Project
NHBE cells infected with SARS-CoV-2 Analysis Results (GEO series: GSE147507)
Navigation
Downloads
Results for ETV4_ETS2
Z-value: 1.20
Motif logo
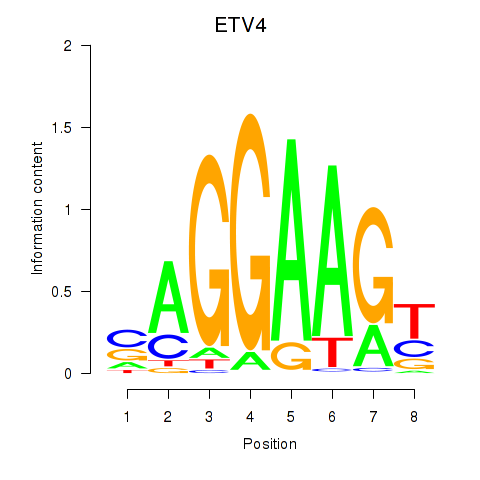
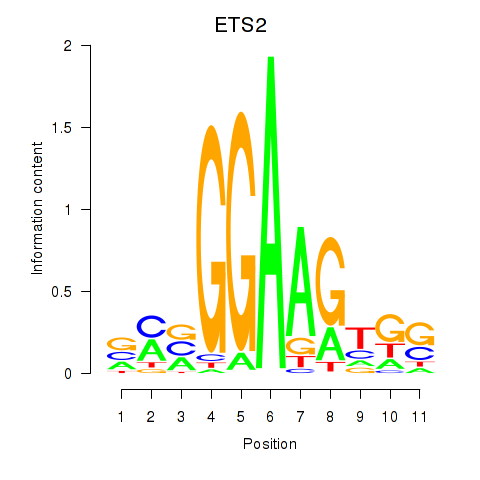
Transcription factors associated with ETV4_ETS2
| Gene Symbol | Gene ID | Gene Info |
|---|---|---|
|
ETV4
|
ENSG00000175832.8 | ETS variant transcription factor 4 |
|
ETS2
|
ENSG00000157557.7 | ETS proto-oncogene 2, transcription factor |
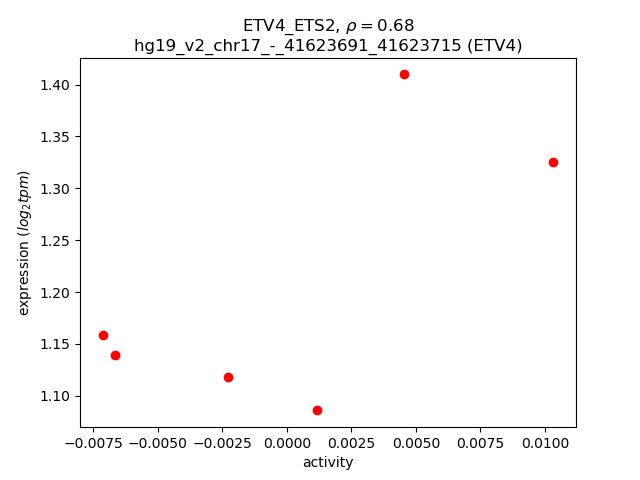
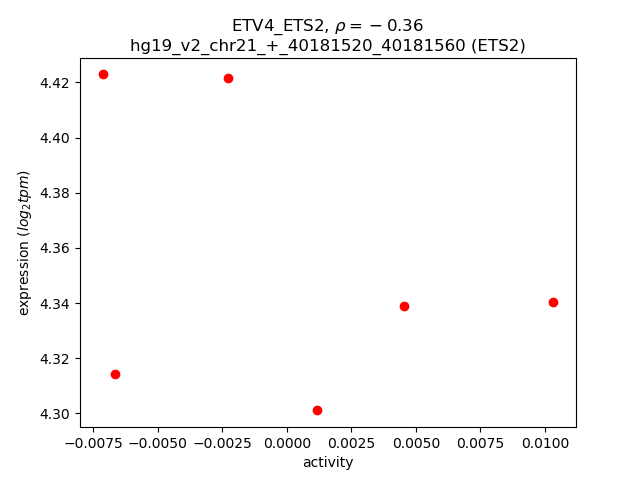
Activity-expression correlation:
| Gene | Promoter | Pearson corr. coef. | P-value | Plot |
|---|---|---|---|---|
| ETV4 | hg19_v2_chr17_-_41623691_41623715 | 0.68 | 1.4e-01 | Click! |
| ETS2 | hg19_v2_chr21_+_40181520_40181560 | -0.36 | 4.8e-01 | Click! |
Activity profile of ETV4_ETS2 motif
Sorted Z-values of ETV4_ETS2 motif
| Promoter | Log-likelihood | Transcript | Gene | Gene Info |
|---|---|---|---|---|
| chr3_-_47324008 | 1.12 |
ENST00000425853.1
|
KIF9
|
kinesin family member 9 |
| chr16_-_67260901 | 1.05 |
ENST00000341546.3
ENST00000409509.1 ENST00000433915.1 ENST00000454102.2 |
LRRC29
AC040160.1
|
leucine rich repeat containing 29 Uncharacterized protein; cDNA FLJ57407, weakly similar to Mus musculus leucine rich repeat containing 29 (Lrrc29), mRNA |
| chr1_+_153330322 | 0.92 |
ENST00000368738.3
|
S100A9
|
S100 calcium binding protein A9 |
| chr11_-_64885111 | 0.87 |
ENST00000528598.1
ENST00000310597.4 |
ZNHIT2
|
zinc finger, HIT-type containing 2 |
| chr3_-_47324242 | 0.87 |
ENST00000456548.1
ENST00000432493.1 ENST00000335044.2 ENST00000444589.2 |
KIF9
|
kinesin family member 9 |
| chr2_+_74212073 | 0.87 |
ENST00000441217.1
|
AC073046.25
|
AC073046.25 |
| chr15_-_80263506 | 0.87 |
ENST00000335661.6
|
BCL2A1
|
BCL2-related protein A1 |
| chr6_+_31515337 | 0.84 |
ENST00000376148.4
ENST00000376145.4 |
NFKBIL1
|
nuclear factor of kappa light polypeptide gene enhancer in B-cells inhibitor-like 1 |
| chr2_+_228678550 | 0.83 |
ENST00000409189.3
ENST00000358813.4 |
CCL20
|
chemokine (C-C motif) ligand 20 |
| chr11_+_313503 | 0.77 |
ENST00000528780.1
ENST00000328221.5 |
IFITM1
|
interferon induced transmembrane protein 1 |
| chr9_-_139268068 | 0.69 |
ENST00000371734.3
ENST00000371732.5 ENST00000315908.7 |
CARD9
|
caspase recruitment domain family, member 9 |
| chr17_+_38171681 | 0.67 |
ENST00000225474.2
ENST00000331769.2 ENST00000394148.3 ENST00000577675.1 |
CSF3
|
colony stimulating factor 3 (granulocyte) |
| chr1_-_209792111 | 0.67 |
ENST00000455193.1
|
LAMB3
|
laminin, beta 3 |
| chr15_-_71184724 | 0.67 |
ENST00000560604.1
|
THAP10
|
THAP domain containing 10 |
| chr17_+_6918093 | 0.65 |
ENST00000439424.2
|
C17orf49
|
chromosome 17 open reading frame 49 |
| chr17_+_6918064 | 0.64 |
ENST00000546760.1
ENST00000552402.1 |
C17orf49
|
chromosome 17 open reading frame 49 |
| chr5_+_159895275 | 0.63 |
ENST00000517927.1
|
MIR146A
|
microRNA 146a |
| chr17_+_4843594 | 0.63 |
ENST00000570328.1
|
RNF167
|
ring finger protein 167 |
| chr1_+_156698708 | 0.59 |
ENST00000519086.1
|
RRNAD1
|
ribosomal RNA adenine dimethylase domain containing 1 |
| chr3_-_142720267 | 0.58 |
ENST00000597953.1
|
RP11-91G21.1
|
RP11-91G21.1 |
| chr17_-_48277552 | 0.58 |
ENST00000507689.1
|
COL1A1
|
collagen, type I, alpha 1 |
| chr19_-_10230562 | 0.57 |
ENST00000587146.1
ENST00000588709.1 ENST00000253108.4 |
EIF3G
|
eukaryotic translation initiation factor 3, subunit G |
| chr20_-_48532046 | 0.55 |
ENST00000543716.1
|
SPATA2
|
spermatogenesis associated 2 |
| chr2_+_138721850 | 0.54 |
ENST00000329366.4
ENST00000280097.3 |
HNMT
|
histamine N-methyltransferase |
| chr14_-_45431091 | 0.54 |
ENST00000579157.1
ENST00000396128.4 ENST00000556500.1 |
KLHL28
|
kelch-like family member 28 |
| chr22_+_30752963 | 0.54 |
ENST00000445005.1
ENST00000430839.1 |
CCDC157
|
coiled-coil domain containing 157 |
| chr20_-_48532019 | 0.54 |
ENST00000289431.5
|
SPATA2
|
spermatogenesis associated 2 |
| chr17_+_38171614 | 0.54 |
ENST00000583218.1
ENST00000394149.3 |
CSF3
|
colony stimulating factor 3 (granulocyte) |
| chr17_-_6917755 | 0.53 |
ENST00000593646.1
|
AC040977.1
|
Uncharacterized protein |
| chr5_-_176730676 | 0.53 |
ENST00000393611.2
ENST00000303251.6 ENST00000303270.6 |
RAB24
|
RAB24, member RAS oncogene family |
| chr15_+_75074410 | 0.52 |
ENST00000439220.2
|
CSK
|
c-src tyrosine kinase |
| chr11_-_62389577 | 0.50 |
ENST00000534715.1
|
B3GAT3
|
beta-1,3-glucuronyltransferase 3 (glucuronosyltransferase I) |
| chr2_+_234160340 | 0.50 |
ENST00000417017.1
ENST00000392020.4 ENST00000392018.1 |
ATG16L1
|
autophagy related 16-like 1 (S. cerevisiae) |
| chr17_+_45908974 | 0.48 |
ENST00000269025.4
|
LRRC46
|
leucine rich repeat containing 46 |
| chr22_+_30752606 | 0.48 |
ENST00000399824.2
ENST00000405659.1 ENST00000338306.3 |
CCDC157
|
coiled-coil domain containing 157 |
| chr17_+_6918354 | 0.46 |
ENST00000552775.1
|
C17orf49
|
chromosome 17 open reading frame 49 |
| chr3_-_51975942 | 0.46 |
ENST00000232888.6
|
RRP9
|
ribosomal RNA processing 9, small subunit (SSU) processome component, homolog (yeast) |
| chr1_+_152881014 | 0.46 |
ENST00000368764.3
ENST00000392667.2 |
IVL
|
involucrin |
| chr3_-_47324060 | 0.45 |
ENST00000452770.2
|
KIF9
|
kinesin family member 9 |
| chr6_+_126240442 | 0.45 |
ENST00000448104.1
ENST00000438495.1 ENST00000444128.1 |
NCOA7
|
nuclear receptor coactivator 7 |
| chr12_+_7053172 | 0.44 |
ENST00000229281.5
|
C12orf57
|
chromosome 12 open reading frame 57 |
| chr19_+_15218180 | 0.44 |
ENST00000342784.2
ENST00000597977.1 ENST00000600440.1 |
SYDE1
|
synapse defective 1, Rho GTPase, homolog 1 (C. elegans) |
| chr2_+_37458904 | 0.44 |
ENST00000416653.1
|
NDUFAF7
|
NADH dehydrogenase (ubiquinone) complex I, assembly factor 7 |
| chr4_+_110736659 | 0.44 |
ENST00000394631.3
ENST00000226796.6 |
GAR1
|
GAR1 ribonucleoprotein |
| chr17_+_4843352 | 0.43 |
ENST00000573404.1
ENST00000576452.1 |
RNF167
|
ring finger protein 167 |
| chr15_-_85197501 | 0.43 |
ENST00000434634.2
|
WDR73
|
WD repeat domain 73 |
| chr3_+_47324424 | 0.42 |
ENST00000437353.1
ENST00000232766.5 ENST00000455924.2 |
KLHL18
|
kelch-like family member 18 |
| chr16_-_66968265 | 0.42 |
ENST00000567511.1
ENST00000422424.2 |
FAM96B
|
family with sequence similarity 96, member B |
| chr3_-_47324079 | 0.42 |
ENST00000352910.4
|
KIF9
|
kinesin family member 9 |
| chr11_-_9336117 | 0.42 |
ENST00000527813.1
ENST00000533723.1 |
TMEM41B
|
transmembrane protein 41B |
| chr15_-_55488817 | 0.42 |
ENST00000569386.1
|
RSL24D1
|
ribosomal L24 domain containing 1 |
| chrX_-_48937684 | 0.41 |
ENST00000465382.1
ENST00000423215.2 |
WDR45
|
WD repeat domain 45 |
| chr11_+_46722368 | 0.41 |
ENST00000311764.2
|
ZNF408
|
zinc finger protein 408 |
| chr1_-_209957882 | 0.41 |
ENST00000294811.1
|
C1orf74
|
chromosome 1 open reading frame 74 |
| chr14_+_75988851 | 0.41 |
ENST00000555504.1
|
BATF
|
basic leucine zipper transcription factor, ATF-like |
| chr3_+_52321827 | 0.40 |
ENST00000473032.1
ENST00000305690.8 ENST00000354773.4 ENST00000471180.1 ENST00000436784.2 |
GLYCTK
|
glycerate kinase |
| chr15_+_90744533 | 0.40 |
ENST00000411539.2
|
SEMA4B
|
sema domain, immunoglobulin domain (Ig), transmembrane domain (TM) and short cytoplasmic domain, (semaphorin) 4B |
| chr7_-_5569588 | 0.40 |
ENST00000417101.1
|
ACTB
|
actin, beta |
| chr11_-_47270341 | 0.40 |
ENST00000529444.1
ENST00000530453.1 ENST00000537863.1 ENST00000529788.1 ENST00000444355.2 ENST00000527256.1 ENST00000529663.1 ENST00000256997.3 |
ACP2
|
acid phosphatase 2, lysosomal |
| chr1_+_156698743 | 0.39 |
ENST00000524343.1
|
RRNAD1
|
ribosomal RNA adenine dimethylase domain containing 1 |
| chr2_+_234160217 | 0.39 |
ENST00000392017.4
ENST00000347464.5 ENST00000444735.1 ENST00000373525.5 ENST00000419681.1 |
ATG16L1
|
autophagy related 16-like 1 (S. cerevisiae) |
| chr6_-_31620455 | 0.39 |
ENST00000437771.1
ENST00000404765.2 ENST00000375964.6 ENST00000211379.5 |
BAG6
|
BCL2-associated athanogene 6 |
| chr16_-_2097787 | 0.39 |
ENST00000566380.1
ENST00000219066.1 |
NTHL1
|
nth endonuclease III-like 1 (E. coli) |
| chr6_+_31620191 | 0.38 |
ENST00000375918.2
ENST00000375920.4 |
APOM
|
apolipoprotein M |
| chr11_+_2421718 | 0.38 |
ENST00000380996.5
ENST00000333256.6 ENST00000380992.1 ENST00000437110.1 ENST00000435795.1 |
TSSC4
|
tumor suppressing subtransferable candidate 4 |
| chr20_+_34287364 | 0.37 |
ENST00000374072.1
ENST00000397416.1 ENST00000336695.4 |
ROMO1
|
reactive oxygen species modulator 1 |
| chr14_+_24630465 | 0.37 |
ENST00000557894.1
ENST00000559284.1 ENST00000560275.1 |
IRF9
|
interferon regulatory factor 9 |
| chr17_+_45331184 | 0.37 |
ENST00000559488.1
ENST00000571680.1 ENST00000435993.2 |
ITGB3
|
integrin, beta 3 (platelet glycoprotein IIIa, antigen CD61) |
| chr22_+_37678505 | 0.37 |
ENST00000402997.1
ENST00000405206.3 |
CYTH4
|
cytohesin 4 |
| chr15_+_75074385 | 0.36 |
ENST00000220003.9
|
CSK
|
c-src tyrosine kinase |
| chr11_-_46722117 | 0.36 |
ENST00000311956.4
|
ARHGAP1
|
Rho GTPase activating protein 1 |
| chr15_+_75074915 | 0.35 |
ENST00000567123.1
ENST00000569462.1 |
CSK
|
c-src tyrosine kinase |
| chr11_+_63655987 | 0.35 |
ENST00000509502.2
ENST00000512060.1 |
MARK2
|
MAP/microtubule affinity-regulating kinase 2 |
| chr19_-_11039261 | 0.35 |
ENST00000590329.1
ENST00000587943.1 ENST00000585858.1 ENST00000586748.1 ENST00000586575.1 ENST00000253031.2 |
YIPF2
|
Yip1 domain family, member 2 |
| chr17_-_4843316 | 0.34 |
ENST00000544061.2
|
SLC25A11
|
solute carrier family 25 (mitochondrial carrier; oxoglutarate carrier), member 11 |
| chr1_-_151254362 | 0.34 |
ENST00000447795.2
|
RP11-126K1.2
|
Uncharacterized protein |
| chr6_-_34524049 | 0.34 |
ENST00000374037.3
|
SPDEF
|
SAM pointed domain containing ETS transcription factor |
| chr6_-_31620403 | 0.34 |
ENST00000451898.1
ENST00000439687.2 ENST00000362049.6 ENST00000424480.1 |
BAG6
|
BCL2-associated athanogene 6 |
| chr5_+_93954358 | 0.34 |
ENST00000504099.1
|
ANKRD32
|
ankyrin repeat domain 32 |
| chr12_-_94673956 | 0.33 |
ENST00000551941.1
|
RP11-1105G2.3
|
Uncharacterized protein |
| chr6_-_11382478 | 0.33 |
ENST00000397378.3
ENST00000513989.1 ENST00000508546.1 ENST00000504387.1 |
NEDD9
|
neural precursor cell expressed, developmentally down-regulated 9 |
| chr17_+_18218587 | 0.33 |
ENST00000406438.3
|
SMCR8
|
Smith-Magenis syndrome chromosome region, candidate 8 |
| chr16_-_57513657 | 0.32 |
ENST00000566936.1
ENST00000568617.1 ENST00000567276.1 ENST00000569548.1 ENST00000569250.1 ENST00000564378.1 |
DOK4
|
docking protein 4 |
| chr1_-_156698591 | 0.32 |
ENST00000368219.1
|
ISG20L2
|
interferon stimulated exonuclease gene 20kDa-like 2 |
| chr9_-_138987115 | 0.32 |
ENST00000277554.2
|
NACC2
|
NACC family member 2, BEN and BTB (POZ) domain containing |
| chr3_-_178865747 | 0.32 |
ENST00000435560.1
|
RP11-360P21.2
|
RP11-360P21.2 |
| chr17_-_7760779 | 0.32 |
ENST00000335155.5
ENST00000575071.1 |
LSMD1
|
LSM domain containing 1 |
| chr17_+_4843413 | 0.32 |
ENST00000572430.1
ENST00000262482.6 |
RNF167
|
ring finger protein 167 |
| chr20_-_2451395 | 0.32 |
ENST00000339610.6
ENST00000381342.2 ENST00000438552.2 |
SNRPB
|
small nuclear ribonucleoprotein polypeptides B and B1 |
| chr12_+_7052974 | 0.32 |
ENST00000544681.1
ENST00000537087.1 |
C12orf57
|
chromosome 12 open reading frame 57 |
| chr4_+_8201091 | 0.32 |
ENST00000382521.3
ENST00000245105.3 ENST00000457650.2 ENST00000539824.1 |
SH3TC1
|
SH3 domain and tetratricopeptide repeats 1 |
| chr19_-_11039188 | 0.32 |
ENST00000588347.1
|
YIPF2
|
Yip1 domain family, member 2 |
| chr20_+_3767547 | 0.31 |
ENST00000344256.6
ENST00000379598.5 |
CDC25B
|
cell division cycle 25B |
| chr1_-_894620 | 0.31 |
ENST00000327044.6
|
NOC2L
|
nucleolar complex associated 2 homolog (S. cerevisiae) |
| chr19_-_51289436 | 0.31 |
ENST00000562076.1
|
CTD-2568A17.1
|
CTD-2568A17.1 |
| chr11_-_102401469 | 0.31 |
ENST00000260227.4
|
MMP7
|
matrix metallopeptidase 7 (matrilysin, uterine) |
| chr1_-_114429997 | 0.31 |
ENST00000471267.1
ENST00000393320.3 |
BCL2L15
|
BCL2-like 15 |
| chr1_-_109618566 | 0.31 |
ENST00000338366.5
|
TAF13
|
TAF13 RNA polymerase II, TATA box binding protein (TBP)-associated factor, 18kDa |
| chr17_+_7942424 | 0.31 |
ENST00000573359.1
|
ALOX15B
|
arachidonate 15-lipoxygenase, type B |
| chr12_+_7053228 | 0.31 |
ENST00000540506.2
|
C12orf57
|
chromosome 12 open reading frame 57 |
| chr13_-_33760216 | 0.31 |
ENST00000255486.4
|
STARD13
|
StAR-related lipid transfer (START) domain containing 13 |
| chr16_+_4666475 | 0.30 |
ENST00000591895.1
|
MGRN1
|
mahogunin ring finger 1, E3 ubiquitin protein ligase |
| chr17_+_67590125 | 0.30 |
ENST00000591334.1
|
AC003051.1
|
AC003051.1 |
| chr16_+_2732476 | 0.30 |
ENST00000301738.4
ENST00000564195.1 |
KCTD5
|
potassium channel tetramerization domain containing 5 |
| chr2_-_242556900 | 0.30 |
ENST00000402545.1
ENST00000402136.1 |
THAP4
|
THAP domain containing 4 |
| chr8_-_104427313 | 0.30 |
ENST00000297578.4
|
SLC25A32
|
solute carrier family 25 (mitochondrial folate carrier), member 32 |
| chr17_+_4843679 | 0.29 |
ENST00000576229.1
|
RNF167
|
ring finger protein 167 |
| chr17_+_26662679 | 0.29 |
ENST00000578158.1
|
TNFAIP1
|
tumor necrosis factor, alpha-induced protein 1 (endothelial) |
| chr8_-_38034192 | 0.29 |
ENST00000520755.1
|
LSM1
|
LSM1 homolog, U6 small nuclear RNA associated (S. cerevisiae) |
| chr17_-_79269067 | 0.29 |
ENST00000288439.5
ENST00000374759.3 |
SLC38A10
|
solute carrier family 38, member 10 |
| chr1_-_156698181 | 0.29 |
ENST00000313146.6
|
ISG20L2
|
interferon stimulated exonuclease gene 20kDa-like 2 |
| chr17_+_48351785 | 0.28 |
ENST00000507382.1
|
TMEM92
|
transmembrane protein 92 |
| chr14_-_37051798 | 0.28 |
ENST00000258829.5
|
NKX2-8
|
NK2 homeobox 8 |
| chr16_-_66968055 | 0.28 |
ENST00000568572.1
|
FAM96B
|
family with sequence similarity 96, member B |
| chr2_+_37571717 | 0.28 |
ENST00000338415.3
ENST00000404976.1 |
QPCT
|
glutaminyl-peptide cyclotransferase |
| chr11_+_65408273 | 0.28 |
ENST00000394227.3
|
SIPA1
|
signal-induced proliferation-associated 1 |
| chr17_-_39093672 | 0.28 |
ENST00000209718.3
ENST00000436344.3 ENST00000485751.1 |
KRT23
|
keratin 23 (histone deacetylase inducible) |
| chr1_+_16767167 | 0.28 |
ENST00000337132.5
|
NECAP2
|
NECAP endocytosis associated 2 |
| chr14_+_23341513 | 0.28 |
ENST00000546834.1
|
LRP10
|
low density lipoprotein receptor-related protein 10 |
| chr5_+_176730769 | 0.28 |
ENST00000303204.4
ENST00000503216.1 |
PRELID1
|
PRELI domain containing 1 |
| chr17_+_7942335 | 0.28 |
ENST00000380183.4
ENST00000572022.1 ENST00000380173.2 |
ALOX15B
|
arachidonate 15-lipoxygenase, type B |
| chr2_+_37458928 | 0.28 |
ENST00000439218.1
ENST00000432075.1 |
NDUFAF7
|
NADH dehydrogenase (ubiquinone) complex I, assembly factor 7 |
| chr14_+_65170820 | 0.28 |
ENST00000555982.1
|
PLEKHG3
|
pleckstrin homology domain containing, family G (with RhoGef domain) member 3 |
| chr3_-_55515400 | 0.27 |
ENST00000497027.1
|
WNT5A
|
wingless-type MMTV integration site family, member 5A |
| chr17_-_62493131 | 0.27 |
ENST00000539111.2
|
POLG2
|
polymerase (DNA directed), gamma 2, accessory subunit |
| chr16_-_28503080 | 0.27 |
ENST00000565316.1
ENST00000565778.1 ENST00000357857.9 ENST00000568558.1 ENST00000357806.7 |
CLN3
|
ceroid-lipofuscinosis, neuronal 3 |
| chr20_+_48884002 | 0.27 |
ENST00000425497.1
ENST00000445003.1 |
RP11-290F20.3
|
RP11-290F20.3 |
| chr14_-_103989033 | 0.27 |
ENST00000553878.1
ENST00000557530.1 |
CKB
|
creatine kinase, brain |
| chr2_+_220462560 | 0.27 |
ENST00000456909.1
ENST00000295641.10 |
STK11IP
|
serine/threonine kinase 11 interacting protein |
| chr5_+_66300464 | 0.27 |
ENST00000436277.1
|
MAST4
|
microtubule associated serine/threonine kinase family member 4 |
| chr11_+_844406 | 0.27 |
ENST00000397404.1
|
TSPAN4
|
tetraspanin 4 |
| chr18_+_3261883 | 0.27 |
ENST00000237500.5
|
MYL12B
|
myosin, light chain 12B, regulatory |
| chr22_+_38004723 | 0.27 |
ENST00000381756.5
|
GGA1
|
golgi-associated, gamma adaptin ear containing, ARF binding protein 1 |
| chr6_-_41908428 | 0.27 |
ENST00000505064.1
|
CCND3
|
cyclin D3 |
| chr19_+_40854559 | 0.27 |
ENST00000598962.1
ENST00000409419.1 ENST00000409587.1 ENST00000602131.1 ENST00000409735.4 ENST00000600948.1 ENST00000356508.5 ENST00000596682.1 ENST00000594908.1 |
PLD3
|
phospholipase D family, member 3 |
| chr4_-_103266626 | 0.27 |
ENST00000356736.4
|
SLC39A8
|
solute carrier family 39 (zinc transporter), member 8 |
| chr6_-_33385854 | 0.27 |
ENST00000488478.1
|
CUTA
|
cutA divalent cation tolerance homolog (E. coli) |
| chr5_-_140070897 | 0.27 |
ENST00000448240.1
ENST00000438307.2 ENST00000415192.2 ENST00000457527.2 ENST00000307633.3 ENST00000507746.1 ENST00000431330.2 |
HARS
|
histidyl-tRNA synthetase |
| chr11_+_65407331 | 0.27 |
ENST00000527525.1
|
SIPA1
|
signal-induced proliferation-associated 1 |
| chr2_+_239335636 | 0.26 |
ENST00000409297.1
|
ASB1
|
ankyrin repeat and SOCS box containing 1 |
| chr19_-_10341948 | 0.26 |
ENST00000590320.1
ENST00000592342.1 ENST00000588952.1 |
S1PR2
DNMT1
|
sphingosine-1-phosphate receptor 2 DNA (cytosine-5-)-methyltransferase 1 |
| chr14_+_93389425 | 0.26 |
ENST00000216492.5
ENST00000334654.4 |
CHGA
|
chromogranin A (parathyroid secretory protein 1) |
| chr6_+_26156551 | 0.26 |
ENST00000304218.3
|
HIST1H1E
|
histone cluster 1, H1e |
| chr17_-_76123101 | 0.26 |
ENST00000392467.3
|
TMC6
|
transmembrane channel-like 6 |
| chr19_-_49243845 | 0.26 |
ENST00000222145.4
|
RASIP1
|
Ras interacting protein 1 |
| chr5_+_61874562 | 0.26 |
ENST00000334994.5
ENST00000409534.1 |
LRRC70
IPO11
|
leucine rich repeat containing 70 importin 11 |
| chr7_-_100888313 | 0.26 |
ENST00000442303.1
|
FIS1
|
fission 1 (mitochondrial outer membrane) homolog (S. cerevisiae) |
| chr6_-_43595039 | 0.26 |
ENST00000307114.7
|
GTPBP2
|
GTP binding protein 2 |
| chr20_+_34287194 | 0.26 |
ENST00000374078.1
ENST00000374077.3 |
ROMO1
|
reactive oxygen species modulator 1 |
| chr3_-_170626376 | 0.26 |
ENST00000487522.1
ENST00000474417.1 |
EIF5A2
|
eukaryotic translation initiation factor 5A2 |
| chr11_+_93754513 | 0.26 |
ENST00000315765.9
|
HEPHL1
|
hephaestin-like 1 |
| chr18_-_47813940 | 0.25 |
ENST00000586837.1
ENST00000412036.2 ENST00000589940.1 |
CXXC1
|
CXXC finger protein 1 |
| chr1_-_183560011 | 0.25 |
ENST00000367536.1
|
NCF2
|
neutrophil cytosolic factor 2 |
| chr9_-_130617029 | 0.25 |
ENST00000373203.4
|
ENG
|
endoglin |
| chr12_+_96588143 | 0.25 |
ENST00000228741.3
ENST00000547249.1 |
ELK3
|
ELK3, ETS-domain protein (SRF accessory protein 2) |
| chr19_+_56186606 | 0.25 |
ENST00000085079.7
|
EPN1
|
epsin 1 |
| chr9_-_91793675 | 0.25 |
ENST00000375835.4
ENST00000375830.1 |
SHC3
|
SHC (Src homology 2 domain containing) transforming protein 3 |
| chr11_+_65337901 | 0.25 |
ENST00000309328.3
ENST00000531405.1 ENST00000527920.1 ENST00000526877.1 ENST00000533115.1 ENST00000526433.1 |
SSSCA1
|
Sjogren syndrome/scleroderma autoantigen 1 |
| chr6_-_33290580 | 0.25 |
ENST00000446511.1
ENST00000446403.1 ENST00000414083.2 ENST00000266000.6 ENST00000374542.5 |
DAXX
|
death-domain associated protein |
| chr17_+_27895609 | 0.25 |
ENST00000581411.2
ENST00000301057.7 |
TP53I13
|
tumor protein p53 inducible protein 13 |
| chr19_-_12792585 | 0.25 |
ENST00000351660.5
|
DHPS
|
deoxyhypusine synthase |
| chr5_-_150466692 | 0.25 |
ENST00000315050.7
ENST00000523338.1 ENST00000522100.1 |
TNIP1
|
TNFAIP3 interacting protein 1 |
| chrX_+_115567767 | 0.25 |
ENST00000371900.4
|
SLC6A14
|
solute carrier family 6 (amino acid transporter), member 14 |
| chr5_+_149380256 | 0.24 |
ENST00000502717.1
|
HMGXB3
|
HMG box domain containing 3 |
| chr19_+_56186557 | 0.24 |
ENST00000270460.6
|
EPN1
|
epsin 1 |
| chr19_-_16653325 | 0.24 |
ENST00000546361.2
|
CHERP
|
calcium homeostasis endoplasmic reticulum protein |
| chr6_+_30524663 | 0.24 |
ENST00000376560.3
|
PRR3
|
proline rich 3 |
| chr8_+_95565947 | 0.24 |
ENST00000523011.1
|
RP11-267M23.4
|
RP11-267M23.4 |
| chr16_-_30204987 | 0.24 |
ENST00000569282.1
ENST00000567436.1 |
BOLA2B
|
bolA family member 2B |
| chr17_+_1944790 | 0.24 |
ENST00000575162.1
|
DPH1
|
diphthamide biosynthesis 1 |
| chr16_-_28503357 | 0.24 |
ENST00000333496.9
ENST00000561505.1 ENST00000567963.1 ENST00000354630.5 ENST00000355477.5 ENST00000357076.5 ENST00000565688.1 ENST00000359984.7 |
CLN3
|
ceroid-lipofuscinosis, neuronal 3 |
| chr5_+_141303461 | 0.24 |
ENST00000508751.1
|
KIAA0141
|
KIAA0141 |
| chr16_+_3185125 | 0.24 |
ENST00000576416.1
|
ZNF213
|
zinc finger protein 213 |
| chr6_-_112575758 | 0.24 |
ENST00000431543.2
ENST00000453937.2 ENST00000368638.4 ENST00000389463.4 |
LAMA4
|
laminin, alpha 4 |
| chr10_-_99161033 | 0.24 |
ENST00000315563.6
ENST00000370992.4 ENST00000414986.1 |
RRP12
|
ribosomal RNA processing 12 homolog (S. cerevisiae) |
| chr6_-_42110342 | 0.24 |
ENST00000356542.5
|
C6orf132
|
chromosome 6 open reading frame 132 |
| chr2_-_96811170 | 0.24 |
ENST00000288943.4
|
DUSP2
|
dual specificity phosphatase 2 |
| chr17_-_76356148 | 0.24 |
ENST00000587578.1
ENST00000330871.2 |
SOCS3
|
suppressor of cytokine signaling 3 |
| chr4_+_76439095 | 0.24 |
ENST00000506261.1
|
THAP6
|
THAP domain containing 6 |
| chr20_+_55967129 | 0.24 |
ENST00000371219.2
|
RBM38
|
RNA binding motif protein 38 |
| chr5_-_40835303 | 0.24 |
ENST00000509877.1
ENST00000508493.1 ENST00000274242.5 |
RPL37
|
ribosomal protein L37 |
| chr1_+_1260147 | 0.24 |
ENST00000343938.4
|
GLTPD1
|
glycolipid transfer protein domain containing 1 |
| chr17_+_80009330 | 0.24 |
ENST00000580716.1
ENST00000583961.1 |
GPS1
|
G protein pathway suppressor 1 |
| chr7_-_130080681 | 0.23 |
ENST00000469826.1
|
CEP41
|
centrosomal protein 41kDa |
| chr3_-_50340996 | 0.23 |
ENST00000266031.4
ENST00000395143.2 ENST00000457214.2 ENST00000447605.2 ENST00000418723.1 ENST00000395144.2 |
HYAL1
|
hyaluronoglucosaminidase 1 |
| chr16_+_31085714 | 0.23 |
ENST00000300850.5
ENST00000564189.1 ENST00000428260.1 |
ZNF646
|
zinc finger protein 646 |
| chr19_-_10230540 | 0.23 |
ENST00000589454.1
|
EIF3G
|
eukaryotic translation initiation factor 3, subunit G |
| chr16_+_3184924 | 0.23 |
ENST00000574902.1
ENST00000396878.3 |
ZNF213
|
zinc finger protein 213 |
| chr22_+_38004832 | 0.23 |
ENST00000405147.3
ENST00000429218.1 ENST00000325180.8 ENST00000337437.4 |
GGA1
|
golgi-associated, gamma adaptin ear containing, ARF binding protein 1 |
| chr6_-_31620149 | 0.23 |
ENST00000435080.1
ENST00000375976.4 ENST00000441054.1 |
BAG6
|
BCL2-associated athanogene 6 |
| chr17_+_4843654 | 0.23 |
ENST00000575111.1
|
RNF167
|
ring finger protein 167 |
| chr5_-_150467221 | 0.23 |
ENST00000522226.1
|
TNIP1
|
TNFAIP3 interacting protein 1 |
| chr17_+_74723031 | 0.23 |
ENST00000586200.1
|
METTL23
|
methyltransferase like 23 |
| chr10_-_98031155 | 0.23 |
ENST00000495266.1
|
BLNK
|
B-cell linker |
| chr3_+_109128837 | 0.23 |
ENST00000497996.1
|
RP11-702L6.4
|
RP11-702L6.4 |
| chr1_+_114522049 | 0.22 |
ENST00000369551.1
ENST00000320334.4 |
OLFML3
|
olfactomedin-like 3 |
| chr5_-_137090028 | 0.22 |
ENST00000314940.4
|
HNRNPA0
|
heterogeneous nuclear ribonucleoprotein A0 |
| chr19_-_16653226 | 0.22 |
ENST00000198939.6
|
CHERP
|
calcium homeostasis endoplasmic reticulum protein |
| chr16_-_31519691 | 0.22 |
ENST00000567994.1
ENST00000430477.2 ENST00000570164.1 ENST00000327237.2 |
C16orf58
|
chromosome 16 open reading frame 58 |
| chr19_+_11546440 | 0.22 |
ENST00000589126.1
ENST00000588269.1 ENST00000587509.1 ENST00000592741.1 ENST00000593101.1 ENST00000587327.1 |
PRKCSH
|
protein kinase C substrate 80K-H |
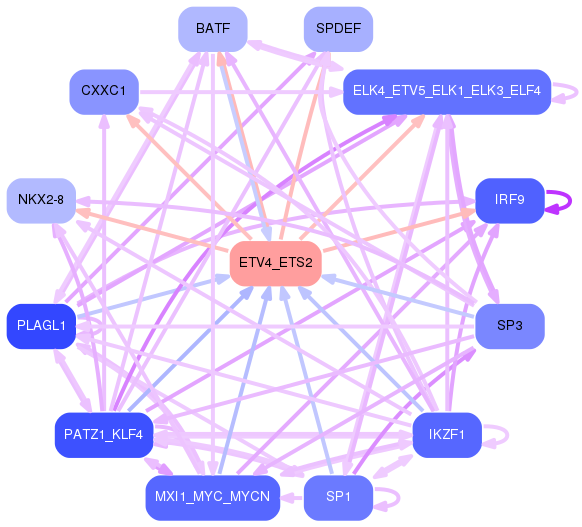
Network of associatons between targets according to the STRING database.

First level regulatory network of ETV4_ETS2
Gene Ontology Analysis
Gene overrepresentation in biological_process category:
| Log-likelihood per target | Total log-likelihood | Term | Description |
|---|---|---|---|
| 0.3 | 1.0 | GO:0035606 | peptidyl-cysteine S-trans-nitrosylation(GO:0035606) |
| 0.3 | 0.9 | GO:0045362 | regulation of interleukin-1 biosynthetic process(GO:0045360) positive regulation of interleukin-1 biosynthetic process(GO:0045362) |
| 0.2 | 1.1 | GO:0036343 | psychomotor behavior(GO:0036343) |
| 0.2 | 0.8 | GO:0035752 | lysosomal lumen pH elevation(GO:0035752) |
| 0.2 | 1.1 | GO:0010989 | negative regulation of low-density lipoprotein particle clearance(GO:0010989) |
| 0.2 | 0.5 | GO:0042631 | cellular response to water deprivation(GO:0042631) |
| 0.2 | 0.5 | GO:0000454 | snoRNA guided rRNA pseudouridine synthesis(GO:0000454) |
| 0.2 | 0.5 | GO:0017186 | peptidyl-pyroglutamic acid biosynthetic process, using glutaminyl-peptide cyclotransferase(GO:0017186) |
| 0.1 | 0.9 | GO:0044034 | negative stranded viral RNA replication(GO:0039689) multi-organism biosynthetic process(GO:0044034) |
| 0.1 | 0.6 | GO:0044691 | tooth eruption(GO:0044691) |
| 0.1 | 0.4 | GO:0001300 | chronological cell aging(GO:0001300) |
| 0.1 | 1.4 | GO:1904327 | protein localization to cytosolic proteasome complex(GO:1904327) protein localization to cytosolic proteasome complex involved in ERAD pathway(GO:1904379) |
| 0.1 | 0.4 | GO:0034444 | regulation of plasma lipoprotein particle oxidation(GO:0034444) negative regulation of plasma lipoprotein particle oxidation(GO:0034445) |
| 0.1 | 0.8 | GO:0019918 | peptidyl-arginine methylation, to symmetrical-dimethyl arginine(GO:0019918) |
| 0.1 | 0.6 | GO:0046203 | spermidine catabolic process(GO:0046203) |
| 0.1 | 0.5 | GO:0001692 | histamine metabolic process(GO:0001692) |
| 0.1 | 0.4 | GO:1901165 | positive regulation of trophoblast cell migration(GO:1901165) |
| 0.1 | 1.2 | GO:0030223 | neutrophil differentiation(GO:0030223) |
| 0.1 | 0.5 | GO:0085032 | modulation of signal transduction in other organism(GO:0044501) modulation by symbiont of host signal transduction pathway(GO:0052027) modulation of signal transduction in other organism involved in symbiotic interaction(GO:0052250) modulation by symbiont of host I-kappaB kinase/NF-kappaB cascade(GO:0085032) |
| 0.1 | 0.4 | GO:0045715 | negative regulation of low-density lipoprotein particle receptor biosynthetic process(GO:0045715) |
| 0.1 | 0.5 | GO:0018199 | peptidyl-glutamine modification(GO:0018199) |
| 0.1 | 0.5 | GO:0060481 | lung goblet cell differentiation(GO:0060480) lobar bronchus epithelium development(GO:0060481) |
| 0.1 | 0.3 | GO:1900738 | dense core granule biogenesis(GO:0061110) positive regulation of phospholipase C-activating G-protein coupled receptor signaling pathway(GO:1900738) positive regulation of relaxation of muscle(GO:1901079) positive regulation of relaxation of cardiac muscle(GO:1901899) regulation of dense core granule biogenesis(GO:2000705) |
| 0.1 | 0.3 | GO:0015742 | alpha-ketoglutarate transport(GO:0015742) |
| 0.1 | 0.2 | GO:0072737 | response to diamide(GO:0072737) cellular response to diamide(GO:0072738) |
| 0.1 | 0.8 | GO:0051715 | cytolysis in other organism(GO:0051715) |
| 0.1 | 0.6 | GO:0010836 | negative regulation of protein ADP-ribosylation(GO:0010836) |
| 0.1 | 3.1 | GO:0071801 | regulation of podosome assembly(GO:0071801) |
| 0.1 | 0.3 | GO:0097498 | endothelial tube lumen extension(GO:0097498) |
| 0.1 | 0.2 | GO:0006427 | histidyl-tRNA aminoacylation(GO:0006427) |
| 0.1 | 0.3 | GO:0036517 | chemoattraction of serotonergic neuron axon(GO:0036517) planar cell polarity pathway involved in outflow tract morphogenesis(GO:0061347) planar cell polarity pathway involved in ventricular septum morphogenesis(GO:0061348) planar cell polarity pathway involved in cardiac right atrium morphogenesis(GO:0061349) planar cell polarity pathway involved in cardiac muscle tissue morphogenesis(GO:0061350) planar cell polarity pathway involved in pericardium morphogenesis(GO:0061354) chemoattraction of axon(GO:0061642) negative regulation of cell proliferation in midbrain(GO:1904934) planar cell polarity pathway involved in midbrain dopaminergic neuron differentiation(GO:1904955) |
| 0.1 | 0.2 | GO:0021553 | olfactory nerve development(GO:0021553) |
| 0.1 | 0.6 | GO:0051121 | hepoxilin metabolic process(GO:0051121) hepoxilin biosynthetic process(GO:0051122) |
| 0.1 | 0.4 | GO:1904579 | response to thapsigargin(GO:1904578) cellular response to thapsigargin(GO:1904579) response to hypobaric hypoxia(GO:1990910) |
| 0.1 | 0.7 | GO:0075525 | viral translational termination-reinitiation(GO:0075525) |
| 0.1 | 0.2 | GO:0060380 | regulation of single-stranded telomeric DNA binding(GO:0060380) positive regulation of single-stranded telomeric DNA binding(GO:0060381) |
| 0.1 | 0.4 | GO:0006001 | fructose catabolic process(GO:0006001) fructose catabolic process to hydroxyacetone phosphate and glyceraldehyde-3-phosphate(GO:0061624) |
| 0.1 | 0.3 | GO:0006203 | dGTP catabolic process(GO:0006203) |
| 0.1 | 0.3 | GO:0097403 | cellular response to raffinose(GO:0097403) response to raffinose(GO:1901545) |
| 0.1 | 0.4 | GO:1904274 | tricellular tight junction assembly(GO:1904274) |
| 0.1 | 0.2 | GO:0042351 | 'de novo' GDP-L-fucose biosynthetic process(GO:0042351) |
| 0.1 | 0.2 | GO:1903572 | regulation of protein kinase D signaling(GO:1903570) positive regulation of protein kinase D signaling(GO:1903572) |
| 0.1 | 0.5 | GO:0017185 | peptidyl-lysine hydroxylation(GO:0017185) |
| 0.1 | 0.5 | GO:0051533 | positive regulation of NFAT protein import into nucleus(GO:0051533) |
| 0.1 | 0.3 | GO:1903336 | negative regulation of vacuolar transport(GO:1903336) |
| 0.1 | 0.3 | GO:0030644 | cellular chloride ion homeostasis(GO:0030644) |
| 0.1 | 0.2 | GO:1902568 | regulation of eosinophil degranulation(GO:0043309) positive regulation of eosinophil degranulation(GO:0043311) regulation of eosinophil activation(GO:1902566) positive regulation of eosinophil activation(GO:1902568) |
| 0.1 | 0.2 | GO:0016598 | protein arginylation(GO:0016598) |
| 0.0 | 0.2 | GO:0033123 | positive regulation of cyclic nucleotide catabolic process(GO:0030807) positive regulation of cAMP catabolic process(GO:0030822) positive regulation of purine nucleotide catabolic process(GO:0033123) |
| 0.0 | 0.2 | GO:1902626 | assembly of large subunit precursor of preribosome(GO:1902626) |
| 0.0 | 0.2 | GO:0060708 | spongiotrophoblast differentiation(GO:0060708) |
| 0.0 | 0.1 | GO:1904398 | positive regulation of neuromuscular junction development(GO:1904398) |
| 0.0 | 0.2 | GO:0018283 | metal incorporation into metallo-sulfur cluster(GO:0018282) iron incorporation into metallo-sulfur cluster(GO:0018283) |
| 0.0 | 0.2 | GO:0044010 | biofilm formation(GO:0042710) single-species biofilm formation(GO:0044010) single-species biofilm formation in or on host organism(GO:0044407) regulation of single-species biofilm formation(GO:1900190) negative regulation of single-species biofilm formation(GO:1900191) regulation of single-species biofilm formation in or on host organism(GO:1900228) negative regulation of single-species biofilm formation in or on host organism(GO:1900229) |
| 0.0 | 0.2 | GO:0006051 | mannosamine metabolic process(GO:0006050) N-acetylmannosamine metabolic process(GO:0006051) |
| 0.0 | 0.2 | GO:1900106 | hyaluranon cable assembly(GO:0036118) regulation of hyaluranon cable assembly(GO:1900104) positive regulation of hyaluranon cable assembly(GO:1900106) |
| 0.0 | 0.5 | GO:0045039 | protein import into mitochondrial inner membrane(GO:0045039) |
| 0.0 | 0.5 | GO:0016584 | nucleosome positioning(GO:0016584) |
| 0.0 | 0.4 | GO:0008612 | peptidyl-lysine modification to peptidyl-hypusine(GO:0008612) |
| 0.0 | 0.9 | GO:0031665 | negative regulation of lipopolysaccharide-mediated signaling pathway(GO:0031665) |
| 0.0 | 0.2 | GO:0071348 | cellular response to interleukin-11(GO:0071348) |
| 0.0 | 0.1 | GO:0035281 | pre-miRNA export from nucleus(GO:0035281) |
| 0.0 | 0.7 | GO:0032494 | response to peptidoglycan(GO:0032494) |
| 0.0 | 0.2 | GO:0033590 | response to cobalamin(GO:0033590) |
| 0.0 | 0.2 | GO:0007468 | regulation of rhodopsin gene expression(GO:0007468) positive regulation of rhodopsin gene expression(GO:0045872) |
| 0.0 | 0.3 | GO:1904431 | positive regulation of t-circle formation(GO:1904431) |
| 0.0 | 0.2 | GO:1901668 | regulation of superoxide dismutase activity(GO:1901668) |
| 0.0 | 0.1 | GO:0045083 | negative regulation of interleukin-12 biosynthetic process(GO:0045083) |
| 0.0 | 0.1 | GO:1902463 | protein localization to cell leading edge(GO:1902463) |
| 0.0 | 0.0 | GO:1990564 | protein ufmylation(GO:0071569) protein polyufmylation(GO:1990564) protein K69-linked ufmylation(GO:1990592) |
| 0.0 | 0.1 | GO:1903251 | multi-ciliated epithelial cell differentiation(GO:1903251) |
| 0.0 | 0.1 | GO:0051106 | positive regulation of DNA ligation(GO:0051106) |
| 0.0 | 0.3 | GO:1901857 | positive regulation of cellular respiration(GO:1901857) |
| 0.0 | 0.3 | GO:0070317 | negative regulation of G0 to G1 transition(GO:0070317) |
| 0.0 | 0.3 | GO:1902231 | positive regulation of intrinsic apoptotic signaling pathway in response to DNA damage(GO:1902231) |
| 0.0 | 0.1 | GO:0003147 | neural crest cell migration involved in heart formation(GO:0003147) anterior neural tube closure(GO:0061713) |
| 0.0 | 0.3 | GO:0070127 | tRNA aminoacylation for mitochondrial protein translation(GO:0070127) |
| 0.0 | 0.3 | GO:0051697 | protein delipidation(GO:0051697) |
| 0.0 | 0.3 | GO:0006102 | isocitrate metabolic process(GO:0006102) |
| 0.0 | 0.1 | GO:0035674 | tricarboxylic acid transmembrane transport(GO:0035674) |
| 0.0 | 0.8 | GO:0016226 | iron-sulfur cluster assembly(GO:0016226) metallo-sulfur cluster assembly(GO:0031163) |
| 0.0 | 0.2 | GO:0060743 | epithelial cell maturation involved in prostate gland development(GO:0060743) |
| 0.0 | 0.2 | GO:1902775 | mitochondrial large ribosomal subunit assembly(GO:1902775) |
| 0.0 | 0.1 | GO:0045590 | negative regulation of regulatory T cell differentiation(GO:0045590) |
| 0.0 | 0.1 | GO:0034427 | nuclear-transcribed mRNA catabolic process, exonucleolytic, 3'-5'(GO:0034427) |
| 0.0 | 0.3 | GO:0006680 | glucosylceramide catabolic process(GO:0006680) |
| 0.0 | 0.9 | GO:0046597 | negative regulation of viral entry into host cell(GO:0046597) |
| 0.0 | 0.1 | GO:0000412 | histone peptidyl-prolyl isomerization(GO:0000412) |
| 0.0 | 0.3 | GO:1901098 | positive regulation of autophagosome maturation(GO:1901098) |
| 0.0 | 0.2 | GO:0030037 | actin filament reorganization involved in cell cycle(GO:0030037) |
| 0.0 | 0.2 | GO:0007089 | traversing start control point of mitotic cell cycle(GO:0007089) |
| 0.0 | 0.0 | GO:0010936 | negative regulation of macrophage cytokine production(GO:0010936) |
| 0.0 | 0.1 | GO:0031346 | positive regulation of cell projection organization(GO:0031346) |
| 0.0 | 0.1 | GO:0006550 | isoleucine catabolic process(GO:0006550) |
| 0.0 | 0.5 | GO:0007144 | female meiosis I(GO:0007144) |
| 0.0 | 0.1 | GO:0014859 | negative regulation of skeletal muscle cell proliferation(GO:0014859) negative regulation of skeletal muscle satellite cell proliferation(GO:1902723) |
| 0.0 | 0.4 | GO:1901525 | negative regulation of macromitophagy(GO:1901525) |
| 0.0 | 0.9 | GO:0031167 | rRNA methylation(GO:0031167) |
| 0.0 | 0.2 | GO:0006740 | NADPH regeneration(GO:0006740) |
| 0.0 | 0.4 | GO:0033211 | adiponectin-activated signaling pathway(GO:0033211) |
| 0.0 | 0.2 | GO:0061084 | regulation of protein refolding(GO:0061083) negative regulation of protein refolding(GO:0061084) |
| 0.0 | 0.4 | GO:0019800 | peptide cross-linking via chondroitin 4-sulfate glycosaminoglycan(GO:0019800) |
| 0.0 | 0.0 | GO:0014744 | positive regulation of muscle adaptation(GO:0014744) |
| 0.0 | 0.2 | GO:0010216 | maintenance of DNA methylation(GO:0010216) DNA methylation on cytosine(GO:0032776) C-5 methylation of cytosine(GO:0090116) |
| 0.0 | 0.1 | GO:0006624 | vacuolar protein processing(GO:0006624) |
| 0.0 | 0.2 | GO:0051142 | regulation of NK T cell proliferation(GO:0051140) positive regulation of NK T cell proliferation(GO:0051142) |
| 0.0 | 0.1 | GO:1902362 | melanocyte proliferation(GO:0097325) melanocyte apoptotic process(GO:1902362) |
| 0.0 | 0.1 | GO:0042796 | snRNA transcription from RNA polymerase III promoter(GO:0042796) |
| 0.0 | 0.1 | GO:0032208 | regulation of telomere maintenance via recombination(GO:0032207) negative regulation of telomere maintenance via recombination(GO:0032208) regulation of single strand break repair(GO:1903516) negative regulation of single strand break repair(GO:1903517) negative regulation of beta-galactosidase activity(GO:1903770) telomere single strand break repair(GO:1903823) negative regulation of telomere single strand break repair(GO:1903824) |
| 0.0 | 0.2 | GO:2001300 | lipoxin metabolic process(GO:2001300) |
| 0.0 | 0.1 | GO:0015688 | iron chelate transport(GO:0015688) siderophore transport(GO:0015891) |
| 0.0 | 0.1 | GO:0019085 | early viral transcription(GO:0019085) |
| 0.0 | 0.1 | GO:0070428 | regulation of nucleotide-binding oligomerization domain containing 1 signaling pathway(GO:0070428) |
| 0.0 | 0.3 | GO:1903003 | positive regulation of protein deubiquitination(GO:1903003) |
| 0.0 | 0.1 | GO:0007288 | sperm axoneme assembly(GO:0007288) |
| 0.0 | 0.3 | GO:0015691 | cadmium ion transport(GO:0015691) cadmium ion transmembrane transport(GO:0070574) |
| 0.0 | 0.1 | GO:0034343 | type III interferon production(GO:0034343) regulation of type III interferon production(GO:0034344) |
| 0.0 | 0.0 | GO:2000525 | regulation of T cell costimulation(GO:2000523) positive regulation of T cell costimulation(GO:2000525) |
| 0.0 | 0.1 | GO:2000348 | regulation of CD40 signaling pathway(GO:2000348) |
| 0.0 | 0.1 | GO:0030886 | negative regulation of myeloid dendritic cell activation(GO:0030886) |
| 0.0 | 0.8 | GO:0008053 | mitochondrial fusion(GO:0008053) |
| 0.0 | 0.1 | GO:0010897 | negative regulation of triglyceride catabolic process(GO:0010897) |
| 0.0 | 0.1 | GO:0010157 | response to chlorate(GO:0010157) |
| 0.0 | 0.1 | GO:0060058 | positive regulation of epithelial cell proliferation involved in wound healing(GO:0060054) apoptotic process involved in mammary gland involution(GO:0060057) positive regulation of apoptotic process involved in mammary gland involution(GO:0060058) positive regulation of apoptotic process involved in morphogenesis(GO:1902339) regulation of mammary gland involution(GO:1903519) positive regulation of mammary gland involution(GO:1903521) positive regulation of apoptotic process involved in development(GO:1904747) |
| 0.0 | 0.1 | GO:1901873 | regulation of post-translational protein modification(GO:1901873) |
| 0.0 | 0.5 | GO:0042832 | defense response to protozoan(GO:0042832) |
| 0.0 | 0.1 | GO:0072619 | interleukin-21 production(GO:0032625) interleukin-21 secretion(GO:0072619) |
| 0.0 | 0.1 | GO:0089700 | protein kinase D signaling(GO:0089700) |
| 0.0 | 0.2 | GO:0006432 | phenylalanyl-tRNA aminoacylation(GO:0006432) |
| 0.0 | 0.1 | GO:0045065 | cytotoxic T cell differentiation(GO:0045065) |
| 0.0 | 0.1 | GO:2000397 | positive regulation of viral budding via host ESCRT complex(GO:1903774) regulation of ubiquitin-dependent endocytosis(GO:2000395) positive regulation of ubiquitin-dependent endocytosis(GO:2000397) |
| 0.0 | 0.1 | GO:0035697 | CD8-positive, alpha-beta T cell extravasation(GO:0035697) CD8-positive, alpha-beta cytotoxic T cell extravasation(GO:0035698) positive regulation of necroptotic process(GO:0060545) regulation of T cell extravasation(GO:2000407) regulation of CD8-positive, alpha-beta T cell extravasation(GO:2000449) regulation of CD8-positive, alpha-beta cytotoxic T cell extravasation(GO:2000452) |
| 0.0 | 0.1 | GO:1903445 | intermembrane transport(GO:0046909) protein transport from ciliary membrane to plasma membrane(GO:1903445) |
| 0.0 | 0.1 | GO:0045073 | chemokine biosynthetic process(GO:0042033) regulation of chemokine biosynthetic process(GO:0045073) |
| 0.0 | 0.5 | GO:0044804 | nucleophagy(GO:0044804) |
| 0.0 | 0.0 | GO:0072708 | response to sorbitol(GO:0072708) |
| 0.0 | 0.4 | GO:0006610 | ribosomal protein import into nucleus(GO:0006610) |
| 0.0 | 0.1 | GO:1903147 | negative regulation of mitophagy(GO:1903147) |
| 0.0 | 0.1 | GO:1990029 | pulmonary valve formation(GO:0003193) atrial ventricular junction remodeling(GO:0003294) foramen ovale closure(GO:0035922) atrial cardiac muscle cell to AV node cell communication by electrical coupling(GO:0086044) bundle of His cell to Purkinje myocyte communication by electrical coupling(GO:0086054) Purkinje myocyte to ventricular cardiac muscle cell communication by electrical coupling(GO:0086055) regulation of Purkinje myocyte action potential(GO:0098906) vasomotion(GO:1990029) |
| 0.0 | 0.2 | GO:0032887 | regulation of spindle elongation(GO:0032887) regulation of mitotic spindle elongation(GO:0032888) anastral spindle assembly(GO:0055048) protein localization to spindle pole body(GO:0071988) regulation of protein localization to spindle pole body(GO:1902363) positive regulation of protein localization to spindle pole body(GO:1902365) positive regulation of mitotic spindle elongation(GO:1902846) |
| 0.0 | 0.3 | GO:0043951 | negative regulation of cAMP-mediated signaling(GO:0043951) |
| 0.0 | 0.1 | GO:1904217 | regulation of CDP-diacylglycerol-serine O-phosphatidyltransferase activity(GO:1904217) positive regulation of CDP-diacylglycerol-serine O-phosphatidyltransferase activity(GO:1904219) positive regulation of serine C-palmitoyltransferase activity(GO:1904222) |
| 0.0 | 0.1 | GO:0043328 | protein targeting to vacuole involved in ubiquitin-dependent protein catabolic process via the multivesicular body sorting pathway(GO:0043328) |
| 0.0 | 0.1 | GO:0051795 | positive regulation of catagen(GO:0051795) activation of meiosis(GO:0090427) |
| 0.0 | 0.1 | GO:0060979 | vasculogenesis involved in coronary vascular morphogenesis(GO:0060979) |
| 0.0 | 0.1 | GO:0043654 | recognition of apoptotic cell(GO:0043654) |
| 0.0 | 0.1 | GO:0050717 | positive regulation of interleukin-1 alpha secretion(GO:0050717) |
| 0.0 | 0.3 | GO:0071763 | nuclear membrane organization(GO:0071763) |
| 0.0 | 0.3 | GO:0018095 | protein polyglutamylation(GO:0018095) |
| 0.0 | 0.1 | GO:0097198 | histone H3-K36 trimethylation(GO:0097198) |
| 0.0 | 0.3 | GO:0034472 | snRNA 3'-end processing(GO:0034472) |
| 0.0 | 0.1 | GO:0050916 | sensory perception of sweet taste(GO:0050916) |
| 0.0 | 0.2 | GO:0043314 | negative regulation of neutrophil degranulation(GO:0043314) |
| 0.0 | 0.7 | GO:0050651 | dermatan sulfate proteoglycan biosynthetic process(GO:0050651) |
| 0.0 | 0.2 | GO:0000395 | mRNA 5'-splice site recognition(GO:0000395) |
| 0.0 | 0.2 | GO:0007406 | negative regulation of neuroblast proliferation(GO:0007406) |
| 0.0 | 0.1 | GO:2000660 | negative regulation of interleukin-1-mediated signaling pathway(GO:2000660) |
| 0.0 | 0.1 | GO:0055099 | response to high density lipoprotein particle(GO:0055099) |
| 0.0 | 0.2 | GO:0019367 | fatty acid elongation, saturated fatty acid(GO:0019367) fatty acid elongation, unsaturated fatty acid(GO:0019368) fatty acid elongation, monounsaturated fatty acid(GO:0034625) fatty acid elongation, polyunsaturated fatty acid(GO:0034626) |
| 0.0 | 0.1 | GO:0006701 | progesterone biosynthetic process(GO:0006701) |
| 0.0 | 0.1 | GO:0033632 | regulation of cell-cell adhesion mediated by integrin(GO:0033632) |
| 0.0 | 0.3 | GO:0002903 | negative regulation of B cell apoptotic process(GO:0002903) |
| 0.0 | 0.1 | GO:0043152 | induction of bacterial agglutination(GO:0043152) |
| 0.0 | 0.0 | GO:1903526 | negative regulation of membrane tubulation(GO:1903526) |
| 0.0 | 0.0 | GO:0072429 | response to intra-S DNA damage checkpoint signaling(GO:0072429) |
| 0.0 | 0.1 | GO:0010966 | regulation of phosphate transport(GO:0010966) |
| 0.0 | 0.0 | GO:0046070 | dGTP metabolic process(GO:0046070) |
| 0.0 | 0.2 | GO:0007000 | nucleolus organization(GO:0007000) |
| 0.0 | 0.1 | GO:0019303 | D-ribose catabolic process(GO:0019303) |
| 0.0 | 0.6 | GO:0031581 | hemidesmosome assembly(GO:0031581) |
| 0.0 | 0.2 | GO:0060316 | positive regulation of ryanodine-sensitive calcium-release channel activity(GO:0060316) |
| 0.0 | 0.0 | GO:0061300 | cerebellum vasculature development(GO:0061300) |
| 0.0 | 0.2 | GO:0030322 | stabilization of membrane potential(GO:0030322) |
| 0.0 | 0.2 | GO:0097500 | receptor localization to nonmotile primary cilium(GO:0097500) |
| 0.0 | 0.0 | GO:1903691 | positive regulation of wound healing, spreading of epidermal cells(GO:1903691) |
| 0.0 | 0.1 | GO:0007290 | spermatid nucleus elongation(GO:0007290) |
| 0.0 | 0.1 | GO:0006844 | acyl carnitine transport(GO:0006844) acyl carnitine transmembrane transport(GO:1902616) |
| 0.0 | 0.1 | GO:0070940 | dephosphorylation of RNA polymerase II C-terminal domain(GO:0070940) |
| 0.0 | 0.0 | GO:0002913 | positive regulation of T cell anergy(GO:0002669) positive regulation of lymphocyte anergy(GO:0002913) |
| 0.0 | 0.0 | GO:0033320 | UDP-D-xylose metabolic process(GO:0033319) UDP-D-xylose biosynthetic process(GO:0033320) |
| 0.0 | 0.1 | GO:0033132 | negative regulation of glucokinase activity(GO:0033132) negative regulation of hexokinase activity(GO:1903300) |
| 0.0 | 0.0 | GO:0021797 | forebrain anterior/posterior pattern specification(GO:0021797) |
| 0.0 | 0.1 | GO:0032487 | regulation of Rap protein signal transduction(GO:0032487) |
| 0.0 | 0.1 | GO:0060971 | intraciliary anterograde transport(GO:0035720) ciliary receptor clustering involved in smoothened signaling pathway(GO:0060830) embryonic heart tube left/right pattern formation(GO:0060971) |
| 0.0 | 0.0 | GO:0010593 | negative regulation of lamellipodium assembly(GO:0010593) negative regulation of lamellipodium organization(GO:1902744) |
| 0.0 | 0.2 | GO:0071285 | cellular response to lithium ion(GO:0071285) |
| 0.0 | 0.1 | GO:0019087 | transformation of host cell by virus(GO:0019087) |
| 0.0 | 0.1 | GO:0097056 | selenocysteinyl-tRNA(Sec) biosynthetic process(GO:0097056) |
| 0.0 | 0.4 | GO:0045730 | respiratory burst(GO:0045730) |
| 0.0 | 0.3 | GO:0060670 | branching involved in labyrinthine layer morphogenesis(GO:0060670) |
| 0.0 | 0.2 | GO:0017183 | peptidyl-diphthamide metabolic process(GO:0017182) peptidyl-diphthamide biosynthetic process from peptidyl-histidine(GO:0017183) |
| 0.0 | 0.1 | GO:0046532 | regulation of photoreceptor cell differentiation(GO:0046532) |
| 0.0 | 0.1 | GO:0035519 | protein K29-linked ubiquitination(GO:0035519) |
| 0.0 | 0.0 | GO:2000588 | positive regulation of platelet-derived growth factor receptor-beta signaling pathway(GO:2000588) |
| 0.0 | 0.5 | GO:0006491 | N-glycan processing(GO:0006491) |
| 0.0 | 0.5 | GO:0035024 | negative regulation of Rho protein signal transduction(GO:0035024) |
| 0.0 | 0.2 | GO:0035897 | proteolysis in other organism(GO:0035897) |
| 0.0 | 0.1 | GO:0036229 | glutamine secretion(GO:0010585) L-glutamine import(GO:0036229) L-glutamine import into cell(GO:1903803) |
| 0.0 | 0.2 | GO:2000400 | positive regulation of T cell differentiation in thymus(GO:0033089) positive regulation of thymocyte aggregation(GO:2000400) |
| 0.0 | 0.1 | GO:0030200 | heparan sulfate proteoglycan catabolic process(GO:0030200) |
| 0.0 | 0.1 | GO:2000002 | negative regulation of DNA damage checkpoint(GO:2000002) |
| 0.0 | 0.2 | GO:0033234 | negative regulation of protein sumoylation(GO:0033234) |
| 0.0 | 0.1 | GO:0008355 | olfactory learning(GO:0008355) |
| 0.0 | 0.0 | GO:1900220 | semaphorin-plexin signaling pathway involved in bone trabecula morphogenesis(GO:1900220) |
| 0.0 | 0.1 | GO:0010814 | substance P catabolic process(GO:0010814) calcitonin catabolic process(GO:0010816) endothelin maturation(GO:0034959) |
| 0.0 | 0.1 | GO:0007296 | vitellogenesis(GO:0007296) |
| 0.0 | 0.1 | GO:0010265 | SCF complex assembly(GO:0010265) |
| 0.0 | 0.1 | GO:0035105 | sterol regulatory element binding protein import into nucleus(GO:0035105) |
| 0.0 | 0.4 | GO:1903204 | negative regulation of oxidative stress-induced neuron death(GO:1903204) |
| 0.0 | 0.0 | GO:1990709 | presynaptic active zone organization(GO:1990709) |
| 0.0 | 0.2 | GO:0051014 | actin filament severing(GO:0051014) |
| 0.0 | 0.0 | GO:1903362 | regulation of cellular protein catabolic process(GO:1903362) |
| 0.0 | 0.2 | GO:0010764 | negative regulation of fibroblast migration(GO:0010764) |
| 0.0 | 0.2 | GO:0045008 | depyrimidination(GO:0045008) |
| 0.0 | 0.1 | GO:0032485 | Ral protein signal transduction(GO:0032484) regulation of Ral protein signal transduction(GO:0032485) |
| 0.0 | 0.6 | GO:0000188 | inactivation of MAPK activity(GO:0000188) |
| 0.0 | 0.0 | GO:1902474 | positive regulation of protein localization to synapse(GO:1902474) |
| 0.0 | 0.1 | GO:1904796 | smooth endoplasmic reticulum calcium ion homeostasis(GO:0051563) regulation of core promoter binding(GO:1904796) |
| 0.0 | 0.2 | GO:0016255 | attachment of GPI anchor to protein(GO:0016255) |
| 0.0 | 0.1 | GO:0010595 | positive regulation of endothelial cell migration(GO:0010595) |
| 0.0 | 0.1 | GO:0090038 | negative regulation of protein kinase C signaling(GO:0090038) |
| 0.0 | 0.1 | GO:0045779 | negative regulation of bone resorption(GO:0045779) |
| 0.0 | 0.1 | GO:0072434 | signal transduction involved in G2 DNA damage checkpoint(GO:0072425) signal transduction involved in mitotic G2 DNA damage checkpoint(GO:0072434) |
| 0.0 | 0.2 | GO:0060394 | negative regulation of pathway-restricted SMAD protein phosphorylation(GO:0060394) |
| 0.0 | 0.2 | GO:0043568 | positive regulation of insulin-like growth factor receptor signaling pathway(GO:0043568) |
| 0.0 | 0.0 | GO:0008616 | queuosine biosynthetic process(GO:0008616) queuosine metabolic process(GO:0046116) |
| 0.0 | 0.1 | GO:0046726 | positive regulation by virus of viral protein levels in host cell(GO:0046726) |
| 0.0 | 0.1 | GO:1903301 | regulation of glucokinase activity(GO:0033131) positive regulation of glucokinase activity(GO:0033133) regulation of hexokinase activity(GO:1903299) positive regulation of hexokinase activity(GO:1903301) |
| 0.0 | 0.7 | GO:0051646 | mitochondrion localization(GO:0051646) |
| 0.0 | 0.1 | GO:1904338 | Schwann cell migration(GO:0036135) regulation of Schwann cell migration(GO:1900147) regulation of dopaminergic neuron differentiation(GO:1904338) |
| 0.0 | 0.3 | GO:0046339 | diacylglycerol metabolic process(GO:0046339) |
| 0.0 | 0.0 | GO:0070126 | mitochondrial translational termination(GO:0070126) |
| 0.0 | 0.2 | GO:0033617 | mitochondrial respiratory chain complex IV assembly(GO:0033617) mitochondrial respiratory chain complex IV biogenesis(GO:0097034) |
| 0.0 | 0.1 | GO:1990822 | basic amino acid transmembrane transport(GO:1990822) |
| 0.0 | 0.1 | GO:0034378 | chylomicron assembly(GO:0034378) |
| 0.0 | 0.1 | GO:0009212 | dTTP biosynthetic process(GO:0006235) pyrimidine deoxyribonucleoside triphosphate biosynthetic process(GO:0009212) |
| 0.0 | 0.0 | GO:0034144 | negative regulation of toll-like receptor 4 signaling pathway(GO:0034144) |
| 0.0 | 0.1 | GO:0060484 | lung-associated mesenchyme development(GO:0060484) |
| 0.0 | 0.1 | GO:0000712 | resolution of meiotic recombination intermediates(GO:0000712) |
| 0.0 | 0.2 | GO:0070935 | 3'-UTR-mediated mRNA stabilization(GO:0070935) |
| 0.0 | 0.1 | GO:0043128 | regulation of 1-phosphatidylinositol 4-kinase activity(GO:0043126) positive regulation of 1-phosphatidylinositol 4-kinase activity(GO:0043128) |
| 0.0 | 0.1 | GO:0021603 | cranial nerve formation(GO:0021603) |
| 0.0 | 0.0 | GO:0038083 | peptidyl-tyrosine autophosphorylation(GO:0038083) |
| 0.0 | 0.1 | GO:0097012 | cellular response to granulocyte macrophage colony-stimulating factor stimulus(GO:0097011) response to granulocyte macrophage colony-stimulating factor(GO:0097012) |
| 0.0 | 0.1 | GO:0015793 | glycerol transport(GO:0015793) |
| 0.0 | 0.1 | GO:0061141 | lung ciliated cell differentiation(GO:0061141) |
| 0.0 | 0.0 | GO:0016094 | polyprenol biosynthetic process(GO:0016094) |
| 0.0 | 0.0 | GO:0042144 | vacuole fusion, non-autophagic(GO:0042144) |
| 0.0 | 0.3 | GO:0032012 | regulation of ARF protein signal transduction(GO:0032012) |
| 0.0 | 0.1 | GO:2000189 | positive regulation of cholesterol homeostasis(GO:2000189) |
| 0.0 | 0.0 | GO:1902732 | positive regulation of chondrocyte proliferation(GO:1902732) |
| 0.0 | 0.1 | GO:1905150 | regulation of voltage-gated sodium channel activity(GO:1905150) |
| 0.0 | 0.1 | GO:0032483 | regulation of Rab protein signal transduction(GO:0032483) |
| 0.0 | 0.4 | GO:0048025 | negative regulation of mRNA splicing, via spliceosome(GO:0048025) |
| 0.0 | 0.2 | GO:0032780 | negative regulation of ATPase activity(GO:0032780) |
| 0.0 | 0.2 | GO:1901741 | positive regulation of myoblast fusion(GO:1901741) |
| 0.0 | 0.0 | GO:0030330 | DNA damage response, signal transduction by p53 class mediator(GO:0030330) positive regulation of cell cycle arrest(GO:0071158) |
| 0.0 | 0.0 | GO:1902214 | regulation of interleukin-4-mediated signaling pathway(GO:1902214) |
Gene overrepresentation in cellular_component category:
| Log-likelihood per target | Total log-likelihood | Term | Description |
|---|---|---|---|
| 0.2 | 0.6 | GO:0005584 | collagen type I trimer(GO:0005584) |
| 0.1 | 0.4 | GO:0072563 | endothelial microparticle(GO:0072563) |
| 0.1 | 0.4 | GO:0034365 | discoidal high-density lipoprotein particle(GO:0034365) |
| 0.1 | 0.8 | GO:0071817 | MMXD complex(GO:0071817) |
| 0.1 | 0.4 | GO:0071062 | alphav-beta3 integrin-vitronectin complex(GO:0071062) |
| 0.1 | 0.3 | GO:0030689 | Noc complex(GO:0030689) |
| 0.1 | 0.6 | GO:0010370 | perinucleolar chromocenter(GO:0010370) |
| 0.1 | 1.1 | GO:0071818 | BAT3 complex(GO:0071818) ER membrane insertion complex(GO:0072379) |
| 0.1 | 0.3 | GO:0000229 | cytoplasmic chromosome(GO:0000229) |
| 0.1 | 0.3 | GO:0071001 | U4/U6 snRNP(GO:0071001) |
| 0.1 | 0.5 | GO:0031428 | box C/D snoRNP complex(GO:0031428) |
| 0.1 | 0.2 | GO:0036117 | hyaluranon cable(GO:0036117) |
| 0.1 | 0.5 | GO:0072589 | box H/ACA scaRNP complex(GO:0072589) box H/ACA telomerase RNP complex(GO:0090661) |
| 0.1 | 0.1 | GO:0000785 | chromatin(GO:0000785) |
| 0.1 | 1.6 | GO:0034045 | pre-autophagosomal structure membrane(GO:0034045) |
| 0.1 | 0.3 | GO:0033596 | TSC1-TSC2 complex(GO:0033596) |
| 0.1 | 1.0 | GO:0097427 | microtubule bundle(GO:0097427) |
| 0.1 | 0.6 | GO:0005610 | laminin-5 complex(GO:0005610) |
| 0.0 | 0.3 | GO:0032010 | phagolysosome(GO:0032010) |
| 0.0 | 0.1 | GO:0042565 | nuclear RNA export factor complex(GO:0042272) RNA nuclear export complex(GO:0042565) |
| 0.0 | 0.2 | GO:0043196 | varicosity(GO:0043196) |
| 0.0 | 0.1 | GO:0043224 | nuclear SCF ubiquitin ligase complex(GO:0043224) |
| 0.0 | 0.3 | GO:0005956 | protein kinase CK2 complex(GO:0005956) |
| 0.0 | 0.3 | GO:0019907 | cyclin-dependent protein kinase activating kinase holoenzyme complex(GO:0019907) |
| 0.0 | 0.2 | GO:0005958 | DNA-dependent protein kinase-DNA ligase 4 complex(GO:0005958) |
| 0.0 | 3.2 | GO:0002102 | podosome(GO:0002102) |
| 0.0 | 0.2 | GO:0032937 | SREBP-SCAP-Insig complex(GO:0032937) |
| 0.0 | 0.2 | GO:0001405 | presequence translocase-associated import motor(GO:0001405) |
| 0.0 | 0.1 | GO:0071821 | FANCM-MHF complex(GO:0071821) |
| 0.0 | 0.2 | GO:0097013 | phagocytic vesicle lumen(GO:0097013) |
| 0.0 | 0.1 | GO:0005944 | phosphatidylinositol 3-kinase complex, class IB(GO:0005944) |
| 0.0 | 0.4 | GO:0061689 | tricellular tight junction(GO:0061689) |
| 0.0 | 0.2 | GO:0009328 | phenylalanine-tRNA ligase complex(GO:0009328) |
| 0.0 | 0.2 | GO:0042765 | GPI-anchor transamidase complex(GO:0042765) |
| 0.0 | 0.2 | GO:0005968 | Rab-protein geranylgeranyltransferase complex(GO:0005968) |
| 0.0 | 0.2 | GO:0042567 | insulin-like growth factor ternary complex(GO:0042567) |
| 0.0 | 0.1 | GO:0055087 | Ski complex(GO:0055087) |
| 0.0 | 0.3 | GO:1990316 | ATG1/ULK1 kinase complex(GO:1990316) |
| 0.0 | 0.4 | GO:0097433 | dense body(GO:0097433) |
| 0.0 | 0.3 | GO:0070187 | telosome(GO:0070187) |
| 0.0 | 0.2 | GO:0070435 | Shc-EGFR complex(GO:0070435) |
| 0.0 | 0.4 | GO:0061700 | GATOR2 complex(GO:0061700) |
| 0.0 | 0.1 | GO:0019034 | viral replication complex(GO:0019034) |
| 0.0 | 0.2 | GO:0005683 | U7 snRNP(GO:0005683) |
| 0.0 | 0.3 | GO:0035578 | azurophil granule lumen(GO:0035578) |
| 0.0 | 0.2 | GO:1990393 | 3M complex(GO:1990393) |
| 0.0 | 0.1 | GO:0000814 | ESCRT II complex(GO:0000814) |
| 0.0 | 0.4 | GO:0032059 | bleb(GO:0032059) |
| 0.0 | 0.1 | GO:0031466 | Cul5-RING ubiquitin ligase complex(GO:0031466) |
| 0.0 | 0.1 | GO:0090571 | RNA polymerase II transcription repressor complex(GO:0090571) |
| 0.0 | 0.2 | GO:0000788 | nuclear nucleosome(GO:0000788) |
| 0.0 | 0.1 | GO:0005742 | mitochondrial outer membrane translocase complex(GO:0005742) |
| 0.0 | 0.0 | GO:0005953 | CAAX-protein geranylgeranyltransferase complex(GO:0005953) |
| 0.0 | 0.7 | GO:0030687 | preribosome, large subunit precursor(GO:0030687) |
| 0.0 | 0.1 | GO:0043625 | delta DNA polymerase complex(GO:0043625) |
| 0.0 | 0.1 | GO:0016222 | procollagen-proline 4-dioxygenase complex(GO:0016222) |
| 0.0 | 0.3 | GO:0000322 | storage vacuole(GO:0000322) |
| 0.0 | 0.1 | GO:0005595 | collagen type XII trimer(GO:0005595) |
| 0.0 | 0.1 | GO:1902636 | kinociliary basal body(GO:1902636) |
| 0.0 | 0.1 | GO:0005687 | U4 snRNP(GO:0005687) |
| 0.0 | 0.1 | GO:0097165 | nuclear stress granule(GO:0097165) |
| 0.0 | 0.1 | GO:0070939 | Dsl1p complex(GO:0070939) |
| 0.0 | 0.5 | GO:0005852 | eukaryotic translation initiation factor 3 complex(GO:0005852) |
| 0.0 | 0.7 | GO:0005605 | basal lamina(GO:0005605) |
| 0.0 | 0.1 | GO:0001939 | female pronucleus(GO:0001939) |
| 0.0 | 0.2 | GO:0032777 | Piccolo NuA4 histone acetyltransferase complex(GO:0032777) |
| 0.0 | 0.2 | GO:0005851 | eukaryotic translation initiation factor 2B complex(GO:0005851) |
| 0.0 | 0.0 | GO:0071020 | post-spliceosomal complex(GO:0071020) |
| 0.0 | 0.1 | GO:0034673 | inhibin-betaglycan-ActRII complex(GO:0034673) |
| 0.0 | 0.0 | GO:0042720 | mitochondrial inner membrane peptidase complex(GO:0042720) |
| 0.0 | 0.1 | GO:0005833 | hemoglobin complex(GO:0005833) |
| 0.0 | 0.1 | GO:0005579 | membrane attack complex(GO:0005579) |
| 0.0 | 0.2 | GO:0070765 | gamma-secretase complex(GO:0070765) |
| 0.0 | 0.1 | GO:0030121 | AP-1 adaptor complex(GO:0030121) |
| 0.0 | 0.2 | GO:0005641 | nuclear envelope lumen(GO:0005641) |
| 0.0 | 0.2 | GO:1990907 | beta-catenin-TCF complex(GO:1990907) |
| 0.0 | 0.1 | GO:0016533 | cyclin-dependent protein kinase 5 holoenzyme complex(GO:0016533) |
| 0.0 | 0.0 | GO:0044609 | DBIRD complex(GO:0044609) |
| 0.0 | 0.4 | GO:0033202 | Ino80 complex(GO:0031011) DNA helicase complex(GO:0033202) |
| 0.0 | 0.1 | GO:0071797 | LUBAC complex(GO:0071797) |
| 0.0 | 0.1 | GO:0020016 | ciliary pocket(GO:0020016) ciliary pocket membrane(GO:0020018) |
| 0.0 | 0.1 | GO:0005874 | microtubule(GO:0005874) |
| 0.0 | 0.1 | GO:0031302 | intrinsic component of endosome membrane(GO:0031302) |
| 0.0 | 0.1 | GO:0032021 | NELF complex(GO:0032021) |
| 0.0 | 0.5 | GO:0042629 | mast cell granule(GO:0042629) |
| 0.0 | 0.2 | GO:0031313 | extrinsic component of endosome membrane(GO:0031313) |
| 0.0 | 0.1 | GO:0000110 | nucleotide-excision repair factor 1 complex(GO:0000110) |
| 0.0 | 0.1 | GO:0036021 | endolysosome lumen(GO:0036021) |
| 0.0 | 0.2 | GO:0033093 | Weibel-Palade body(GO:0033093) |
| 0.0 | 0.4 | GO:0071011 | precatalytic spliceosome(GO:0071011) |
| 0.0 | 0.2 | GO:0014701 | junctional sarcoplasmic reticulum membrane(GO:0014701) |
| 0.0 | 0.2 | GO:0034464 | BBSome(GO:0034464) |
| 0.0 | 0.1 | GO:0044294 | dendritic growth cone(GO:0044294) |
| 0.0 | 1.1 | GO:0031463 | Cul3-RING ubiquitin ligase complex(GO:0031463) |
| 0.0 | 0.8 | GO:0005801 | cis-Golgi network(GO:0005801) |
| 0.0 | 0.1 | GO:0005672 | transcription factor TFIIA complex(GO:0005672) |
| 0.0 | 0.2 | GO:0019774 | proteasome core complex, beta-subunit complex(GO:0019774) |
| 0.0 | 0.2 | GO:0008385 | IkappaB kinase complex(GO:0008385) |
Gene overrepresentation in molecular_function category:
| Log-likelihood per target | Total log-likelihood | Term | Description |
|---|---|---|---|
| 0.3 | 0.8 | GO:0031731 | CCR6 chemokine receptor binding(GO:0031731) |
| 0.2 | 0.6 | GO:0034038 | deoxyhypusine synthase activity(GO:0034038) |
| 0.2 | 0.9 | GO:0015018 | galactosylgalactosylxylosylprotein 3-beta-glucuronosyltransferase activity(GO:0015018) |
| 0.2 | 1.0 | GO:0000179 | rRNA (adenine-N6,N6-)-dimethyltransferase activity(GO:0000179) |
| 0.2 | 0.5 | GO:0016603 | glutaminyl-peptide cyclotransferase activity(GO:0016603) |
| 0.1 | 0.6 | GO:0016165 | linoleate 13S-lipoxygenase activity(GO:0016165) |
| 0.1 | 0.9 | GO:0035662 | Toll-like receptor 4 binding(GO:0035662) |
| 0.1 | 0.8 | GO:0035243 | protein-arginine omega-N symmetric methyltransferase activity(GO:0035243) |
| 0.1 | 0.3 | GO:0035539 | 8-oxo-7,8-dihydroguanosine triphosphate pyrophosphatase activity(GO:0008413) 8-oxo-7,8-dihydrodeoxyguanosine triphosphate pyrophosphatase activity(GO:0035539) |
| 0.1 | 0.4 | GO:0045322 | unmethylated CpG binding(GO:0045322) |
| 0.1 | 0.4 | GO:0032422 | purine-rich negative regulatory element binding(GO:0032422) |
| 0.1 | 0.4 | GO:0008534 | oxidized purine nucleobase lesion DNA N-glycosylase activity(GO:0008534) |
| 0.1 | 0.1 | GO:0000702 | oxidized base lesion DNA N-glycosylase activity(GO:0000702) |
| 0.1 | 0.2 | GO:0050577 | GDP-4-dehydro-D-rhamnose reductase activity(GO:0042356) GDP-L-fucose synthase activity(GO:0050577) |
| 0.1 | 0.2 | GO:0008330 | protein tyrosine/threonine phosphatase activity(GO:0008330) |
| 0.1 | 0.2 | GO:0004821 | histidine-tRNA ligase activity(GO:0004821) |
| 0.1 | 0.3 | GO:1902379 | receptor tyrosine kinase-like orphan receptor binding(GO:0005115) chemoattractant activity involved in axon guidance(GO:1902379) |
| 0.1 | 0.5 | GO:0034511 | U3 snoRNA binding(GO:0034511) |
| 0.1 | 0.3 | GO:0015140 | malate transmembrane transporter activity(GO:0015140) |
| 0.1 | 0.2 | GO:0008160 | protein tyrosine phosphatase activator activity(GO:0008160) |
| 0.1 | 0.4 | GO:0070815 | peptidyl-lysine 5-dioxygenase activity(GO:0070815) |
| 0.1 | 0.2 | GO:0031071 | cysteine desulfurase activity(GO:0031071) |
| 0.1 | 0.5 | GO:0043184 | vascular endothelial growth factor receptor 2 binding(GO:0043184) |
| 0.1 | 0.4 | GO:0005534 | galactose binding(GO:0005534) |
| 0.1 | 0.4 | GO:0047179 | platelet-activating factor acetyltransferase activity(GO:0047179) |
| 0.1 | 1.4 | GO:0015643 | toxic substance binding(GO:0015643) |
| 0.1 | 0.2 | GO:0045127 | N-acetylglucosamine kinase activity(GO:0045127) |
| 0.1 | 0.2 | GO:0004464 | leukotriene-C4 synthase activity(GO:0004464) |
| 0.1 | 0.3 | GO:1990050 | phosphatidic acid transporter activity(GO:1990050) |
| 0.1 | 0.1 | GO:0098847 | sequence-specific single stranded DNA binding(GO:0098847) |
| 0.1 | 0.2 | GO:0004057 | arginyltransferase activity(GO:0004057) |
| 0.1 | 0.5 | GO:0003917 | DNA topoisomerase type I activity(GO:0003917) |
| 0.1 | 0.3 | GO:0071208 | histone pre-mRNA DCP binding(GO:0071208) |
| 0.1 | 0.3 | GO:1990450 | linear polyubiquitin binding(GO:1990450) |
| 0.1 | 0.3 | GO:0004348 | glucosylceramidase activity(GO:0004348) |
| 0.0 | 1.0 | GO:0050321 | tau-protein kinase activity(GO:0050321) |
| 0.0 | 0.5 | GO:0034513 | box H/ACA snoRNA binding(GO:0034513) |
| 0.0 | 0.2 | GO:0004449 | isocitrate dehydrogenase (NAD+) activity(GO:0004449) |
| 0.0 | 0.1 | GO:0003986 | acetyl-CoA hydrolase activity(GO:0003986) |
| 0.0 | 0.2 | GO:0050501 | hyaluronan synthase activity(GO:0050501) |
| 0.0 | 0.4 | GO:0030621 | U4 snRNA binding(GO:0030621) |
| 0.0 | 0.1 | GO:0090631 | pre-miRNA transporter activity(GO:0090631) |
| 0.0 | 0.2 | GO:0008745 | N-acetylmuramoyl-L-alanine amidase activity(GO:0008745) |
| 0.0 | 0.1 | GO:0004917 | interleukin-7 receptor activity(GO:0004917) |
| 0.0 | 1.2 | GO:0034236 | protein kinase A catalytic subunit binding(GO:0034236) |
| 0.0 | 0.1 | GO:0097003 | adipokinetic hormone receptor activity(GO:0097003) |
| 0.0 | 0.3 | GO:1990446 | U1 snRNP binding(GO:1990446) |
| 0.0 | 0.2 | GO:0016230 | sphingomyelin phosphodiesterase activator activity(GO:0016230) |
| 0.0 | 0.9 | GO:0051400 | BH domain binding(GO:0051400) |
| 0.0 | 0.5 | GO:0004630 | phospholipase D activity(GO:0004630) |
| 0.0 | 0.2 | GO:0032564 | adenyl deoxyribonucleotide binding(GO:0032558) dATP binding(GO:0032564) |
| 0.0 | 0.2 | GO:0008113 | peptide-methionine (S)-S-oxide reductase activity(GO:0008113) |
| 0.0 | 0.8 | GO:0030306 | ADP-ribosylation factor binding(GO:0030306) |
| 0.0 | 0.6 | GO:0048407 | platelet-derived growth factor binding(GO:0048407) |
| 0.0 | 0.1 | GO:0004794 | L-threonine ammonia-lyase activity(GO:0004794) |
| 0.0 | 0.2 | GO:0004345 | glucose-6-phosphate dehydrogenase activity(GO:0004345) |
| 0.0 | 0.1 | GO:0052856 | NADHX epimerase activity(GO:0052856) NADPHX epimerase activity(GO:0052857) |
| 0.0 | 0.2 | GO:0003923 | GPI-anchor transamidase activity(GO:0003923) |
| 0.0 | 0.2 | GO:0003886 | DNA (cytosine-5-)-methyltransferase activity(GO:0003886) |
| 0.0 | 0.7 | GO:0050700 | CARD domain binding(GO:0050700) |
| 0.0 | 0.1 | GO:0061714 | folic acid receptor activity(GO:0061714) |
| 0.0 | 0.2 | GO:0043141 | ATP-dependent 5'-3' DNA helicase activity(GO:0043141) |
| 0.0 | 0.3 | GO:0019788 | NEDD8 transferase activity(GO:0019788) |
| 0.0 | 0.1 | GO:0044736 | acid-sensing ion channel activity(GO:0044736) |
| 0.0 | 0.3 | GO:0004111 | creatine kinase activity(GO:0004111) |
| 0.0 | 0.1 | GO:0051538 | 3 iron, 4 sulfur cluster binding(GO:0051538) |
| 0.0 | 0.2 | GO:0036132 | 13-prostaglandin reductase activity(GO:0036132) 15-oxoprostaglandin 13-oxidase activity(GO:0047522) |
| 0.0 | 0.1 | GO:0070123 | transforming growth factor beta receptor activity, type III(GO:0070123) |
| 0.0 | 0.1 | GO:0042134 | rRNA primary transcript binding(GO:0042134) |
| 0.0 | 0.1 | GO:0050613 | delta14-sterol reductase activity(GO:0050613) |
| 0.0 | 0.5 | GO:0030957 | Tat protein binding(GO:0030957) |
| 0.0 | 0.1 | GO:0050510 | N-acetylgalactosaminyl-proteoglycan 3-beta-glucuronosyltransferase activity(GO:0050510) |
| 0.0 | 0.1 | GO:0004796 | thromboxane-A synthase activity(GO:0004796) 12-hydroxyheptadecatrienoic acid synthase activity(GO:0036134) |
| 0.0 | 0.2 | GO:0005134 | interleukin-2 receptor binding(GO:0005134) |
| 0.0 | 0.1 | GO:0005150 | interleukin-1, Type I receptor binding(GO:0005150) |
| 0.0 | 0.1 | GO:0003845 | 11-beta-hydroxysteroid dehydrogenase [NAD(P)] activity(GO:0003845) |
| 0.0 | 0.1 | GO:0004045 | aminoacyl-tRNA hydrolase activity(GO:0004045) |
| 0.0 | 0.1 | GO:0052655 | branched-chain-amino-acid transaminase activity(GO:0004084) L-leucine transaminase activity(GO:0052654) L-valine transaminase activity(GO:0052655) L-isoleucine transaminase activity(GO:0052656) |
| 0.0 | 0.1 | GO:0045131 | pre-mRNA branch point binding(GO:0045131) |
| 0.0 | 0.2 | GO:0036312 | phosphatidylinositol 3-kinase regulatory subunit binding(GO:0036312) |
| 0.0 | 0.3 | GO:0016176 | superoxide-generating NADPH oxidase activator activity(GO:0016176) |
| 0.0 | 0.3 | GO:0005078 | MAP-kinase scaffold activity(GO:0005078) |
| 0.0 | 0.2 | GO:0004826 | phenylalanine-tRNA ligase activity(GO:0004826) |
| 0.0 | 0.0 | GO:0004169 | dolichyl-phosphate-mannose-protein mannosyltransferase activity(GO:0004169) |
| 0.0 | 0.2 | GO:0048408 | epidermal growth factor binding(GO:0048408) |
| 0.0 | 0.1 | GO:0086079 | gap junction channel activity involved in atrial cardiac muscle cell-AV node cell electrical coupling(GO:0086076) gap junction channel activity involved in bundle of His cell-Purkinje myocyte electrical coupling(GO:0086078) gap junction channel activity involved in Purkinje myocyte-ventricular cardiac muscle cell electrical coupling(GO:0086079) |
| 0.0 | 0.1 | GO:0034041 | sterol-transporting ATPase activity(GO:0034041) |
| 0.0 | 0.9 | GO:0080025 | phosphatidylinositol-3,5-bisphosphate binding(GO:0080025) |
| 0.0 | 0.2 | GO:0004322 | ferroxidase activity(GO:0004322) oxidoreductase activity, oxidizing metal ions, oxygen as acceptor(GO:0016724) |
| 0.0 | 0.1 | GO:0047696 | beta-adrenergic receptor kinase activity(GO:0047696) |
| 0.0 | 0.5 | GO:0043522 | leucine zipper domain binding(GO:0043522) |
| 0.0 | 0.1 | GO:0004566 | beta-glucuronidase activity(GO:0004566) |
| 0.0 | 0.1 | GO:0015137 | citrate transmembrane transporter activity(GO:0015137) tricarboxylic acid transmembrane transporter activity(GO:0015142) |
| 0.0 | 0.1 | GO:0003974 | UDP-N-acetylglucosamine 4-epimerase activity(GO:0003974) UDP-glucose 4-epimerase activity(GO:0003978) |
| 0.0 | 0.5 | GO:0004143 | diacylglycerol kinase activity(GO:0004143) |
| 0.0 | 0.1 | GO:0005128 | erythropoietin receptor binding(GO:0005128) |
| 0.0 | 0.1 | GO:0047888 | fatty acid peroxidase activity(GO:0047888) |
| 0.0 | 0.1 | GO:0004461 | lactose synthase activity(GO:0004461) |
| 0.0 | 0.5 | GO:0017049 | GTP-Rho binding(GO:0017049) |
| 0.0 | 0.2 | GO:0102336 | fatty acid elongase activity(GO:0009922) 3-oxo-arachidoyl-CoA synthase activity(GO:0102336) 3-oxo-cerotoyl-CoA synthase activity(GO:0102337) 3-oxo-lignoceronyl-CoA synthase activity(GO:0102338) |
| 0.0 | 0.1 | GO:0033691 | sialic acid binding(GO:0033691) |
| 0.0 | 0.4 | GO:0032794 | GTPase activating protein binding(GO:0032794) |
| 0.0 | 2.4 | GO:0003777 | microtubule motor activity(GO:0003777) |
| 0.0 | 0.1 | GO:0045029 | UDP-activated nucleotide receptor activity(GO:0045029) |
| 0.0 | 0.1 | GO:0015254 | glycerol channel activity(GO:0015254) |
| 0.0 | 0.1 | GO:0050220 | prostaglandin-E synthase activity(GO:0050220) |
| 0.0 | 0.0 | GO:0015230 | FAD transmembrane transporter activity(GO:0015230) |
| 0.0 | 0.1 | GO:0009383 | rRNA (cytosine-C5-)-methyltransferase activity(GO:0009383) |
| 0.0 | 0.2 | GO:0001042 | RNA polymerase I core binding(GO:0001042) |
| 0.0 | 0.8 | GO:0000175 | 3'-5'-exoribonuclease activity(GO:0000175) |
| 0.0 | 0.1 | GO:0070095 | fructose-6-phosphate binding(GO:0070095) |
| 0.0 | 0.4 | GO:0097602 | cullin family protein binding(GO:0097602) |
| 0.0 | 0.1 | GO:0009019 | tRNA (guanine-N1-)-methyltransferase activity(GO:0009019) |
| 0.0 | 0.1 | GO:0015227 | amino-acid betaine transmembrane transporter activity(GO:0015199) carnitine transmembrane transporter activity(GO:0015226) acyl carnitine transmembrane transporter activity(GO:0015227) |
| 0.0 | 0.0 | GO:0048040 | UDP-glucuronate decarboxylase activity(GO:0048040) |
| 0.0 | 0.6 | GO:0005035 | tumor necrosis factor-activated receptor activity(GO:0005031) death receptor activity(GO:0005035) |
| 0.0 | 0.1 | GO:0001032 | RNA polymerase III type 3 promoter DNA binding(GO:0001032) |
| 0.0 | 0.0 | GO:0051021 | GDP-dissociation inhibitor binding(GO:0051021) Rho GDP-dissociation inhibitor binding(GO:0051022) |
| 0.0 | 0.1 | GO:0005119 | smoothened binding(GO:0005119) |
| 0.0 | 0.1 | GO:0042809 | vitamin D receptor binding(GO:0042809) |
| 0.0 | 0.1 | GO:0004910 | interleukin-1, Type II, blocking receptor activity(GO:0004910) |
| 0.0 | 0.6 | GO:0030228 | lipoprotein particle receptor activity(GO:0030228) |
| 0.0 | 0.6 | GO:0017091 | AU-rich element binding(GO:0017091) |
| 0.0 | 0.1 | GO:0071933 | Arp2/3 complex binding(GO:0071933) |
| 0.0 | 0.2 | GO:0017034 | Rap guanyl-nucleotide exchange factor activity(GO:0017034) |
| 0.0 | 0.1 | GO:0015315 | hexose phosphate transmembrane transporter activity(GO:0015119) organophosphate:inorganic phosphate antiporter activity(GO:0015315) hexose-phosphate:inorganic phosphate antiporter activity(GO:0015526) glucose 6-phosphate:inorganic phosphate antiporter activity(GO:0061513) |
| 0.0 | 0.2 | GO:0032036 | myosin heavy chain binding(GO:0032036) |
| 0.0 | 0.0 | GO:0004818 | glutamate-tRNA ligase activity(GO:0004818) |
| 0.0 | 0.1 | GO:0016309 | 1-phosphatidylinositol-5-phosphate 4-kinase activity(GO:0016309) |
| 0.0 | 0.4 | GO:0005095 | GTPase inhibitor activity(GO:0005095) |
| 0.0 | 0.1 | GO:0016922 | ligand-dependent nuclear receptor binding(GO:0016922) |
| 0.0 | 0.1 | GO:0044020 | histone methyltransferase activity (H4-R3 specific)(GO:0044020) |
| 0.0 | 0.1 | GO:0016286 | small conductance calcium-activated potassium channel activity(GO:0016286) |
| 0.0 | 0.1 | GO:0003720 | telomerase activity(GO:0003720) RNA-directed DNA polymerase activity(GO:0003964) |
| 0.0 | 0.1 | GO:0005173 | stem cell factor receptor binding(GO:0005173) |
| 0.0 | 0.5 | GO:0038191 | neuropilin binding(GO:0038191) |
| 0.0 | 0.4 | GO:0005528 | macrolide binding(GO:0005527) FK506 binding(GO:0005528) |
| 0.0 | 0.1 | GO:0042500 | aspartic endopeptidase activity, intramembrane cleaving(GO:0042500) |
| 0.0 | 0.1 | GO:0051185 | coenzyme transporter activity(GO:0051185) |
| 0.0 | 0.1 | GO:0070915 | lysophosphatidic acid receptor activity(GO:0070915) |
| 0.0 | 0.2 | GO:0030284 | estrogen receptor activity(GO:0030284) |
| 0.0 | 0.1 | GO:0033906 | protein tyrosine kinase inhibitor activity(GO:0030292) hyaluronoglucuronidase activity(GO:0033906) |
| 0.0 | 0.1 | GO:0005105 | type 1 fibroblast growth factor receptor binding(GO:0005105) |
| 0.0 | 0.2 | GO:0019865 | immunoglobulin binding(GO:0019865) |
| 0.0 | 0.1 | GO:1990599 | 3' overhang single-stranded DNA endodeoxyribonuclease activity(GO:1990599) |
| 0.0 | 0.1 | GO:0002046 | opsin binding(GO:0002046) |
| 0.0 | 0.0 | GO:0051734 | ATP-dependent polydeoxyribonucleotide 5'-hydroxyl-kinase activity(GO:0046404) polydeoxyribonucleotide kinase activity(GO:0051733) ATP-dependent polynucleotide kinase activity(GO:0051734) |
| 0.0 | 0.3 | GO:0008191 | metalloendopeptidase inhibitor activity(GO:0008191) |
| 0.0 | 0.0 | GO:0000384 | first spliceosomal transesterification activity(GO:0000384) |
| 0.0 | 0.1 | GO:0030274 | LIM domain binding(GO:0030274) |
| 0.0 | 0.1 | GO:0015307 | drug:proton antiporter activity(GO:0015307) |
| 0.0 | 0.0 | GO:0002094 | polyprenyltransferase activity(GO:0002094) |
| 0.0 | 0.1 | GO:0008195 | phosphatidate phosphatase activity(GO:0008195) |
| 0.0 | 0.1 | GO:0022841 | potassium ion leak channel activity(GO:0022841) |
| 0.0 | 0.0 | GO:0031177 | acyl binding(GO:0000035) phosphopantetheine binding(GO:0031177) |
| 0.0 | 0.6 | GO:0042162 | telomeric DNA binding(GO:0042162) |
Gene overrepresentation in C2:CP category:
| Log-likelihood per target | Total log-likelihood | Term | Description |
|---|---|---|---|
| 0.0 | 0.5 | PID RET PATHWAY | Signaling events regulated by Ret tyrosine kinase |
| 0.0 | 0.4 | ST TYPE I INTERFERON PATHWAY | Type I Interferon (alpha/beta IFN) Pathway |
| 0.0 | 1.6 | ST GAQ PATHWAY | G alpha q Pathway |
| 0.0 | 0.6 | PID INTEGRIN4 PATHWAY | Alpha6 beta4 integrin-ligand interactions |
| 0.0 | 0.7 | NABA BASEMENT MEMBRANES | Genes encoding structural components of basement membranes |
| 0.0 | 0.4 | PID IL23 PATHWAY | IL23-mediated signaling events |
| 0.0 | 0.1 | PID IL8 CXCR2 PATHWAY | IL8- and CXCR2-mediated signaling events |
| 0.0 | 0.8 | PID S1P S1P3 PATHWAY | S1P3 pathway |
| 0.0 | 1.1 | PID SYNDECAN 1 PATHWAY | Syndecan-1-mediated signaling events |
| 0.0 | 0.2 | SIG CD40PATHWAYMAP | Genes related to CD40 signaling |
| 0.0 | 1.1 | ST T CELL SIGNAL TRANSDUCTION | T Cell Signal Transduction |
| 0.0 | 0.3 | ST G ALPHA S PATHWAY | G alpha s Pathway |
| 0.0 | 0.1 | PID ARF6 DOWNSTREAM PATHWAY | Arf6 downstream pathway |
| 0.0 | 1.2 | PID LKB1 PATHWAY | LKB1 signaling events |
| 0.0 | 0.1 | SIG PIP3 SIGNALING IN CARDIAC MYOCTES | Genes related to PIP3 signaling in cardiac myocytes |
| 0.0 | 0.8 | PID ECADHERIN STABILIZATION PATHWAY | Stabilization and expansion of the E-cadherin adherens junction |
Gene overrepresentation in C2:CP:REACTOME category:
| Log-likelihood per target | Total log-likelihood | Term | Description |
|---|---|---|---|
| 0.1 | 2.5 | REACTOME KINESINS | Genes involved in Kinesins |
| 0.1 | 0.3 | REACTOME MITOTIC G2 G2 M PHASES | Genes involved in Mitotic G2-G2/M phases |
| 0.0 | 0.1 | REACTOME FORMATION OF TUBULIN FOLDING INTERMEDIATES BY CCT TRIC | Genes involved in Formation of tubulin folding intermediates by CCT/TriC |
| 0.0 | 1.1 | REACTOME PHOSPHORYLATION OF CD3 AND TCR ZETA CHAINS | Genes involved in Phosphorylation of CD3 and TCR zeta chains |
| 0.0 | 0.7 | REACTOME PLATELET ADHESION TO EXPOSED COLLAGEN | Genes involved in Platelet Adhesion to exposed collagen |
| 0.0 | 0.7 | REACTOME PROLACTIN RECEPTOR SIGNALING | Genes involved in Prolactin receptor signaling |
| 0.0 | 0.5 | REACTOME BASE FREE SUGAR PHOSPHATE REMOVAL VIA THE SINGLE NUCLEOTIDE REPLACEMENT PATHWAY | Genes involved in Base-free sugar-phosphate removal via the single-nucleotide replacement pathway |
| 0.0 | 0.1 | REACTOME ENDOSOMAL VACUOLAR PATHWAY | Genes involved in Endosomal/Vacuolar pathway |
| 0.0 | 1.0 | REACTOME PTM GAMMA CARBOXYLATION HYPUSINE FORMATION AND ARYLSULFATASE ACTIVATION | Genes involved in PTM: gamma carboxylation, hypusine formation and arylsulfatase activation |
| 0.0 | 0.3 | REACTOME PECAM1 INTERACTIONS | Genes involved in PECAM1 interactions |
| 0.0 | 0.2 | REACTOME ACTIVATED TAK1 MEDIATES P38 MAPK ACTIVATION | Genes involved in activated TAK1 mediates p38 MAPK activation |
| 0.0 | 0.4 | REACTOME CALNEXIN CALRETICULIN CYCLE | Genes involved in Calnexin/calreticulin cycle |
| 0.0 | 0.9 | REACTOME PACKAGING OF TELOMERE ENDS | Genes involved in Packaging Of Telomere Ends |
| 0.0 | 0.4 | REACTOME SIGNAL ATTENUATION | Genes involved in Signal attenuation |
| 0.0 | 0.2 | REACTOME CS DS DEGRADATION | Genes involved in CS/DS degradation |
| 0.0 | 0.8 | REACTOME A TETRASACCHARIDE LINKER SEQUENCE IS REQUIRED FOR GAG SYNTHESIS | Genes involved in A tetrasaccharide linker sequence is required for GAG synthesis |
| 0.0 | 0.1 | REACTOME ABORTIVE ELONGATION OF HIV1 TRANSCRIPT IN THE ABSENCE OF TAT | Genes involved in Abortive elongation of HIV-1 transcript in the absence of Tat |
| 0.0 | 1.4 | REACTOME INTERFERON ALPHA BETA SIGNALING | Genes involved in Interferon alpha/beta signaling |
| 0.0 | 0.1 | REACTOME GASTRIN CREB SIGNALLING PATHWAY VIA PKC AND MAPK | Genes involved in Gastrin-CREB signalling pathway via PKC and MAPK |
| 0.0 | 0.7 | REACTOME SEMA4D INDUCED CELL MIGRATION AND GROWTH CONE COLLAPSE | Genes involved in Sema4D induced cell migration and growth-cone collapse |
| 0.0 | 0.2 | REACTOME TRAF3 DEPENDENT IRF ACTIVATION PATHWAY | Genes involved in TRAF3-dependent IRF activation pathway |
| 0.0 | 0.1 | REACTOME MICRORNA MIRNA BIOGENESIS | Genes involved in MicroRNA (miRNA) Biogenesis |
| 0.0 | 0.2 | REACTOME SLBP DEPENDENT PROCESSING OF REPLICATION DEPENDENT HISTONE PRE MRNAS | Genes involved in SLBP Dependent Processing of Replication-Dependent Histone Pre-mRNAs |
| 0.0 | 0.3 | REACTOME DEGRADATION OF THE EXTRACELLULAR MATRIX | Genes involved in Degradation of the extracellular matrix |
| 0.0 | 0.2 | REACTOME REGULATION OF INSULIN LIKE GROWTH FACTOR IGF ACTIVITY BY INSULIN LIKE GROWTH FACTOR BINDING PROTEINS IGFBPS | Genes involved in Regulation of Insulin-like Growth Factor (IGF) Activity by Insulin-like Growth Factor Binding Proteins (IGFBPs) |
| 0.0 | 0.7 | REACTOME RAP1 SIGNALLING | Genes involved in Rap1 signalling |
| 0.0 | 0.3 | REACTOME REGULATION OF RHEB GTPASE ACTIVITY BY AMPK | Genes involved in Regulation of Rheb GTPase activity by AMPK |
| 0.0 | 0.1 | REACTOME E2F ENABLED INHIBITION OF PRE REPLICATION COMPLEX FORMATION | Genes involved in E2F-enabled inhibition of pre-replication complex formation |
| 0.0 | 0.8 | REACTOME NOD1 2 SIGNALING PATHWAY | Genes involved in NOD1/2 Signaling Pathway |