Project
NHBE cells infected with SARS-CoV-2 Analysis Results (GEO series: GSE147507)
Navigation
Downloads
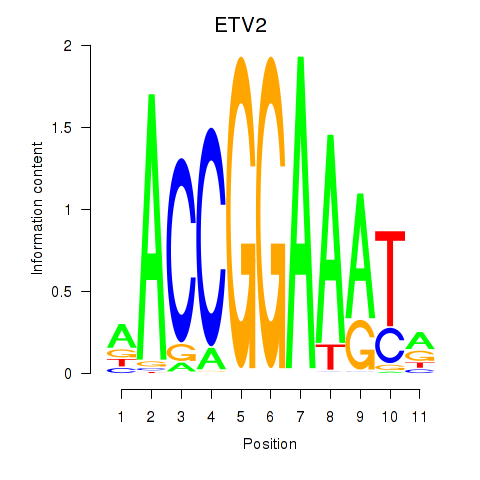
Results for ETV2
Z-value: 0.52
Motif logo
Transcription factors associated with ETV2
| Gene Symbol | Gene ID | Gene Info |
|---|---|---|
|
ETV2
|
ENSG00000105672.10 | ETS variant transcription factor 2 |
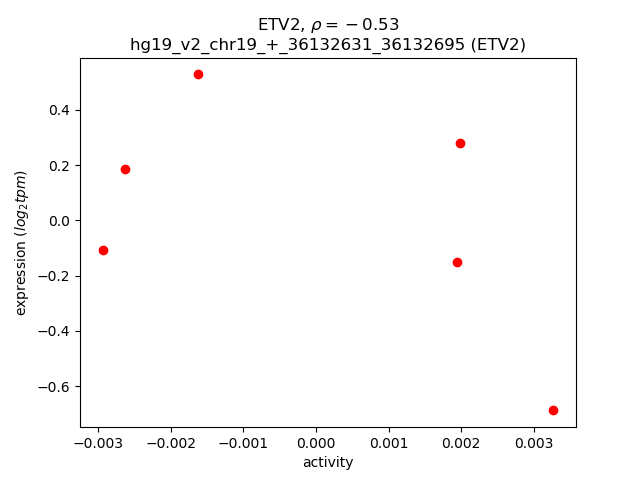
Activity-expression correlation:
| Gene | Promoter | Pearson corr. coef. | P-value | Plot |
|---|---|---|---|---|
| ETV2 | hg19_v2_chr19_+_36132631_36132695 | -0.53 | 2.8e-01 | Click! |
Activity profile of ETV2 motif
Sorted Z-values of ETV2 motif
| Promoter | Log-likelihood | Transcript | Gene | Gene Info |
|---|---|---|---|---|
| chr22_+_27068766 | 0.72 |
ENST00000435162.1
ENST00000437071.1 ENST00000440816.1 ENST00000421253.1 |
CTA-211A9.5
|
CTA-211A9.5 |
| chr22_+_27068704 | 0.49 |
ENST00000444388.1
ENST00000450963.1 ENST00000449017.1 |
CTA-211A9.5
|
CTA-211A9.5 |
| chr3_+_52321827 | 0.30 |
ENST00000473032.1
ENST00000305690.8 ENST00000354773.4 ENST00000471180.1 ENST00000436784.2 |
GLYCTK
|
glycerate kinase |
| chr15_-_71184724 | 0.29 |
ENST00000560604.1
|
THAP10
|
THAP domain containing 10 |
| chr11_-_62389577 | 0.27 |
ENST00000534715.1
|
B3GAT3
|
beta-1,3-glucuronyltransferase 3 (glucuronosyltransferase I) |
| chr6_+_31620191 | 0.26 |
ENST00000375918.2
ENST00000375920.4 |
APOM
|
apolipoprotein M |
| chr17_+_48450575 | 0.26 |
ENST00000338165.4
ENST00000393271.2 ENST00000511519.2 |
EME1
|
essential meiotic structure-specific endonuclease 1 |
| chr16_-_2205352 | 0.23 |
ENST00000563192.1
|
RP11-304L19.5
|
RP11-304L19.5 |
| chr2_+_234160217 | 0.23 |
ENST00000392017.4
ENST00000347464.5 ENST00000444735.1 ENST00000373525.5 ENST00000419681.1 |
ATG16L1
|
autophagy related 16-like 1 (S. cerevisiae) |
| chr21_-_47706098 | 0.20 |
ENST00000426537.1
|
MCM3AP
|
minichromosome maintenance complex component 3 associated protein |
| chr19_-_55791563 | 0.20 |
ENST00000588971.1
ENST00000255631.5 ENST00000587551.1 |
HSPBP1
|
HSPA (heat shock 70kDa) binding protein, cytoplasmic cochaperone 1 |
| chr15_-_55488817 | 0.19 |
ENST00000569386.1
|
RSL24D1
|
ribosomal L24 domain containing 1 |
| chr10_-_127408011 | 0.19 |
ENST00000531977.1
ENST00000527483.1 ENST00000525909.1 ENST00000528844.1 ENST00000423178.2 |
RP11-383C5.4
|
RP11-383C5.4 |
| chr16_-_3493528 | 0.19 |
ENST00000301744.4
|
ZNF597
|
zinc finger protein 597 |
| chr9_+_36190853 | 0.19 |
ENST00000433436.2
ENST00000538225.1 ENST00000540080.1 |
CLTA
|
clathrin, light chain A |
| chr4_-_137842536 | 0.19 |
ENST00000512039.1
|
RP11-138I17.1
|
RP11-138I17.1 |
| chr2_+_217363559 | 0.18 |
ENST00000600880.1
ENST00000446558.1 |
RPL37A
|
ribosomal protein L37a |
| chr9_+_36190905 | 0.18 |
ENST00000345519.5
ENST00000470744.1 ENST00000242285.6 ENST00000466396.1 ENST00000396603.2 |
CLTA
|
clathrin, light chain A |
| chr2_+_234160340 | 0.18 |
ENST00000417017.1
ENST00000392020.4 ENST00000392018.1 |
ATG16L1
|
autophagy related 16-like 1 (S. cerevisiae) |
| chr16_-_67260691 | 0.18 |
ENST00000447579.1
ENST00000393992.1 ENST00000424285.1 |
LRRC29
|
leucine rich repeat containing 29 |
| chr3_-_47324242 | 0.18 |
ENST00000456548.1
ENST00000432493.1 ENST00000335044.2 ENST00000444589.2 |
KIF9
|
kinesin family member 9 |
| chr15_+_83209620 | 0.17 |
ENST00000568285.1
|
RP11-379H8.1
|
Uncharacterized protein |
| chr17_-_48450534 | 0.17 |
ENST00000503633.1
ENST00000442592.3 ENST00000225969.4 |
MRPL27
|
mitochondrial ribosomal protein L27 |
| chr3_-_195581080 | 0.17 |
ENST00000444346.1
|
AC124944.5
|
AC124944.5 |
| chr4_+_79567362 | 0.17 |
ENST00000512322.1
|
RP11-792D21.2
|
long intergenic non-protein coding RNA 1094 |
| chr12_-_752786 | 0.17 |
ENST00000433832.2
ENST00000542920.1 |
NINJ2
|
ninjurin 2 |
| chr11_-_9482010 | 0.17 |
ENST00000596206.1
|
AC132192.1
|
LOC644656 protein; Uncharacterized protein |
| chr12_+_47473369 | 0.17 |
ENST00000546455.1
|
PCED1B
|
PC-esterase domain containing 1B |
| chr1_-_151254362 | 0.16 |
ENST00000447795.2
|
RP11-126K1.2
|
Uncharacterized protein |
| chr4_+_75174204 | 0.16 |
ENST00000332112.4
ENST00000514968.1 ENST00000503098.1 ENST00000502358.1 ENST00000509145.1 ENST00000505212.1 |
EPGN
|
epithelial mitogen |
| chr2_+_138721850 | 0.16 |
ENST00000329366.4
ENST00000280097.3 |
HNMT
|
histamine N-methyltransferase |
| chr19_+_35741466 | 0.16 |
ENST00000599658.1
|
LSR
|
lipolysis stimulated lipoprotein receptor |
| chr10_+_104614008 | 0.15 |
ENST00000369883.3
|
C10orf32
|
chromosome 10 open reading frame 32 |
| chr17_-_48450265 | 0.15 |
ENST00000507088.1
|
MRPL27
|
mitochondrial ribosomal protein L27 |
| chr4_+_79567314 | 0.15 |
ENST00000503539.1
ENST00000504675.1 |
RP11-792D21.2
|
long intergenic non-protein coding RNA 1094 |
| chr20_+_60962143 | 0.15 |
ENST00000343986.4
|
RPS21
|
ribosomal protein S21 |
| chr15_-_65809625 | 0.14 |
ENST00000560436.1
|
DPP8
|
dipeptidyl-peptidase 8 |
| chr15_+_42565393 | 0.14 |
ENST00000561871.1
|
GANC
|
glucosidase, alpha; neutral C |
| chr7_-_99006443 | 0.14 |
ENST00000350498.3
|
PDAP1
|
PDGFA associated protein 1 |
| chr19_+_56116771 | 0.14 |
ENST00000568956.1
|
ZNF865
|
zinc finger protein 865 |
| chr5_+_133451254 | 0.14 |
ENST00000517851.1
ENST00000521639.1 ENST00000522375.1 ENST00000378560.4 ENST00000432532.2 ENST00000520958.1 ENST00000518915.1 ENST00000395023.1 |
TCF7
|
transcription factor 7 (T-cell specific, HMG-box) |
| chr1_+_204485571 | 0.14 |
ENST00000454264.2
ENST00000367183.3 |
MDM4
|
Mdm4 p53 binding protein homolog (mouse) |
| chr3_-_49055991 | 0.13 |
ENST00000441576.2
ENST00000420952.2 ENST00000341949.4 ENST00000395462.4 |
DALRD3
|
DALR anticodon binding domain containing 3 |
| chrX_-_103401649 | 0.13 |
ENST00000357421.4
|
SLC25A53
|
solute carrier family 25, member 53 |
| chr15_-_39486510 | 0.13 |
ENST00000560743.1
|
RP11-265N7.1
|
RP11-265N7.1 |
| chr12_+_120875910 | 0.13 |
ENST00000551806.1
|
AL021546.6
|
Glutamyl-tRNA(Gln) amidotransferase subunit C, mitochondrial |
| chr8_+_105235572 | 0.13 |
ENST00000523362.1
|
RIMS2
|
regulating synaptic membrane exocytosis 2 |
| chrX_+_54947229 | 0.13 |
ENST00000442098.1
ENST00000430420.1 ENST00000453081.1 ENST00000173898.7 ENST00000319167.8 ENST00000375022.4 ENST00000399736.1 ENST00000440072.1 ENST00000420798.2 ENST00000431115.1 ENST00000440759.1 ENST00000375041.2 |
TRO
|
trophinin |
| chr1_-_169764026 | 0.12 |
ENST00000454472.1
ENST00000310392.4 |
METTL18
|
methyltransferase like 18 |
| chr11_-_62477313 | 0.12 |
ENST00000464544.1
ENST00000530009.1 |
BSCL2
|
Berardinelli-Seip congenital lipodystrophy 2 (seipin) |
| chr21_-_46359760 | 0.12 |
ENST00000330551.3
ENST00000397841.1 ENST00000380070.4 |
C21orf67
|
chromosome 21 open reading frame 67 |
| chr5_-_110074603 | 0.12 |
ENST00000515278.2
|
TMEM232
|
transmembrane protein 232 |
| chr19_-_37263723 | 0.12 |
ENST00000589390.1
|
ZNF850
|
zinc finger protein 850 |
| chr19_+_37264033 | 0.12 |
ENST00000590750.1
|
CTD-2162K18.4
|
Uncharacterized protein |
| chr12_-_6798410 | 0.12 |
ENST00000361959.3
ENST00000436774.2 ENST00000544482.1 |
ZNF384
|
zinc finger protein 384 |
| chr19_+_44764031 | 0.12 |
ENST00000592581.1
ENST00000590668.1 ENST00000588489.1 ENST00000391958.2 |
ZNF233
|
zinc finger protein 233 |
| chr7_-_150020216 | 0.12 |
ENST00000477367.1
|
ACTR3C
|
ARP3 actin-related protein 3 homolog C (yeast) |
| chr7_+_99006232 | 0.12 |
ENST00000403633.2
|
BUD31
|
BUD31 homolog (S. cerevisiae) |
| chr3_+_15469058 | 0.12 |
ENST00000432764.2
|
EAF1
|
ELL associated factor 1 |
| chr16_+_20817953 | 0.11 |
ENST00000568647.1
|
AC004381.6
|
Putative RNA exonuclease NEF-sp |
| chr1_+_204485503 | 0.11 |
ENST00000367182.3
ENST00000507825.2 |
MDM4
|
Mdm4 p53 binding protein homolog (mouse) |
| chr5_-_139422654 | 0.11 |
ENST00000289409.4
ENST00000358522.3 ENST00000378238.4 ENST00000289422.7 ENST00000361474.1 ENST00000545385.1 ENST00000394770.1 ENST00000541337.1 |
NRG2
|
neuregulin 2 |
| chr14_-_23299009 | 0.11 |
ENST00000488800.1
|
SLC7A7
|
solute carrier family 7 (amino acid transporter light chain, y+L system), member 7 |
| chr9_-_91793675 | 0.11 |
ENST00000375835.4
ENST00000375830.1 |
SHC3
|
SHC (Src homology 2 domain containing) transforming protein 3 |
| chr12_+_76653611 | 0.11 |
ENST00000550380.1
|
RP11-54A9.1
|
RP11-54A9.1 |
| chr14_+_32414059 | 0.11 |
ENST00000553330.1
|
RP11-187E13.1
|
Uncharacterized protein |
| chr19_-_40596828 | 0.11 |
ENST00000414720.2
ENST00000455521.1 ENST00000340963.5 ENST00000595773.1 |
ZNF780A
|
zinc finger protein 780A |
| chr3_+_142842128 | 0.11 |
ENST00000483262.1
|
RP11-80H8.4
|
RP11-80H8.4 |
| chr5_+_172386517 | 0.11 |
ENST00000519522.1
|
RPL26L1
|
ribosomal protein L26-like 1 |
| chr4_+_79567057 | 0.10 |
ENST00000503259.1
ENST00000507802.1 |
RP11-792D21.2
|
long intergenic non-protein coding RNA 1094 |
| chr15_+_75639372 | 0.10 |
ENST00000566313.1
ENST00000568059.1 ENST00000568881.1 |
NEIL1
|
nei endonuclease VIII-like 1 (E. coli) |
| chr20_+_49575342 | 0.10 |
ENST00000244051.1
|
MOCS3
|
molybdenum cofactor synthesis 3 |
| chr16_-_3306587 | 0.10 |
ENST00000541159.1
ENST00000536379.1 ENST00000219596.1 ENST00000339854.4 |
MEFV
|
Mediterranean fever |
| chr1_-_161039647 | 0.10 |
ENST00000368013.3
|
ARHGAP30
|
Rho GTPase activating protein 30 |
| chr8_+_22132810 | 0.10 |
ENST00000356766.6
|
PIWIL2
|
piwi-like RNA-mediated gene silencing 2 |
| chr19_+_3708338 | 0.10 |
ENST00000590545.1
|
TJP3
|
tight junction protein 3 |
| chr11_-_119293903 | 0.10 |
ENST00000580275.1
|
THY1
|
Thy-1 cell surface antigen |
| chr19_-_44405623 | 0.10 |
ENST00000591815.1
|
RP11-15A1.3
|
RP11-15A1.3 |
| chr19_-_55791540 | 0.10 |
ENST00000433386.2
|
HSPBP1
|
HSPA (heat shock 70kDa) binding protein, cytoplasmic cochaperone 1 |
| chr16_+_3493611 | 0.10 |
ENST00000407558.4
ENST00000572169.1 ENST00000572757.1 ENST00000573593.1 ENST00000570372.1 ENST00000424546.2 ENST00000575733.1 ENST00000573201.1 ENST00000574950.1 ENST00000573580.1 ENST00000608722.1 |
NAA60
NAA60
|
N(alpha)-acetyltransferase 60, NatF catalytic subunit N-alpha-acetyltransferase 60 |
| chr7_+_150020329 | 0.10 |
ENST00000323078.7
|
LRRC61
|
leucine rich repeat containing 61 |
| chr4_-_185139062 | 0.10 |
ENST00000296741.2
|
ENPP6
|
ectonucleotide pyrophosphatase/phosphodiesterase 6 |
| chr3_-_20227720 | 0.10 |
ENST00000412997.1
|
SGOL1
|
shugoshin-like 1 (S. pombe) |
| chr3_+_139062838 | 0.10 |
ENST00000310776.4
ENST00000465056.1 ENST00000465373.1 |
MRPS22
|
mitochondrial ribosomal protein S22 |
| chr1_+_43855545 | 0.10 |
ENST00000372450.4
ENST00000310739.4 |
SZT2
|
seizure threshold 2 homolog (mouse) |
| chr15_-_74753443 | 0.10 |
ENST00000567435.1
ENST00000564488.1 ENST00000565130.1 ENST00000563081.1 ENST00000565335.1 ENST00000395081.2 ENST00000361351.4 |
UBL7
|
ubiquitin-like 7 (bone marrow stromal cell-derived) |
| chr1_+_145470504 | 0.10 |
ENST00000323397.4
|
ANKRD34A
|
ankyrin repeat domain 34A |
| chr1_-_43855479 | 0.10 |
ENST00000290663.6
ENST00000372457.4 |
MED8
|
mediator complex subunit 8 |
| chr3_+_196669494 | 0.10 |
ENST00000602845.1
|
NCBP2-AS2
|
NCBP2 antisense RNA 2 (head to head) |
| chr1_+_153963227 | 0.10 |
ENST00000368567.4
ENST00000392558.4 |
RPS27
|
ribosomal protein S27 |
| chr4_+_1714548 | 0.10 |
ENST00000605571.1
|
RP11-572O17.1
|
RP11-572O17.1 |
| chr11_-_73882249 | 0.10 |
ENST00000535954.1
|
C2CD3
|
C2 calcium-dependent domain containing 3 |
| chr12_+_47610315 | 0.10 |
ENST00000548348.1
ENST00000549500.1 |
PCED1B
|
PC-esterase domain containing 1B |
| chr16_+_20818020 | 0.10 |
ENST00000564274.1
ENST00000563068.1 |
AC004381.6
|
Putative RNA exonuclease NEF-sp |
| chr19_-_55791431 | 0.09 |
ENST00000593263.1
ENST00000376343.3 |
HSPBP1
|
HSPA (heat shock 70kDa) binding protein, cytoplasmic cochaperone 1 |
| chr19_+_10397648 | 0.09 |
ENST00000340992.4
ENST00000393717.2 |
ICAM4
|
intercellular adhesion molecule 4 (Landsteiner-Wiener blood group) |
| chr2_+_32502952 | 0.09 |
ENST00000238831.4
|
YIPF4
|
Yip1 domain family, member 4 |
| chr15_-_90233866 | 0.09 |
ENST00000561257.1
|
PEX11A
|
peroxisomal biogenesis factor 11 alpha |
| chr7_+_99006550 | 0.09 |
ENST00000222969.5
|
BUD31
|
BUD31 homolog (S. cerevisiae) |
| chr9_+_2017063 | 0.09 |
ENST00000457226.1
|
SMARCA2
|
SWI/SNF related, matrix associated, actin dependent regulator of chromatin, subfamily a, member 2 |
| chr11_+_10772847 | 0.09 |
ENST00000524523.1
|
CTR9
|
CTR9, Paf1/RNA polymerase II complex component |
| chr16_+_89724188 | 0.09 |
ENST00000301031.4
ENST00000566204.1 ENST00000579310.1 |
SPATA33
|
spermatogenesis associated 33 |
| chr20_-_48532046 | 0.09 |
ENST00000543716.1
|
SPATA2
|
spermatogenesis associated 2 |
| chr14_-_69864993 | 0.09 |
ENST00000555373.1
|
ERH
|
enhancer of rudimentary homolog (Drosophila) |
| chr1_+_38273818 | 0.09 |
ENST00000373042.4
|
C1orf122
|
chromosome 1 open reading frame 122 |
| chr16_+_20817746 | 0.09 |
ENST00000568894.1
|
AC004381.6
|
Putative RNA exonuclease NEF-sp |
| chr17_-_7155775 | 0.09 |
ENST00000571409.1
|
CTDNEP1
|
CTD nuclear envelope phosphatase 1 |
| chr9_+_37753795 | 0.09 |
ENST00000377753.2
ENST00000537911.1 ENST00000377754.2 ENST00000297994.3 |
TRMT10B
|
tRNA methyltransferase 10 homolog B (S. cerevisiae) |
| chr14_-_75179774 | 0.09 |
ENST00000555249.1
ENST00000556202.1 ENST00000356357.4 ENST00000338772.5 |
AREL1
AC007956.1
|
apoptosis resistant E3 ubiquitin protein ligase 1 Full-length cDNA 5-PRIME end of clone CS0CAP004YO05 of Thymus of Homo sapiens (human); Uncharacterized protein |
| chr14_+_24616588 | 0.09 |
ENST00000324103.6
ENST00000559260.1 |
RNF31
|
ring finger protein 31 |
| chr19_-_19626838 | 0.09 |
ENST00000360913.3
|
TSSK6
|
testis-specific serine kinase 6 |
| chr20_-_48532019 | 0.09 |
ENST00000289431.5
|
SPATA2
|
spermatogenesis associated 2 |
| chr7_+_102988082 | 0.09 |
ENST00000292644.3
ENST00000544811.1 |
PSMC2
|
proteasome (prosome, macropain) 26S subunit, ATPase, 2 |
| chr16_+_67261008 | 0.09 |
ENST00000304800.9
ENST00000563953.1 ENST00000565201.1 |
TMEM208
|
transmembrane protein 208 |
| chr1_-_92952433 | 0.09 |
ENST00000294702.5
|
GFI1
|
growth factor independent 1 transcription repressor |
| chr17_+_4843594 | 0.09 |
ENST00000570328.1
|
RNF167
|
ring finger protein 167 |
| chr2_+_217363826 | 0.09 |
ENST00000441179.2
|
RPL37A
|
ribosomal protein L37a |
| chr5_-_10249990 | 0.09 |
ENST00000511437.1
ENST00000280330.8 ENST00000510047.1 |
FAM173B
|
family with sequence similarity 173, member B |
| chr1_-_147245445 | 0.09 |
ENST00000430508.1
|
GJA5
|
gap junction protein, alpha 5, 40kDa |
| chr3_+_93781728 | 0.09 |
ENST00000314622.4
|
NSUN3
|
NOP2/Sun domain family, member 3 |
| chr3_-_180397256 | 0.09 |
ENST00000442201.2
|
CCDC39
|
coiled-coil domain containing 39 |
| chr10_+_1102303 | 0.09 |
ENST00000381329.1
|
WDR37
|
WD repeat domain 37 |
| chr12_-_104350898 | 0.08 |
ENST00000552940.1
ENST00000547975.1 ENST00000549478.1 ENST00000546540.1 ENST00000546819.1 ENST00000378090.4 ENST00000547945.1 |
C12orf73
|
chromosome 12 open reading frame 73 |
| chr2_+_113342011 | 0.08 |
ENST00000324913.5
|
CHCHD5
|
coiled-coil-helix-coiled-coil-helix domain containing 5 |
| chr15_+_42565464 | 0.08 |
ENST00000562170.1
ENST00000562859.1 |
GANC
|
glucosidase, alpha; neutral C |
| chr14_+_52313833 | 0.08 |
ENST00000553560.1
|
GNG2
|
guanine nucleotide binding protein (G protein), gamma 2 |
| chr22_+_22020353 | 0.08 |
ENST00000456792.2
|
PPIL2
|
peptidylprolyl isomerase (cyclophilin)-like 2 |
| chr11_-_64084959 | 0.08 |
ENST00000535750.1
ENST00000535126.1 ENST00000539854.1 ENST00000308774.2 |
TRMT112
|
tRNA methyltransferase 11-2 homolog (S. cerevisiae) |
| chr11_+_62432777 | 0.08 |
ENST00000532971.1
|
METTL12
|
methyltransferase like 12 |
| chr11_-_62477103 | 0.08 |
ENST00000532818.1
|
BSCL2
|
Berardinelli-Seip congenital lipodystrophy 2 (seipin) |
| chr1_-_1509931 | 0.08 |
ENST00000359060.4
|
SSU72
|
SSU72 RNA polymerase II CTD phosphatase homolog (S. cerevisiae) |
| chr4_+_39640754 | 0.08 |
ENST00000529094.1
ENST00000533736.1 |
RP11-539G18.2
|
RP11-539G18.2 |
| chr3_-_169482840 | 0.08 |
ENST00000602385.1
|
TERC
|
telomerase RNA component |
| chr12_+_76653682 | 0.08 |
ENST00000553247.1
|
RP11-54A9.1
|
RP11-54A9.1 |
| chrX_+_48398053 | 0.08 |
ENST00000537536.1
ENST00000418627.1 |
TBC1D25
|
TBC1 domain family, member 25 |
| chr7_-_99679324 | 0.08 |
ENST00000292393.5
ENST00000413658.2 ENST00000412947.1 ENST00000441298.1 ENST00000449785.1 ENST00000299667.4 ENST00000424697.1 |
ZNF3
|
zinc finger protein 3 |
| chr6_-_109776901 | 0.08 |
ENST00000431946.1
|
MICAL1
|
microtubule associated monooxygenase, calponin and LIM domain containing 1 |
| chr17_+_18218587 | 0.08 |
ENST00000406438.3
|
SMCR8
|
Smith-Magenis syndrome chromosome region, candidate 8 |
| chr11_-_62477041 | 0.08 |
ENST00000433053.1
|
BSCL2
|
Berardinelli-Seip congenital lipodystrophy 2 (seipin) |
| chr16_+_20817926 | 0.08 |
ENST00000565340.1
|
AC004381.6
|
Putative RNA exonuclease NEF-sp |
| chr12_-_50236907 | 0.08 |
ENST00000333924.4
|
BCDIN3D
|
BCDIN3 domain containing |
| chr9_-_138853156 | 0.08 |
ENST00000371756.3
|
UBAC1
|
UBA domain containing 1 |
| chr14_+_65879437 | 0.08 |
ENST00000394585.1
|
FUT8
|
fucosyltransferase 8 (alpha (1,6) fucosyltransferase) |
| chr1_-_52870059 | 0.08 |
ENST00000371566.1
|
ORC1
|
origin recognition complex, subunit 1 |
| chr19_+_9732156 | 0.08 |
ENST00000586614.1
ENST00000587536.1 ENST00000591056.1 ENST00000592851.1 |
C19orf82
|
chromosome 19 open reading frame 82 |
| chr17_-_56065484 | 0.08 |
ENST00000581208.1
|
VEZF1
|
vascular endothelial zinc finger 1 |
| chr2_+_162016804 | 0.08 |
ENST00000392749.2
ENST00000440506.1 |
TANK
|
TRAF family member-associated NFKB activator |
| chr17_+_45908974 | 0.08 |
ENST00000269025.4
|
LRRC46
|
leucine rich repeat containing 46 |
| chr2_-_231989808 | 0.08 |
ENST00000258400.3
|
HTR2B
|
5-hydroxytryptamine (serotonin) receptor 2B, G protein-coupled |
| chr3_-_47324060 | 0.08 |
ENST00000452770.2
|
KIF9
|
kinesin family member 9 |
| chr22_+_39898391 | 0.08 |
ENST00000434364.1
|
MIEF1
|
mitochondrial elongation factor 1 |
| chr11_-_125773085 | 0.08 |
ENST00000227474.3
ENST00000534158.1 ENST00000529801.1 |
PUS3
|
pseudouridylate synthase 3 |
| chr11_+_43902373 | 0.08 |
ENST00000302708.4
ENST00000378840.4 ENST00000524742.1 |
ALKBH3
|
alkB, alkylation repair homolog 3 (E. coli) |
| chr6_-_99873145 | 0.08 |
ENST00000369239.5
ENST00000438806.1 |
PNISR
|
PNN-interacting serine/arginine-rich protein |
| chr7_-_22539771 | 0.07 |
ENST00000406890.2
ENST00000424363.1 |
STEAP1B
|
STEAP family member 1B |
| chr12_-_122018859 | 0.07 |
ENST00000536437.1
ENST00000377071.4 ENST00000538046.2 |
KDM2B
|
lysine (K)-specific demethylase 2B |
| chr16_-_66968265 | 0.07 |
ENST00000567511.1
ENST00000422424.2 |
FAM96B
|
family with sequence similarity 96, member B |
| chr7_-_150020578 | 0.07 |
ENST00000478393.1
|
ACTR3C
|
ARP3 actin-related protein 3 homolog C (yeast) |
| chr3_+_28390637 | 0.07 |
ENST00000420223.1
ENST00000383768.2 |
ZCWPW2
|
zinc finger, CW type with PWWP domain 2 |
| chr6_+_42981922 | 0.07 |
ENST00000326974.4
ENST00000244670.8 |
KLHDC3
|
kelch domain containing 3 |
| chr2_+_63816126 | 0.07 |
ENST00000454035.1
|
MDH1
|
malate dehydrogenase 1, NAD (soluble) |
| chr2_-_25016251 | 0.07 |
ENST00000328379.5
|
PTRHD1
|
peptidyl-tRNA hydrolase domain containing 1 |
| chr19_-_52674896 | 0.07 |
ENST00000322146.8
ENST00000597065.1 |
ZNF836
|
zinc finger protein 836 |
| chr6_+_71377567 | 0.07 |
ENST00000422334.2
|
SMAP1
|
small ArfGAP 1 |
| chr17_-_6543973 | 0.07 |
ENST00000571642.1
ENST00000572370.1 |
KIAA0753
|
KIAA0753 |
| chr19_+_36235964 | 0.07 |
ENST00000587708.2
|
PSENEN
|
presenilin enhancer gamma secretase subunit |
| chr18_+_32621324 | 0.07 |
ENST00000300249.5
ENST00000538170.2 ENST00000588910.1 |
MAPRE2
|
microtubule-associated protein, RP/EB family, member 2 |
| chr17_+_60501228 | 0.07 |
ENST00000311506.5
|
METTL2A
|
methyltransferase like 2A |
| chr11_-_64851496 | 0.07 |
ENST00000404147.3
ENST00000275517.3 |
CDCA5
|
cell division cycle associated 5 |
| chr2_+_217363793 | 0.07 |
ENST00000456586.1
ENST00000598925.1 ENST00000427280.2 |
RPL37A
|
ribosomal protein L37a |
| chr22_+_22020273 | 0.07 |
ENST00000412327.1
ENST00000335025.8 ENST00000398831.3 ENST00000492445.2 ENST00000458567.1 ENST00000406385.1 |
PPIL2
|
peptidylprolyl isomerase (cyclophilin)-like 2 |
| chr14_+_100842735 | 0.07 |
ENST00000554998.1
ENST00000402312.3 ENST00000335290.6 ENST00000554175.1 |
WDR25
|
WD repeat domain 25 |
| chr12_-_6798523 | 0.07 |
ENST00000319770.3
|
ZNF384
|
zinc finger protein 384 |
| chr4_-_186732892 | 0.07 |
ENST00000451958.1
ENST00000439914.1 ENST00000428330.1 ENST00000429056.1 |
SORBS2
|
sorbin and SH3 domain containing 2 |
| chr15_+_75640068 | 0.07 |
ENST00000565051.1
ENST00000564257.1 ENST00000567005.1 |
NEIL1
|
nei endonuclease VIII-like 1 (E. coli) |
| chr2_+_120687335 | 0.07 |
ENST00000544261.1
|
PTPN4
|
protein tyrosine phosphatase, non-receptor type 4 (megakaryocyte) |
| chr5_+_132202252 | 0.07 |
ENST00000378670.3
ENST00000378667.1 ENST00000378665.1 |
UQCRQ
|
ubiquinol-cytochrome c reductase, complex III subunit VII, 9.5kDa |
| chr9_+_115249100 | 0.07 |
ENST00000337530.6
ENST00000374244.3 ENST00000536272.1 |
KIAA1958
|
KIAA1958 |
| chr11_-_64085533 | 0.07 |
ENST00000544844.1
|
TRMT112
|
tRNA methyltransferase 11-2 homolog (S. cerevisiae) |
| chr17_-_7108436 | 0.07 |
ENST00000493294.1
|
DLG4
|
discs, large homolog 4 (Drosophila) |
| chr10_-_53459319 | 0.07 |
ENST00000331173.4
|
CSTF2T
|
cleavage stimulation factor, 3' pre-RNA, subunit 2, 64kDa, tau variant |
| chr1_-_161039456 | 0.07 |
ENST00000368016.3
|
ARHGAP30
|
Rho GTPase activating protein 30 |
| chr19_+_10397621 | 0.07 |
ENST00000380770.3
|
ICAM4
|
intercellular adhesion molecule 4 (Landsteiner-Wiener blood group) |
| chr19_-_59030921 | 0.07 |
ENST00000354590.3
ENST00000596739.1 |
ZBTB45
|
zinc finger and BTB domain containing 45 |
| chr12_-_6602955 | 0.07 |
ENST00000543703.1
|
MRPL51
|
mitochondrial ribosomal protein L51 |
| chr2_+_233415363 | 0.07 |
ENST00000409514.1
ENST00000409098.1 ENST00000409495.1 ENST00000409167.3 ENST00000409322.1 ENST00000409394.1 |
EIF4E2
|
eukaryotic translation initiation factor 4E family member 2 |
| chr12_-_6798616 | 0.07 |
ENST00000355772.4
ENST00000417772.3 ENST00000396801.3 ENST00000396799.2 |
ZNF384
|
zinc finger protein 384 |
| chr8_-_145742862 | 0.07 |
ENST00000524998.1
|
RECQL4
|
RecQ protein-like 4 |
| chr12_+_53689309 | 0.07 |
ENST00000351500.3
ENST00000550846.1 ENST00000334478.4 ENST00000549759.1 |
PFDN5
|
prefoldin subunit 5 |
| chr1_+_43637996 | 0.07 |
ENST00000528956.1
ENST00000529956.1 |
WDR65
|
WD repeat domain 65 |
| chr19_+_7069690 | 0.07 |
ENST00000439035.2
|
ZNF557
|
zinc finger protein 557 |
| chr19_+_36236491 | 0.07 |
ENST00000591949.1
|
PSENEN
|
presenilin enhancer gamma secretase subunit |
| chr14_+_100531738 | 0.07 |
ENST00000555706.1
|
EVL
|
Enah/Vasp-like |
| chr11_+_9482551 | 0.06 |
ENST00000438144.2
ENST00000526657.1 ENST00000299606.2 ENST00000534265.1 ENST00000412390.2 |
ZNF143
|
zinc finger protein 143 |
| chr9_-_130213652 | 0.06 |
ENST00000536368.1
ENST00000361436.5 |
RPL12
|
ribosomal protein L12 |
| chr17_-_1012305 | 0.06 |
ENST00000291107.2
|
ABR
|
active BCR-related |
| chr19_+_19626531 | 0.06 |
ENST00000507754.4
|
NDUFA13
|
NADH dehydrogenase (ubiquinone) 1 alpha subcomplex, 13 |
| chr1_-_235324772 | 0.06 |
ENST00000408888.3
|
RBM34
|
RNA binding motif protein 34 |
| chr19_-_8579030 | 0.06 |
ENST00000255616.8
ENST00000393927.4 |
ZNF414
|
zinc finger protein 414 |
| chr19_+_58694396 | 0.06 |
ENST00000326804.4
ENST00000345813.3 ENST00000424679.2 |
ZNF274
|
zinc finger protein 274 |
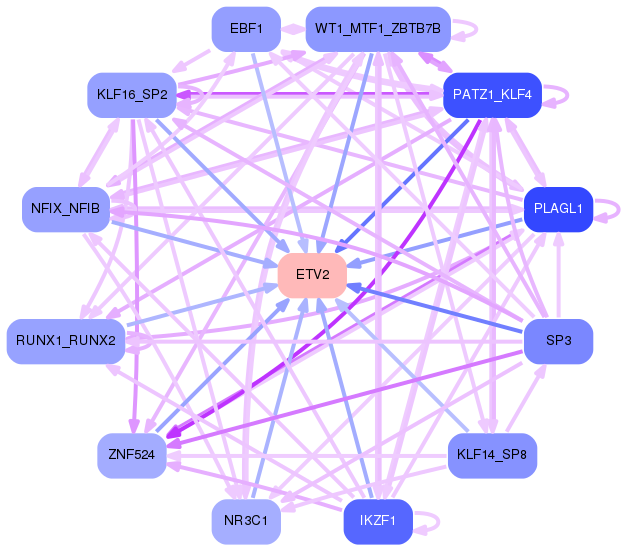
Network of associatons between targets according to the STRING database.

First level regulatory network of ETV2
Gene Ontology Analysis
Gene overrepresentation in biological_process category:
| Log-likelihood per target | Total log-likelihood | Term | Description |
|---|---|---|---|
| 0.1 | 0.1 | GO:0018307 | enzyme active site formation(GO:0018307) |
| 0.1 | 0.3 | GO:0034444 | regulation of plasma lipoprotein particle oxidation(GO:0034444) negative regulation of plasma lipoprotein particle oxidation(GO:0034445) |
| 0.1 | 0.4 | GO:0039689 | negative stranded viral RNA replication(GO:0039689) multi-organism biosynthetic process(GO:0044034) |
| 0.1 | 0.1 | GO:1900195 | positive regulation of oocyte maturation(GO:1900195) |
| 0.1 | 0.3 | GO:0072429 | response to intra-S DNA damage checkpoint signaling(GO:0072429) |
| 0.1 | 0.3 | GO:0061624 | fructose catabolic process(GO:0006001) fructose catabolic process to hydroxyacetone phosphate and glyceraldehyde-3-phosphate(GO:0061624) |
| 0.0 | 0.1 | GO:0030718 | germ-line stem cell population maintenance(GO:0030718) |
| 0.0 | 0.3 | GO:2000825 | positive regulation of androgen receptor activity(GO:2000825) |
| 0.0 | 0.2 | GO:0018364 | peptidyl-glutamine methylation(GO:0018364) |
| 0.0 | 0.2 | GO:1902626 | assembly of large subunit precursor of preribosome(GO:1902626) |
| 0.0 | 0.1 | GO:0086044 | pulmonary valve formation(GO:0003193) atrial ventricular junction remodeling(GO:0003294) foramen ovale closure(GO:0035922) atrial cardiac muscle cell to AV node cell communication by electrical coupling(GO:0086044) bundle of His cell to Purkinje myocyte communication by electrical coupling(GO:0086054) Purkinje myocyte to ventricular cardiac muscle cell communication by electrical coupling(GO:0086055) regulation of Purkinje myocyte action potential(GO:0098906) vasomotion(GO:1990029) |
| 0.0 | 0.1 | GO:0006624 | vacuolar protein processing(GO:0006624) |
| 0.0 | 0.1 | GO:0070105 | positive regulation of interleukin-6-mediated signaling pathway(GO:0070105) |
| 0.0 | 0.1 | GO:0002101 | tRNA wobble cytosine modification(GO:0002101) |
| 0.0 | 0.1 | GO:0001692 | histamine metabolic process(GO:0001692) |
| 0.0 | 0.1 | GO:0035752 | lysosomal lumen pH elevation(GO:0035752) |
| 0.0 | 0.1 | GO:2000298 | regulation of Rho-dependent protein serine/threonine kinase activity(GO:2000298) |
| 0.0 | 0.2 | GO:1904274 | tricellular tight junction assembly(GO:1904274) |
| 0.0 | 0.1 | GO:1900226 | negative regulation of NLRP3 inflammasome complex assembly(GO:1900226) |
| 0.0 | 0.2 | GO:0000023 | maltose metabolic process(GO:0000023) |
| 0.0 | 0.1 | GO:1901668 | regulation of superoxide dismutase activity(GO:1901668) |
| 0.0 | 0.1 | GO:0035552 | oxidative single-stranded DNA demethylation(GO:0035552) |
| 0.0 | 0.1 | GO:0071921 | establishment of sister chromatid cohesion(GO:0034085) cohesin loading(GO:0071921) regulation of cohesin loading(GO:0071922) |
| 0.0 | 0.1 | GO:0048619 | embryonic genitalia morphogenesis(GO:0030538) embryonic hindgut morphogenesis(GO:0048619) |
| 0.0 | 0.1 | GO:0021997 | neural plate axis specification(GO:0021997) |
| 0.0 | 0.1 | GO:2001162 | regulation of histone H3-K79 methylation(GO:2001160) positive regulation of histone H3-K79 methylation(GO:2001162) |
| 0.0 | 0.3 | GO:0032074 | negative regulation of nuclease activity(GO:0032074) |
| 0.0 | 0.1 | GO:0019417 | sulfur oxidation(GO:0019417) |
| 0.0 | 0.1 | GO:0097156 | fasciculation of motor neuron axon(GO:0097156) |
| 0.0 | 0.1 | GO:0010513 | positive regulation of phosphatidylinositol biosynthetic process(GO:0010513) |
| 0.0 | 0.1 | GO:0033319 | UDP-D-xylose metabolic process(GO:0033319) UDP-D-xylose biosynthetic process(GO:0033320) |
| 0.0 | 0.1 | GO:0060265 | positive regulation of respiratory burst involved in inflammatory response(GO:0060265) |
| 0.0 | 0.0 | GO:0050685 | positive regulation of mRNA processing(GO:0050685) |
| 0.0 | 0.1 | GO:0006481 | C-terminal protein methylation(GO:0006481) |
| 0.0 | 0.1 | GO:0036071 | N-glycan fucosylation(GO:0036071) |
| 0.0 | 0.1 | GO:0000821 | regulation of arginine metabolic process(GO:0000821) basic amino acid transmembrane transport(GO:1990822) |
| 0.0 | 0.0 | GO:0046833 | positive regulation of nucleobase-containing compound transport(GO:0032241) positive regulation of RNA export from nucleus(GO:0046833) |
| 0.0 | 0.0 | GO:0045226 | extracellular polysaccharide biosynthetic process(GO:0045226) extracellular polysaccharide metabolic process(GO:0046379) |
| 0.0 | 0.1 | GO:2000619 | negative regulation of histone H3-K9 dimethylation(GO:1900110) regulation of TORC2 signaling(GO:1903939) negative regulation of histone H4-K16 acetylation(GO:2000619) |
| 0.0 | 0.0 | GO:0019085 | early viral transcription(GO:0019085) |
| 0.0 | 0.1 | GO:0010836 | negative regulation of protein ADP-ribosylation(GO:0010836) |
| 0.0 | 0.2 | GO:0045023 | G0 to G1 transition(GO:0045023) |
| 0.0 | 0.1 | GO:0070940 | dephosphorylation of RNA polymerase II C-terminal domain(GO:0070940) |
| 0.0 | 0.4 | GO:0032802 | low-density lipoprotein particle receptor catabolic process(GO:0032802) |
| 0.0 | 0.1 | GO:0007228 | positive regulation of hh target transcription factor activity(GO:0007228) |
| 0.0 | 0.1 | GO:0021539 | subthalamus development(GO:0021539) |
| 0.0 | 0.0 | GO:0034402 | recruitment of 3'-end processing factors to RNA polymerase II holoenzyme complex(GO:0034402) |
| 0.0 | 0.1 | GO:0000727 | double-strand break repair via break-induced replication(GO:0000727) |
| 0.0 | 0.1 | GO:1904046 | negative regulation of vascular endothelial growth factor production(GO:1904046) |
| 0.0 | 0.0 | GO:0043309 | regulation of eosinophil degranulation(GO:0043309) positive regulation of eosinophil degranulation(GO:0043311) regulation of eosinophil activation(GO:1902566) positive regulation of eosinophil activation(GO:1902568) |
| 0.0 | 0.1 | GO:0021993 | initiation of neural tube closure(GO:0021993) |
| 0.0 | 0.0 | GO:0042713 | sperm ejaculation(GO:0042713) |
| 0.0 | 0.0 | GO:0043132 | NAD transport(GO:0043132) |
| 0.0 | 0.1 | GO:0036118 | hyaluranon cable assembly(GO:0036118) regulation of hyaluranon cable assembly(GO:1900104) positive regulation of hyaluranon cable assembly(GO:1900106) |
| 0.0 | 0.1 | GO:0032484 | Ral protein signal transduction(GO:0032484) regulation of Ral protein signal transduction(GO:0032485) |
| 0.0 | 0.1 | GO:0017196 | N-terminal peptidyl-methionine acetylation(GO:0017196) |
| 0.0 | 0.1 | GO:0098787 | mRNA cleavage involved in mRNA processing(GO:0098787) pre-mRNA cleavage required for polyadenylation(GO:0098789) |
| 0.0 | 0.1 | GO:2000158 | positive regulation of ubiquitin-specific protease activity(GO:2000158) |
| 0.0 | 0.1 | GO:1902255 | positive regulation of intrinsic apoptotic signaling pathway by p53 class mediator(GO:1902255) |
| 0.0 | 0.1 | GO:0060161 | positive regulation of dopamine receptor signaling pathway(GO:0060161) |
| 0.0 | 0.1 | GO:0061669 | spontaneous neurotransmitter secretion(GO:0061669) spontaneous synaptic transmission(GO:0098814) |
| 0.0 | 0.2 | GO:1901096 | regulation of autophagosome maturation(GO:1901096) |
| 0.0 | 0.1 | GO:1990481 | mRNA pseudouridine synthesis(GO:1990481) |
| 0.0 | 0.1 | GO:0035469 | determination of pancreatic left/right asymmetry(GO:0035469) |
| 0.0 | 0.1 | GO:0061484 | hematopoietic stem cell homeostasis(GO:0061484) |
| 0.0 | 0.0 | GO:0021797 | forebrain anterior/posterior pattern specification(GO:0021797) |
| 0.0 | 0.0 | GO:0060335 | positive regulation of response to interferon-gamma(GO:0060332) positive regulation of interferon-gamma-mediated signaling pathway(GO:0060335) |
| 0.0 | 0.1 | GO:0006436 | tryptophanyl-tRNA aminoacylation(GO:0006436) |
| 0.0 | 0.1 | GO:0097039 | protein linear polyubiquitination(GO:0097039) |
| 0.0 | 0.1 | GO:0019276 | UDP-N-acetylgalactosamine metabolic process(GO:0019276) |
| 0.0 | 0.1 | GO:0000447 | endonucleolytic cleavage in ITS1 to separate SSU-rRNA from 5.8S rRNA and LSU-rRNA from tricistronic rRNA transcript (SSU-rRNA, 5.8S rRNA, LSU-rRNA)(GO:0000447) |
| 0.0 | 0.1 | GO:1903336 | negative regulation of vacuolar transport(GO:1903336) |
Gene overrepresentation in cellular_component category:
| Log-likelihood per target | Total log-likelihood | Term | Description |
|---|---|---|---|
| 0.1 | 0.3 | GO:0034365 | discoidal high-density lipoprotein particle(GO:0034365) |
| 0.0 | 0.1 | GO:0032783 | ELL-EAF complex(GO:0032783) |
| 0.0 | 0.3 | GO:0010370 | perinucleolar chromocenter(GO:0010370) |
| 0.0 | 0.3 | GO:0048476 | Holliday junction resolvase complex(GO:0048476) |
| 0.0 | 0.2 | GO:0071595 | Nem1-Spo7 phosphatase complex(GO:0071595) |
| 0.0 | 0.4 | GO:0030130 | clathrin coat of trans-Golgi network vesicle(GO:0030130) |
| 0.0 | 0.1 | GO:0036117 | hyaluranon cable(GO:0036117) |
| 0.0 | 0.1 | GO:0071817 | MMXD complex(GO:0071817) |
| 0.0 | 0.1 | GO:1990130 | Iml1 complex(GO:1990130) |
| 0.0 | 0.1 | GO:0016222 | procollagen-proline 4-dioxygenase complex(GO:0016222) |
| 0.0 | 0.4 | GO:0034045 | pre-autophagosomal structure membrane(GO:0034045) |
| 0.0 | 0.1 | GO:0042585 | germinal vesicle(GO:0042585) |
| 0.0 | 0.1 | GO:0000811 | GINS complex(GO:0000811) |
| 0.0 | 0.2 | GO:0070765 | gamma-secretase complex(GO:0070765) |
| 0.0 | 0.1 | GO:0071797 | LUBAC complex(GO:0071797) |
| 0.0 | 0.1 | GO:1902560 | GMP reductase complex(GO:1902560) |
| 0.0 | 0.1 | GO:0005854 | nascent polypeptide-associated complex(GO:0005854) |
| 0.0 | 0.0 | GO:0031261 | nuclear pre-replicative complex(GO:0005656) DNA replication preinitiation complex(GO:0031261) pre-replicative complex(GO:0036387) |
| 0.0 | 0.0 | GO:0097543 | ciliary inversin compartment(GO:0097543) |
| 0.0 | 0.2 | GO:0061689 | tricellular tight junction(GO:0061689) |
| 0.0 | 0.1 | GO:0031838 | haptoglobin-hemoglobin complex(GO:0031838) |
| 0.0 | 0.1 | GO:0000275 | mitochondrial proton-transporting ATP synthase complex, catalytic core F(1)(GO:0000275) |
| 0.0 | 0.1 | GO:0036156 | inner dynein arm(GO:0036156) |
| 0.0 | 0.1 | GO:0070545 | PeBoW complex(GO:0070545) |
| 0.0 | 0.1 | GO:0071541 | eukaryotic translation initiation factor 3 complex, eIF3m(GO:0071541) |
| 0.0 | 1.3 | GO:0022625 | cytosolic large ribosomal subunit(GO:0022625) |
Gene overrepresentation in molecular_function category:
| Log-likelihood per target | Total log-likelihood | Term | Description |
|---|---|---|---|
| 0.0 | 0.1 | GO:0035248 | alpha-1,4-N-acetylgalactosaminyltransferase activity(GO:0035248) |
| 0.0 | 0.1 | GO:0061628 | H3K27me3 modified histone binding(GO:0061628) |
| 0.0 | 0.1 | GO:0086078 | gap junction channel activity involved in atrial cardiac muscle cell-AV node cell electrical coupling(GO:0086076) gap junction channel activity involved in bundle of His cell-Purkinje myocyte electrical coupling(GO:0086078) gap junction channel activity involved in Purkinje myocyte-ventricular cardiac muscle cell electrical coupling(GO:0086079) |
| 0.0 | 0.1 | GO:0034584 | piRNA binding(GO:0034584) |
| 0.0 | 0.4 | GO:0032050 | clathrin heavy chain binding(GO:0032050) |
| 0.0 | 0.2 | GO:0032450 | alpha-1,4-glucosidase activity(GO:0004558) maltose alpha-glucosidase activity(GO:0032450) |
| 0.0 | 0.1 | GO:0032089 | NACHT domain binding(GO:0032089) |
| 0.0 | 0.1 | GO:0070180 | large ribosomal subunit rRNA binding(GO:0070180) |
| 0.0 | 0.1 | GO:0045322 | unmethylated CpG binding(GO:0045322) |
| 0.0 | 0.1 | GO:0015018 | galactosylgalactosylxylosylprotein 3-beta-glucuronosyltransferase activity(GO:0015018) |
| 0.0 | 0.1 | GO:0004045 | aminoacyl-tRNA hydrolase activity(GO:0004045) |
| 0.0 | 0.2 | GO:0008821 | crossover junction endodeoxyribonuclease activity(GO:0008821) |
| 0.0 | 0.2 | GO:0016427 | tRNA (cytosine) methyltransferase activity(GO:0016427) |
| 0.0 | 0.1 | GO:0035514 | DNA demethylase activity(GO:0035514) |
| 0.0 | 0.1 | GO:0050501 | hyaluronan synthase activity(GO:0050501) |
| 0.0 | 0.1 | GO:0048040 | UDP-glucuronate decarboxylase activity(GO:0048040) |
| 0.0 | 0.1 | GO:0000702 | oxidized base lesion DNA N-glycosylase activity(GO:0000702) |
| 0.0 | 0.1 | GO:0008665 | 2'-phosphotransferase activity(GO:0008665) |
| 0.0 | 0.1 | GO:0003880 | protein C-terminal carboxyl O-methyltransferase activity(GO:0003880) |
| 0.0 | 0.1 | GO:0008424 | glycoprotein 6-alpha-L-fucosyltransferase activity(GO:0008424) alpha-(1->6)-fucosyltransferase activity(GO:0046921) |
| 0.0 | 0.1 | GO:0004792 | thiosulfate sulfurtransferase activity(GO:0004792) |
| 0.0 | 0.1 | GO:0031811 | G-protein coupled nucleotide receptor binding(GO:0031811) P2Y1 nucleotide receptor binding(GO:0031812) |
| 0.0 | 0.1 | GO:0008889 | glycerophosphodiester phosphodiesterase activity(GO:0008889) |
| 0.0 | 0.0 | GO:0004913 | interleukin-4 receptor activity(GO:0004913) interleukin-7 receptor activity(GO:0004917) |
| 0.0 | 0.1 | GO:0009019 | tRNA (guanine-N1-)-methyltransferase activity(GO:0009019) |
| 0.0 | 0.3 | GO:0003906 | DNA-(apurinic or apyrimidinic site) lyase activity(GO:0003906) |
| 0.0 | 0.1 | GO:0016657 | GMP reductase activity(GO:0003920) oxidoreductase activity, acting on NAD(P)H, nitrogenous group as acceptor(GO:0016657) |
| 0.0 | 0.1 | GO:0047860 | diiodophenylpyruvate reductase activity(GO:0047860) |
| 0.0 | 0.1 | GO:0030492 | hemoglobin binding(GO:0030492) |
| 0.0 | 0.0 | GO:0098770 | FBXO family protein binding(GO:0098770) |
| 0.0 | 0.1 | GO:0035800 | deubiquitinase activator activity(GO:0035800) |
| 0.0 | 0.0 | GO:0008413 | 8-oxo-7,8-dihydroguanosine triphosphate pyrophosphatase activity(GO:0008413) 8-oxo-7,8-dihydrodeoxyguanosine triphosphate pyrophosphatase activity(GO:0035539) |
| 0.0 | 0.0 | GO:0052856 | NADHX epimerase activity(GO:0052856) NADPHX epimerase activity(GO:0052857) |
| 0.0 | 0.0 | GO:0003923 | GPI-anchor transamidase activity(GO:0003923) |
| 0.0 | 0.0 | GO:0034353 | RNA pyrophosphohydrolase activity(GO:0034353) |
| 0.0 | 0.1 | GO:0004830 | tryptophan-tRNA ligase activity(GO:0004830) |
| 0.0 | 0.0 | GO:0002113 | interleukin-33 binding(GO:0002113) |
Gene overrepresentation in C2:CP category:
| Log-likelihood per target | Total log-likelihood | Term | Description |
|---|---|---|---|
| 0.0 | 0.4 | PID ARF 3PATHWAY | Arf1 pathway |
Gene overrepresentation in C2:CP:REACTOME category:
| Log-likelihood per target | Total log-likelihood | Term | Description |
|---|---|---|---|
| 0.0 | 0.4 | REACTOME RETROGRADE NEUROTROPHIN SIGNALLING | Genes involved in Retrograde neurotrophin signalling |
| 0.0 | 0.2 | REACTOME REGULATED PROTEOLYSIS OF P75NTR | Genes involved in Regulated proteolysis of p75NTR |
| 0.0 | 0.1 | REACTOME ARMS MEDIATED ACTIVATION | Genes involved in ARMS-mediated activation |
| 0.0 | 1.6 | REACTOME PEPTIDE CHAIN ELONGATION | Genes involved in Peptide chain elongation |