Project
NHBE cells infected with SARS-CoV-2 Analysis Results (GEO series: GSE147507)
Navigation
Downloads
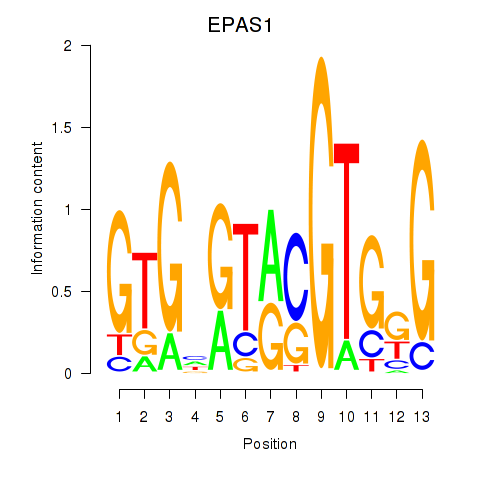
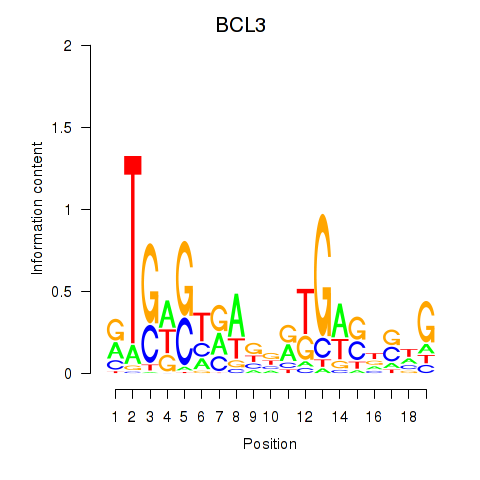
Results for EPAS1_BCL3
Z-value: 1.23
Motif logo
Transcription factors associated with EPAS1_BCL3
| Gene Symbol | Gene ID | Gene Info |
|---|---|---|
|
EPAS1
|
ENSG00000116016.9 | endothelial PAS domain protein 1 |
|
BCL3
|
ENSG00000069399.8 | BCL3 transcription coactivator |
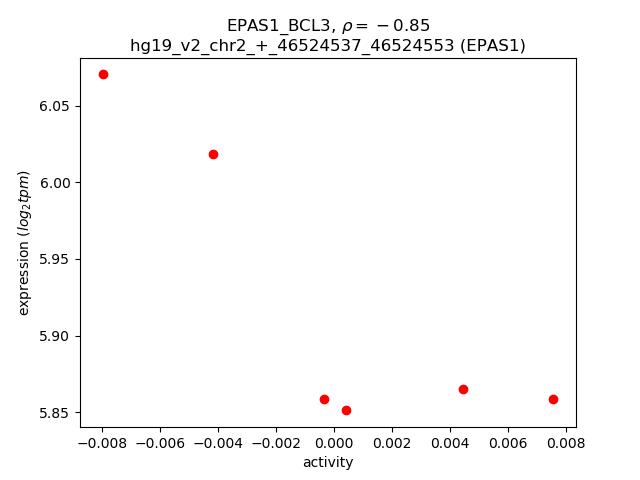
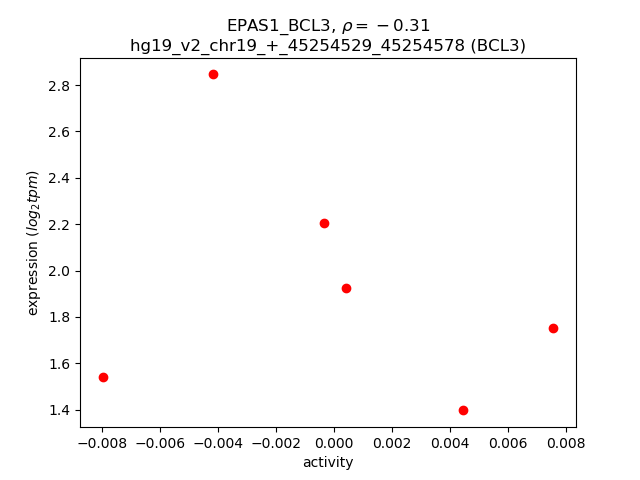
Activity-expression correlation:
| Gene | Promoter | Pearson corr. coef. | P-value | Plot |
|---|---|---|---|---|
| EPAS1 | hg19_v2_chr2_+_46524537_46524553 | -0.85 | 3.3e-02 | Click! |
| BCL3 | hg19_v2_chr19_+_45254529_45254578 | -0.31 | 5.6e-01 | Click! |
Activity profile of EPAS1_BCL3 motif
Sorted Z-values of EPAS1_BCL3 motif
| Promoter | Log-likelihood | Transcript | Gene | Gene Info |
|---|---|---|---|---|
| chr22_-_46283597 | 1.28 |
ENST00000451118.1
|
WI2-85898F10.1
|
WI2-85898F10.1 |
| chr11_+_111808119 | 0.95 |
ENST00000531396.1
|
DIXDC1
|
DIX domain containing 1 |
| chr11_-_75062730 | 0.81 |
ENST00000420843.2
ENST00000360025.3 |
ARRB1
|
arrestin, beta 1 |
| chr5_-_119669160 | 0.80 |
ENST00000514240.1
|
CTC-552D5.1
|
CTC-552D5.1 |
| chr1_-_152779104 | 0.77 |
ENST00000606576.1
ENST00000368768.1 |
LCE1C
|
late cornified envelope 1C |
| chr14_-_81902516 | 0.65 |
ENST00000554710.1
|
STON2
|
stonin 2 |
| chr19_-_35626104 | 0.62 |
ENST00000310123.3
ENST00000392225.3 |
LGI4
|
leucine-rich repeat LGI family, member 4 |
| chr9_+_46390277 | 0.61 |
ENST00000426006.1
|
FAM27D1
|
family with sequence similarity 27, member D1 |
| chr11_+_73675873 | 0.60 |
ENST00000537753.1
ENST00000542350.1 |
DNAJB13
|
DnaJ (Hsp40) homolog, subfamily B, member 13 |
| chrX_+_1387693 | 0.59 |
ENST00000381529.3
ENST00000432318.2 ENST00000361536.3 ENST00000501036.2 ENST00000381524.3 ENST00000412290.1 |
CSF2RA
|
colony stimulating factor 2 receptor, alpha, low-affinity (granulocyte-macrophage) |
| chr14_+_91709103 | 0.59 |
ENST00000553725.1
|
CTD-2547L24.3
|
HCG1816139; Uncharacterized protein |
| chr16_-_11367452 | 0.57 |
ENST00000327157.2
|
PRM3
|
protamine 3 |
| chr14_-_71107921 | 0.54 |
ENST00000553982.1
ENST00000500016.1 |
CTD-2540L5.5
CTD-2540L5.6
|
CTD-2540L5.5 CTD-2540L5.6 |
| chr16_+_82068873 | 0.49 |
ENST00000566213.1
|
HSD17B2
|
hydroxysteroid (17-beta) dehydrogenase 2 |
| chr4_+_105828492 | 0.47 |
ENST00000506148.1
|
RP11-556I14.1
|
RP11-556I14.1 |
| chrX_-_20134990 | 0.47 |
ENST00000379651.3
ENST00000443379.3 ENST00000379643.5 |
MAP7D2
|
MAP7 domain containing 2 |
| chr19_-_47975106 | 0.45 |
ENST00000539381.1
ENST00000594353.1 ENST00000542837.1 |
SLC8A2
|
solute carrier family 8 (sodium/calcium exchanger), member 2 |
| chr4_+_105828537 | 0.43 |
ENST00000515649.1
|
RP11-556I14.1
|
RP11-556I14.1 |
| chr1_-_240775447 | 0.40 |
ENST00000318160.4
|
GREM2
|
gremlin 2, DAN family BMP antagonist |
| chr22_-_29075853 | 0.40 |
ENST00000397906.2
|
TTC28
|
tetratricopeptide repeat domain 28 |
| chr1_-_23751189 | 0.39 |
ENST00000374601.3
ENST00000450454.2 |
TCEA3
|
transcription elongation factor A (SII), 3 |
| chr19_-_47975417 | 0.39 |
ENST00000236877.6
|
SLC8A2
|
solute carrier family 8 (sodium/calcium exchanger), member 2 |
| chr19_+_18530146 | 0.39 |
ENST00000348495.6
ENST00000270061.7 |
SSBP4
|
single stranded DNA binding protein 4 |
| chr6_-_4347271 | 0.39 |
ENST00000437430.2
|
RP3-527G5.1
|
RP3-527G5.1 |
| chr3_+_187957646 | 0.38 |
ENST00000457242.1
|
LPP
|
LIM domain containing preferred translocation partner in lipoma |
| chrX_-_111923145 | 0.38 |
ENST00000371968.3
ENST00000536453.1 |
LHFPL1
|
lipoma HMGIC fusion partner-like 1 |
| chr19_-_44405623 | 0.38 |
ENST00000591815.1
|
RP11-15A1.3
|
RP11-15A1.3 |
| chr1_+_174769006 | 0.38 |
ENST00000489615.1
|
RABGAP1L
|
RAB GTPase activating protein 1-like |
| chr5_-_142065612 | 0.36 |
ENST00000360966.5
ENST00000411960.1 |
FGF1
|
fibroblast growth factor 1 (acidic) |
| chr19_+_40195101 | 0.35 |
ENST00000360675.3
ENST00000601802.1 |
LGALS14
|
lectin, galactoside-binding, soluble, 14 |
| chr1_-_150208291 | 0.33 |
ENST00000533654.1
|
ANP32E
|
acidic (leucine-rich) nuclear phosphoprotein 32 family, member E |
| chr12_+_121088291 | 0.33 |
ENST00000351200.2
|
CABP1
|
calcium binding protein 1 |
| chr1_+_81106951 | 0.32 |
ENST00000443565.1
|
RP5-887A10.1
|
RP5-887A10.1 |
| chr9_+_2017063 | 0.32 |
ENST00000457226.1
|
SMARCA2
|
SWI/SNF related, matrix associated, actin dependent regulator of chromatin, subfamily a, member 2 |
| chr20_+_9049742 | 0.32 |
ENST00000437503.1
|
PLCB4
|
phospholipase C, beta 4 |
| chr17_+_38119216 | 0.32 |
ENST00000301659.4
|
GSDMA
|
gasdermin A |
| chr19_+_14491948 | 0.31 |
ENST00000358600.3
|
CD97
|
CD97 molecule |
| chr7_-_117512264 | 0.30 |
ENST00000454375.1
|
CTTNBP2
|
cortactin binding protein 2 |
| chr6_+_31620191 | 0.30 |
ENST00000375918.2
ENST00000375920.4 |
APOM
|
apolipoprotein M |
| chr21_+_35553045 | 0.30 |
ENST00000416145.1
ENST00000430922.1 ENST00000419881.2 |
LINC00310
|
long intergenic non-protein coding RNA 310 |
| chr1_+_110453514 | 0.28 |
ENST00000369802.3
ENST00000420111.2 |
CSF1
|
colony stimulating factor 1 (macrophage) |
| chrX_-_30871004 | 0.27 |
ENST00000378928.1
|
TAB3
|
TGF-beta activated kinase 1/MAP3K7 binding protein 3 |
| chr1_+_110198714 | 0.27 |
ENST00000336075.5
ENST00000326729.5 |
GSTM4
|
glutathione S-transferase mu 4 |
| chr2_+_74229812 | 0.27 |
ENST00000305799.7
|
TET3
|
tet methylcytosine dioxygenase 3 |
| chr8_+_41386725 | 0.27 |
ENST00000276533.3
ENST00000520710.1 ENST00000518671.1 |
GINS4
|
GINS complex subunit 4 (Sld5 homolog) |
| chr6_-_40555176 | 0.27 |
ENST00000338305.6
|
LRFN2
|
leucine rich repeat and fibronectin type III domain containing 2 |
| chr11_-_75062829 | 0.26 |
ENST00000393505.4
|
ARRB1
|
arrestin, beta 1 |
| chr2_+_120436760 | 0.26 |
ENST00000445518.1
ENST00000409951.1 |
TMEM177
|
transmembrane protein 177 |
| chr11_+_128761220 | 0.26 |
ENST00000529694.1
|
KCNJ5
|
potassium inwardly-rectifying channel, subfamily J, member 5 |
| chr4_-_168155577 | 0.26 |
ENST00000541354.1
ENST00000509854.1 ENST00000512681.1 ENST00000421836.2 ENST00000510741.1 ENST00000510403.1 |
SPOCK3
|
sparc/osteonectin, cwcv and kazal-like domains proteoglycan (testican) 3 |
| chr11_+_94371204 | 0.26 |
ENST00000438416.2
|
RP11-867G2.5
|
RP11-867G2.5 |
| chr16_-_70719925 | 0.25 |
ENST00000338779.6
|
MTSS1L
|
metastasis suppressor 1-like |
| chr18_+_1099004 | 0.25 |
ENST00000581556.1
|
RP11-78F17.1
|
RP11-78F17.1 |
| chr2_+_74881398 | 0.25 |
ENST00000339773.5
ENST00000434486.1 |
SEMA4F
|
sema domain, immunoglobulin domain (Ig), transmembrane domain (TM) and short cytoplasmic domain, (semaphorin) 4F |
| chr16_-_79804394 | 0.25 |
ENST00000567993.1
|
RP11-345M22.2
|
RP11-345M22.2 |
| chr1_-_45308616 | 0.24 |
ENST00000447098.2
ENST00000372192.3 |
PTCH2
|
patched 2 |
| chr7_+_121513374 | 0.24 |
ENST00000449182.1
|
PTPRZ1
|
protein tyrosine phosphatase, receptor-type, Z polypeptide 1 |
| chr4_+_86749045 | 0.24 |
ENST00000514229.1
|
ARHGAP24
|
Rho GTPase activating protein 24 |
| chr9_+_34652164 | 0.24 |
ENST00000441545.2
ENST00000553620.1 |
IL11RA
|
interleukin 11 receptor, alpha |
| chr4_-_177116772 | 0.23 |
ENST00000280191.2
|
SPATA4
|
spermatogenesis associated 4 |
| chr19_-_52227221 | 0.23 |
ENST00000222115.1
ENST00000540069.2 |
HAS1
|
hyaluronan synthase 1 |
| chr4_-_146859623 | 0.23 |
ENST00000379448.4
ENST00000513320.1 |
ZNF827
|
zinc finger protein 827 |
| chr9_+_125315391 | 0.23 |
ENST00000373688.2
|
OR1N2
|
olfactory receptor, family 1, subfamily N, member 2 |
| chr12_+_56546363 | 0.23 |
ENST00000551834.1
ENST00000552568.1 |
MYL6B
|
myosin, light chain 6B, alkali, smooth muscle and non-muscle |
| chr13_-_103426081 | 0.23 |
ENST00000376022.1
ENST00000376021.4 |
TEX30
|
testis expressed 30 |
| chr3_-_133748758 | 0.23 |
ENST00000493729.1
|
SLCO2A1
|
solute carrier organic anion transporter family, member 2A1 |
| chr7_-_76039000 | 0.23 |
ENST00000275560.3
|
SRCRB4D
|
scavenger receptor cysteine rich domain containing, group B (4 domains) |
| chr5_-_169407744 | 0.23 |
ENST00000377365.3
|
FAM196B
|
family with sequence similarity 196, member B |
| chr17_+_79369249 | 0.22 |
ENST00000574717.2
|
RP11-1055B8.6
|
Uncharacterized protein |
| chr19_-_16284286 | 0.22 |
ENST00000379859.3
ENST00000269878.4 |
CIB3
|
calcium and integrin binding family member 3 |
| chr19_+_35741466 | 0.22 |
ENST00000599658.1
|
LSR
|
lipolysis stimulated lipoprotein receptor |
| chr2_+_33701684 | 0.22 |
ENST00000442390.1
|
RASGRP3
|
RAS guanyl releasing protein 3 (calcium and DAG-regulated) |
| chr20_-_61733657 | 0.22 |
ENST00000608031.1
ENST00000447910.2 |
HAR1B
|
highly accelerated region 1B (non-protein coding) |
| chr4_-_113627966 | 0.22 |
ENST00000505632.1
|
RP11-148B6.2
|
RP11-148B6.2 |
| chr10_-_47222824 | 0.21 |
ENST00000355232.3
|
AGAP10
|
ArfGAP with GTPase domain, ankyrin repeat and PH domain 10 |
| chr1_+_247712383 | 0.21 |
ENST00000366488.4
ENST00000536561.1 |
GCSAML
|
germinal center-associated, signaling and motility-like |
| chr2_+_33701707 | 0.21 |
ENST00000425210.1
ENST00000444784.1 ENST00000423159.1 |
RASGRP3
|
RAS guanyl releasing protein 3 (calcium and DAG-regulated) |
| chr13_+_51913819 | 0.21 |
ENST00000419898.2
|
SERPINE3
|
serpin peptidase inhibitor, clade E (nexin, plasminogen activator inhibitor type 1), member 3 |
| chr17_-_75878647 | 0.21 |
ENST00000374983.2
|
FLJ45079
|
FLJ45079 |
| chr15_-_79576156 | 0.21 |
ENST00000560452.1
ENST00000560872.1 ENST00000560732.1 ENST00000559979.1 ENST00000560533.1 ENST00000559225.1 |
RP11-17L5.4
|
RP11-17L5.4 |
| chr19_-_17007026 | 0.21 |
ENST00000598792.1
|
CPAMD8
|
C3 and PZP-like, alpha-2-macroglobulin domain containing 8 |
| chr18_-_74534232 | 0.21 |
ENST00000585258.1
|
RP11-162A12.2
|
Uncharacterized protein |
| chr2_+_120436733 | 0.21 |
ENST00000401466.1
ENST00000424086.1 ENST00000272521.6 |
TMEM177
|
transmembrane protein 177 |
| chr1_+_209757051 | 0.20 |
ENST00000009105.1
ENST00000423146.1 ENST00000361322.2 |
CAMK1G
|
calcium/calmodulin-dependent protein kinase IG |
| chrX_-_15288154 | 0.20 |
ENST00000380483.3
ENST00000380485.3 ENST00000380488.4 |
ASB9
|
ankyrin repeat and SOCS box containing 9 |
| chr3_+_185080908 | 0.20 |
ENST00000265026.3
|
MAP3K13
|
mitogen-activated protein kinase kinase kinase 13 |
| chr4_+_331578 | 0.20 |
ENST00000512994.1
|
ZNF141
|
zinc finger protein 141 |
| chr1_+_110198689 | 0.20 |
ENST00000369836.4
|
GSTM4
|
glutathione S-transferase mu 4 |
| chr13_+_31309645 | 0.20 |
ENST00000380490.3
|
ALOX5AP
|
arachidonate 5-lipoxygenase-activating protein |
| chr1_-_31230650 | 0.19 |
ENST00000294507.3
|
LAPTM5
|
lysosomal protein transmembrane 5 |
| chr11_-_74022658 | 0.19 |
ENST00000427714.2
ENST00000331597.4 |
P4HA3
|
prolyl 4-hydroxylase, alpha polypeptide III |
| chr20_+_34680698 | 0.19 |
ENST00000447825.1
|
EPB41L1
|
erythrocyte membrane protein band 4.1-like 1 |
| chr3_-_184870751 | 0.19 |
ENST00000335012.2
|
C3orf70
|
chromosome 3 open reading frame 70 |
| chr21_+_37507210 | 0.19 |
ENST00000290354.5
|
CBR3
|
carbonyl reductase 3 |
| chr3_-_9291063 | 0.19 |
ENST00000383836.3
|
SRGAP3
|
SLIT-ROBO Rho GTPase activating protein 3 |
| chr10_-_93669233 | 0.18 |
ENST00000311575.5
|
FGFBP3
|
fibroblast growth factor binding protein 3 |
| chr11_-_89224638 | 0.18 |
ENST00000535633.1
ENST00000263317.4 |
NOX4
|
NADPH oxidase 4 |
| chr2_+_102618428 | 0.18 |
ENST00000457817.1
|
IL1R2
|
interleukin 1 receptor, type II |
| chr3_-_49459878 | 0.18 |
ENST00000546031.1
ENST00000458307.2 ENST00000430521.1 |
AMT
|
aminomethyltransferase |
| chr2_+_105760549 | 0.18 |
ENST00000436841.1
ENST00000452037.1 ENST00000438148.1 |
AC104655.3
|
AC104655.3 |
| chr19_+_55795493 | 0.18 |
ENST00000309383.1
|
BRSK1
|
BR serine/threonine kinase 1 |
| chr4_-_48082192 | 0.18 |
ENST00000507351.1
|
TXK
|
TXK tyrosine kinase |
| chrX_-_133792480 | 0.18 |
ENST00000359237.4
|
PLAC1
|
placenta-specific 1 |
| chrX_+_3189861 | 0.18 |
ENST00000457435.1
ENST00000420429.2 |
CXorf28
|
chromosome X open reading frame 28 |
| chr11_+_31833939 | 0.18 |
ENST00000530348.1
|
RCN1
|
reticulocalbin 1, EF-hand calcium binding domain |
| chr17_-_76732928 | 0.18 |
ENST00000589768.1
|
CYTH1
|
cytohesin 1 |
| chr2_+_74881432 | 0.18 |
ENST00000453930.1
|
SEMA4F
|
sema domain, immunoglobulin domain (Ig), transmembrane domain (TM) and short cytoplasmic domain, (semaphorin) 4F |
| chr14_-_85996332 | 0.17 |
ENST00000380722.1
|
RP11-497E19.1
|
RP11-497E19.1 |
| chr18_+_61254221 | 0.17 |
ENST00000431153.1
|
SERPINB13
|
serpin peptidase inhibitor, clade B (ovalbumin), member 13 |
| chr2_+_102686820 | 0.17 |
ENST00000409929.1
ENST00000424272.1 |
IL1R1
|
interleukin 1 receptor, type I |
| chr17_-_74533734 | 0.17 |
ENST00000589342.1
|
CYGB
|
cytoglobin |
| chr1_-_221915418 | 0.17 |
ENST00000323825.3
ENST00000366899.3 |
DUSP10
|
dual specificity phosphatase 10 |
| chr3_+_112930946 | 0.17 |
ENST00000462425.1
|
BOC
|
BOC cell adhesion associated, oncogene regulated |
| chr2_-_238499131 | 0.17 |
ENST00000538644.1
|
RAB17
|
RAB17, member RAS oncogene family |
| chr10_-_30348439 | 0.17 |
ENST00000375377.1
|
KIAA1462
|
KIAA1462 |
| chr19_-_16582815 | 0.17 |
ENST00000455140.2
ENST00000248070.6 ENST00000594975.1 |
EPS15L1
|
epidermal growth factor receptor pathway substrate 15-like 1 |
| chr1_+_61548374 | 0.17 |
ENST00000485903.2
ENST00000371185.2 ENST00000371184.2 |
NFIA
|
nuclear factor I/A |
| chr17_-_17109579 | 0.17 |
ENST00000321560.3
|
PLD6
|
phospholipase D family, member 6 |
| chr19_+_45445524 | 0.17 |
ENST00000591600.1
|
APOC4
|
apolipoprotein C-IV |
| chr17_+_73750699 | 0.17 |
ENST00000584939.1
|
ITGB4
|
integrin, beta 4 |
| chr8_-_41508855 | 0.17 |
ENST00000518699.2
|
NKX6-3
|
NK6 homeobox 3 |
| chr18_+_6729725 | 0.17 |
ENST00000400091.2
ENST00000583410.1 ENST00000584387.1 |
ARHGAP28
|
Rho GTPase activating protein 28 |
| chr17_+_1665306 | 0.16 |
ENST00000571360.1
|
SERPINF1
|
serpin peptidase inhibitor, clade F (alpha-2 antiplasmin, pigment epithelium derived factor), member 1 |
| chr9_-_4299874 | 0.16 |
ENST00000381971.3
ENST00000477901.1 |
GLIS3
|
GLIS family zinc finger 3 |
| chr19_+_52848659 | 0.16 |
ENST00000327920.8
|
ZNF610
|
zinc finger protein 610 |
| chr19_-_56988677 | 0.16 |
ENST00000504904.3
ENST00000292069.6 |
ZNF667
|
zinc finger protein 667 |
| chr22_-_37505449 | 0.16 |
ENST00000406725.1
|
TMPRSS6
|
transmembrane protease, serine 6 |
| chr12_-_57504975 | 0.16 |
ENST00000553397.1
ENST00000556259.1 |
STAT6
|
signal transducer and activator of transcription 6, interleukin-4 induced |
| chr3_-_193272741 | 0.16 |
ENST00000392443.3
|
ATP13A4
|
ATPase type 13A4 |
| chr17_-_30185971 | 0.16 |
ENST00000378634.2
|
COPRS
|
coordinator of PRMT5, differentiation stimulator |
| chr1_+_32712815 | 0.16 |
ENST00000373582.3
|
FAM167B
|
family with sequence similarity 167, member B |
| chr22_-_37880543 | 0.16 |
ENST00000442496.1
|
MFNG
|
MFNG O-fucosylpeptide 3-beta-N-acetylglucosaminyltransferase |
| chr22_+_32439019 | 0.16 |
ENST00000266088.4
|
SLC5A1
|
solute carrier family 5 (sodium/glucose cotransporter), member 1 |
| chr22_+_24990746 | 0.16 |
ENST00000456869.1
ENST00000411974.1 |
GGT1
|
gamma-glutamyltransferase 1 |
| chr3_-_195310802 | 0.16 |
ENST00000421243.1
ENST00000453131.1 |
APOD
|
apolipoprotein D |
| chr3_-_45017609 | 0.16 |
ENST00000342790.4
ENST00000424952.2 ENST00000296127.3 ENST00000455235.1 |
ZDHHC3
|
zinc finger, DHHC-type containing 3 |
| chr5_-_96143602 | 0.15 |
ENST00000443439.2
ENST00000503921.1 ENST00000508227.1 ENST00000507154.1 |
ERAP1
|
endoplasmic reticulum aminopeptidase 1 |
| chr7_+_95401851 | 0.15 |
ENST00000447467.2
|
DYNC1I1
|
dynein, cytoplasmic 1, intermediate chain 1 |
| chr12_-_62585203 | 0.15 |
ENST00000551449.1
|
FAM19A2
|
family with sequence similarity 19 (chemokine (C-C motif)-like), member A2 |
| chr19_-_8675559 | 0.15 |
ENST00000597188.1
|
ADAMTS10
|
ADAM metallopeptidase with thrombospondin type 1 motif, 10 |
| chr4_-_186732241 | 0.15 |
ENST00000421639.1
|
SORBS2
|
sorbin and SH3 domain containing 2 |
| chr14_+_104177607 | 0.15 |
ENST00000429169.1
|
AL049840.1
|
Uncharacterized protein; cDNA FLJ53535 |
| chrX_-_142722897 | 0.15 |
ENST00000338017.4
|
SLITRK4
|
SLIT and NTRK-like family, member 4 |
| chr3_-_167813672 | 0.15 |
ENST00000470487.1
|
GOLIM4
|
golgi integral membrane protein 4 |
| chr8_-_38386175 | 0.15 |
ENST00000437935.2
ENST00000358138.1 |
C8orf86
|
chromosome 8 open reading frame 86 |
| chrX_-_119445306 | 0.15 |
ENST00000371369.4
ENST00000440464.1 ENST00000519908.1 |
TMEM255A
|
transmembrane protein 255A |
| chr12_+_4829507 | 0.15 |
ENST00000252318.2
|
GALNT8
|
UDP-N-acetyl-alpha-D-galactosamine:polypeptide N-acetylgalactosaminyltransferase 8 (GalNAc-T8) |
| chr10_+_123923205 | 0.15 |
ENST00000369004.3
ENST00000260733.3 |
TACC2
|
transforming, acidic coiled-coil containing protein 2 |
| chr1_-_113160826 | 0.15 |
ENST00000538187.1
ENST00000369664.1 |
ST7L
|
suppression of tumorigenicity 7 like |
| chr19_+_58838369 | 0.15 |
ENST00000329665.4
|
ZSCAN22
|
zinc finger and SCAN domain containing 22 |
| chr4_-_70626314 | 0.15 |
ENST00000510821.1
|
SULT1B1
|
sulfotransferase family, cytosolic, 1B, member 1 |
| chr11_-_89224488 | 0.15 |
ENST00000534731.1
ENST00000527626.1 |
NOX4
|
NADPH oxidase 4 |
| chr7_+_125078119 | 0.15 |
ENST00000458437.1
ENST00000415896.1 |
RP11-807H17.1
|
RP11-807H17.1 |
| chr19_+_782755 | 0.15 |
ENST00000606242.1
ENST00000586061.1 |
AC006273.5
|
AC006273.5 |
| chr22_+_41601209 | 0.14 |
ENST00000216237.5
|
L3MBTL2
|
l(3)mbt-like 2 (Drosophila) |
| chr5_-_58652788 | 0.14 |
ENST00000405755.2
|
PDE4D
|
phosphodiesterase 4D, cAMP-specific |
| chr2_+_242673994 | 0.14 |
ENST00000321264.4
ENST00000537090.1 ENST00000403782.1 ENST00000342518.6 |
D2HGDH
|
D-2-hydroxyglutarate dehydrogenase |
| chr3_+_174577070 | 0.14 |
ENST00000454872.1
|
NAALADL2
|
N-acetylated alpha-linked acidic dipeptidase-like 2 |
| chr2_+_45878407 | 0.14 |
ENST00000421201.1
|
PRKCE
|
protein kinase C, epsilon |
| chr3_+_154958715 | 0.14 |
ENST00000462531.1
ENST00000490497.1 |
RP11-451G4.1
|
RP11-451G4.1 |
| chr13_-_103426112 | 0.14 |
ENST00000376032.4
ENST00000376029.3 |
TEX30
|
testis expressed 30 |
| chr5_+_32711419 | 0.14 |
ENST00000265074.8
|
NPR3
|
natriuretic peptide receptor C/guanylate cyclase C (atrionatriuretic peptide receptor C) |
| chr4_-_106817137 | 0.14 |
ENST00000510876.1
|
INTS12
|
integrator complex subunit 12 |
| chr6_-_90121789 | 0.14 |
ENST00000359203.3
|
RRAGD
|
Ras-related GTP binding D |
| chr19_+_41509851 | 0.14 |
ENST00000593831.1
ENST00000330446.5 |
CYP2B6
|
cytochrome P450, family 2, subfamily B, polypeptide 6 |
| chr9_+_127020202 | 0.14 |
ENST00000373600.3
ENST00000320246.5 |
NEK6
|
NIMA-related kinase 6 |
| chr1_+_223354486 | 0.14 |
ENST00000446145.1
|
RP11-239E10.3
|
RP11-239E10.3 |
| chr2_-_42180940 | 0.14 |
ENST00000378711.2
|
C2orf91
|
chromosome 2 open reading frame 91 |
| chr14_+_71108460 | 0.14 |
ENST00000256367.2
|
TTC9
|
tetratricopeptide repeat domain 9 |
| chr19_-_37096139 | 0.14 |
ENST00000585983.1
ENST00000585960.1 ENST00000586115.1 |
ZNF529
|
zinc finger protein 529 |
| chr15_+_40544749 | 0.14 |
ENST00000559617.1
ENST00000560684.1 |
PAK6
|
p21 protein (Cdc42/Rac)-activated kinase 6 |
| chr19_+_14492247 | 0.14 |
ENST00000357355.3
ENST00000592261.2 ENST00000242786.5 |
CD97
|
CD97 molecule |
| chr11_+_111169565 | 0.14 |
ENST00000528846.1
|
COLCA2
|
colorectal cancer associated 2 |
| chr10_+_115939008 | 0.14 |
ENST00000369282.1
ENST00000251864.2 ENST00000369281.2 ENST00000422662.1 |
TDRD1
|
tudor domain containing 1 |
| chr17_-_78194147 | 0.13 |
ENST00000534910.1
ENST00000326317.6 |
SGSH
|
N-sulfoglucosamine sulfohydrolase |
| chr6_-_11807277 | 0.13 |
ENST00000379415.2
|
ADTRP
|
androgen-dependent TFPI-regulating protein |
| chr15_+_48009541 | 0.13 |
ENST00000536845.2
ENST00000558816.1 |
SEMA6D
|
sema domain, transmembrane domain (TM), and cytoplasmic domain, (semaphorin) 6D |
| chr10_+_5566916 | 0.13 |
ENST00000315238.1
|
CALML3
|
calmodulin-like 3 |
| chr19_-_36705547 | 0.13 |
ENST00000304116.5
|
ZNF565
|
zinc finger protein 565 |
| chr19_+_46009837 | 0.13 |
ENST00000589627.1
|
VASP
|
vasodilator-stimulated phosphoprotein |
| chr19_+_46171464 | 0.13 |
ENST00000590918.1
ENST00000263281.3 ENST00000304207.8 |
GIPR
|
gastric inhibitory polypeptide receptor |
| chr18_-_21242833 | 0.13 |
ENST00000586087.1
ENST00000592179.1 |
ANKRD29
|
ankyrin repeat domain 29 |
| chr4_-_70725856 | 0.13 |
ENST00000226444.3
|
SULT1E1
|
sulfotransferase family 1E, estrogen-preferring, member 1 |
| chr2_-_188312971 | 0.13 |
ENST00000410068.1
ENST00000447403.1 ENST00000410102.1 |
CALCRL
|
calcitonin receptor-like |
| chr5_-_142065223 | 0.13 |
ENST00000378046.1
|
FGF1
|
fibroblast growth factor 1 (acidic) |
| chr12_-_56326402 | 0.13 |
ENST00000547925.1
|
WIBG
|
within bgcn homolog (Drosophila) |
| chr12_+_4385230 | 0.13 |
ENST00000536537.1
|
CCND2
|
cyclin D2 |
| chr8_-_143696833 | 0.13 |
ENST00000356613.2
|
ARC
|
activity-regulated cytoskeleton-associated protein |
| chr6_-_150212029 | 0.13 |
ENST00000529948.1
ENST00000357183.4 ENST00000367363.3 |
RAET1E
|
retinoic acid early transcript 1E |
| chr17_+_48243352 | 0.13 |
ENST00000344627.6
ENST00000262018.3 ENST00000543315.1 ENST00000451235.2 ENST00000511303.1 |
SGCA
|
sarcoglycan, alpha (50kDa dystrophin-associated glycoprotein) |
| chr15_+_42694573 | 0.13 |
ENST00000397200.4
ENST00000569827.1 |
CAPN3
|
calpain 3, (p94) |
| chr3_-_50374869 | 0.13 |
ENST00000327761.3
|
RASSF1
|
Ras association (RalGDS/AF-6) domain family member 1 |
| chr21_-_31311818 | 0.13 |
ENST00000535441.1
ENST00000309434.7 ENST00000327783.4 ENST00000389124.2 ENST00000389125.3 ENST00000399913.1 |
GRIK1
|
glutamate receptor, ionotropic, kainate 1 |
| chr3_-_193272874 | 0.13 |
ENST00000342695.4
|
ATP13A4
|
ATPase type 13A4 |
| chr9_-_101471479 | 0.13 |
ENST00000259455.2
|
GABBR2
|
gamma-aminobutyric acid (GABA) B receptor, 2 |
| chrX_-_101397433 | 0.13 |
ENST00000372774.3
|
TCEAL6
|
transcription elongation factor A (SII)-like 6 |
| chr6_-_41122063 | 0.12 |
ENST00000426005.2
ENST00000437044.2 ENST00000373127.4 |
TREML1
|
triggering receptor expressed on myeloid cells-like 1 |
| chr3_-_15563229 | 0.12 |
ENST00000383786.5
ENST00000383787.2 ENST00000383785.2 ENST00000383788.5 ENST00000603808.1 |
COLQ
|
collagen-like tail subunit (single strand of homotrimer) of asymmetric acetylcholinesterase |
| chr14_-_54420133 | 0.12 |
ENST00000559501.1
ENST00000558984.1 |
BMP4
|
bone morphogenetic protein 4 |
| chr7_-_83824449 | 0.12 |
ENST00000420047.1
|
SEMA3A
|
sema domain, immunoglobulin domain (Ig), short basic domain, secreted, (semaphorin) 3A |
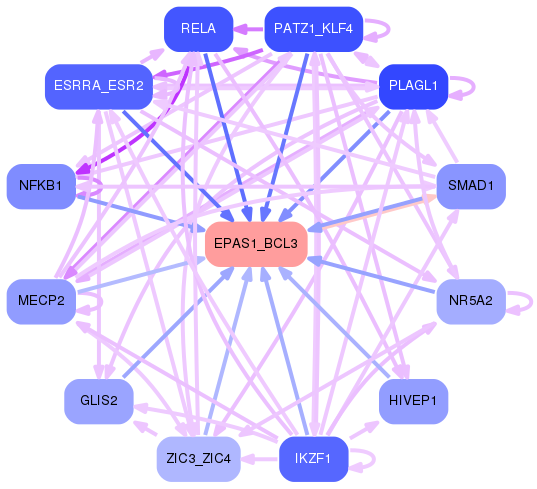
Network of associatons between targets according to the STRING database.

First level regulatory network of EPAS1_BCL3
Gene Ontology Analysis
Gene overrepresentation in biological_process category:
| Log-likelihood per target | Total log-likelihood | Term | Description |
|---|---|---|---|
| 0.2 | 1.1 | GO:0042699 | follicle-stimulating hormone signaling pathway(GO:0042699) |
| 0.1 | 0.7 | GO:1904158 | axonemal central apparatus assembly(GO:1904158) |
| 0.1 | 0.6 | GO:1903974 | mammary gland fat development(GO:0060611) positive regulation of macrophage colony-stimulating factor signaling pathway(GO:1902228) positive regulation of response to macrophage colony-stimulating factor(GO:1903971) positive regulation of cellular response to macrophage colony-stimulating factor stimulus(GO:1903974) microglial cell migration(GO:1904124) regulation of microglial cell migration(GO:1904139) positive regulation of microglial cell migration(GO:1904141) |
| 0.1 | 0.5 | GO:0034443 | negative regulation of lipoprotein oxidation(GO:0034443) |
| 0.1 | 1.1 | GO:0021869 | forebrain ventricular zone progenitor cell division(GO:0021869) |
| 0.1 | 0.3 | GO:0044727 | DNA demethylation of male pronucleus(GO:0044727) |
| 0.1 | 0.3 | GO:0045226 | extracellular polysaccharide biosynthetic process(GO:0045226) extracellular polysaccharide metabolic process(GO:0046379) |
| 0.1 | 0.4 | GO:0038098 | sequestering of BMP from receptor via BMP binding(GO:0038098) |
| 0.1 | 0.7 | GO:2000544 | cell chemotaxis to fibroblast growth factor(GO:0035766) endothelial cell chemotaxis to fibroblast growth factor(GO:0035768) regulation of cell chemotaxis to fibroblast growth factor(GO:1904847) regulation of endothelial cell chemotaxis to fibroblast growth factor(GO:2000544) |
| 0.1 | 0.6 | GO:0018916 | nitrobenzene metabolic process(GO:0018916) |
| 0.1 | 0.3 | GO:0019464 | glycine catabolic process(GO:0006546) glycine decarboxylation via glycine cleavage system(GO:0019464) |
| 0.1 | 0.2 | GO:1904425 | negative regulation of GTP binding(GO:1904425) |
| 0.0 | 0.1 | GO:0019516 | lactate oxidation(GO:0019516) |
| 0.0 | 0.2 | GO:0050712 | negative regulation of interleukin-1 alpha production(GO:0032690) negative regulation of interleukin-1 alpha secretion(GO:0050712) |
| 0.0 | 0.8 | GO:0048172 | regulation of short-term neuronal synaptic plasticity(GO:0048172) |
| 0.0 | 0.1 | GO:0098582 | innate vocalization behavior(GO:0098582) |
| 0.0 | 0.3 | GO:0010890 | positive regulation of sequestering of triglyceride(GO:0010890) |
| 0.0 | 0.1 | GO:0032289 | central nervous system myelin formation(GO:0032289) |
| 0.0 | 0.4 | GO:0098914 | membrane repolarization during atrial cardiac muscle cell action potential(GO:0098914) |
| 0.0 | 0.1 | GO:0046985 | positive regulation of hemoglobin biosynthetic process(GO:0046985) |
| 0.0 | 0.2 | GO:0042376 | phylloquinone metabolic process(GO:0042374) phylloquinone catabolic process(GO:0042376) quinone catabolic process(GO:1901662) |
| 0.0 | 0.2 | GO:1904274 | tricellular tight junction assembly(GO:1904274) |
| 0.0 | 0.1 | GO:0046338 | phosphatidylethanolamine catabolic process(GO:0046338) |
| 0.0 | 0.1 | GO:0071106 | coenzyme A transport(GO:0015880) coenzyme A transmembrane transport(GO:0035349) adenosine 3',5'-bisphosphate transmembrane transport(GO:0071106) AMP transport(GO:0080121) |
| 0.0 | 0.2 | GO:0071279 | cellular response to cobalt ion(GO:0071279) |
| 0.0 | 0.2 | GO:0001507 | acetylcholine catabolic process in synaptic cleft(GO:0001507) acetylcholine catabolic process(GO:0006581) |
| 0.0 | 0.3 | GO:0000727 | double-strand break repair via break-induced replication(GO:0000727) |
| 0.0 | 0.1 | GO:0090214 | spongiotrophoblast layer developmental growth(GO:0090214) |
| 0.0 | 0.1 | GO:0046022 | positive regulation of transcription from RNA polymerase II promoter during mitosis(GO:0046022) |
| 0.0 | 0.2 | GO:0002536 | respiratory burst involved in inflammatory response(GO:0002536) regulation of respiratory burst involved in inflammatory response(GO:0060264) negative regulation of respiratory burst involved in inflammatory response(GO:0060266) |
| 0.0 | 0.1 | GO:1903697 | negative regulation of microvillus assembly(GO:1903697) |
| 0.0 | 0.2 | GO:0010636 | positive regulation of mitochondrial fusion(GO:0010636) |
| 0.0 | 0.2 | GO:2000051 | negative regulation of non-canonical Wnt signaling pathway(GO:2000051) |
| 0.0 | 0.2 | GO:0097327 | response to antineoplastic agent(GO:0097327) |
| 0.0 | 0.1 | GO:1903045 | neural crest cell migration involved in sympathetic nervous system development(GO:1903045) |
| 0.0 | 0.1 | GO:0051151 | negative regulation of smooth muscle cell differentiation(GO:0051151) |
| 0.0 | 0.2 | GO:0060332 | positive regulation of response to interferon-gamma(GO:0060332) positive regulation of interferon-gamma-mediated signaling pathway(GO:0060335) |
| 0.0 | 0.2 | GO:0072197 | ureter morphogenesis(GO:0072197) |
| 0.0 | 0.1 | GO:0036118 | hyaluranon cable assembly(GO:0036118) regulation of hyaluranon cable assembly(GO:1900104) positive regulation of hyaluranon cable assembly(GO:1900106) |
| 0.0 | 0.2 | GO:2000661 | positive regulation of interleukin-1-mediated signaling pathway(GO:2000661) |
| 0.0 | 0.5 | GO:0006703 | estrogen biosynthetic process(GO:0006703) |
| 0.0 | 0.0 | GO:0035582 | sequestering of BMP in extracellular matrix(GO:0035582) |
| 0.0 | 0.1 | GO:0046013 | regulation of T cell homeostatic proliferation(GO:0046013) |
| 0.0 | 0.0 | GO:1903895 | negative regulation of IRE1-mediated unfolded protein response(GO:1903895) |
| 0.0 | 0.1 | GO:0002290 | gamma-delta T cell activation involved in immune response(GO:0002290) negative regulation of interferon-beta secretion(GO:0035548) regulation of gamma-delta T cell activation involved in immune response(GO:2001191) positive regulation of gamma-delta T cell activation involved in immune response(GO:2001193) |
| 0.0 | 0.1 | GO:2000969 | positive regulation of alpha-amino-3-hydroxy-5-methyl-4-isoxazole propionate selective glutamate receptor activity(GO:2000969) |
| 0.0 | 0.1 | GO:2000283 | regulation of cellular amine catabolic process(GO:0033241) negative regulation of cellular amine catabolic process(GO:0033242) negative regulation of the force of heart contraction(GO:0098736) regulation of arginine catabolic process(GO:1900081) negative regulation of arginine catabolic process(GO:1900082) regulation of citrulline biosynthetic process(GO:1903248) negative regulation of citrulline biosynthetic process(GO:1903249) negative regulation of cellular amino acid biosynthetic process(GO:2000283) |
| 0.0 | 0.2 | GO:2000490 | negative regulation of hepatic stellate cell activation(GO:2000490) |
| 0.0 | 0.1 | GO:0050902 | leukocyte adhesive activation(GO:0050902) |
| 0.0 | 0.2 | GO:0034154 | toll-like receptor 7 signaling pathway(GO:0034154) |
| 0.0 | 0.3 | GO:0070445 | oligodendrocyte progenitor proliferation(GO:0070444) regulation of oligodendrocyte progenitor proliferation(GO:0070445) |
| 0.0 | 0.1 | GO:0002296 | T-helper 1 cell lineage commitment(GO:0002296) |
| 0.0 | 0.1 | GO:0035283 | rhombomere 3 development(GO:0021569) central nervous system segmentation(GO:0035283) brain segmentation(GO:0035284) |
| 0.0 | 0.0 | GO:0002767 | immune response-inhibiting cell surface receptor signaling pathway(GO:0002767) |
| 0.0 | 0.2 | GO:0071233 | cellular response to leucine(GO:0071233) |
| 0.0 | 0.1 | GO:0010621 | negative regulation of transcription by transcription factor localization(GO:0010621) |
| 0.0 | 0.1 | GO:2000672 | negative regulation of motor neuron apoptotic process(GO:2000672) |
| 0.0 | 0.1 | GO:0038162 | erythropoietin-mediated signaling pathway(GO:0038162) |
| 0.0 | 0.2 | GO:0030200 | heparan sulfate proteoglycan catabolic process(GO:0030200) |
| 0.0 | 0.2 | GO:0010724 | regulation of definitive erythrocyte differentiation(GO:0010724) |
| 0.0 | 0.2 | GO:0036506 | maintenance of unfolded protein(GO:0036506) maintenance of unfolded protein involved in ERAD pathway(GO:1904378) |
| 0.0 | 0.1 | GO:0019418 | sulfide oxidation(GO:0019418) sulfide oxidation, using sulfide:quinone oxidoreductase(GO:0070221) |
| 0.0 | 0.2 | GO:0048050 | post-embryonic eye morphogenesis(GO:0048050) |
| 0.0 | 0.1 | GO:0014740 | regulation of muscle hyperplasia(GO:0014738) negative regulation of muscle hyperplasia(GO:0014740) |
| 0.0 | 0.1 | GO:0033563 | dorsal/ventral axon guidance(GO:0033563) |
| 0.0 | 0.3 | GO:0070234 | positive regulation of T cell apoptotic process(GO:0070234) |
| 0.0 | 0.2 | GO:0002158 | osteoclast proliferation(GO:0002158) |
| 0.0 | 0.1 | GO:0030241 | skeletal muscle myosin thick filament assembly(GO:0030241) |
| 0.0 | 0.2 | GO:2001300 | lipoxin metabolic process(GO:2001300) |
| 0.0 | 0.1 | GO:0014718 | positive regulation of satellite cell activation involved in skeletal muscle regeneration(GO:0014718) |
| 0.0 | 0.2 | GO:0045743 | positive regulation of fibroblast growth factor receptor signaling pathway(GO:0045743) |
| 0.0 | 0.1 | GO:0072675 | multinuclear osteoclast differentiation(GO:0072674) osteoclast fusion(GO:0072675) |
| 0.0 | 0.1 | GO:0031548 | regulation of brain-derived neurotrophic factor receptor signaling pathway(GO:0031548) |
| 0.0 | 0.2 | GO:0009957 | epidermal cell fate specification(GO:0009957) |
| 0.0 | 0.2 | GO:0001951 | intestinal D-glucose absorption(GO:0001951) |
| 0.0 | 0.1 | GO:0002118 | aggressive behavior(GO:0002118) |
| 0.0 | 0.1 | GO:0070327 | thyroid hormone transport(GO:0070327) |
| 0.0 | 0.1 | GO:1904252 | hepatocyte cell migration(GO:0002194) otic placode formation(GO:0043049) branching involved in pancreas morphogenesis(GO:0061114) negative regulation of bile acid biosynthetic process(GO:0070858) acinar cell differentiation(GO:0090425) negative regulation of bile acid metabolic process(GO:1904252) positive regulation of forebrain neuron differentiation(GO:2000979) |
| 0.0 | 0.2 | GO:2000576 | positive regulation of microtubule motor activity(GO:2000576) regulation of ATP-dependent microtubule motor activity, plus-end-directed(GO:2000580) positive regulation of ATP-dependent microtubule motor activity, plus-end-directed(GO:2000582) |
| 0.0 | 0.6 | GO:0022011 | myelination in peripheral nervous system(GO:0022011) peripheral nervous system axon ensheathment(GO:0032292) |
| 0.0 | 0.0 | GO:1904897 | regulation of hepatic stellate cell proliferation(GO:1904897) positive regulation of hepatic stellate cell proliferation(GO:1904899) hepatic stellate cell proliferation(GO:1990922) |
| 0.0 | 0.1 | GO:0090076 | relaxation of skeletal muscle(GO:0090076) |
| 0.0 | 0.0 | GO:0035262 | gonad morphogenesis(GO:0035262) |
| 0.0 | 0.0 | GO:0048880 | sensory system development(GO:0048880) |
| 0.0 | 0.1 | GO:0034285 | response to sucrose(GO:0009744) response to disaccharide(GO:0034285) |
| 0.0 | 0.3 | GO:0019800 | peptide cross-linking via chondroitin 4-sulfate glycosaminoglycan(GO:0019800) |
| 0.0 | 0.0 | GO:1990926 | short-term synaptic potentiation(GO:1990926) |
| 0.0 | 0.0 | GO:0034970 | histone H3-R2 methylation(GO:0034970) |
| 0.0 | 0.1 | GO:0086024 | adrenergic receptor signaling pathway involved in positive regulation of heart rate(GO:0086024) |
| 0.0 | 0.1 | GO:0000270 | peptidoglycan metabolic process(GO:0000270) peptidoglycan catabolic process(GO:0009253) |
| 0.0 | 0.1 | GO:0035669 | TRAM-dependent toll-like receptor signaling pathway(GO:0035668) TRAM-dependent toll-like receptor 4 signaling pathway(GO:0035669) |
| 0.0 | 0.2 | GO:0019344 | cysteine biosynthetic process(GO:0019344) |
| 0.0 | 0.0 | GO:0010360 | negative regulation of anion channel activity(GO:0010360) |
| 0.0 | 0.1 | GO:0043569 | negative regulation of insulin-like growth factor receptor signaling pathway(GO:0043569) |
| 0.0 | 0.1 | GO:0038110 | interleukin-2-mediated signaling pathway(GO:0038110) |
| 0.0 | 0.1 | GO:0043932 | ossification involved in bone remodeling(GO:0043932) |
| 0.0 | 0.2 | GO:2000601 | positive regulation of Arp2/3 complex-mediated actin nucleation(GO:2000601) |
| 0.0 | 0.2 | GO:0043985 | histone H4-R3 methylation(GO:0043985) |
| 0.0 | 0.2 | GO:0090179 | planar cell polarity pathway involved in neural tube closure(GO:0090179) |
| 0.0 | 0.2 | GO:0019885 | antigen processing and presentation of endogenous peptide antigen via MHC class I(GO:0019885) |
| 0.0 | 0.3 | GO:0014037 | Schwann cell differentiation(GO:0014037) |
| 0.0 | 0.1 | GO:0035690 | cellular response to drug(GO:0035690) |
| 0.0 | 0.6 | GO:0042554 | superoxide anion generation(GO:0042554) |
| 0.0 | 0.2 | GO:0045663 | positive regulation of myoblast differentiation(GO:0045663) |
| 0.0 | 0.1 | GO:0010571 | positive regulation of nuclear cell cycle DNA replication(GO:0010571) |
| 0.0 | 0.1 | GO:0090038 | negative regulation of protein kinase C signaling(GO:0090038) |
| 0.0 | 0.0 | GO:0002101 | tRNA wobble cytosine modification(GO:0002101) |
| 0.0 | 0.1 | GO:0007197 | adenylate cyclase-inhibiting G-protein coupled acetylcholine receptor signaling pathway(GO:0007197) |
| 0.0 | 0.0 | GO:0072302 | negative regulation of metanephric glomerulus development(GO:0072299) negative regulation of metanephric glomerular mesangial cell proliferation(GO:0072302) |
| 0.0 | 0.0 | GO:0032581 | ER-dependent peroxisome organization(GO:0032581) |
| 0.0 | 0.2 | GO:0014877 | response to muscle inactivity involved in regulation of muscle adaptation(GO:0014877) response to denervation involved in regulation of muscle adaptation(GO:0014894) |
| 0.0 | 0.0 | GO:0061091 | regulation of phospholipid translocation(GO:0061091) positive regulation of phospholipid translocation(GO:0061092) |
| 0.0 | 0.1 | GO:0046092 | deoxycytidine metabolic process(GO:0046092) |
| 0.0 | 0.2 | GO:0001574 | ganglioside biosynthetic process(GO:0001574) |
| 0.0 | 0.1 | GO:0019075 | virus maturation(GO:0019075) |
| 0.0 | 0.1 | GO:0006929 | substrate-dependent cell migration(GO:0006929) |
| 0.0 | 0.1 | GO:0006572 | tyrosine catabolic process(GO:0006572) |
| 0.0 | 0.1 | GO:0072553 | terminal button organization(GO:0072553) |
| 0.0 | 0.0 | GO:0061073 | ciliary body morphogenesis(GO:0061073) |
| 0.0 | 0.1 | GO:2001206 | positive regulation of osteoclast development(GO:2001206) |
| 0.0 | 0.1 | GO:0010536 | positive regulation of activation of Janus kinase activity(GO:0010536) regulation of NK T cell proliferation(GO:0051140) positive regulation of NK T cell proliferation(GO:0051142) |
| 0.0 | 0.2 | GO:0043252 | sodium-independent organic anion transport(GO:0043252) |
| 0.0 | 0.3 | GO:0016254 | preassembly of GPI anchor in ER membrane(GO:0016254) |
| 0.0 | 0.2 | GO:1902187 | negative regulation of viral release from host cell(GO:1902187) |
| 0.0 | 0.4 | GO:0018345 | protein palmitoylation(GO:0018345) |
| 0.0 | 0.1 | GO:1902414 | protein localization to cell junction(GO:1902414) |
| 0.0 | 0.4 | GO:0031290 | retinal ganglion cell axon guidance(GO:0031290) |
| 0.0 | 0.2 | GO:0051382 | kinetochore assembly(GO:0051382) |
| 0.0 | 0.0 | GO:0048263 | determination of dorsal identity(GO:0048263) |
Gene overrepresentation in cellular_component category:
| Log-likelihood per target | Total log-likelihood | Term | Description |
|---|---|---|---|
| 0.1 | 0.3 | GO:0034365 | discoidal high-density lipoprotein particle(GO:0034365) |
| 0.1 | 0.6 | GO:1990682 | CSF1-CSF1R complex(GO:1990682) |
| 0.1 | 0.3 | GO:0000811 | GINS complex(GO:0000811) |
| 0.1 | 0.3 | GO:0072534 | perineuronal net(GO:0072534) |
| 0.0 | 0.2 | GO:1990131 | Gtr1-Gtr2 GTPase complex(GO:1990131) |
| 0.0 | 1.1 | GO:0031143 | pseudopodium(GO:0031143) |
| 0.0 | 0.1 | GO:0038039 | G-protein coupled receptor heterodimeric complex(GO:0038039) |
| 0.0 | 0.1 | GO:0036117 | hyaluranon cable(GO:0036117) |
| 0.0 | 0.6 | GO:0043020 | NADPH oxidase complex(GO:0043020) |
| 0.0 | 0.3 | GO:0042627 | chylomicron(GO:0042627) |
| 0.0 | 0.1 | GO:0016012 | sarcoglycan complex(GO:0016012) |
| 0.0 | 0.3 | GO:0001940 | male pronucleus(GO:0001940) |
| 0.0 | 0.2 | GO:0072379 | BAT3 complex(GO:0071818) ER membrane insertion complex(GO:0072379) |
| 0.0 | 0.5 | GO:0032045 | guanyl-nucleotide exchange factor complex(GO:0032045) |
| 0.0 | 0.1 | GO:0071546 | pi-body(GO:0071546) |
| 0.0 | 0.1 | GO:0097059 | CNTFR-CLCF1 complex(GO:0097059) |
| 0.0 | 0.4 | GO:0000812 | Swr1 complex(GO:0000812) |
| 0.0 | 0.1 | GO:0097129 | cyclin D2-CDK4 complex(GO:0097129) |
| 0.0 | 0.1 | GO:0000220 | vacuolar proton-transporting V-type ATPase, V0 domain(GO:0000220) |
| 0.0 | 0.2 | GO:0000506 | glycosylphosphatidylinositol-N-acetylglucosaminyltransferase (GPI-GnT) complex(GO:0000506) |
| 0.0 | 0.1 | GO:0032279 | asymmetric synapse(GO:0032279) symmetric synapse(GO:0032280) |
| 0.0 | 0.0 | GO:0031523 | Myb complex(GO:0031523) |
| 0.0 | 0.0 | GO:0071006 | U2-type catalytic step 1 spliceosome(GO:0071006) |
| 0.0 | 0.1 | GO:0045254 | pyruvate dehydrogenase complex(GO:0045254) |
| 0.0 | 0.0 | GO:0002944 | cyclin K-CDK12 complex(GO:0002944) |
| 0.0 | 0.2 | GO:0043083 | synaptic cleft(GO:0043083) |
| 0.0 | 0.3 | GO:0071564 | npBAF complex(GO:0071564) |
| 0.0 | 0.1 | GO:0034385 | very-low-density lipoprotein particle(GO:0034361) triglyceride-rich lipoprotein particle(GO:0034385) |
| 0.0 | 0.1 | GO:0071953 | elastic fiber(GO:0071953) |
Gene overrepresentation in molecular_function category:
| Log-likelihood per target | Total log-likelihood | Term | Description |
|---|---|---|---|
| 0.4 | 1.1 | GO:0031896 | vasopressin receptor binding(GO:0031893) V2 vasopressin receptor binding(GO:0031896) |
| 0.1 | 0.7 | GO:0005157 | macrophage colony-stimulating factor receptor binding(GO:0005157) |
| 0.1 | 0.4 | GO:0050501 | hyaluronan synthase activity(GO:0050501) |
| 0.1 | 0.5 | GO:0047006 | 17-alpha,20-alpha-dihydroxypregn-4-en-3-one dehydrogenase activity(GO:0047006) |
| 0.1 | 0.3 | GO:0004047 | aminomethyltransferase activity(GO:0004047) |
| 0.1 | 0.4 | GO:0086089 | voltage-gated potassium channel activity involved in atrial cardiac muscle cell action potential repolarization(GO:0086089) |
| 0.1 | 0.3 | GO:0070579 | methylcytosine dioxygenase activity(GO:0070579) |
| 0.1 | 0.2 | GO:0000253 | 3-keto sterol reductase activity(GO:0000253) |
| 0.1 | 0.2 | GO:0016826 | N-sulfoglucosamine sulfohydrolase activity(GO:0016250) hydrolase activity, acting on acid sulfur-nitrogen bonds(GO:0016826) |
| 0.1 | 0.2 | GO:0004464 | leukotriene-C4 synthase activity(GO:0004464) |
| 0.0 | 0.1 | GO:0004458 | D-lactate dehydrogenase (cytochrome) activity(GO:0004458) oxidoreductase activity, acting on the CH-OH group of donors, cytochrome as acceptor(GO:0016898) |
| 0.0 | 0.5 | GO:0036122 | BMP binding(GO:0036122) |
| 0.0 | 0.2 | GO:0005151 | interleukin-1, Type II receptor binding(GO:0005151) |
| 0.0 | 0.2 | GO:0047888 | fatty acid peroxidase activity(GO:0047888) |
| 0.0 | 0.1 | GO:0031435 | mitogen-activated protein kinase kinase kinase binding(GO:0031435) |
| 0.0 | 0.1 | GO:0004948 | calcitonin receptor activity(GO:0004948) |
| 0.0 | 0.8 | GO:0005432 | calcium:sodium antiporter activity(GO:0005432) |
| 0.0 | 0.1 | GO:0032440 | 2-alkenal reductase [NAD(P)] activity(GO:0032440) |
| 0.0 | 0.5 | GO:0019826 | oxygen sensor activity(GO:0019826) |
| 0.0 | 0.2 | GO:0043398 | HLH domain binding(GO:0043398) |
| 0.0 | 0.2 | GO:0004910 | interleukin-1, Type II, blocking receptor activity(GO:0004910) |
| 0.0 | 0.1 | GO:0071077 | coenzyme A transmembrane transporter activity(GO:0015228) adenosine 3',5'-bisphosphate transmembrane transporter activity(GO:0071077) AMP transmembrane transporter activity(GO:0080122) |
| 0.0 | 0.1 | GO:0050211 | procollagen galactosyltransferase activity(GO:0050211) |
| 0.0 | 0.2 | GO:0005006 | epidermal growth factor-activated receptor activity(GO:0005006) |
| 0.0 | 0.1 | GO:0015439 | heme-transporting ATPase activity(GO:0015439) |
| 0.0 | 0.2 | GO:0033829 | O-fucosylpeptide 3-beta-N-acetylglucosaminyltransferase activity(GO:0033829) |
| 0.0 | 0.2 | GO:0097108 | hedgehog family protein binding(GO:0097108) |
| 0.0 | 0.4 | GO:0038132 | neuregulin binding(GO:0038132) |
| 0.0 | 0.2 | GO:0015277 | kainate selective glutamate receptor activity(GO:0015277) |
| 0.0 | 0.1 | GO:0004739 | pyruvate dehydrogenase (acetyl-transferring) activity(GO:0004739) |
| 0.0 | 0.2 | GO:0016941 | natriuretic peptide receptor activity(GO:0016941) |
| 0.0 | 0.1 | GO:0016639 | oxidoreductase activity, acting on the CH-NH2 group of donors, NAD or NADP as acceptor(GO:0016639) |
| 0.0 | 0.1 | GO:0030109 | HLA-A specific inhibitory MHC class I receptor activity(GO:0030107) HLA-B specific inhibitory MHC class I receptor activity(GO:0030109) inhibitory MHC class I receptor activity(GO:0032396) |
| 0.0 | 0.6 | GO:0043295 | glutathione binding(GO:0043295) |
| 0.0 | 0.1 | GO:0036487 | nitric-oxide synthase inhibitor activity(GO:0036487) |
| 0.0 | 0.1 | GO:0004965 | G-protein coupled GABA receptor activity(GO:0004965) |
| 0.0 | 0.7 | GO:0005104 | fibroblast growth factor receptor binding(GO:0005104) |
| 0.0 | 0.2 | GO:0004909 | interleukin-1, Type I, activating receptor activity(GO:0004909) |
| 0.0 | 0.1 | GO:0003947 | (N-acetylneuraminyl)-galactosylglucosylceramide N-acetylgalactosaminyltransferase activity(GO:0003947) |
| 0.0 | 0.1 | GO:0035939 | microsatellite binding(GO:0035939) |
| 0.0 | 0.1 | GO:0005128 | erythropoietin receptor binding(GO:0005128) |
| 0.0 | 0.1 | GO:0034353 | RNA pyrophosphohydrolase activity(GO:0034353) |
| 0.0 | 0.1 | GO:0051377 | mannose-ethanolamine phosphotransferase activity(GO:0051377) |
| 0.0 | 0.2 | GO:0019798 | procollagen-proline 4-dioxygenase activity(GO:0004656) procollagen-proline dioxygenase activity(GO:0019798) |
| 0.0 | 0.1 | GO:0004911 | interleukin-2 receptor activity(GO:0004911) interleukin-2 binding(GO:0019976) |
| 0.0 | 0.1 | GO:0004699 | calcium-independent protein kinase C activity(GO:0004699) |
| 0.0 | 0.2 | GO:0005412 | glucose:sodium symporter activity(GO:0005412) |
| 0.0 | 0.1 | GO:0047894 | flavonol 3-sulfotransferase activity(GO:0047894) steroid sulfotransferase activity(GO:0050294) |
| 0.0 | 0.1 | GO:0005169 | neurotrophin TRKB receptor binding(GO:0005169) |
| 0.0 | 0.8 | GO:0043015 | gamma-tubulin binding(GO:0043015) |
| 0.0 | 0.2 | GO:0017176 | phosphatidylinositol N-acetylglucosaminyltransferase activity(GO:0017176) |
| 0.0 | 0.1 | GO:0030215 | semaphorin receptor binding(GO:0030215) |
| 0.0 | 0.1 | GO:0055100 | adiponectin binding(GO:0055100) |
| 0.0 | 0.3 | GO:0043138 | 3'-5' DNA helicase activity(GO:0043138) |
| 0.0 | 0.1 | GO:0033691 | sialic acid binding(GO:0033691) |
| 0.0 | 0.0 | GO:0031859 | platelet activating factor receptor binding(GO:0031859) |
| 0.0 | 0.1 | GO:0015018 | galactosylgalactosylxylosylprotein 3-beta-glucuronosyltransferase activity(GO:0015018) |
| 0.0 | 0.0 | GO:0004019 | adenylosuccinate synthase activity(GO:0004019) |
| 0.0 | 0.1 | GO:0050253 | retinyl-palmitate esterase activity(GO:0050253) |
| 0.0 | 0.1 | GO:0004873 | asialoglycoprotein receptor activity(GO:0004873) |
| 0.0 | 0.1 | GO:0042806 | fucose binding(GO:0042806) |
| 0.0 | 0.2 | GO:0070700 | BMP receptor binding(GO:0070700) |
| 0.0 | 0.0 | GO:0004366 | glycerol-3-phosphate O-acyltransferase activity(GO:0004366) |
| 0.0 | 0.0 | GO:0004119 | cGMP-inhibited cyclic-nucleotide phosphodiesterase activity(GO:0004119) |
| 0.0 | 0.1 | GO:0004024 | alcohol dehydrogenase activity, zinc-dependent(GO:0004024) |
| 0.0 | 0.5 | GO:0038191 | neuropilin binding(GO:0038191) |
| 0.0 | 0.1 | GO:0047288 | monosialoganglioside sialyltransferase activity(GO:0047288) |
| 0.0 | 0.1 | GO:0004045 | aminoacyl-tRNA hydrolase activity(GO:0004045) |
| 0.0 | 0.4 | GO:0008191 | metalloendopeptidase inhibitor activity(GO:0008191) |
| 0.0 | 0.1 | GO:0016907 | G-protein coupled acetylcholine receptor activity(GO:0016907) |
| 0.0 | 0.2 | GO:0015245 | fatty acid transporter activity(GO:0015245) |
| 0.0 | 0.1 | GO:1990380 | Lys48-specific deubiquitinase activity(GO:1990380) |
| 0.0 | 0.1 | GO:0016509 | long-chain-3-hydroxyacyl-CoA dehydrogenase activity(GO:0016509) |
| 0.0 | 0.3 | GO:0030296 | protein tyrosine kinase activator activity(GO:0030296) |
| 0.0 | 0.0 | GO:0003839 | gamma-glutamylcyclotransferase activity(GO:0003839) |
| 0.0 | 0.2 | GO:0048273 | mitogen-activated protein kinase p38 binding(GO:0048273) |
| 0.0 | 0.1 | GO:0050431 | transforming growth factor beta binding(GO:0050431) |
| 0.0 | 0.4 | GO:0019707 | protein-cysteine S-palmitoyltransferase activity(GO:0019706) protein-cysteine S-acyltransferase activity(GO:0019707) |
Gene overrepresentation in C2:CP category:
| Log-likelihood per target | Total log-likelihood | Term | Description |
|---|---|---|---|
| 0.0 | 1.3 | PID IL8 CXCR1 PATHWAY | IL8- and CXCR1-mediated signaling events |
| 0.0 | 0.1 | PID EPHB FWD PATHWAY | EPHB forward signaling |
| 0.0 | 0.1 | ST WNT CA2 CYCLIC GMP PATHWAY | Wnt/Ca2+/cyclic GMP signaling. |
| 0.0 | 0.5 | PID HEDGEHOG 2PATHWAY | Signaling events mediated by the Hedgehog family |
| 0.0 | 0.3 | SA MMP CYTOKINE CONNECTION | Cytokines can induce activation of matrix metalloproteinases, which degrade extracellular matrix. |
Gene overrepresentation in C2:CP:REACTOME category:
| Log-likelihood per target | Total log-likelihood | Term | Description |
|---|---|---|---|
| 0.1 | 0.1 | REACTOME DAG AND IP3 SIGNALING | Genes involved in DAG and IP3 signaling |
| 0.0 | 0.7 | REACTOME FGFR4 LIGAND BINDING AND ACTIVATION | Genes involved in FGFR4 ligand binding and activation |
| 0.0 | 0.8 | REACTOME PLATELET CALCIUM HOMEOSTASIS | Genes involved in Platelet calcium homeostasis |
| 0.0 | 1.2 | REACTOME ACTIVATED NOTCH1 TRANSMITS SIGNAL TO THE NUCLEUS | Genes involved in Activated NOTCH1 Transmits Signal to the Nucleus |
| 0.0 | 0.5 | REACTOME HYALURONAN METABOLISM | Genes involved in Hyaluronan metabolism |
| 0.0 | 0.2 | REACTOME IRAK2 MEDIATED ACTIVATION OF TAK1 COMPLEX UPON TLR7 8 OR 9 STIMULATION | Genes involved in IRAK2 mediated activation of TAK1 complex upon TLR7/8 or 9 stimulation |
| 0.0 | 0.3 | REACTOME UNWINDING OF DNA | Genes involved in Unwinding of DNA |
| 0.0 | 0.7 | REACTOME GLUTATHIONE CONJUGATION | Genes involved in Glutathione conjugation |
| 0.0 | 0.4 | REACTOME SYNTHESIS OF GLYCOSYLPHOSPHATIDYLINOSITOL GPI | Genes involved in Synthesis of glycosylphosphatidylinositol (GPI) |
| 0.0 | 0.5 | REACTOME INHIBITION OF VOLTAGE GATED CA2 CHANNELS VIA GBETA GAMMA SUBUNITS | Genes involved in Inhibition of voltage gated Ca2+ channels via Gbeta/gamma subunits |
| 0.0 | 0.1 | REACTOME TRANSPORT OF ORGANIC ANIONS | Genes involved in Transport of organic anions |
| 0.0 | 0.1 | REACTOME SEROTONIN RECEPTORS | Genes involved in Serotonin receptors |
| 0.0 | 0.3 | REACTOME ACTIVATION OF RAC | Genes involved in Activation of Rac |