Project
NHBE cells infected with SARS-CoV-2 Analysis Results (GEO series: GSE147507)
Navigation
Downloads
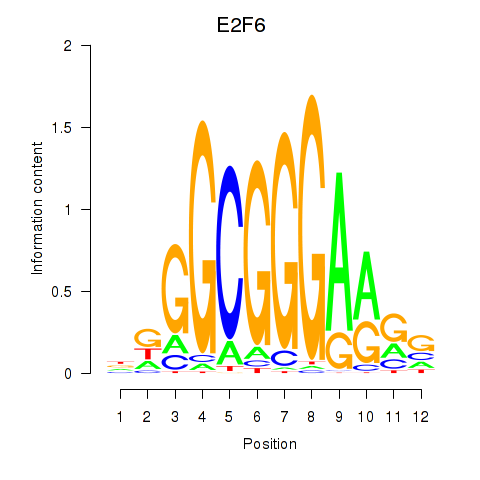
Results for E2F6
Z-value: 1.70
Motif logo
Transcription factors associated with E2F6
| Gene Symbol | Gene ID | Gene Info |
|---|---|---|
|
E2F6
|
ENSG00000169016.12 | E2F transcription factor 6 |
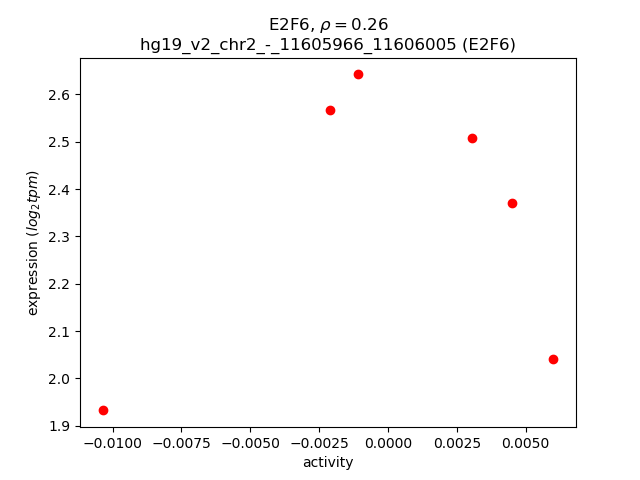
Activity-expression correlation:
| Gene | Promoter | Pearson corr. coef. | P-value | Plot |
|---|---|---|---|---|
| E2F6 | hg19_v2_chr2_-_11605966_11606005 | 0.26 | 6.2e-01 | Click! |
Activity profile of E2F6 motif
Sorted Z-values of E2F6 motif
| Promoter | Log-likelihood | Transcript | Gene | Gene Info |
|---|---|---|---|---|
| chr9_+_96928516 | 1.34 |
ENST00000602703.1
|
RP11-2B6.3
|
RP11-2B6.3 |
| chr19_-_48673465 | 1.34 |
ENST00000598938.1
|
LIG1
|
ligase I, DNA, ATP-dependent |
| chr12_-_58145889 | 1.20 |
ENST00000547853.1
|
CDK4
|
cyclin-dependent kinase 4 |
| chr17_-_58469591 | 0.89 |
ENST00000589335.1
|
USP32
|
ubiquitin specific peptidase 32 |
| chr2_-_174828892 | 0.89 |
ENST00000418194.2
|
SP3
|
Sp3 transcription factor |
| chr10_-_126849626 | 0.85 |
ENST00000530884.1
|
CTBP2
|
C-terminal binding protein 2 |
| chr1_+_51434357 | 0.84 |
ENST00000396148.1
|
CDKN2C
|
cyclin-dependent kinase inhibitor 2C (p18, inhibits CDK4) |
| chr20_+_31350184 | 0.67 |
ENST00000328111.2
ENST00000353855.2 ENST00000348286.2 |
DNMT3B
|
DNA (cytosine-5-)-methyltransferase 3 beta |
| chr17_-_58469329 | 0.66 |
ENST00000393003.3
|
USP32
|
ubiquitin specific peptidase 32 |
| chr14_-_81902791 | 0.64 |
ENST00000557055.1
|
STON2
|
stonin 2 |
| chr16_+_29817841 | 0.63 |
ENST00000322945.6
ENST00000562337.1 ENST00000566906.2 ENST00000563402.1 ENST00000219782.6 |
MAZ
|
MYC-associated zinc finger protein (purine-binding transcription factor) |
| chr17_+_55334364 | 0.62 |
ENST00000322684.3
ENST00000579590.1 |
MSI2
|
musashi RNA-binding protein 2 |
| chr19_+_48673949 | 0.61 |
ENST00000328759.7
|
C19orf68
|
chromosome 19 open reading frame 68 |
| chr17_-_62915574 | 0.60 |
ENST00000339474.5
ENST00000581368.1 |
LRRC37A3
|
leucine rich repeat containing 37, member A3 |
| chr10_+_120789223 | 0.60 |
ENST00000425699.1
|
NANOS1
|
nanos homolog 1 (Drosophila) |
| chr12_-_48499826 | 0.60 |
ENST00000551798.1
|
SENP1
|
SUMO1/sentrin specific peptidase 1 |
| chr11_-_46142615 | 0.58 |
ENST00000529734.1
ENST00000323180.6 |
PHF21A
|
PHD finger protein 21A |
| chr6_-_153452356 | 0.58 |
ENST00000206262.1
|
RGS17
|
regulator of G-protein signaling 17 |
| chr15_-_100273544 | 0.57 |
ENST00000409796.1
ENST00000545021.1 ENST00000344791.2 ENST00000332728.4 ENST00000450512.1 |
LYSMD4
|
LysM, putative peptidoglycan-binding, domain containing 4 |
| chr12_+_72233487 | 0.56 |
ENST00000482439.2
ENST00000550746.1 ENST00000491063.1 ENST00000319106.8 ENST00000485960.2 ENST00000393309.3 |
TBC1D15
|
TBC1 domain family, member 15 |
| chr3_+_37903432 | 0.54 |
ENST00000443503.2
|
CTDSPL
|
CTD (carboxy-terminal domain, RNA polymerase II, polypeptide A) small phosphatase-like |
| chr8_+_73449625 | 0.53 |
ENST00000523207.1
|
KCNB2
|
potassium voltage-gated channel, Shab-related subfamily, member 2 |
| chr15_-_59041768 | 0.53 |
ENST00000402627.1
ENST00000396140.2 ENST00000559053.1 ENST00000561288.1 |
ADAM10
|
ADAM metallopeptidase domain 10 |
| chr5_-_81046841 | 0.52 |
ENST00000509013.2
ENST00000505980.1 ENST00000509053.1 |
SSBP2
|
single-stranded DNA binding protein 2 |
| chr5_+_61601965 | 0.52 |
ENST00000401507.3
|
KIF2A
|
kinesin heavy chain member 2A |
| chr3_-_121467983 | 0.52 |
ENST00000472475.1
|
GOLGB1
|
golgin B1 |
| chr1_+_193028717 | 0.50 |
ENST00000415442.2
ENST00000506303.1 |
TROVE2
|
TROVE domain family, member 2 |
| chr2_-_164592497 | 0.50 |
ENST00000333129.3
ENST00000409634.1 |
FIGN
|
fidgetin |
| chr15_+_84116106 | 0.49 |
ENST00000535412.1
ENST00000324537.5 |
SH3GL3
|
SH3-domain GRB2-like 3 |
| chr6_-_111136299 | 0.48 |
ENST00000457688.1
|
CDK19
|
cyclin-dependent kinase 19 |
| chr5_+_61602236 | 0.48 |
ENST00000514082.1
ENST00000407818.3 |
KIF2A
|
kinesin heavy chain member 2A |
| chr5_+_61602055 | 0.48 |
ENST00000381103.2
|
KIF2A
|
kinesin heavy chain member 2A |
| chr8_-_121824374 | 0.47 |
ENST00000517992.1
|
SNTB1
|
syntrophin, beta 1 (dystrophin-associated protein A1, 59kDa, basic component 1) |
| chr10_+_76586348 | 0.47 |
ENST00000372724.1
ENST00000287239.4 ENST00000372714.1 |
KAT6B
|
K(lysine) acetyltransferase 6B |
| chr6_+_31126291 | 0.47 |
ENST00000376257.3
ENST00000376255.4 |
TCF19
|
transcription factor 19 |
| chr17_-_48207115 | 0.47 |
ENST00000511964.1
|
SAMD14
|
sterile alpha motif domain containing 14 |
| chr1_+_210406121 | 0.46 |
ENST00000367012.3
|
SERTAD4
|
SERTA domain containing 4 |
| chr17_-_30185946 | 0.45 |
ENST00000579741.1
|
COPRS
|
coordinator of PRMT5, differentiation stimulator |
| chr17_-_42277203 | 0.45 |
ENST00000587097.1
|
ATXN7L3
|
ataxin 7-like 3 |
| chr7_-_21985489 | 0.43 |
ENST00000356195.5
ENST00000447180.1 ENST00000373934.4 ENST00000457951.1 |
CDCA7L
|
cell division cycle associated 7-like |
| chr4_-_120548779 | 0.43 |
ENST00000264805.5
|
PDE5A
|
phosphodiesterase 5A, cGMP-specific |
| chr22_-_39096981 | 0.42 |
ENST00000427389.1
|
JOSD1
|
Josephin domain containing 1 |
| chr17_-_4710288 | 0.42 |
ENST00000571067.1
|
RP11-81A22.5
|
RP11-81A22.5 |
| chr5_-_81046904 | 0.42 |
ENST00000515395.1
|
SSBP2
|
single-stranded DNA binding protein 2 |
| chr3_-_9811674 | 0.42 |
ENST00000411972.1
|
CAMK1
|
calcium/calmodulin-dependent protein kinase I |
| chr1_+_211432700 | 0.42 |
ENST00000452621.2
|
RCOR3
|
REST corepressor 3 |
| chr1_-_109825751 | 0.42 |
ENST00000369907.3
ENST00000438534.2 ENST00000369909.2 ENST00000409138.2 |
PSRC1
|
proline/serine-rich coiled-coil 1 |
| chr11_-_7041466 | 0.42 |
ENST00000536068.1
ENST00000278314.4 |
ZNF214
|
zinc finger protein 214 |
| chr5_+_95998070 | 0.42 |
ENST00000421689.2
ENST00000510756.1 ENST00000512620.1 |
CAST
|
calpastatin |
| chr16_+_19729586 | 0.41 |
ENST00000564186.1
ENST00000541926.1 ENST00000433597.2 |
IQCK
|
IQ motif containing K |
| chr9_+_2621950 | 0.41 |
ENST00000382096.1
|
VLDLR
|
very low density lipoprotein receptor |
| chr12_+_105724613 | 0.41 |
ENST00000549934.2
|
C12orf75
|
chromosome 12 open reading frame 75 |
| chr1_-_98510843 | 0.41 |
ENST00000413670.2
ENST00000538428.1 |
MIR137HG
|
MIR137 host gene (non-protein coding) |
| chr2_-_219433014 | 0.40 |
ENST00000418019.1
ENST00000454775.1 ENST00000338465.5 ENST00000415516.1 ENST00000258399.3 |
USP37
|
ubiquitin specific peptidase 37 |
| chrX_-_117250740 | 0.40 |
ENST00000371882.1
ENST00000540167.1 ENST00000545703.1 |
KLHL13
|
kelch-like family member 13 |
| chr5_-_81046922 | 0.40 |
ENST00000514493.1
ENST00000320672.4 |
SSBP2
|
single-stranded DNA binding protein 2 |
| chr11_-_72853267 | 0.40 |
ENST00000409418.4
|
FCHSD2
|
FCH and double SH3 domains 2 |
| chr11_-_77122928 | 0.40 |
ENST00000528203.1
ENST00000528592.1 ENST00000528633.1 ENST00000529248.1 |
PAK1
|
p21 protein (Cdc42/Rac)-activated kinase 1 |
| chr7_-_152373216 | 0.40 |
ENST00000359321.1
|
XRCC2
|
X-ray repair complementing defective repair in Chinese hamster cells 2 |
| chr11_-_61196858 | 0.39 |
ENST00000413184.2
|
CPSF7
|
cleavage and polyadenylation specific factor 7, 59kDa |
| chr11_-_46142505 | 0.39 |
ENST00000524497.1
ENST00000418153.2 |
PHF21A
|
PHD finger protein 21A |
| chr7_-_105752651 | 0.39 |
ENST00000470347.1
ENST00000455385.2 |
SYPL1
|
synaptophysin-like 1 |
| chr17_+_5389605 | 0.38 |
ENST00000576988.1
ENST00000576570.1 ENST00000573759.1 |
MIS12
|
MIS12 kinetochore complex component |
| chr16_-_54963026 | 0.38 |
ENST00000560208.1
ENST00000557792.1 |
CRNDE
|
colorectal neoplasia differentially expressed (non-protein coding) |
| chr1_-_245026388 | 0.38 |
ENST00000440865.1
|
HNRNPU
|
heterogeneous nuclear ribonucleoprotein U (scaffold attachment factor A) |
| chr7_-_121036337 | 0.38 |
ENST00000426156.1
ENST00000359943.3 ENST00000412653.1 |
FAM3C
|
family with sequence similarity 3, member C |
| chr9_+_74526532 | 0.38 |
ENST00000486911.2
|
C9orf85
|
chromosome 9 open reading frame 85 |
| chr10_+_35416223 | 0.38 |
ENST00000489321.1
ENST00000427847.2 ENST00000345491.3 ENST00000395895.2 ENST00000374728.3 ENST00000487132.1 |
CREM
|
cAMP responsive element modulator |
| chr22_-_39096925 | 0.37 |
ENST00000456626.1
ENST00000412832.1 |
JOSD1
|
Josephin domain containing 1 |
| chr6_+_144606817 | 0.37 |
ENST00000433557.1
|
UTRN
|
utrophin |
| chr2_+_63816126 | 0.37 |
ENST00000454035.1
|
MDH1
|
malate dehydrogenase 1, NAD (soluble) |
| chr5_-_142784003 | 0.37 |
ENST00000416954.2
|
NR3C1
|
nuclear receptor subfamily 3, group C, member 1 (glucocorticoid receptor) |
| chr2_+_44396000 | 0.37 |
ENST00000409895.4
ENST00000409432.3 ENST00000282412.4 ENST00000378551.2 ENST00000345249.4 |
PPM1B
|
protein phosphatase, Mg2+/Mn2+ dependent, 1B |
| chr11_+_124824000 | 0.37 |
ENST00000529051.1
ENST00000344762.5 |
CCDC15
|
coiled-coil domain containing 15 |
| chr1_-_109825719 | 0.37 |
ENST00000369904.3
ENST00000369903.2 ENST00000429031.1 ENST00000418914.2 ENST00000409267.1 |
PSRC1
|
proline/serine-rich coiled-coil 1 |
| chr3_-_27525826 | 0.37 |
ENST00000454389.1
ENST00000440156.1 ENST00000437179.1 ENST00000446700.1 ENST00000455077.1 ENST00000435667.2 ENST00000388777.4 ENST00000425128.2 |
SLC4A7
|
solute carrier family 4, sodium bicarbonate cotransporter, member 7 |
| chr10_-_103535657 | 0.36 |
ENST00000344255.3
ENST00000320185.2 ENST00000346714.3 ENST00000347978.2 |
FGF8
|
fibroblast growth factor 8 (androgen-induced) |
| chr19_-_6110474 | 0.36 |
ENST00000587181.1
ENST00000587321.1 ENST00000586806.1 ENST00000589742.1 ENST00000592546.1 ENST00000303657.5 |
RFX2
|
regulatory factor X, 2 (influences HLA class II expression) |
| chr2_+_198365095 | 0.36 |
ENST00000409468.1
|
HSPE1
|
heat shock 10kDa protein 1 |
| chrX_-_80377162 | 0.36 |
ENST00000430960.1
ENST00000447319.1 |
HMGN5
|
high mobility group nucleosome binding domain 5 |
| chr1_-_113161730 | 0.36 |
ENST00000544629.1
ENST00000543570.1 ENST00000360743.4 ENST00000490067.1 ENST00000343210.7 ENST00000369666.1 |
ST7L
|
suppression of tumorigenicity 7 like |
| chr6_-_75953484 | 0.36 |
ENST00000472311.2
ENST00000460985.1 ENST00000377978.3 ENST00000509698.1 ENST00000230459.4 ENST00000370089.2 |
COX7A2
|
cytochrome c oxidase subunit VIIa polypeptide 2 (liver) |
| chr2_+_112895939 | 0.35 |
ENST00000331203.2
ENST00000409903.1 ENST00000409667.3 ENST00000409450.3 |
FBLN7
|
fibulin 7 |
| chr10_-_22292675 | 0.35 |
ENST00000376946.1
|
DNAJC1
|
DnaJ (Hsp40) homolog, subfamily C, member 1 |
| chr14_-_81902516 | 0.35 |
ENST00000554710.1
|
STON2
|
stonin 2 |
| chr3_-_52719888 | 0.35 |
ENST00000458294.1
|
PBRM1
|
polybromo 1 |
| chr15_+_66585555 | 0.35 |
ENST00000319194.5
ENST00000525134.2 ENST00000441424.2 |
DIS3L
|
DIS3 mitotic control homolog (S. cerevisiae)-like |
| chr18_-_658244 | 0.35 |
ENST00000585033.1
ENST00000323813.3 |
C18orf56
|
chromosome 18 open reading frame 56 |
| chr17_+_2496971 | 0.34 |
ENST00000397195.5
|
PAFAH1B1
|
platelet-activating factor acetylhydrolase 1b, regulatory subunit 1 (45kDa) |
| chr19_+_47760777 | 0.34 |
ENST00000599398.1
ENST00000595659.1 |
CCDC9
|
coiled-coil domain containing 9 |
| chr8_+_96146168 | 0.34 |
ENST00000519516.1
|
PLEKHF2
|
pleckstrin homology domain containing, family F (with FYVE domain) member 2 |
| chr16_-_75498450 | 0.34 |
ENST00000566594.1
|
RP11-77K12.1
|
Uncharacterized protein |
| chr14_+_36295638 | 0.34 |
ENST00000543183.1
|
BRMS1L
|
breast cancer metastasis-suppressor 1-like |
| chr5_-_36242119 | 0.34 |
ENST00000511088.1
ENST00000282512.3 ENST00000506945.1 |
NADK2
|
NAD kinase 2, mitochondrial |
| chr9_+_131452239 | 0.34 |
ENST00000372688.4
ENST00000372686.5 |
SET
|
SET nuclear oncogene |
| chr11_-_125932685 | 0.34 |
ENST00000527967.1
|
CDON
|
cell adhesion associated, oncogene regulated |
| chr2_-_202645612 | 0.33 |
ENST00000409632.2
ENST00000410052.1 ENST00000467448.1 |
ALS2
|
amyotrophic lateral sclerosis 2 (juvenile) |
| chr6_-_17706618 | 0.33 |
ENST00000262077.2
ENST00000537253.1 |
NUP153
|
nucleoporin 153kDa |
| chr9_+_74526384 | 0.33 |
ENST00000334731.2
ENST00000377031.3 |
C9orf85
|
chromosome 9 open reading frame 85 |
| chrX_+_118370288 | 0.33 |
ENST00000535419.1
|
PGRMC1
|
progesterone receptor membrane component 1 |
| chr2_+_48667898 | 0.33 |
ENST00000281394.4
ENST00000294952.8 |
PPP1R21
|
protein phosphatase 1, regulatory subunit 21 |
| chr9_-_115249484 | 0.33 |
ENST00000457681.1
|
C9orf147
|
chromosome 9 open reading frame 147 |
| chr5_-_36241900 | 0.33 |
ENST00000381937.4
ENST00000514504.1 |
NADK2
|
NAD kinase 2, mitochondrial |
| chr3_-_17783990 | 0.33 |
ENST00000429383.4
ENST00000446863.1 ENST00000414349.1 ENST00000428355.1 ENST00000425944.1 ENST00000445294.1 ENST00000444471.1 ENST00000415814.2 |
TBC1D5
|
TBC1 domain family, member 5 |
| chr14_+_21566980 | 0.33 |
ENST00000418511.2
ENST00000554329.2 |
TMEM253
|
transmembrane protein 253 |
| chr6_+_149068464 | 0.33 |
ENST00000367463.4
|
UST
|
uronyl-2-sulfotransferase |
| chr2_+_159313452 | 0.33 |
ENST00000389757.3
ENST00000389759.3 |
PKP4
|
plakophilin 4 |
| chr12_-_56881874 | 0.32 |
ENST00000539272.1
|
GLS2
|
glutaminase 2 (liver, mitochondrial) |
| chr16_+_21610879 | 0.32 |
ENST00000396014.4
|
METTL9
|
methyltransferase like 9 |
| chr8_-_67525473 | 0.32 |
ENST00000522677.3
|
MYBL1
|
v-myb avian myeloblastosis viral oncogene homolog-like 1 |
| chr19_-_14064114 | 0.32 |
ENST00000585607.1
ENST00000538517.2 ENST00000587458.1 ENST00000538371.2 |
PODNL1
|
podocan-like 1 |
| chr8_-_80680078 | 0.32 |
ENST00000337919.5
ENST00000354724.3 |
HEY1
|
hes-related family bHLH transcription factor with YRPW motif 1 |
| chr22_-_41842781 | 0.32 |
ENST00000434408.1
|
TOB2
|
transducer of ERBB2, 2 |
| chr1_+_185014647 | 0.31 |
ENST00000367509.4
|
RNF2
|
ring finger protein 2 |
| chr9_+_131451480 | 0.31 |
ENST00000322030.8
|
SET
|
SET nuclear oncogene |
| chr5_+_95997885 | 0.31 |
ENST00000511097.2
|
CAST
|
calpastatin |
| chr12_-_113658892 | 0.31 |
ENST00000299732.2
ENST00000416617.2 |
IQCD
|
IQ motif containing D |
| chr10_+_21823079 | 0.31 |
ENST00000377100.3
ENST00000377072.3 ENST00000446906.2 |
MLLT10
|
myeloid/lymphoid or mixed-lineage leukemia (trithorax homolog, Drosophila); translocated to, 10 |
| chr6_-_111804905 | 0.31 |
ENST00000358835.3
ENST00000435970.1 |
REV3L
|
REV3-like, polymerase (DNA directed), zeta, catalytic subunit |
| chr2_+_204193101 | 0.31 |
ENST00000430418.1
ENST00000424558.1 ENST00000261016.6 |
ABI2
|
abl-interactor 2 |
| chr20_-_271304 | 0.31 |
ENST00000400269.3
ENST00000360321.2 |
C20orf96
|
chromosome 20 open reading frame 96 |
| chr12_-_51785083 | 0.31 |
ENST00000603563.1
|
GALNT6
|
UDP-N-acetyl-alpha-D-galactosamine:polypeptide N-acetylgalactosaminyltransferase 6 (GalNAc-T6) |
| chr1_+_6845578 | 0.31 |
ENST00000467404.2
ENST00000439411.2 |
CAMTA1
|
calmodulin binding transcription activator 1 |
| chrX_-_47509994 | 0.31 |
ENST00000343894.4
|
ELK1
|
ELK1, member of ETS oncogene family |
| chr1_+_95583479 | 0.31 |
ENST00000455656.1
ENST00000604534.1 |
TMEM56
RP11-57H12.6
|
transmembrane protein 56 TMEM56-RWDD3 readthrough |
| chr1_-_113162040 | 0.31 |
ENST00000358039.4
ENST00000369668.2 |
ST7L
|
suppression of tumorigenicity 7 like |
| chr17_-_56065540 | 0.31 |
ENST00000583932.1
|
VEZF1
|
vascular endothelial zinc finger 1 |
| chr1_+_226250379 | 0.31 |
ENST00000366815.3
ENST00000366814.3 |
H3F3A
|
H3 histone, family 3A |
| chr3_-_51533966 | 0.31 |
ENST00000504652.1
|
VPRBP
|
Vpr (HIV-1) binding protein |
| chr14_+_36295504 | 0.30 |
ENST00000216807.7
|
BRMS1L
|
breast cancer metastasis-suppressor 1-like |
| chr14_-_45603657 | 0.30 |
ENST00000396062.3
|
FKBP3
|
FK506 binding protein 3, 25kDa |
| chr3_-_52312337 | 0.30 |
ENST00000469000.1
|
WDR82
|
WD repeat domain 82 |
| chr12_-_48499591 | 0.30 |
ENST00000551330.1
ENST00000004980.5 ENST00000339976.6 ENST00000448372.1 |
SENP1
|
SUMO1/sentrin specific peptidase 1 |
| chrX_-_106243451 | 0.30 |
ENST00000355610.4
ENST00000535534.1 |
MORC4
|
MORC family CW-type zinc finger 4 |
| chr14_+_94640671 | 0.30 |
ENST00000328839.3
|
PPP4R4
|
protein phosphatase 4, regulatory subunit 4 |
| chr9_+_86595626 | 0.30 |
ENST00000445877.1
ENST00000325875.3 |
RMI1
|
RecQ mediated genome instability 1 |
| chr7_-_105752971 | 0.30 |
ENST00000011473.2
|
SYPL1
|
synaptophysin-like 1 |
| chr2_+_9563769 | 0.30 |
ENST00000475482.1
|
CPSF3
|
cleavage and polyadenylation specific factor 3, 73kDa |
| chr17_+_2264983 | 0.30 |
ENST00000574650.1
|
SGSM2
|
small G protein signaling modulator 2 |
| chr11_+_65769946 | 0.30 |
ENST00000533166.1
|
BANF1
|
barrier to autointegration factor 1 |
| chr11_-_46142948 | 0.30 |
ENST00000257821.4
|
PHF21A
|
PHD finger protein 21A |
| chr3_+_119187785 | 0.29 |
ENST00000295588.4
ENST00000476573.1 |
POGLUT1
|
protein O-glucosyltransferase 1 |
| chr2_+_29033682 | 0.29 |
ENST00000379579.4
ENST00000334056.5 ENST00000449210.1 |
SPDYA
|
speedy/RINGO cell cycle regulator family member A |
| chr6_-_31514516 | 0.29 |
ENST00000303892.5
ENST00000483251.1 |
ATP6V1G2
|
ATPase, H+ transporting, lysosomal 13kDa, V1 subunit G2 |
| chr2_-_166650700 | 0.29 |
ENST00000422973.1
|
GALNT3
|
UDP-N-acetyl-alpha-D-galactosamine:polypeptide N-acetylgalactosaminyltransferase 3 (GalNAc-T3) |
| chr10_+_70661014 | 0.29 |
ENST00000373585.3
|
DDX50
|
DEAD (Asp-Glu-Ala-Asp) box polypeptide 50 |
| chr17_-_30185971 | 0.29 |
ENST00000378634.2
|
COPRS
|
coordinator of PRMT5, differentiation stimulator |
| chr11_-_77123065 | 0.29 |
ENST00000530617.1
|
PAK1
|
p21 protein (Cdc42/Rac)-activated kinase 1 |
| chr5_+_95997918 | 0.29 |
ENST00000395812.2
ENST00000395813.1 ENST00000359176.4 ENST00000325674.7 |
CAST
|
calpastatin |
| chr2_+_238600788 | 0.29 |
ENST00000289175.6
ENST00000244815.5 |
LRRFIP1
|
leucine rich repeat (in FLII) interacting protein 1 |
| chr8_+_103876528 | 0.29 |
ENST00000522939.1
ENST00000524007.1 |
KB-1507C5.2
|
HCG15011, isoform CRA_a; Protein LOC100996457 |
| chr8_+_26240666 | 0.28 |
ENST00000523949.1
|
BNIP3L
|
BCL2/adenovirus E1B 19kDa interacting protein 3-like |
| chr4_+_39640787 | 0.28 |
ENST00000532680.1
|
RP11-539G18.2
|
RP11-539G18.2 |
| chr14_-_54420133 | 0.28 |
ENST00000559501.1
ENST00000558984.1 |
BMP4
|
bone morphogenetic protein 4 |
| chr5_-_55008136 | 0.28 |
ENST00000503891.1
ENST00000507109.1 |
SLC38A9
|
solute carrier family 38, member 9 |
| chr7_-_98030360 | 0.28 |
ENST00000005260.8
|
BAIAP2L1
|
BAI1-associated protein 2-like 1 |
| chr15_+_42867857 | 0.28 |
ENST00000290607.7
|
STARD9
|
StAR-related lipid transfer (START) domain containing 9 |
| chr8_-_67525524 | 0.28 |
ENST00000517885.1
|
MYBL1
|
v-myb avian myeloblastosis viral oncogene homolog-like 1 |
| chr8_-_144099795 | 0.28 |
ENST00000522060.1
ENST00000517833.1 ENST00000502167.2 ENST00000518831.1 |
RP11-273G15.2
|
RP11-273G15.2 |
| chr4_+_6784358 | 0.28 |
ENST00000508423.1
|
KIAA0232
|
KIAA0232 |
| chr17_-_43045439 | 0.28 |
ENST00000253407.3
|
C1QL1
|
complement component 1, q subcomponent-like 1 |
| chr15_+_93426514 | 0.28 |
ENST00000556722.1
|
CHD2
|
chromodomain helicase DNA binding protein 2 |
| chr1_-_53833812 | 0.28 |
ENST00000449958.1
|
RP11-117D22.2
|
RP11-117D22.2 |
| chr4_-_102268484 | 0.28 |
ENST00000394853.4
|
PPP3CA
|
protein phosphatase 3, catalytic subunit, alpha isozyme |
| chr19_-_39340563 | 0.27 |
ENST00000601813.1
|
HNRNPL
|
heterogeneous nuclear ribonucleoprotein L |
| chr2_-_240322685 | 0.27 |
ENST00000544989.1
|
HDAC4
|
histone deacetylase 4 |
| chr16_-_81129845 | 0.27 |
ENST00000569885.1
ENST00000566566.1 |
GCSH
|
glycine cleavage system protein H (aminomethyl carrier) |
| chr1_+_179263308 | 0.27 |
ENST00000426956.1
|
SOAT1
|
sterol O-acyltransferase 1 |
| chr18_+_29078131 | 0.27 |
ENST00000585206.1
|
DSG2
|
desmoglein 2 |
| chr9_+_127631399 | 0.27 |
ENST00000259477.6
|
ARPC5L
|
actin related protein 2/3 complex, subunit 5-like |
| chr1_-_32403370 | 0.27 |
ENST00000534796.1
|
PTP4A2
|
protein tyrosine phosphatase type IVA, member 2 |
| chr11_+_117198801 | 0.27 |
ENST00000527609.1
ENST00000533570.1 |
CEP164
|
centrosomal protein 164kDa |
| chr17_+_76183398 | 0.27 |
ENST00000409257.5
|
AFMID
|
arylformamidase |
| chrX_-_153141783 | 0.27 |
ENST00000458029.1
|
L1CAM
|
L1 cell adhesion molecule |
| chr17_-_58469687 | 0.27 |
ENST00000590133.1
|
USP32
|
ubiquitin specific peptidase 32 |
| chr15_+_96904487 | 0.27 |
ENST00000600790.1
|
AC087477.1
|
Uncharacterized protein |
| chr5_+_126112794 | 0.27 |
ENST00000261366.5
ENST00000395354.1 |
LMNB1
|
lamin B1 |
| chr9_-_15510989 | 0.27 |
ENST00000380715.1
ENST00000380716.4 ENST00000380738.4 ENST00000380733.4 |
PSIP1
|
PC4 and SFRS1 interacting protein 1 |
| chr10_-_75351088 | 0.27 |
ENST00000451492.1
ENST00000413442.1 |
USP54
|
ubiquitin specific peptidase 54 |
| chr14_+_100070869 | 0.27 |
ENST00000502101.2
|
RP11-543C4.1
|
RP11-543C4.1 |
| chr4_-_165898768 | 0.27 |
ENST00000329314.5
|
TRIM61
|
tripartite motif containing 61 |
| chr20_-_55841662 | 0.27 |
ENST00000395863.3
ENST00000450594.2 |
BMP7
|
bone morphogenetic protein 7 |
| chr2_+_88991162 | 0.27 |
ENST00000283646.4
|
RPIA
|
ribose 5-phosphate isomerase A |
| chr2_+_201936458 | 0.27 |
ENST00000237889.4
|
NDUFB3
|
NADH dehydrogenase (ubiquinone) 1 beta subcomplex, 3, 12kDa |
| chr9_+_136243117 | 0.26 |
ENST00000426926.2
ENST00000371957.3 |
C9orf96
|
chromosome 9 open reading frame 96 |
| chrX_-_80377118 | 0.26 |
ENST00000373250.3
|
HMGN5
|
high mobility group nucleosome binding domain 5 |
| chr1_+_184356188 | 0.26 |
ENST00000235307.6
|
C1orf21
|
chromosome 1 open reading frame 21 |
| chr5_-_56248030 | 0.26 |
ENST00000336942.5
|
MIER3
|
mesoderm induction early response 1, family member 3 |
| chr1_-_36235529 | 0.26 |
ENST00000318121.3
ENST00000373220.3 ENST00000520551.1 |
CLSPN
|
claspin |
| chr21_+_35445811 | 0.26 |
ENST00000399312.2
|
MRPS6
|
mitochondrial ribosomal protein S6 |
| chr2_-_40679148 | 0.26 |
ENST00000417271.1
|
SLC8A1
|
solute carrier family 8 (sodium/calcium exchanger), member 1 |
| chr16_+_2198604 | 0.26 |
ENST00000210187.6
|
RAB26
|
RAB26, member RAS oncogene family |
| chr16_-_54962625 | 0.26 |
ENST00000559432.1
|
CRNDE
|
colorectal neoplasia differentially expressed (non-protein coding) |
| chr12_+_6309517 | 0.26 |
ENST00000382519.4
ENST00000009180.4 |
CD9
|
CD9 molecule |
| chr15_+_51973550 | 0.26 |
ENST00000220478.3
|
SCG3
|
secretogranin III |
| chr19_-_55881741 | 0.26 |
ENST00000264563.2
ENST00000590625.1 ENST00000585513.1 |
IL11
|
interleukin 11 |
| chr8_+_95653373 | 0.26 |
ENST00000358397.5
|
ESRP1
|
epithelial splicing regulatory protein 1 |
| chr1_+_60280458 | 0.26 |
ENST00000455990.1
ENST00000371208.3 |
HOOK1
|
hook microtubule-tethering protein 1 |
| chr12_+_50101500 | 0.26 |
ENST00000548809.1
ENST00000551154.1 |
TMBIM6
|
transmembrane BAX inhibitor motif containing 6 |
| chr1_-_212873267 | 0.26 |
ENST00000243440.1
|
BATF3
|
basic leucine zipper transcription factor, ATF-like 3 |
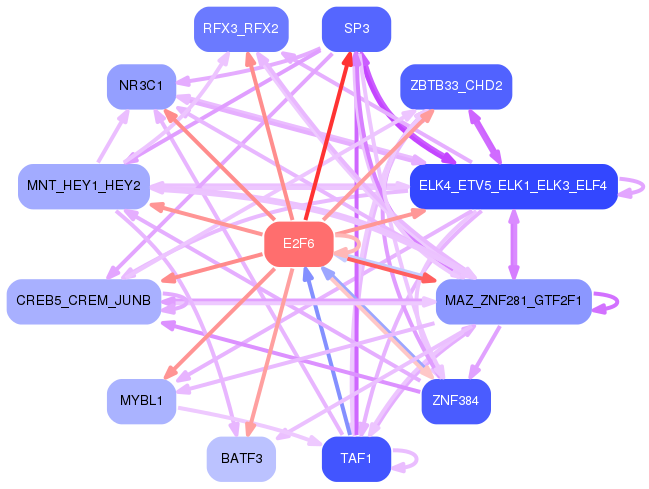
Network of associatons between targets according to the STRING database.

First level regulatory network of E2F6
Gene Ontology Analysis
Gene overrepresentation in biological_process category:
| Log-likelihood per target | Total log-likelihood | Term | Description |
|---|---|---|---|
| 0.2 | 0.5 | GO:0044830 | modulation by host of viral RNA genome replication(GO:0044830) positive regulation of intracellular transport of viral material(GO:1901254) |
| 0.2 | 0.2 | GO:0071283 | cellular response to iron(III) ion(GO:0071283) |
| 0.2 | 0.6 | GO:0003164 | His-Purkinje system development(GO:0003164) |
| 0.1 | 0.4 | GO:1905069 | allantois development(GO:1905069) |
| 0.1 | 0.4 | GO:1903461 | Okazaki fragment processing involved in mitotic DNA replication(GO:1903461) |
| 0.1 | 0.5 | GO:0060623 | regulation of chromosome condensation(GO:0060623) |
| 0.1 | 0.4 | GO:2000301 | negative regulation of synaptic vesicle exocytosis(GO:2000301) |
| 0.1 | 1.0 | GO:0018242 | protein O-linked glycosylation via serine(GO:0018242) |
| 0.1 | 1.1 | GO:0060136 | embryonic process involved in female pregnancy(GO:0060136) |
| 0.1 | 0.4 | GO:1902303 | negative regulation of potassium ion export(GO:1902303) |
| 0.1 | 0.9 | GO:0006499 | N-terminal protein myristoylation(GO:0006499) |
| 0.1 | 0.3 | GO:2001247 | positive regulation of phosphatidylcholine biosynthetic process(GO:2001247) |
| 0.1 | 0.5 | GO:0033563 | dorsal/ventral axon guidance(GO:0033563) |
| 0.1 | 0.7 | GO:1903588 | negative regulation of blood vessel endothelial cell proliferation involved in sprouting angiogenesis(GO:1903588) |
| 0.1 | 0.3 | GO:0035022 | positive regulation of Rac protein signal transduction(GO:0035022) |
| 0.1 | 0.3 | GO:0046832 | negative regulation of nucleobase-containing compound transport(GO:0032240) negative regulation of RNA export from nucleus(GO:0046832) |
| 0.1 | 0.2 | GO:0060434 | bronchus morphogenesis(GO:0060434) |
| 0.1 | 1.1 | GO:0060244 | negative regulation of cell proliferation involved in contact inhibition(GO:0060244) |
| 0.1 | 0.2 | GO:0032786 | positive regulation of DNA-templated transcription, elongation(GO:0032786) |
| 0.1 | 0.3 | GO:0045212 | negative regulation of synaptic transmission, cholinergic(GO:0032223) neurotransmitter receptor biosynthetic process(GO:0045212) |
| 0.1 | 0.9 | GO:1904636 | response to ionomycin(GO:1904636) cellular response to ionomycin(GO:1904637) |
| 0.1 | 0.4 | GO:0010615 | positive regulation of cardiac muscle adaptation(GO:0010615) positive regulation of cardiac muscle hypertrophy in response to stress(GO:1903244) positive regulation of connective tissue replacement(GO:1905205) |
| 0.1 | 0.4 | GO:1903566 | positive regulation of protein localization to cilium(GO:1903566) |
| 0.1 | 1.0 | GO:0010724 | regulation of definitive erythrocyte differentiation(GO:0010724) |
| 0.1 | 0.6 | GO:0010166 | wax biosynthetic process(GO:0010025) wax metabolic process(GO:0010166) |
| 0.1 | 0.3 | GO:0099558 | maintenance of synapse structure(GO:0099558) |
| 0.1 | 0.4 | GO:0060392 | negative regulation of SMAD protein import into nucleus(GO:0060392) |
| 0.1 | 0.3 | GO:0032877 | positive regulation of DNA endoreduplication(GO:0032877) |
| 0.1 | 0.1 | GO:1904954 | canonical Wnt signaling pathway involved in midbrain dopaminergic neuron differentiation(GO:1904954) |
| 0.1 | 0.1 | GO:1904976 | response to bleomycin(GO:1904975) cellular response to bleomycin(GO:1904976) |
| 0.1 | 0.4 | GO:0048390 | apoptotic process involved in endocardial cushion morphogenesis(GO:0003277) intermediate mesoderm morphogenesis(GO:0048390) intermediate mesoderm formation(GO:0048391) intermediate mesodermal cell differentiation(GO:0048392) regulation of cardiac muscle fiber development(GO:0055018) positive regulation of cardiac muscle fiber development(GO:0055020) bud dilation involved in lung branching(GO:0060503) BMP signaling pathway involved in ureter morphogenesis(GO:0061149) renal system segmentation(GO:0061150) BMP signaling pathway involved in renal system segmentation(GO:0061151) pulmonary artery endothelial tube morphogenesis(GO:0061155) regulation of transcription from RNA polymerase II promoter involved in mesonephros development(GO:0061216) BMP signaling pathway involved in nephric duct formation(GO:0071893) negative regulation of branch elongation involved in ureteric bud branching(GO:0072096) negative regulation of branch elongation involved in ureteric bud branching by BMP signaling pathway(GO:0072097) anterior/posterior pattern specification involved in ureteric bud development(GO:0072099) specification of ureteric bud anterior/posterior symmetry(GO:0072100) specification of ureteric bud anterior/posterior symmetry by BMP signaling pathway(GO:0072101) ureter epithelial cell differentiation(GO:0072192) negative regulation of mesenchymal cell proliferation involved in ureter development(GO:0072200) positive regulation of cell proliferation involved in outflow tract morphogenesis(GO:1901964) cardiac jelly development(GO:1905072) regulation of metanephric S-shaped body morphogenesis(GO:2000004) negative regulation of metanephric S-shaped body morphogenesis(GO:2000005) regulation of metanephric comma-shaped body morphogenesis(GO:2000006) negative regulation of metanephric comma-shaped body morphogenesis(GO:2000007) |
| 0.1 | 0.7 | GO:0090116 | DNA methylation on cytosine(GO:0032776) C-5 methylation of cytosine(GO:0090116) |
| 0.1 | 0.7 | GO:0006741 | NADP biosynthetic process(GO:0006741) |
| 0.1 | 0.5 | GO:0061441 | renal artery morphogenesis(GO:0061441) |
| 0.1 | 0.8 | GO:0048386 | positive regulation of retinoic acid receptor signaling pathway(GO:0048386) |
| 0.1 | 0.2 | GO:0098939 | dendritic transport of mitochondrion(GO:0098939) anterograde dendritic transport of mitochondrion(GO:0098972) |
| 0.1 | 0.7 | GO:0003065 | positive regulation of heart rate by epinephrine(GO:0003065) |
| 0.1 | 0.3 | GO:0035948 | positive regulation of gluconeogenesis by positive regulation of transcription from RNA polymerase II promoter(GO:0035948) |
| 0.1 | 0.2 | GO:0021882 | regulation of transcription from RNA polymerase II promoter involved in forebrain neuron fate commitment(GO:0021882) cerebral cortex GABAergic interneuron fate commitment(GO:0021893) positive regulation of neural retina development(GO:0061075) positive regulation of retina development in camera-type eye(GO:1902868) positive regulation of amacrine cell differentiation(GO:1902871) |
| 0.1 | 0.2 | GO:0003072 | regulation of blood vessel size by renin-angiotensin(GO:0002034) renal control of peripheral vascular resistance involved in regulation of systemic arterial blood pressure(GO:0003072) |
| 0.1 | 0.5 | GO:0061343 | cell adhesion involved in heart morphogenesis(GO:0061343) |
| 0.1 | 0.2 | GO:0007387 | anterior compartment pattern formation(GO:0007387) posterior compartment specification(GO:0007388) |
| 0.1 | 0.5 | GO:0006543 | glutamine catabolic process(GO:0006543) |
| 0.1 | 0.5 | GO:0034436 | glycoprotein transport(GO:0034436) |
| 0.1 | 0.2 | GO:0031204 | posttranslational protein targeting to membrane, translocation(GO:0031204) |
| 0.1 | 0.2 | GO:0035508 | positive regulation of myosin-light-chain-phosphatase activity(GO:0035508) |
| 0.1 | 0.3 | GO:0021834 | chemorepulsion involved in embryonic olfactory bulb interneuron precursor migration(GO:0021834) |
| 0.1 | 0.3 | GO:0097010 | eukaryotic translation initiation factor 4F complex assembly(GO:0097010) |
| 0.1 | 0.6 | GO:0060282 | positive regulation of oocyte development(GO:0060282) |
| 0.1 | 0.3 | GO:0035711 | plasmacytoid dendritic cell activation(GO:0002270) regulation of restriction endodeoxyribonuclease activity(GO:0032072) T-helper 1 cell activation(GO:0035711) |
| 0.1 | 0.4 | GO:0036353 | histone H2A-K119 monoubiquitination(GO:0036353) |
| 0.1 | 0.3 | GO:0051088 | PMA-inducible membrane protein ectodomain proteolysis(GO:0051088) |
| 0.1 | 1.0 | GO:0043402 | glucocorticoid mediated signaling pathway(GO:0043402) |
| 0.1 | 0.1 | GO:0051149 | positive regulation of muscle cell differentiation(GO:0051149) |
| 0.1 | 0.5 | GO:1902963 | regulation of metalloendopeptidase activity involved in amyloid precursor protein catabolic process(GO:1902962) negative regulation of metalloendopeptidase activity involved in amyloid precursor protein catabolic process(GO:1902963) |
| 0.1 | 0.5 | GO:0031438 | negative regulation of mRNA cleavage(GO:0031438) negative regulation of mRNA endonucleolytic cleavage involved in unfolded protein response(GO:1904721) |
| 0.1 | 0.1 | GO:0033023 | mast cell homeostasis(GO:0033023) mast cell apoptotic process(GO:0033024) regulation of mast cell apoptotic process(GO:0033025) |
| 0.1 | 0.3 | GO:1903722 | negative regulation of exosomal secretion(GO:1903542) regulation of centriole elongation(GO:1903722) |
| 0.1 | 0.9 | GO:2000601 | positive regulation of Arp2/3 complex-mediated actin nucleation(GO:2000601) |
| 0.1 | 0.3 | GO:1902725 | negative regulation of satellite cell differentiation(GO:1902725) |
| 0.1 | 0.3 | GO:0014816 | skeletal muscle satellite cell differentiation(GO:0014816) |
| 0.1 | 1.2 | GO:2000675 | negative regulation of type B pancreatic cell apoptotic process(GO:2000675) |
| 0.1 | 0.5 | GO:1901189 | positive regulation of ephrin receptor signaling pathway(GO:1901189) positive regulation of canonical Wnt signaling pathway involved in cardiac muscle cell fate commitment(GO:1901297) positive regulation of canonical Wnt signaling pathway involved in heart development(GO:1905068) |
| 0.1 | 0.1 | GO:0046619 | optic placode formation involved in camera-type eye formation(GO:0046619) |
| 0.1 | 0.1 | GO:1904640 | response to methionine(GO:1904640) |
| 0.1 | 0.2 | GO:0070632 | spindle pole body duplication(GO:0030474) spindle pole body organization(GO:0051300) spindle pole body localization(GO:0070631) establishment of spindle pole body localization(GO:0070632) spindle pole body localization to nuclear envelope(GO:0071789) establishment of spindle pole body localization to nuclear envelope(GO:0071790) |
| 0.1 | 0.6 | GO:0033183 | negative regulation of histone ubiquitination(GO:0033183) regulation of histone H2A K63-linked ubiquitination(GO:1901314) negative regulation of histone H2A K63-linked ubiquitination(GO:1901315) |
| 0.1 | 0.9 | GO:0006108 | malate metabolic process(GO:0006108) |
| 0.1 | 0.2 | GO:0045653 | negative regulation of megakaryocyte differentiation(GO:0045653) |
| 0.1 | 0.2 | GO:0021919 | BMP signaling pathway involved in spinal cord dorsal/ventral patterning(GO:0021919) |
| 0.1 | 0.4 | GO:0034670 | chemotaxis to arachidonic acid(GO:0034670) response to arachidonic acid(GO:1904550) |
| 0.1 | 0.2 | GO:1904562 | phosphatidylinositol 5-phosphate metabolic process(GO:1904562) |
| 0.1 | 0.1 | GO:0043569 | negative regulation of insulin-like growth factor receptor signaling pathway(GO:0043569) |
| 0.1 | 0.1 | GO:1902463 | protein localization to cell leading edge(GO:1902463) |
| 0.1 | 0.3 | GO:0016476 | regulation of embryonic cell shape(GO:0016476) |
| 0.1 | 0.5 | GO:0035694 | mitochondrial protein catabolic process(GO:0035694) |
| 0.1 | 0.6 | GO:0006398 | mRNA 3'-end processing by stem-loop binding and cleavage(GO:0006398) |
| 0.1 | 1.0 | GO:0075713 | establishment of integrated proviral latency(GO:0075713) |
| 0.1 | 0.3 | GO:0019464 | glycine catabolic process(GO:0006546) glycine decarboxylation via glycine cleavage system(GO:0019464) |
| 0.1 | 0.4 | GO:1903679 | regulation of cap-independent translational initiation(GO:1903677) positive regulation of cap-independent translational initiation(GO:1903679) regulation of cytoplasmic translational initiation(GO:1904688) positive regulation of cytoplasmic translational initiation(GO:1904690) |
| 0.1 | 0.3 | GO:0060842 | arterial endothelial cell differentiation(GO:0060842) |
| 0.1 | 0.2 | GO:0007422 | peripheral nervous system development(GO:0007422) |
| 0.1 | 0.2 | GO:0034553 | respiratory chain complex II assembly(GO:0034552) mitochondrial respiratory chain complex II assembly(GO:0034553) mitochondrial respiratory chain complex II biogenesis(GO:0097032) |
| 0.1 | 0.5 | GO:0006065 | UDP-glucuronate biosynthetic process(GO:0006065) |
| 0.1 | 0.7 | GO:0043985 | histone H4-R3 methylation(GO:0043985) |
| 0.1 | 0.3 | GO:1903659 | regulation of complement-dependent cytotoxicity(GO:1903659) |
| 0.1 | 0.1 | GO:0097237 | cellular response to toxic substance(GO:0097237) |
| 0.1 | 0.3 | GO:0051944 | positive regulation of neurotransmitter uptake(GO:0051582) positive regulation of dopamine uptake involved in synaptic transmission(GO:0051586) positive regulation of catecholamine uptake involved in synaptic transmission(GO:0051944) |
| 0.1 | 0.2 | GO:0071894 | histone H2B conserved C-terminal lysine ubiquitination(GO:0071894) |
| 0.1 | 0.3 | GO:0060355 | positive regulation of cell adhesion molecule production(GO:0060355) |
| 0.1 | 0.2 | GO:2000138 | positive regulation of cell proliferation involved in heart morphogenesis(GO:2000138) |
| 0.0 | 0.1 | GO:0019858 | cytosine metabolic process(GO:0019858) |
| 0.0 | 0.3 | GO:0046469 | platelet activating factor metabolic process(GO:0046469) |
| 0.0 | 0.2 | GO:0034499 | late endosome to Golgi transport(GO:0034499) |
| 0.0 | 0.1 | GO:0051780 | mevalonate transport(GO:0015728) behavioral response to nutrient(GO:0051780) |
| 0.0 | 0.5 | GO:0010569 | regulation of double-strand break repair via homologous recombination(GO:0010569) |
| 0.0 | 0.2 | GO:0006740 | NADPH regeneration(GO:0006740) |
| 0.0 | 0.1 | GO:0070389 | chaperone cofactor-dependent protein refolding(GO:0070389) |
| 0.0 | 0.1 | GO:0034970 | histone H3-R2 methylation(GO:0034970) |
| 0.0 | 0.2 | GO:0001560 | regulation of cell growth by extracellular stimulus(GO:0001560) |
| 0.0 | 0.1 | GO:2000721 | positive regulation of transcription from RNA polymerase II promoter involved in smooth muscle cell differentiation(GO:2000721) |
| 0.0 | 0.1 | GO:0048631 | regulation of skeletal muscle tissue growth(GO:0048631) |
| 0.0 | 0.2 | GO:0046677 | response to antibiotic(GO:0046677) |
| 0.0 | 0.3 | GO:0006269 | DNA replication, synthesis of RNA primer(GO:0006269) |
| 0.0 | 0.5 | GO:0002043 | blood vessel endothelial cell proliferation involved in sprouting angiogenesis(GO:0002043) |
| 0.0 | 0.2 | GO:2001045 | negative regulation of integrin-mediated signaling pathway(GO:2001045) |
| 0.0 | 0.2 | GO:1904387 | cellular response to thyroxine stimulus(GO:0097069) cellular response to L-phenylalanine derivative(GO:1904387) |
| 0.0 | 0.4 | GO:1903867 | chorion development(GO:0060717) extraembryonic membrane development(GO:1903867) |
| 0.0 | 0.1 | GO:0003050 | regulation of systemic arterial blood pressure by atrial natriuretic peptide(GO:0003050) |
| 0.0 | 0.6 | GO:0032876 | negative regulation of DNA endoreduplication(GO:0032876) |
| 0.0 | 0.1 | GO:0032915 | positive regulation of transforming growth factor beta2 production(GO:0032915) |
| 0.0 | 0.2 | GO:1902530 | regulation of protein linear polyubiquitination(GO:1902528) positive regulation of protein linear polyubiquitination(GO:1902530) |
| 0.0 | 0.0 | GO:0021523 | somatic motor neuron differentiation(GO:0021523) |
| 0.0 | 0.4 | GO:0000710 | meiotic mismatch repair(GO:0000710) |
| 0.0 | 0.3 | GO:0035407 | histone H3-T11 phosphorylation(GO:0035407) |
| 0.0 | 0.3 | GO:0033484 | nitric oxide homeostasis(GO:0033484) |
| 0.0 | 0.4 | GO:0036444 | calcium ion transmembrane import into mitochondrion(GO:0036444) |
| 0.0 | 0.1 | GO:0007206 | phospholipase C-activating G-protein coupled glutamate receptor signaling pathway(GO:0007206) |
| 0.0 | 0.3 | GO:0006014 | D-ribose metabolic process(GO:0006014) |
| 0.0 | 0.4 | GO:0000707 | meiotic DNA recombinase assembly(GO:0000707) |
| 0.0 | 0.1 | GO:0036166 | phenotypic switching(GO:0036166) regulation of phenotypic switching(GO:1900239) |
| 0.0 | 0.1 | GO:0036388 | pre-replicative complex assembly involved in nuclear cell cycle DNA replication(GO:0006267) pre-replicative complex assembly(GO:0036388) pre-replicative complex assembly involved in cell cycle DNA replication(GO:1902299) |
| 0.0 | 0.2 | GO:0002087 | regulation of respiratory gaseous exchange by neurological system process(GO:0002087) |
| 0.0 | 0.2 | GO:0097105 | presynaptic membrane assembly(GO:0097105) |
| 0.0 | 0.3 | GO:0006880 | intracellular sequestering of iron ion(GO:0006880) sequestering of iron ion(GO:0097577) |
| 0.0 | 0.1 | GO:2000588 | positive regulation of platelet-derived growth factor receptor-beta signaling pathway(GO:2000588) |
| 0.0 | 0.1 | GO:1904049 | negative regulation of spontaneous neurotransmitter secretion(GO:1904049) |
| 0.0 | 0.1 | GO:0044209 | AMP salvage(GO:0044209) |
| 0.0 | 0.2 | GO:0060708 | spongiotrophoblast differentiation(GO:0060708) |
| 0.0 | 0.4 | GO:0060982 | coronary artery morphogenesis(GO:0060982) |
| 0.0 | 0.1 | GO:1903249 | regulation of cellular amine catabolic process(GO:0033241) negative regulation of cellular amine catabolic process(GO:0033242) negative regulation of the force of heart contraction(GO:0098736) regulation of arginine catabolic process(GO:1900081) negative regulation of arginine catabolic process(GO:1900082) regulation of citrulline biosynthetic process(GO:1903248) negative regulation of citrulline biosynthetic process(GO:1903249) negative regulation of cellular amino acid biosynthetic process(GO:2000283) |
| 0.0 | 0.2 | GO:0043983 | histone H4-K12 acetylation(GO:0043983) |
| 0.0 | 0.1 | GO:0072684 | tRNA 3'-trailer cleavage, endonucleolytic(GO:0034414) tRNA 3'-trailer cleavage(GO:0042779) mitochondrial tRNA 3'-trailer cleavage, endonucleolytic(GO:0072684) |
| 0.0 | 0.2 | GO:0051622 | negative regulation of dopamine uptake involved in synaptic transmission(GO:0051585) norepinephrine uptake(GO:0051620) regulation of norepinephrine uptake(GO:0051621) negative regulation of norepinephrine uptake(GO:0051622) negative regulation of catecholamine uptake involved in synaptic transmission(GO:0051945) regulation of glutathione peroxidase activity(GO:1903282) positive regulation of glutathione peroxidase activity(GO:1903284) positive regulation of hydrogen peroxide catabolic process(GO:1903285) positive regulation of peroxidase activity(GO:2000470) |
| 0.0 | 0.1 | GO:1904428 | negative regulation of tubulin deacetylation(GO:1904428) |
| 0.0 | 0.0 | GO:0009405 | pathogenesis(GO:0009405) |
| 0.0 | 0.2 | GO:0051835 | positive regulation of synapse structural plasticity(GO:0051835) |
| 0.0 | 0.5 | GO:0035871 | protein K11-linked deubiquitination(GO:0035871) |
| 0.0 | 0.2 | GO:0006290 | pyrimidine dimer repair(GO:0006290) |
| 0.0 | 0.1 | GO:1903966 | monounsaturated fatty acid metabolic process(GO:1903964) monounsaturated fatty acid biosynthetic process(GO:1903966) |
| 0.0 | 0.2 | GO:0050915 | sensory perception of sour taste(GO:0050915) |
| 0.0 | 0.2 | GO:0001714 | endodermal cell fate specification(GO:0001714) |
| 0.0 | 0.2 | GO:0042699 | follicle-stimulating hormone signaling pathway(GO:0042699) |
| 0.0 | 0.2 | GO:0043137 | DNA replication, removal of RNA primer(GO:0043137) mitotic telomere maintenance via semi-conservative replication(GO:1902990) |
| 0.0 | 0.1 | GO:0061582 | intestinal epithelial cell migration(GO:0061582) |
| 0.0 | 0.2 | GO:0000103 | sulfate assimilation(GO:0000103) |
| 0.0 | 0.2 | GO:1904117 | response to vasopressin(GO:1904116) cellular response to vasopressin(GO:1904117) |
| 0.0 | 0.3 | GO:1904381 | Golgi apparatus mannose trimming(GO:1904381) |
| 0.0 | 0.2 | GO:0097350 | neutrophil clearance(GO:0097350) |
| 0.0 | 0.3 | GO:0051684 | maintenance of Golgi location(GO:0051684) |
| 0.0 | 0.1 | GO:0046081 | dUTP metabolic process(GO:0046080) dUTP catabolic process(GO:0046081) |
| 0.0 | 0.1 | GO:1904048 | regulation of spontaneous neurotransmitter secretion(GO:1904048) |
| 0.0 | 0.1 | GO:0070563 | negative regulation of vitamin D receptor signaling pathway(GO:0070563) |
| 0.0 | 0.2 | GO:0007221 | positive regulation of transcription of Notch receptor target(GO:0007221) |
| 0.0 | 0.1 | GO:0061300 | cerebellum vasculature development(GO:0061300) |
| 0.0 | 0.1 | GO:0071460 | cellular response to cell-matrix adhesion(GO:0071460) |
| 0.0 | 0.1 | GO:0035441 | cell migration involved in vasculogenesis(GO:0035441) |
| 0.0 | 0.2 | GO:0043686 | co-translational protein modification(GO:0043686) |
| 0.0 | 0.1 | GO:0044537 | regulation of circulating fibrinogen levels(GO:0044537) |
| 0.0 | 0.1 | GO:0002949 | tRNA threonylcarbamoyladenosine modification(GO:0002949) |
| 0.0 | 0.4 | GO:0010032 | meiotic chromosome condensation(GO:0010032) |
| 0.0 | 0.4 | GO:0006271 | DNA strand elongation involved in DNA replication(GO:0006271) |
| 0.0 | 0.4 | GO:2000622 | regulation of nuclear-transcribed mRNA catabolic process, nonsense-mediated decay(GO:2000622) negative regulation of nuclear-transcribed mRNA catabolic process, nonsense-mediated decay(GO:2000623) |
| 0.0 | 0.2 | GO:0060800 | regulation of cell differentiation involved in embryonic placenta development(GO:0060800) |
| 0.0 | 0.0 | GO:0051481 | negative regulation of cytosolic calcium ion concentration(GO:0051481) |
| 0.0 | 0.1 | GO:0090270 | fibroblast growth factor production(GO:0090269) regulation of fibroblast growth factor production(GO:0090270) |
| 0.0 | 0.2 | GO:0072752 | cellular response to rapamycin(GO:0072752) |
| 0.0 | 0.2 | GO:0002528 | regulation of vascular permeability involved in acute inflammatory response(GO:0002528) |
| 0.0 | 0.4 | GO:0048102 | autophagic cell death(GO:0048102) |
| 0.0 | 0.5 | GO:2000680 | rubidium ion transport(GO:0035826) regulation of rubidium ion transport(GO:2000680) |
| 0.0 | 0.6 | GO:0051103 | DNA ligation involved in DNA repair(GO:0051103) |
| 0.0 | 0.1 | GO:0045209 | MAPK phosphatase export from nucleus(GO:0045208) MAPK phosphatase export from nucleus, leptomycin B sensitive(GO:0045209) |
| 0.0 | 0.8 | GO:0051382 | kinetochore assembly(GO:0051382) |
| 0.0 | 0.1 | GO:0060084 | synaptic transmission involved in micturition(GO:0060084) |
| 0.0 | 0.1 | GO:0045204 | MAPK export from nucleus(GO:0045204) |
| 0.0 | 0.1 | GO:1901350 | cell-cell signaling involved in cell-cell junction organization(GO:1901350) |
| 0.0 | 0.1 | GO:0010710 | regulation of collagen catabolic process(GO:0010710) |
| 0.0 | 0.1 | GO:0001823 | mesonephros development(GO:0001823) |
| 0.0 | 0.1 | GO:0033364 | mast cell secretory granule organization(GO:0033364) |
| 0.0 | 0.1 | GO:1903515 | calcium ion transport from cytosol to endoplasmic reticulum(GO:1903515) |
| 0.0 | 0.1 | GO:1900215 | pronephric field specification(GO:0039003) pattern specification involved in pronephros development(GO:0039017) thyroid-stimulating hormone secretion(GO:0070460) kidney field specification(GO:0072004) DCT cell differentiation(GO:0072069) metanephric DCT cell differentiation(GO:0072240) regulation of mesenchymal cell apoptotic process involved in metanephric nephron morphogenesis(GO:0072304) negative regulation of mesenchymal cell apoptotic process involved in metanephric nephron morphogenesis(GO:0072305) mesenchymal stem cell maintenance involved in metanephric nephron morphogenesis(GO:0072309) apoptotic process involved in metanephric collecting duct development(GO:1900204) apoptotic process involved in metanephric nephron tubule development(GO:1900205) regulation of apoptotic process involved in metanephric collecting duct development(GO:1900214) negative regulation of apoptotic process involved in metanephric collecting duct development(GO:1900215) regulation of apoptotic process involved in metanephric nephron tubule development(GO:1900217) negative regulation of apoptotic process involved in metanephric nephron tubule development(GO:1900218) mesenchymal cell apoptotic process involved in metanephric nephron morphogenesis(GO:1901147) regulation of metanephric DCT cell differentiation(GO:2000592) positive regulation of metanephric DCT cell differentiation(GO:2000594) regulation of thyroid-stimulating hormone secretion(GO:2000612) |
| 0.0 | 0.1 | GO:0035621 | ER to Golgi ceramide transport(GO:0035621) |
| 0.0 | 0.0 | GO:0072003 | kidney rudiment formation(GO:0072003) |
| 0.0 | 0.2 | GO:0035567 | non-canonical Wnt signaling pathway(GO:0035567) |
| 0.0 | 0.1 | GO:0036496 | regulation of translational initiation by eIF2 alpha dephosphorylation(GO:0036496) |
| 0.0 | 0.3 | GO:0097033 | respiratory chain complex III assembly(GO:0017062) mitochondrial respiratory chain complex III assembly(GO:0034551) mitochondrial respiratory chain complex III biogenesis(GO:0097033) |
| 0.0 | 0.2 | GO:0009258 | 10-formyltetrahydrofolate catabolic process(GO:0009258) |
| 0.0 | 0.1 | GO:0002424 | T cell mediated immune response to tumor cell(GO:0002424) regulation of T cell mediated immune response to tumor cell(GO:0002840) |
| 0.0 | 0.1 | GO:1904020 | regulation of G-protein coupled receptor internalization(GO:1904020) |
| 0.0 | 0.3 | GO:1900246 | positive regulation of RIG-I signaling pathway(GO:1900246) |
| 0.0 | 0.4 | GO:0033314 | mitotic DNA replication checkpoint(GO:0033314) |
| 0.0 | 0.1 | GO:0042040 | molybdenum incorporation into molybdenum-molybdopterin complex(GO:0018315) metal incorporation into metallo-molybdopterin complex(GO:0042040) glycine receptor clustering(GO:0072579) |
| 0.0 | 0.2 | GO:0072660 | maintenance of protein location in membrane(GO:0072658) maintenance of protein location in plasma membrane(GO:0072660) positive regulation of membrane depolarization during cardiac muscle cell action potential(GO:1900827) |
| 0.0 | 0.1 | GO:0048265 | response to pain(GO:0048265) |
| 0.0 | 0.1 | GO:0010470 | regulation of gastrulation(GO:0010470) |
| 0.0 | 0.2 | GO:0031585 | regulation of inositol 1,4,5-trisphosphate-sensitive calcium-release channel activity(GO:0031585) |
| 0.0 | 0.1 | GO:0090086 | negative regulation of protein deubiquitination(GO:0090086) |
| 0.0 | 0.2 | GO:0030997 | regulation of centriole-centriole cohesion(GO:0030997) |
| 0.0 | 0.2 | GO:0014846 | esophagus smooth muscle contraction(GO:0014846) |
| 0.0 | 0.1 | GO:0044342 | type B pancreatic cell proliferation(GO:0044342) |
| 0.0 | 0.1 | GO:0021503 | neural fold bending(GO:0021503) |
| 0.0 | 0.1 | GO:0036292 | DNA rewinding(GO:0036292) |
| 0.0 | 0.3 | GO:0019563 | glycerol catabolic process(GO:0019563) |
| 0.0 | 0.1 | GO:0035281 | pre-miRNA export from nucleus(GO:0035281) |
| 0.0 | 0.2 | GO:0043418 | homocysteine catabolic process(GO:0043418) |
| 0.0 | 0.4 | GO:0045876 | positive regulation of sister chromatid cohesion(GO:0045876) |
| 0.0 | 0.4 | GO:0071394 | cellular response to testosterone stimulus(GO:0071394) |
| 0.0 | 0.1 | GO:0090611 | ubiquitin-independent protein catabolic process via the multivesicular body sorting pathway(GO:0090611) |
| 0.0 | 0.1 | GO:0045807 | positive regulation of endocytosis(GO:0045807) |
| 0.0 | 0.2 | GO:0030047 | actin modification(GO:0030047) |
| 0.0 | 0.2 | GO:0061153 | trachea submucosa development(GO:0061152) trachea gland development(GO:0061153) |
| 0.0 | 0.3 | GO:0042711 | maternal behavior(GO:0042711) parental behavior(GO:0060746) |
| 0.0 | 0.2 | GO:0042276 | error-prone translesion synthesis(GO:0042276) |
| 0.0 | 0.1 | GO:0021569 | rhombomere 3 development(GO:0021569) central nervous system segmentation(GO:0035283) brain segmentation(GO:0035284) |
| 0.0 | 0.2 | GO:0070940 | dephosphorylation of RNA polymerase II C-terminal domain(GO:0070940) |
| 0.0 | 0.2 | GO:0022027 | interkinetic nuclear migration(GO:0022027) |
| 0.0 | 0.1 | GO:0019065 | receptor-mediated endocytosis of virus by host cell(GO:0019065) endocytosis involved in viral entry into host cell(GO:0075509) |
| 0.0 | 0.4 | GO:1903025 | regulation of RNA polymerase II regulatory region sequence-specific DNA binding(GO:1903025) |
| 0.0 | 0.3 | GO:0007342 | fusion of sperm to egg plasma membrane(GO:0007342) |
| 0.0 | 0.1 | GO:0003175 | tricuspid valve development(GO:0003175) tricuspid valve morphogenesis(GO:0003186) |
| 0.0 | 0.2 | GO:1901908 | diadenosine polyphosphate catabolic process(GO:0015961) diphosphoinositol polyphosphate metabolic process(GO:0071543) diadenosine pentaphosphate metabolic process(GO:1901906) diadenosine pentaphosphate catabolic process(GO:1901907) diadenosine hexaphosphate metabolic process(GO:1901908) diadenosine hexaphosphate catabolic process(GO:1901909) adenosine 5'-(hexahydrogen pentaphosphate) metabolic process(GO:1901910) adenosine 5'-(hexahydrogen pentaphosphate) catabolic process(GO:1901911) |
| 0.0 | 0.1 | GO:0014063 | negative regulation of serotonin secretion(GO:0014063) |
| 0.0 | 0.5 | GO:0001675 | acrosome assembly(GO:0001675) |
| 0.0 | 0.2 | GO:0034628 | nicotinamide nucleotide biosynthetic process from aspartate(GO:0019355) 'de novo' NAD biosynthetic process from aspartate(GO:0034628) |
| 0.0 | 0.2 | GO:1904936 | cerebral cortex GABAergic interneuron migration(GO:0021853) interneuron migration(GO:1904936) |
| 0.0 | 0.3 | GO:0007076 | mitotic chromosome condensation(GO:0007076) |
| 0.0 | 0.1 | GO:1902232 | regulation of interleukin-4-mediated signaling pathway(GO:1902214) regulation of positive thymic T cell selection(GO:1902232) |
| 0.0 | 0.1 | GO:0072369 | regulation of lipid transport by positive regulation of transcription from RNA polymerase II promoter(GO:0072369) |
| 0.0 | 0.1 | GO:0032972 | regulation of muscle filament sliding speed(GO:0032972) |
| 0.0 | 0.2 | GO:0090669 | telomerase RNA stabilization(GO:0090669) |
| 0.0 | 1.1 | GO:0045736 | negative regulation of cyclin-dependent protein serine/threonine kinase activity(GO:0045736) |
| 0.0 | 0.3 | GO:0019441 | tryptophan catabolic process to kynurenine(GO:0019441) |
| 0.0 | 0.5 | GO:0033235 | positive regulation of protein sumoylation(GO:0033235) |
| 0.0 | 0.4 | GO:1904321 | response to forskolin(GO:1904321) cellular response to forskolin(GO:1904322) |
| 0.0 | 0.3 | GO:0019509 | L-methionine biosynthetic process from methylthioadenosine(GO:0019509) |
| 0.0 | 0.6 | GO:0032515 | negative regulation of phosphoprotein phosphatase activity(GO:0032515) |
| 0.0 | 0.2 | GO:0021902 | commitment of neuronal cell to specific neuron type in forebrain(GO:0021902) |
| 0.0 | 0.6 | GO:1904778 | regulation of protein localization to cell cortex(GO:1904776) positive regulation of protein localization to cell cortex(GO:1904778) |
| 0.0 | 0.2 | GO:0021930 | cell proliferation in hindbrain(GO:0021534) cell proliferation in external granule layer(GO:0021924) cerebellar granule cell precursor proliferation(GO:0021930) |
| 0.0 | 0.1 | GO:0045759 | negative regulation of action potential(GO:0045759) |
| 0.0 | 0.2 | GO:0006438 | valyl-tRNA aminoacylation(GO:0006438) |
| 0.0 | 0.1 | GO:0042998 | positive regulation of Golgi to plasma membrane protein transport(GO:0042998) |
| 0.0 | 0.2 | GO:0055129 | L-proline biosynthetic process(GO:0055129) |
| 0.0 | 0.0 | GO:0043589 | skin morphogenesis(GO:0043589) |
| 0.0 | 0.1 | GO:0031291 | Ran protein signal transduction(GO:0031291) |
| 0.0 | 0.5 | GO:2001032 | regulation of double-strand break repair via nonhomologous end joining(GO:2001032) |
| 0.0 | 0.1 | GO:1902283 | negative regulation of primary amine oxidase activity(GO:1902283) |
| 0.0 | 0.1 | GO:0035408 | histone H3-T6 phosphorylation(GO:0035408) |
| 0.0 | 0.1 | GO:0032489 | regulation of Cdc42 protein signal transduction(GO:0032489) |
| 0.0 | 0.1 | GO:0035616 | histone H2B conserved C-terminal lysine deubiquitination(GO:0035616) |
| 0.0 | 0.1 | GO:0070966 | nuclear-transcribed mRNA catabolic process, no-go decay(GO:0070966) |
| 0.0 | 0.4 | GO:0015693 | magnesium ion transport(GO:0015693) |
| 0.0 | 0.2 | GO:0070358 | actin polymerization-dependent cell motility(GO:0070358) |
| 0.0 | 0.5 | GO:0006465 | signal peptide processing(GO:0006465) |
| 0.0 | 0.1 | GO:0051005 | negative regulation of lipoprotein lipase activity(GO:0051005) |
| 0.0 | 0.1 | GO:0035865 | cellular response to potassium ion(GO:0035865) |
| 0.0 | 0.1 | GO:0061187 | regulation of chromatin silencing at rDNA(GO:0061187) negative regulation of chromatin silencing at rDNA(GO:0061188) |
| 0.0 | 0.6 | GO:0034975 | protein folding in endoplasmic reticulum(GO:0034975) |
| 0.0 | 0.2 | GO:0070236 | negative regulation of activation-induced cell death of T cells(GO:0070236) |
| 0.0 | 0.4 | GO:0000290 | deadenylation-dependent decapping of nuclear-transcribed mRNA(GO:0000290) |
| 0.0 | 0.2 | GO:0034723 | DNA replication-dependent nucleosome assembly(GO:0006335) DNA replication-dependent nucleosome organization(GO:0034723) |
| 0.0 | 0.3 | GO:0006610 | ribosomal protein import into nucleus(GO:0006610) |
| 0.0 | 0.4 | GO:0036010 | protein localization to endosome(GO:0036010) |
| 0.0 | 0.1 | GO:0006015 | 5-phosphoribose 1-diphosphate biosynthetic process(GO:0006015) hypoxanthine metabolic process(GO:0046100) hypoxanthine biosynthetic process(GO:0046101) 5-phosphoribose 1-diphosphate metabolic process(GO:0046391) |
| 0.0 | 0.3 | GO:0014877 | response to muscle inactivity involved in regulation of muscle adaptation(GO:0014877) response to denervation involved in regulation of muscle adaptation(GO:0014894) |
| 0.0 | 0.1 | GO:1901340 | negative regulation of store-operated calcium channel activity(GO:1901340) |
| 0.0 | 0.2 | GO:0090520 | sphingosine-1-phosphate signaling pathway(GO:0003376) sphingolipid mediated signaling pathway(GO:0090520) |
| 0.0 | 0.2 | GO:2000676 | positive regulation of type B pancreatic cell apoptotic process(GO:2000676) |
| 0.0 | 0.1 | GO:0072641 | type I interferon secretion(GO:0072641) interferon-alpha secretion(GO:0072642) regulation of interferon-alpha secretion(GO:1902739) positive regulation of interferon-alpha secretion(GO:1902741) |
| 0.0 | 0.0 | GO:0045110 | intermediate filament bundle assembly(GO:0045110) |
| 0.0 | 0.1 | GO:0048496 | maintenance of organ identity(GO:0048496) |
| 0.0 | 0.2 | GO:0001731 | formation of translation preinitiation complex(GO:0001731) |
| 0.0 | 0.4 | GO:0048864 | stem cell development(GO:0048864) |
| 0.0 | 0.7 | GO:0016254 | preassembly of GPI anchor in ER membrane(GO:0016254) |
| 0.0 | 0.1 | GO:0032707 | negative regulation of interleukin-23 production(GO:0032707) |
| 0.0 | 0.7 | GO:0060117 | auditory receptor cell development(GO:0060117) |
| 0.0 | 0.1 | GO:0035261 | external genitalia morphogenesis(GO:0035261) |
| 0.0 | 0.1 | GO:0033140 | negative regulation of peptidyl-serine phosphorylation of STAT protein(GO:0033140) |
| 0.0 | 0.1 | GO:0060699 | regulation of endoribonuclease activity(GO:0060699) |
| 0.0 | 0.2 | GO:0046940 | nucleoside monophosphate phosphorylation(GO:0046940) |
| 0.0 | 0.2 | GO:0061088 | regulation of sequestering of zinc ion(GO:0061088) |
| 0.0 | 0.1 | GO:0061107 | seminal vesicle development(GO:0061107) |
| 0.0 | 0.2 | GO:0071787 | endoplasmic reticulum tubular network assembly(GO:0071787) |
| 0.0 | 0.1 | GO:1902268 | negative regulation of polyamine transmembrane transport(GO:1902268) |
| 0.0 | 0.1 | GO:0071109 | superior temporal gyrus development(GO:0071109) |
| 0.0 | 0.1 | GO:0071896 | protein localization to adherens junction(GO:0071896) |
| 0.0 | 0.0 | GO:1990918 | double-strand break repair involved in meiotic recombination(GO:1990918) |
| 0.0 | 0.2 | GO:0010571 | positive regulation of nuclear cell cycle DNA replication(GO:0010571) |
| 0.0 | 0.1 | GO:0032289 | central nervous system myelin formation(GO:0032289) |
| 0.0 | 0.1 | GO:2000645 | negative regulation of receptor catabolic process(GO:2000645) |
| 0.0 | 0.2 | GO:0016926 | protein desumoylation(GO:0016926) |
| 0.0 | 0.3 | GO:0042659 | regulation of cell fate specification(GO:0042659) |
| 0.0 | 0.4 | GO:0009263 | deoxyribonucleotide biosynthetic process(GO:0009263) |
| 0.0 | 0.1 | GO:0007343 | egg activation(GO:0007343) |
| 0.0 | 0.1 | GO:0038033 | positive regulation of endothelial cell chemotaxis by VEGF-activated vascular endothelial growth factor receptor signaling pathway(GO:0038033) |
| 0.0 | 0.2 | GO:0046826 | negative regulation of protein export from nucleus(GO:0046826) |
| 0.0 | 0.0 | GO:0070256 | regulation of neurotrophin production(GO:0032899) negative regulation of neurotrophin production(GO:0032900) negative regulation of circadian sleep/wake cycle, non-REM sleep(GO:0042323) negative regulation of mucus secretion(GO:0070256) |
| 0.0 | 0.4 | GO:1901620 | regulation of smoothened signaling pathway involved in dorsal/ventral neural tube patterning(GO:1901620) |
| 0.0 | 0.4 | GO:0009113 | purine nucleobase biosynthetic process(GO:0009113) |
| 0.0 | 0.1 | GO:0036260 | 7-methylguanosine mRNA capping(GO:0006370) 7-methylguanosine RNA capping(GO:0009452) RNA capping(GO:0036260) |
| 0.0 | 0.3 | GO:0006477 | protein sulfation(GO:0006477) |
| 0.0 | 0.2 | GO:0051045 | negative regulation of membrane protein ectodomain proteolysis(GO:0051045) |
| 0.0 | 0.1 | GO:0044861 | protein transport into plasma membrane raft(GO:0044861) |
| 0.0 | 0.3 | GO:1904251 | regulation of bile acid metabolic process(GO:1904251) |
| 0.0 | 0.2 | GO:0071670 | smooth muscle cell chemotaxis(GO:0071670) |
| 0.0 | 0.5 | GO:0035162 | embryonic hemopoiesis(GO:0035162) |
| 0.0 | 0.3 | GO:0010603 | regulation of cytoplasmic mRNA processing body assembly(GO:0010603) |
| 0.0 | 0.2 | GO:0038028 | insulin receptor signaling pathway via phosphatidylinositol 3-kinase(GO:0038028) |
| 0.0 | 0.1 | GO:0016260 | selenocysteine biosynthetic process(GO:0016260) |
| 0.0 | 0.2 | GO:0000733 | DNA strand renaturation(GO:0000733) |
| 0.0 | 0.1 | GO:1905098 | negative regulation of guanyl-nucleotide exchange factor activity(GO:1905098) |
| 0.0 | 0.1 | GO:0015798 | myo-inositol transport(GO:0015798) |
| 0.0 | 0.5 | GO:0051085 | chaperone mediated protein folding requiring cofactor(GO:0051085) |
| 0.0 | 0.6 | GO:0000732 | strand displacement(GO:0000732) |
| 0.0 | 0.0 | GO:0060023 | soft palate development(GO:0060023) |
| 0.0 | 0.1 | GO:0048149 | behavioral response to ethanol(GO:0048149) |
| 0.0 | 0.2 | GO:0098535 | de novo centriole assembly(GO:0098535) |
| 0.0 | 0.0 | GO:2001180 | negative regulation of interleukin-10 secretion(GO:2001180) |
| 0.0 | 0.2 | GO:0050434 | positive regulation of viral transcription(GO:0050434) |
| 0.0 | 0.1 | GO:1903280 | negative regulation of calcium:sodium antiporter activity(GO:1903280) |
| 0.0 | 0.1 | GO:0002740 | negative regulation of cytokine secretion involved in immune response(GO:0002740) |
| 0.0 | 0.1 | GO:2000568 | memory T cell activation(GO:0035709) regulation of memory T cell activation(GO:2000567) positive regulation of memory T cell activation(GO:2000568) |
| 0.0 | 0.1 | GO:0001880 | Mullerian duct regression(GO:0001880) |
| 0.0 | 0.1 | GO:1900745 | positive regulation of p38MAPK cascade(GO:1900745) |
| 0.0 | 0.1 | GO:2000348 | regulation of CD40 signaling pathway(GO:2000348) |
| 0.0 | 0.1 | GO:0051770 | positive regulation of nitric-oxide synthase biosynthetic process(GO:0051770) |
| 0.0 | 0.3 | GO:0097151 | positive regulation of inhibitory postsynaptic potential(GO:0097151) modulation of inhibitory postsynaptic potential(GO:0098828) |
| 0.0 | 0.1 | GO:0044806 | G-quadruplex DNA unwinding(GO:0044806) |
| 0.0 | 0.0 | GO:0015959 | diadenosine polyphosphate metabolic process(GO:0015959) |
| 0.0 | 0.4 | GO:0016180 | snRNA processing(GO:0016180) |
| 0.0 | 0.1 | GO:2000051 | negative regulation of non-canonical Wnt signaling pathway(GO:2000051) |
| 0.0 | 0.2 | GO:0030916 | otic vesicle formation(GO:0030916) |
| 0.0 | 0.1 | GO:0070345 | negative regulation of fat cell proliferation(GO:0070345) |
| 0.0 | 0.2 | GO:0014051 | gamma-aminobutyric acid secretion(GO:0014051) |
| 0.0 | 0.1 | GO:0060836 | lymphatic endothelial cell differentiation(GO:0060836) |
| 0.0 | 0.1 | GO:0060315 | negative regulation of ryanodine-sensitive calcium-release channel activity(GO:0060315) |
| 0.0 | 0.1 | GO:0001544 | initiation of primordial ovarian follicle growth(GO:0001544) |
| 0.0 | 0.1 | GO:0006597 | spermine biosynthetic process(GO:0006597) |
| 0.0 | 0.2 | GO:0051764 | actin crosslink formation(GO:0051764) |
| 0.0 | 0.2 | GO:0071313 | cellular response to caffeine(GO:0071313) |
| 0.0 | 0.1 | GO:1904896 | ESCRT complex disassembly(GO:1904896) ESCRT III complex disassembly(GO:1904903) |
| 0.0 | 0.1 | GO:0036451 | cap mRNA methylation(GO:0036451) |
| 0.0 | 0.5 | GO:0071157 | negative regulation of cell cycle arrest(GO:0071157) |
| 0.0 | 0.3 | GO:0070914 | UV-damage excision repair(GO:0070914) |
| 0.0 | 0.1 | GO:0036120 | response to platelet-derived growth factor(GO:0036119) cellular response to platelet-derived growth factor stimulus(GO:0036120) |
| 0.0 | 0.1 | GO:0042426 | choline catabolic process(GO:0042426) |
| 0.0 | 0.1 | GO:0000972 | transcription-dependent tethering of RNA polymerase II gene DNA at nuclear periphery(GO:0000972) |
| 0.0 | 0.2 | GO:0036091 | positive regulation of transcription from RNA polymerase II promoter in response to oxidative stress(GO:0036091) |
| 0.0 | 0.1 | GO:0016080 | synaptic vesicle targeting(GO:0016080) |
| 0.0 | 0.0 | GO:0021979 | hypothalamus cell differentiation(GO:0021979) |
| 0.0 | 0.2 | GO:0034435 | steroid esterification(GO:0034433) sterol esterification(GO:0034434) cholesterol esterification(GO:0034435) |
| 0.0 | 0.1 | GO:0048148 | behavioral response to cocaine(GO:0048148) |
| 0.0 | 0.1 | GO:0090206 | negative regulation of cholesterol biosynthetic process(GO:0045541) negative regulation of cholesterol metabolic process(GO:0090206) |
| 0.0 | 0.1 | GO:0010459 | negative regulation of heart rate(GO:0010459) |
| 0.0 | 0.3 | GO:0050729 | positive regulation of inflammatory response(GO:0050729) |
| 0.0 | 0.2 | GO:0030007 | cellular potassium ion homeostasis(GO:0030007) |
| 0.0 | 0.3 | GO:1990573 | potassium ion import across plasma membrane(GO:1990573) |
| 0.0 | 0.1 | GO:0072709 | cellular response to sorbitol(GO:0072709) |
| 0.0 | 0.4 | GO:1900273 | positive regulation of long-term synaptic potentiation(GO:1900273) |
| 0.0 | 0.1 | GO:0018343 | protein farnesylation(GO:0018343) |
| 0.0 | 0.1 | GO:0070885 | negative regulation of calcineurin-NFAT signaling cascade(GO:0070885) |
| 0.0 | 0.1 | GO:0035418 | protein localization to synapse(GO:0035418) |
| 0.0 | 0.6 | GO:0043968 | histone H2A acetylation(GO:0043968) |
| 0.0 | 0.1 | GO:0090222 | centrosome-templated microtubule nucleation(GO:0090222) |
| 0.0 | 0.2 | GO:0048194 | Golgi vesicle budding(GO:0048194) |
| 0.0 | 0.2 | GO:0034625 | fatty acid elongation, saturated fatty acid(GO:0019367) fatty acid elongation, unsaturated fatty acid(GO:0019368) fatty acid elongation, monounsaturated fatty acid(GO:0034625) fatty acid elongation, polyunsaturated fatty acid(GO:0034626) |
| 0.0 | 0.0 | GO:0050894 | determination of affect(GO:0050894) |
| 0.0 | 0.1 | GO:2000812 | regulation of barbed-end actin filament capping(GO:2000812) |
| 0.0 | 0.1 | GO:0032474 | otolith morphogenesis(GO:0032474) |
| 0.0 | 0.0 | GO:0001842 | neural fold formation(GO:0001842) |
| 0.0 | 0.2 | GO:0043249 | erythrocyte maturation(GO:0043249) |
| 0.0 | 0.0 | GO:1990927 | calcium ion regulated lysosome exocytosis(GO:1990927) |
| 0.0 | 0.6 | GO:0045671 | negative regulation of osteoclast differentiation(GO:0045671) |
| 0.0 | 0.1 | GO:0048254 | snoRNA localization(GO:0048254) |
| 0.0 | 0.1 | GO:0016344 | meiotic chromosome movement towards spindle pole(GO:0016344) |
| 0.0 | 0.2 | GO:0061734 | parkin-mediated mitophagy in response to mitochondrial depolarization(GO:0061734) |
| 0.0 | 0.1 | GO:1904491 | protein localization to ciliary transition zone(GO:1904491) |
| 0.0 | 0.3 | GO:0010510 | regulation of acetyl-CoA biosynthetic process from pyruvate(GO:0010510) |
| 0.0 | 0.2 | GO:0001955 | blood vessel maturation(GO:0001955) |
| 0.0 | 1.2 | GO:0043044 | ATP-dependent chromatin remodeling(GO:0043044) |
| 0.0 | 0.5 | GO:0006337 | nucleosome disassembly(GO:0006337) |
| 0.0 | 0.1 | GO:0000160 | phosphorelay signal transduction system(GO:0000160) |
| 0.0 | 0.2 | GO:0071492 | cellular response to UV-A(GO:0071492) |
| 0.0 | 0.0 | GO:0060399 | positive regulation of growth hormone receptor signaling pathway(GO:0060399) |
| 0.0 | 0.1 | GO:0006428 | isoleucyl-tRNA aminoacylation(GO:0006428) |
| 0.0 | 0.2 | GO:0032836 | glomerular basement membrane development(GO:0032836) |
| 0.0 | 0.2 | GO:0006776 | vitamin A metabolic process(GO:0006776) |
| 0.0 | 0.1 | GO:0016127 | cholesterol catabolic process(GO:0006707) sterol catabolic process(GO:0016127) |
| 0.0 | 0.0 | GO:0035989 | tendon development(GO:0035989) |
| 0.0 | 0.2 | GO:0002227 | innate immune response in mucosa(GO:0002227) |
| 0.0 | 0.2 | GO:0061087 | positive regulation of histone H3-K27 methylation(GO:0061087) |
| 0.0 | 0.8 | GO:0048488 | synaptic vesicle endocytosis(GO:0048488) |
| 0.0 | 0.0 | GO:0051891 | positive regulation of cardioblast differentiation(GO:0051891) |
| 0.0 | 0.1 | GO:0009233 | menaquinone metabolic process(GO:0009233) |
| 0.0 | 0.1 | GO:0001833 | inner cell mass cell proliferation(GO:0001833) |
| 0.0 | 0.1 | GO:0030050 | vesicle transport along actin filament(GO:0030050) |
| 0.0 | 0.0 | GO:0001975 | response to amphetamine(GO:0001975) |
| 0.0 | 0.1 | GO:0006422 | aspartyl-tRNA aminoacylation(GO:0006422) |
| 0.0 | 0.2 | GO:0061179 | negative regulation of insulin secretion involved in cellular response to glucose stimulus(GO:0061179) |
| 0.0 | 0.3 | GO:0016075 | rRNA catabolic process(GO:0016075) |
| 0.0 | 0.1 | GO:0009048 | dosage compensation by inactivation of X chromosome(GO:0009048) |
| 0.0 | 0.2 | GO:0070050 | neuron cellular homeostasis(GO:0070050) |
| 0.0 | 0.1 | GO:0010265 | SCF complex assembly(GO:0010265) |
| 0.0 | 0.2 | GO:0070987 | error-free translesion synthesis(GO:0070987) |
| 0.0 | 0.2 | GO:0072520 | seminiferous tubule development(GO:0072520) |
| 0.0 | 0.2 | GO:1903012 | positive regulation of bone development(GO:1903012) |
| 0.0 | 0.0 | GO:0035813 | renal sodium excretion(GO:0035812) regulation of renal sodium excretion(GO:0035813) positive regulation of renal sodium excretion(GO:0035815) regulation of excretion(GO:0044062) |
| 0.0 | 0.1 | GO:0036071 | N-glycan fucosylation(GO:0036071) |
| 0.0 | 0.2 | GO:0046007 | negative regulation of activated T cell proliferation(GO:0046007) |
| 0.0 | 0.5 | GO:0061003 | positive regulation of dendritic spine morphogenesis(GO:0061003) |
| 0.0 | 0.4 | GO:0031116 | positive regulation of microtubule polymerization(GO:0031116) |
| 0.0 | 0.1 | GO:0061387 | regulation of extent of cell growth(GO:0061387) |
| 0.0 | 0.3 | GO:0031122 | cytoplasmic microtubule organization(GO:0031122) |
| 0.0 | 0.2 | GO:0080182 | histone H3-K4 trimethylation(GO:0080182) |
| 0.0 | 0.1 | GO:0061470 | T follicular helper cell differentiation(GO:0061470) |
| 0.0 | 0.1 | GO:0033564 | anterior/posterior axon guidance(GO:0033564) |
| 0.0 | 0.1 | GO:1902951 | negative regulation of dendritic spine maintenance(GO:1902951) |
| 0.0 | 0.1 | GO:0060052 | neurofilament cytoskeleton organization(GO:0060052) |
| 0.0 | 0.1 | GO:0072156 | distal tubule morphogenesis(GO:0072156) |
| 0.0 | 0.2 | GO:0033523 | histone H2B ubiquitination(GO:0033523) |
| 0.0 | 0.2 | GO:0086070 | SA node cell to atrial cardiac muscle cell communication(GO:0086070) |
| 0.0 | 0.5 | GO:0070911 | global genome nucleotide-excision repair(GO:0070911) |
| 0.0 | 0.1 | GO:0001886 | endothelial cell morphogenesis(GO:0001886) |
| 0.0 | 0.1 | GO:0006659 | phosphatidylserine biosynthetic process(GO:0006659) |
| 0.0 | 0.3 | GO:1904707 | positive regulation of vascular smooth muscle cell proliferation(GO:1904707) |
| 0.0 | 0.1 | GO:0060694 | regulation of cholesterol transporter activity(GO:0060694) pancreatic stellate cell proliferation(GO:0072343) response to metformin(GO:1901558) regulation of pancreatic stellate cell proliferation(GO:2000229) negative regulation of pancreatic stellate cell proliferation(GO:2000230) |
| 0.0 | 0.0 | GO:1900100 | epithelial cell differentiation involved in salivary gland development(GO:0060690) epithelial cell maturation involved in salivary gland development(GO:0060691) regulation of plasma cell differentiation(GO:1900098) positive regulation of plasma cell differentiation(GO:1900100) regulation of lactation(GO:1903487) positive regulation of lactation(GO:1903489) |
| 0.0 | 0.0 | GO:0045348 | positive regulation of MHC class II biosynthetic process(GO:0045348) |
| 0.0 | 0.1 | GO:0000389 | mRNA 3'-splice site recognition(GO:0000389) |
| 0.0 | 0.1 | GO:1903800 | positive regulation of production of miRNAs involved in gene silencing by miRNA(GO:1903800) |
| 0.0 | 0.1 | GO:2001301 | lipoxin biosynthetic process(GO:2001301) lipoxin A4 metabolic process(GO:2001302) lipoxin A4 biosynthetic process(GO:2001303) |
| 0.0 | 0.1 | GO:0033962 | cytoplasmic mRNA processing body assembly(GO:0033962) |
| 0.0 | 0.2 | GO:2000580 | positive regulation of microtubule motor activity(GO:2000576) regulation of ATP-dependent microtubule motor activity, plus-end-directed(GO:2000580) positive regulation of ATP-dependent microtubule motor activity, plus-end-directed(GO:2000582) |
| 0.0 | 0.1 | GO:0010891 | negative regulation of sequestering of triglyceride(GO:0010891) |
| 0.0 | 0.1 | GO:2000758 | positive regulation of histone acetylation(GO:0035066) positive regulation of peptidyl-lysine acetylation(GO:2000758) |
| 0.0 | 1.6 | GO:0051225 | spindle assembly(GO:0051225) |
| 0.0 | 0.1 | GO:0034334 | adherens junction maintenance(GO:0034334) |
| 0.0 | 0.1 | GO:0070459 | prolactin secretion(GO:0070459) |
| 0.0 | 0.1 | GO:0048096 | chromatin-mediated maintenance of transcription(GO:0048096) |
| 0.0 | 0.1 | GO:0070475 | rRNA base methylation(GO:0070475) |
| 0.0 | 0.0 | GO:0002265 | astrocyte activation involved in immune response(GO:0002265) |
| 0.0 | 0.4 | GO:0099514 | anterograde synaptic vesicle transport(GO:0048490) synaptic vesicle cytoskeletal transport(GO:0099514) synaptic vesicle transport along microtubule(GO:0099517) |
| 0.0 | 0.0 | GO:0071481 | cellular response to X-ray(GO:0071481) |
| 0.0 | 0.1 | GO:0030174 | regulation of DNA-dependent DNA replication initiation(GO:0030174) |
| 0.0 | 0.3 | GO:0007175 | negative regulation of epidermal growth factor-activated receptor activity(GO:0007175) |
| 0.0 | 0.1 | GO:0071539 | protein localization to centrosome(GO:0071539) |
| 0.0 | 0.0 | GO:0040033 | miRNA mediated inhibition of translation(GO:0035278) negative regulation of translation, ncRNA-mediated(GO:0040033) regulation of translation, ncRNA-mediated(GO:0045974) |
| 0.0 | 0.1 | GO:0071786 | endoplasmic reticulum tubular network organization(GO:0071786) |
| 0.0 | 0.0 | GO:0046121 | deoxyribonucleoside catabolic process(GO:0046121) |
| 0.0 | 0.1 | GO:2000188 | regulation of cholesterol homeostasis(GO:2000188) |
| 0.0 | 0.1 | GO:1904153 | negative regulation of protein exit from endoplasmic reticulum(GO:0070862) negative regulation of retrograde protein transport, ER to cytosol(GO:1904153) |
| 0.0 | 0.0 | GO:1902202 | regulation of hepatocyte growth factor receptor signaling pathway(GO:1902202) |
| 0.0 | 0.0 | GO:0046452 | dihydrofolate metabolic process(GO:0046452) |
| 0.0 | 0.4 | GO:0030033 | microvillus assembly(GO:0030033) |
| 0.0 | 0.3 | GO:0006123 | mitochondrial electron transport, cytochrome c to oxygen(GO:0006123) |
| 0.0 | 0.1 | GO:0018243 | protein O-linked glycosylation via threonine(GO:0018243) |
| 0.0 | 0.1 | GO:0033615 | mitochondrial proton-transporting ATP synthase complex assembly(GO:0033615) |
| 0.0 | 0.1 | GO:0033151 | V(D)J recombination(GO:0033151) |
| 0.0 | 0.6 | GO:0000387 | spliceosomal snRNP assembly(GO:0000387) |
| 0.0 | 0.0 | GO:0000395 | mRNA 5'-splice site recognition(GO:0000395) |
| 0.0 | 0.1 | GO:0050882 | voluntary musculoskeletal movement(GO:0050882) |
| 0.0 | 0.0 | GO:0070535 | histone H2A K63-linked ubiquitination(GO:0070535) |
| 0.0 | 0.2 | GO:0045721 | negative regulation of gluconeogenesis(GO:0045721) |
| 0.0 | 0.5 | GO:0072661 | protein targeting to plasma membrane(GO:0072661) |
| 0.0 | 0.0 | GO:0003360 | brainstem development(GO:0003360) |
| 0.0 | 0.0 | GO:0060265 | positive regulation of respiratory burst involved in inflammatory response(GO:0060265) |
| 0.0 | 0.2 | GO:0043984 | histone H4-K16 acetylation(GO:0043984) |
| 0.0 | 0.1 | GO:0031936 | negative regulation of chromatin silencing(GO:0031936) |
| 0.0 | 0.0 | GO:0001672 | regulation of chromatin assembly or disassembly(GO:0001672) |
| 0.0 | 0.1 | GO:0090394 | negative regulation of excitatory postsynaptic potential(GO:0090394) |
| 0.0 | 0.0 | GO:0048210 | Golgi vesicle fusion to target membrane(GO:0048210) |
| 0.0 | 0.1 | GO:0045625 | regulation of T-helper 1 cell differentiation(GO:0045625) |
| 0.0 | 0.0 | GO:0071480 | cellular response to gamma radiation(GO:0071480) |
| 0.0 | 0.5 | GO:0032008 | positive regulation of TOR signaling(GO:0032008) |
| 0.0 | 0.1 | GO:0002829 | negative regulation of type 2 immune response(GO:0002829) |
| 0.0 | 0.2 | GO:0035414 | negative regulation of catenin import into nucleus(GO:0035414) |
| 0.0 | 0.2 | GO:0034243 | regulation of transcription elongation from RNA polymerase II promoter(GO:0034243) |
| 0.0 | 0.1 | GO:0015074 | DNA integration(GO:0015074) |
| 0.0 | 0.1 | GO:0051490 | negative regulation of filopodium assembly(GO:0051490) |
| 0.0 | 0.2 | GO:0030514 | negative regulation of BMP signaling pathway(GO:0030514) |
| 0.0 | 0.1 | GO:0051292 | nuclear pore complex assembly(GO:0051292) |
| 0.0 | 0.3 | GO:0007190 | activation of adenylate cyclase activity(GO:0007190) |
| 0.0 | 0.1 | GO:0061484 | hematopoietic stem cell homeostasis(GO:0061484) |
| 0.0 | 0.3 | GO:0044804 | nucleophagy(GO:0044804) |
| 0.0 | 0.1 | GO:0016198 | axon choice point recognition(GO:0016198) |
| 0.0 | 0.1 | GO:0072592 | oxygen metabolic process(GO:0072592) |
| 0.0 | 0.2 | GO:1903432 | regulation of TORC1 signaling(GO:1903432) |
| 0.0 | 0.0 | GO:0045607 | regulation of auditory receptor cell differentiation(GO:0045607) regulation of mechanoreceptor differentiation(GO:0045631) regulation of inner ear receptor cell differentiation(GO:2000980) |
| 0.0 | 0.5 | GO:0048791 | calcium ion-regulated exocytosis of neurotransmitter(GO:0048791) |
| 0.0 | 0.3 | GO:0090383 | phagosome acidification(GO:0090383) |
Gene overrepresentation in cellular_component category:
| Log-likelihood per target | Total log-likelihood | Term | Description |
|---|---|---|---|
| 0.2 | 1.7 | GO:0097129 | cyclin D2-CDK4 complex(GO:0097129) |
| 0.2 | 0.5 | GO:1902737 | dendritic filopodium(GO:1902737) |
| 0.2 | 0.5 | GO:0000818 | nuclear MIS12/MIND complex(GO:0000818) |
| 0.1 | 0.3 | GO:0005960 | glycine cleavage complex(GO:0005960) |
| 0.1 | 0.4 | GO:0097224 | sperm connecting piece(GO:0097224) |
| 0.1 | 0.3 | GO:0097196 | Shu complex(GO:0097196) |
| 0.1 | 0.1 | GO:1902710 | GABA receptor complex(GO:1902710) |
| 0.1 | 0.5 | GO:0070381 | endosome to plasma membrane transport vesicle(GO:0070381) |
| 0.1 | 0.2 | GO:0030893 | meiotic cohesin complex(GO:0030893) |
| 0.1 | 0.3 | GO:0070288 | intracellular ferritin complex(GO:0008043) ferritin complex(GO:0070288) |
| 0.1 | 0.3 | GO:0002189 | ribose phosphate diphosphokinase complex(GO:0002189) |
| 0.1 | 0.4 | GO:1990246 | uniplex complex(GO:1990246) |
| 0.1 | 0.7 | GO:0005663 | DNA replication factor C complex(GO:0005663) |
| 0.1 | 0.3 | GO:0044301 | climbing fiber(GO:0044301) |
| 0.1 | 0.3 | GO:0033186 | CAF-1 complex(GO:0033186) |
| 0.1 | 0.2 | GO:0070762 | nuclear pore transmembrane ring(GO:0070762) |
| 0.1 | 1.1 | GO:0031209 | SCAR complex(GO:0031209) |
| 0.1 | 0.5 | GO:0005787 | signal peptidase complex(GO:0005787) |
| 0.1 | 0.9 | GO:0097470 | ribbon synapse(GO:0097470) |
| 0.1 | 0.4 | GO:1990589 | ATF4-CREB1 transcription factor complex(GO:1990589) |
| 0.1 | 0.5 | GO:0000798 | nuclear cohesin complex(GO:0000798) |
| 0.1 | 0.2 | GO:0070931 | Golgi-associated vesicle lumen(GO:0070931) |
| 0.1 | 0.2 | GO:0045111 | intermediate filament cytoskeleton(GO:0045111) |
| 0.1 | 0.5 | GO:0002193 | MAML1-RBP-Jkappa- ICN1 complex(GO:0002193) |
| 0.1 | 0.7 | GO:0005883 | neurofilament(GO:0005883) |
| 0.1 | 0.9 | GO:0072357 | PTW/PP1 phosphatase complex(GO:0072357) |
| 0.0 | 0.7 | GO:0071986 | Ragulator complex(GO:0071986) |
| 0.0 | 0.4 | GO:0033063 | Rad51B-Rad51C-Rad51D-XRCC2 complex(GO:0033063) |
| 0.0 | 0.7 | GO:0070652 | HAUS complex(GO:0070652) |
| 0.0 | 0.4 | GO:0005971 | ribonucleoside-diphosphate reductase complex(GO:0005971) |
| 0.0 | 0.2 | GO:0071942 | XPC complex(GO:0071942) |
| 0.0 | 0.3 | GO:0031501 | mannosyltransferase complex(GO:0031501) |
| 0.0 | 0.1 | GO:0044609 | DBIRD complex(GO:0044609) |
| 0.0 | 0.3 | GO:0034678 | integrin alpha8-beta1 complex(GO:0034678) |
| 0.0 | 0.2 | GO:0031985 | Golgi cisterna(GO:0031985) |
| 0.0 | 0.1 | GO:0031213 | RSF complex(GO:0031213) |
| 0.0 | 0.2 | GO:0017109 | glutamate-cysteine ligase complex(GO:0017109) |
| 0.0 | 0.4 | GO:0034715 | pICln-Sm protein complex(GO:0034715) |
| 0.0 | 0.1 | GO:0036387 | nuclear pre-replicative complex(GO:0005656) pre-replicative complex(GO:0036387) |
| 0.0 | 0.6 | GO:0000796 | condensin complex(GO:0000796) |
| 0.0 | 0.4 | GO:0016589 | NURF complex(GO:0016589) |
| 0.0 | 0.3 | GO:0071203 | WASH complex(GO:0071203) |
| 0.0 | 0.2 | GO:0097125 | cyclin B1-CDK1 complex(GO:0097125) |
| 0.0 | 0.4 | GO:0005955 | calcineurin complex(GO:0005955) |
| 0.0 | 0.4 | GO:0016442 | RISC complex(GO:0016442) RNAi effector complex(GO:0031332) |
| 0.0 | 0.2 | GO:0000125 | PCAF complex(GO:0000125) |
| 0.0 | 0.2 | GO:0090498 | extrinsic component of Golgi membrane(GO:0090498) |
| 0.0 | 0.4 | GO:0001739 | sex chromatin(GO:0001739) |
| 0.0 | 0.7 | GO:0000124 | SAGA complex(GO:0000124) |
| 0.0 | 0.2 | GO:1990130 | Iml1 complex(GO:1990130) |
| 0.0 | 0.3 | GO:0034274 | Atg12-Atg5-Atg16 complex(GO:0034274) |
| 0.0 | 0.1 | GO:0071001 | U4/U6 snRNP(GO:0071001) |
| 0.0 | 0.1 | GO:0034676 | integrin alpha6-beta4 complex(GO:0034676) |
| 0.0 | 0.3 | GO:0001740 | Barr body(GO:0001740) |
| 0.0 | 0.2 | GO:0031905 | early endosome lumen(GO:0031905) |
| 0.0 | 0.3 | GO:0031465 | Cul4B-RING E3 ubiquitin ligase complex(GO:0031465) |
| 0.0 | 0.2 | GO:0000275 | mitochondrial proton-transporting ATP synthase complex, catalytic core F(1)(GO:0000275) |
| 0.0 | 0.2 | GO:0005927 | muscle tendon junction(GO:0005927) |
| 0.0 | 0.1 | GO:0005683 | U7 snRNP(GO:0005683) |
| 0.0 | 0.3 | GO:0070695 | FHF complex(GO:0070695) |
| 0.0 | 0.1 | GO:0070937 | CRD-mediated mRNA stability complex(GO:0070937) |
| 0.0 | 1.5 | GO:0090544 | BAF-type complex(GO:0090544) |
| 0.0 | 0.6 | GO:0005862 | muscle thin filament tropomyosin(GO:0005862) |
| 0.0 | 0.1 | GO:0042565 | RNA nuclear export complex(GO:0042565) |
| 0.0 | 0.2 | GO:0016012 | sarcoglycan complex(GO:0016012) |
| 0.0 | 0.5 | GO:0016600 | flotillin complex(GO:0016600) |
| 0.0 | 0.7 | GO:0030122 | AP-2 adaptor complex(GO:0030122) |
| 0.0 | 0.1 | GO:0097543 | ciliary inversin compartment(GO:0097543) |
| 0.0 | 0.4 | GO:0097487 | multivesicular body, internal vesicle(GO:0097487) |
| 0.0 | 0.1 | GO:0002133 | polycystin complex(GO:0002133) |
| 0.0 | 0.1 | GO:1990635 | proximal dendrite(GO:1990635) |
| 0.0 | 0.3 | GO:1990909 | Wnt signalosome(GO:1990909) |
| 0.0 | 0.8 | GO:0097038 | perinuclear endoplasmic reticulum(GO:0097038) |
| 0.0 | 1.0 | GO:0005849 | mRNA cleavage factor complex(GO:0005849) |
| 0.0 | 0.2 | GO:1990452 | Parkin-FBXW7-Cul1 ubiquitin ligase complex(GO:1990452) |
| 0.0 | 1.2 | GO:0097228 | sperm principal piece(GO:0097228) |
| 0.0 | 0.2 | GO:0005658 | alpha DNA polymerase:primase complex(GO:0005658) |
| 0.0 | 0.1 | GO:0097134 | cyclin E1-CDK2 complex(GO:0097134) |
| 0.0 | 0.1 | GO:1990604 | IRE1-TRAF2-ASK1 complex(GO:1990604) |
| 0.0 | 0.1 | GO:0048179 | activin receptor complex(GO:0048179) |
| 0.0 | 0.8 | GO:0016010 | dystrophin-associated glycoprotein complex(GO:0016010) glycoprotein complex(GO:0090665) |
| 0.0 | 0.1 | GO:0005965 | protein farnesyltransferase complex(GO:0005965) |
| 0.0 | 0.4 | GO:0072546 | ER membrane protein complex(GO:0072546) |
| 0.0 | 0.4 | GO:0032039 | integrator complex(GO:0032039) |
| 0.0 | 0.3 | GO:0070775 | H3 histone acetyltransferase complex(GO:0070775) MOZ/MORF histone acetyltransferase complex(GO:0070776) |
| 0.0 | 0.1 | GO:0005745 | m-AAA complex(GO:0005745) |
| 0.0 | 0.5 | GO:0000812 | Swr1 complex(GO:0000812) |
| 0.0 | 1.0 | GO:0031092 | platelet alpha granule membrane(GO:0031092) |
| 0.0 | 0.4 | GO:0005818 | astral microtubule(GO:0000235) aster(GO:0005818) |
| 0.0 | 0.1 | GO:1902937 | inward rectifier potassium channel complex(GO:1902937) |
| 0.0 | 0.4 | GO:0044327 | dendritic spine head(GO:0044327) |
| 0.0 | 0.3 | GO:0031089 | platelet dense granule lumen(GO:0031089) |
| 0.0 | 0.2 | GO:0070847 | core mediator complex(GO:0070847) |
| 0.0 | 0.1 | GO:0030289 | protein phosphatase 4 complex(GO:0030289) |
| 0.0 | 0.1 | GO:0097025 | MPP7-DLG1-LIN7 complex(GO:0097025) |
| 0.0 | 0.9 | GO:0071437 | invadopodium(GO:0071437) |
| 0.0 | 0.1 | GO:0005967 | mitochondrial pyruvate dehydrogenase complex(GO:0005967) |
| 0.0 | 1.7 | GO:0017053 | transcriptional repressor complex(GO:0017053) |
| 0.0 | 0.1 | GO:0034457 | Mpp10 complex(GO:0034457) |
| 0.0 | 0.1 | GO:0044326 | dendritic spine neck(GO:0044326) |
| 0.0 | 0.1 | GO:0044352 | pinosome(GO:0044352) macropinosome(GO:0044354) |
| 0.0 | 0.3 | GO:0030991 | intraciliary transport particle A(GO:0030991) |
| 0.0 | 0.2 | GO:0030877 | beta-catenin destruction complex(GO:0030877) |
| 0.0 | 0.1 | GO:0000110 | nucleotide-excision repair factor 1 complex(GO:0000110) |
| 0.0 | 0.1 | GO:0008282 | ATP-sensitive potassium channel complex(GO:0008282) |
| 0.0 | 0.1 | GO:0032173 | septin ring(GO:0005940) septin collar(GO:0032173) |
| 0.0 | 0.3 | GO:0005672 | transcription factor TFIIA complex(GO:0005672) |
| 0.0 | 0.1 | GO:0070701 | mucus layer(GO:0070701) |
| 0.0 | 0.3 | GO:0043083 | synaptic cleft(GO:0043083) |
| 0.0 | 0.1 | GO:0005713 | recombination nodule(GO:0005713) |
| 0.0 | 0.6 | GO:0032809 | neuronal cell body membrane(GO:0032809) cell body membrane(GO:0044298) |
| 0.0 | 0.2 | GO:0042105 | alpha-beta T cell receptor complex(GO:0042105) |
| 0.0 | 0.1 | GO:0031251 | PAN complex(GO:0031251) |
| 0.0 | 0.7 | GO:0030057 | desmosome(GO:0030057) |
| 0.0 | 0.1 | GO:0097512 | cardiac myofibril(GO:0097512) |
| 0.0 | 0.2 | GO:0005853 | eukaryotic translation elongation factor 1 complex(GO:0005853) |
| 0.0 | 0.1 | GO:0031232 | extrinsic component of external side of plasma membrane(GO:0031232) |
| 0.0 | 0.1 | GO:1990584 | cardiac Troponin complex(GO:1990584) |
| 0.0 | 0.2 | GO:0032797 | SMN complex(GO:0032797) |
| 0.0 | 0.2 | GO:0016602 | CCAAT-binding factor complex(GO:0016602) |
| 0.0 | 0.4 | GO:0030285 | integral component of synaptic vesicle membrane(GO:0030285) intrinsic component of synaptic vesicle membrane(GO:0098563) |
| 0.0 | 0.1 | GO:0098536 | deuterosome(GO:0098536) |
| 0.0 | 0.7 | GO:0035869 | ciliary transition zone(GO:0035869) |
| 0.0 | 0.1 | GO:0034753 | nuclear aryl hydrocarbon receptor complex(GO:0034753) |
| 0.0 | 0.4 | GO:0097539 | ciliary transition fiber(GO:0097539) |
| 0.0 | 0.1 | GO:0097123 | cyclin A1-CDK2 complex(GO:0097123) |
| 0.0 | 0.1 | GO:0031010 | ISWI-type complex(GO:0031010) |
| 0.0 | 0.3 | GO:0044615 | nuclear pore nuclear basket(GO:0044615) |
| 0.0 | 0.1 | GO:0051233 | spindle midzone(GO:0051233) |
| 0.0 | 0.1 | GO:0008537 | proteasome activator complex(GO:0008537) |
| 0.0 | 0.5 | GO:0035145 | exon-exon junction complex(GO:0035145) |
| 0.0 | 0.1 | GO:0035631 | CD40 receptor complex(GO:0035631) |
| 0.0 | 0.4 | GO:0016281 | eukaryotic translation initiation factor 4F complex(GO:0016281) |
| 0.0 | 0.2 | GO:0001940 | male pronucleus(GO:0001940) |
| 0.0 | 0.2 | GO:0044233 | ER-mitochondrion membrane contact site(GO:0044233) |
| 0.0 | 0.1 | GO:0000811 | GINS complex(GO:0000811) |
| 0.0 | 2.3 | GO:0000118 | histone deacetylase complex(GO:0000118) |
| 0.0 | 0.5 | GO:0035327 | transcriptionally active chromatin(GO:0035327) |
| 0.0 | 1.7 | GO:0005905 | clathrin-coated pit(GO:0005905) |
| 0.0 | 0.1 | GO:0070852 | cell body fiber(GO:0070852) |
| 0.0 | 0.0 | GO:0005900 | oncostatin-M receptor complex(GO:0005900) |
| 0.0 | 0.4 | GO:1990124 | messenger ribonucleoprotein complex(GO:1990124) |
| 0.0 | 0.2 | GO:0005751 | mitochondrial respiratory chain complex IV(GO:0005751) |
| 0.0 | 0.1 | GO:0000242 | pericentriolar material(GO:0000242) |
| 0.0 | 0.2 | GO:0000164 | protein phosphatase type 1 complex(GO:0000164) |
| 0.0 | 0.1 | GO:0032301 | MutSalpha complex(GO:0032301) |
| 0.0 | 0.1 | GO:0071008 | U2-type post-mRNA release spliceosomal complex(GO:0071008) |
| 0.0 | 0.0 | GO:0002139 | stereocilia coupling link(GO:0002139) |
| 0.0 | 0.5 | GO:0005779 | integral component of peroxisomal membrane(GO:0005779) intrinsic component of peroxisomal membrane(GO:0031231) |
| 0.0 | 0.1 | GO:0071664 | beta-catenin-TCF7L2 complex(GO:0070369) catenin-TCF7L2 complex(GO:0071664) |
| 0.0 | 0.1 | GO:0031095 | platelet dense tubular network membrane(GO:0031095) |
| 0.0 | 0.3 | GO:0008250 | oligosaccharyltransferase complex(GO:0008250) |
| 0.0 | 0.1 | GO:0070022 | transforming growth factor beta receptor homodimeric complex(GO:0070022) |
| 0.0 | 0.3 | GO:0005952 | cAMP-dependent protein kinase complex(GO:0005952) |
| 0.0 | 0.2 | GO:0032433 | filopodium tip(GO:0032433) |
| 0.0 | 0.1 | GO:0032021 | NELF complex(GO:0032021) |
| 0.0 | 0.2 | GO:0001741 | XY body(GO:0001741) |
| 0.0 | 0.0 | GO:0071204 | histone pre-mRNA 3'end processing complex(GO:0071204) |
| 0.0 | 0.3 | GO:0017146 | NMDA selective glutamate receptor complex(GO:0017146) |
| 0.0 | 0.0 | GO:0035068 | micro-ribonucleoprotein complex(GO:0035068) |
| 0.0 | 0.1 | GO:0070876 | SOSS complex(GO:0070876) |
| 0.0 | 0.4 | GO:0032839 | dendrite cytoplasm(GO:0032839) |
| 0.0 | 0.9 | GO:0030173 | integral component of Golgi membrane(GO:0030173) |
| 0.0 | 0.7 | GO:0008287 | protein serine/threonine phosphatase complex(GO:0008287) phosphatase complex(GO:1903293) |
| 0.0 | 0.3 | GO:0005885 | Arp2/3 protein complex(GO:0005885) |
| 0.0 | 0.1 | GO:0097442 | CA3 pyramidal cell dendrite(GO:0097442) |
| 0.0 | 0.1 | GO:0017102 | methionyl glutamyl tRNA synthetase complex(GO:0017102) |
| 0.0 | 0.2 | GO:0000940 | condensed chromosome outer kinetochore(GO:0000940) |
| 0.0 | 0.1 | GO:0005797 | Golgi medial cisterna(GO:0005797) |
| 0.0 | 0.2 | GO:0030123 | AP-3 adaptor complex(GO:0030123) |
| 0.0 | 0.0 | GO:1990667 | PCSK9-AnxA2 complex(GO:1990667) |
| 0.0 | 0.1 | GO:0030906 | retromer, cargo-selective complex(GO:0030906) |
| 0.0 | 0.1 | GO:0014704 | intercalated disc(GO:0014704) |
| 0.0 | 0.2 | GO:0030008 | TRAPP complex(GO:0030008) |
| 0.0 | 0.1 | GO:0031428 | box C/D snoRNP complex(GO:0031428) |
| 0.0 | 0.2 | GO:0044666 | MLL3/4 complex(GO:0044666) |
| 0.0 | 0.1 | GO:0071817 | MMXD complex(GO:0071817) |
| 0.0 | 0.1 | GO:0098845 | postsynaptic endosome(GO:0098845) |
| 0.0 | 0.1 | GO:0072487 | MSL complex(GO:0072487) |
| 0.0 | 0.2 | GO:0097227 | sperm annulus(GO:0097227) |
| 0.0 | 0.1 | GO:0030897 | HOPS complex(GO:0030897) |
| 0.0 | 0.2 | GO:0005942 | phosphatidylinositol 3-kinase complex(GO:0005942) |
| 0.0 | 0.1 | GO:0008290 | F-actin capping protein complex(GO:0008290) |
| 0.0 | 0.0 | GO:0016939 | plus-end kinesin complex(GO:0005873) kinesin II complex(GO:0016939) |
| 0.0 | 0.3 | GO:0014731 | spectrin-associated cytoskeleton(GO:0014731) |
Gene overrepresentation in molecular_function category:
| Log-likelihood per target | Total log-likelihood | Term | Description |
|---|---|---|---|
| 0.2 | 0.9 | GO:0047860 | diiodophenylpyruvate reductase activity(GO:0047860) |
| 0.1 | 0.6 | GO:0034189 | very-low-density lipoprotein particle binding(GO:0034189) |
| 0.1 | 0.4 | GO:0031893 | vasopressin receptor binding(GO:0031893) V2 vasopressin receptor binding(GO:0031896) |
| 0.1 | 1.0 | GO:0070137 | ubiquitin-like protein-specific endopeptidase activity(GO:0070137) SUMO-specific endopeptidase activity(GO:0070139) |
| 0.1 | 0.3 | GO:0004584 | dolichyl-phosphate-mannose-glycolipid alpha-mannosyltransferase activity(GO:0004584) |
| 0.1 | 1.2 | GO:0010859 | calcium-dependent cysteine-type endopeptidase inhibitor activity(GO:0010859) |
| 0.1 | 0.4 | GO:0004727 | prenylated protein tyrosine phosphatase activity(GO:0004727) |
| 0.1 | 0.4 | GO:0036033 | mediator complex binding(GO:0036033) |
| 0.1 | 0.3 | GO:0035939 | microsatellite binding(GO:0035939) |
| 0.1 | 0.8 | GO:0035252 | UDP-xylosyltransferase activity(GO:0035252) xylosyltransferase activity(GO:0042285) |
| 0.1 | 0.9 | GO:0004883 | glucocorticoid receptor activity(GO:0004883) glucocorticoid-activated RNA polymerase II transcription factor binding transcription factor activity(GO:0038051) |
| 0.1 | 0.3 | GO:0004379 | glycylpeptide N-tetradecanoyltransferase activity(GO:0004379) myristoyltransferase activity(GO:0019107) |
| 0.1 | 0.6 | GO:0080019 | fatty-acyl-CoA reductase (alcohol-forming) activity(GO:0080019) |
| 0.1 | 1.2 | GO:0097100 | supercoiled DNA binding(GO:0097100) |
| 0.1 | 0.3 | GO:0016820 | hydrolase activity, acting on acid anhydrides, catalyzing transmembrane movement of substances(GO:0016820) |
| 0.1 | 0.8 | GO:0016618 | hydroxypyruvate reductase activity(GO:0016618) glyoxylate reductase (NADP) activity(GO:0030267) |
| 0.1 | 0.7 | GO:0003886 | DNA (cytosine-5-)-methyltransferase activity(GO:0003886) |
| 0.1 | 0.2 | GO:0031783 | corticotropin hormone receptor binding(GO:0031780) type 5 melanocortin receptor binding(GO:0031783) |
| 0.1 | 0.3 | GO:0003990 | acetylcholinesterase activity(GO:0003990) |
| 0.1 | 0.2 | GO:0016520 | growth hormone-releasing hormone receptor activity(GO:0016520) |
| 0.1 | 0.5 | GO:0061575 | cyclin-dependent protein serine/threonine kinase activator activity(GO:0061575) |
| 0.1 | 0.9 | GO:0033592 | RNA strand annealing activity(GO:0033592) |
| 0.1 | 0.5 | GO:0004594 | pantothenate kinase activity(GO:0004594) |
| 0.1 | 0.3 | GO:0003896 | DNA primase activity(GO:0003896) |
| 0.1 | 0.3 | GO:0004047 | aminomethyltransferase activity(GO:0004047) |
| 0.1 | 0.3 | GO:1904408 | dihydronicotinamide riboside quinone reductase activity(GO:0001512) melatonin binding(GO:1904408) |
| 0.1 | 1.5 | GO:0004861 | cyclin-dependent protein serine/threonine kinase inhibitor activity(GO:0004861) |
| 0.1 | 0.3 | GO:0071074 | eukaryotic initiation factor eIF2 binding(GO:0071074) |
| 0.1 | 0.2 | GO:0008746 | NAD(P)+ transhydrogenase activity(GO:0008746) oxidoreductase activity, acting on NAD(P)H, NAD(P) as acceptor(GO:0016652) |
| 0.1 | 0.2 | GO:0034736 | sterol O-acyltransferase activity(GO:0004772) cholesterol O-acyltransferase activity(GO:0034736) |
| 0.1 | 1.4 | GO:0016538 | cyclin-dependent protein serine/threonine kinase regulator activity(GO:0016538) |
| 0.1 | 0.4 | GO:0030144 | alpha-1,6-mannosylglycoprotein 6-beta-N-acetylglucosaminyltransferase activity(GO:0030144) |
| 0.1 | 0.2 | GO:0004307 | ethanolaminephosphotransferase activity(GO:0004307) |
| 0.1 | 0.5 | GO:0060698 | endoribonuclease inhibitor activity(GO:0060698) |
| 0.1 | 0.6 | GO:0032027 | myosin light chain binding(GO:0032027) |
| 0.1 | 0.2 | GO:0019828 | aspartic-type endopeptidase inhibitor activity(GO:0019828) |
| 0.1 | 0.4 | GO:0043813 | phosphatidylinositol-3,5-bisphosphate 5-phosphatase activity(GO:0043813) |
| 0.1 | 0.2 | GO:0010858 | calcium-dependent protein kinase inhibitor activity(GO:0008427) calcium-dependent protein kinase regulator activity(GO:0010858) |
| 0.1 | 0.4 | GO:0071535 | RING-like zinc finger domain binding(GO:0071535) |
| 0.1 | 0.3 | GO:0052839 | inositol 5-diphosphate pentakisphosphate 5-kinase activity(GO:0052836) inositol diphosphate tetrakisphosphate kinase activity(GO:0052839) |
| 0.1 | 0.2 | GO:0004020 | adenylylsulfate kinase activity(GO:0004020) sulfate adenylyltransferase activity(GO:0004779) sulfate adenylyltransferase (ATP) activity(GO:0004781) |
| 0.1 | 0.2 | GO:0001591 | dopamine neurotransmitter receptor activity, coupled via Gi/Go(GO:0001591) |
| 0.0 | 0.4 | GO:0004359 | glutaminase activity(GO:0004359) |
| 0.0 | 0.4 | GO:0016728 | ribonucleoside-diphosphate reductase activity, thioredoxin disulfide as acceptor(GO:0004748) oxidoreductase activity, acting on CH or CH2 groups, disulfide as acceptor(GO:0016728) ribonucleoside-diphosphate reductase activity(GO:0061731) |
| 0.0 | 0.1 | GO:0051033 | nucleic acid transmembrane transporter activity(GO:0051032) RNA transmembrane transporter activity(GO:0051033) |
| 0.0 | 0.1 | GO:0015130 | mevalonate transmembrane transporter activity(GO:0015130) |
| 0.0 | 0.4 | GO:1990763 | arrestin family protein binding(GO:1990763) |
| 0.0 | 0.1 | GO:0005365 | myo-inositol transmembrane transporter activity(GO:0005365) |
| 0.0 | 0.7 | GO:0033192 | calmodulin-dependent protein phosphatase activity(GO:0033192) |
| 0.0 | 0.1 | GO:0008332 | low voltage-gated calcium channel activity(GO:0008332) |
| 0.0 | 0.0 | GO:0034041 | sterol-transporting ATPase activity(GO:0034041) |
| 0.0 | 0.3 | GO:0003983 | UTP:glucose-1-phosphate uridylyltransferase activity(GO:0003983) UTP-monosaccharide-1-phosphate uridylyltransferase activity(GO:0051748) |
| 0.0 | 0.2 | GO:0004357 | glutamate-cysteine ligase activity(GO:0004357) |
| 0.0 | 0.9 | GO:0000150 | recombinase activity(GO:0000150) |
| 0.0 | 0.3 | GO:0001537 | N-acetylgalactosamine 4-O-sulfotransferase activity(GO:0001537) |
| 0.0 | 0.1 | GO:0043398 | HLH domain binding(GO:0043398) |
| 0.0 | 0.6 | GO:0070700 | BMP receptor binding(GO:0070700) |
| 0.0 | 0.3 | GO:0035402 | histone kinase activity (H3-T11 specific)(GO:0035402) |
| 0.0 | 0.3 | GO:0019776 | Atg8 ligase activity(GO:0019776) |
| 0.0 | 0.1 | GO:0008431 | vitamin E binding(GO:0008431) |
| 0.0 | 0.5 | GO:0030620 | U2 snRNA binding(GO:0030620) |
| 0.0 | 0.3 | GO:0051022 | GDP-dissociation inhibitor binding(GO:0051021) Rho GDP-dissociation inhibitor binding(GO:0051022) |
| 0.0 | 0.2 | GO:0015403 | thiamine uptake transmembrane transporter activity(GO:0015403) |
| 0.0 | 0.1 | GO:0045485 | omega-6 fatty acid desaturase activity(GO:0045485) |
| 0.0 | 0.3 | GO:0004534 | 5'-3' exoribonuclease activity(GO:0004534) |
| 0.0 | 0.2 | GO:0008798 | beta-aspartyl-peptidase activity(GO:0008798) |
| 0.0 | 0.1 | GO:0036487 | nitric-oxide synthase inhibitor activity(GO:0036487) |
| 0.0 | 0.2 | GO:0060961 | phospholipase D inhibitor activity(GO:0060961) |
| 0.0 | 0.5 | GO:0003910 | DNA ligase (ATP) activity(GO:0003910) |
| 0.0 | 0.2 | GO:0004723 | calcium-dependent protein serine/threonine phosphatase activity(GO:0004723) |
| 0.0 | 0.3 | GO:0003713 | transcription coactivator activity(GO:0003713) |
| 0.0 | 0.4 | GO:0038085 | vascular endothelial growth factor binding(GO:0038085) |
| 0.0 | 0.7 | GO:0008140 | cAMP response element binding protein binding(GO:0008140) |
| 0.0 | 0.2 | GO:0032795 | heterotrimeric G-protein binding(GO:0032795) |
| 0.0 | 0.2 | GO:0005222 | intracellular cAMP activated cation channel activity(GO:0005222) |
| 0.0 | 0.2 | GO:0008378 | galactosyltransferase activity(GO:0008378) |
| 0.0 | 0.1 | GO:0004170 | dUTP diphosphatase activity(GO:0004170) |
| 0.0 | 0.4 | GO:0043515 | kinetochore binding(GO:0043515) |
| 0.0 | 2.1 | GO:0031492 | nucleosomal DNA binding(GO:0031492) |
| 0.0 | 0.3 | GO:0010997 | anaphase-promoting complex binding(GO:0010997) |
| 0.0 | 0.3 | GO:0097027 | ubiquitin-protein transferase activator activity(GO:0097027) |
| 0.0 | 0.2 | GO:0016361 | activin receptor activity, type I(GO:0016361) |
| 0.0 | 0.5 | GO:0032050 | clathrin heavy chain binding(GO:0032050) |
| 0.0 | 0.1 | GO:0004874 | aryl hydrocarbon receptor activity(GO:0004874) |
| 0.0 | 0.7 | GO:0008494 | translation activator activity(GO:0008494) |
| 0.0 | 0.5 | GO:0001135 | transcription factor activity, RNA polymerase II transcription factor recruiting(GO:0001135) |
| 0.0 | 0.4 | GO:0004322 | ferroxidase activity(GO:0004322) oxidoreductase activity, oxidizing metal ions, oxygen as acceptor(GO:0016724) |
| 0.0 | 0.2 | GO:0047184 | 1-acylglycerophosphocholine O-acyltransferase activity(GO:0047184) |
| 0.0 | 0.5 | GO:0035612 | AP-2 adaptor complex binding(GO:0035612) |
| 0.0 | 0.1 | GO:0086039 | lutropin-choriogonadotropic hormone receptor binding(GO:0031775) calcium-transporting ATPase activity involved in regulation of cardiac muscle cell membrane potential(GO:0086039) |
| 0.0 | 0.1 | GO:0001602 | pancreatic polypeptide receptor activity(GO:0001602) |
| 0.0 | 0.7 | GO:0043274 | phospholipase binding(GO:0043274) |
| 0.0 | 0.2 | GO:0016155 | formyltetrahydrofolate dehydrogenase activity(GO:0016155) |
| 0.0 | 0.3 | GO:0004749 | ribose phosphate diphosphokinase activity(GO:0004749) |
| 0.0 | 0.1 | GO:0071209 | U7 snRNA binding(GO:0071209) |
| 0.0 | 0.1 | GO:0061598 | molybdopterin adenylyltransferase activity(GO:0061598) molybdopterin molybdotransferase activity(GO:0061599) |
| 0.0 | 0.5 | GO:0046935 | 1-phosphatidylinositol-3-kinase regulator activity(GO:0046935) |
| 0.0 | 0.1 | GO:0019166 | trans-2-enoyl-CoA reductase (NADPH) activity(GO:0019166) |
| 0.0 | 0.4 | GO:0097157 | pre-mRNA intronic binding(GO:0097157) |
| 0.0 | 0.2 | GO:0099580 | ion antiporter activity involved in regulation of postsynaptic membrane potential(GO:0099580) |
| 0.0 | 0.1 | GO:0042781 | 3'-tRNA processing endoribonuclease activity(GO:0042781) |
| 0.0 | 0.2 | GO:0004741 | [pyruvate dehydrogenase (lipoamide)] phosphatase activity(GO:0004741) |
| 0.0 | 0.2 | GO:0042799 | histone methyltransferase activity (H4-K20 specific)(GO:0042799) |
| 0.0 | 0.4 | GO:0086083 | cell adhesive protein binding involved in bundle of His cell-Purkinje myocyte communication(GO:0086083) |
| 0.0 | 0.1 | GO:0090631 | pre-miRNA transporter activity(GO:0090631) |
| 0.0 | 0.2 | GO:0061649 | ubiquitinated histone binding(GO:0061649) |
| 0.0 | 0.1 | GO:0050265 | RNA uridylyltransferase activity(GO:0050265) |
| 0.0 | 0.1 | GO:0050146 | nucleoside phosphotransferase activity(GO:0050146) |
| 0.0 | 0.1 | GO:0008384 | IkappaB kinase activity(GO:0008384) |
| 0.0 | 0.9 | GO:0030296 | protein tyrosine kinase activator activity(GO:0030296) |
| 0.0 | 1.0 | GO:0004653 | polypeptide N-acetylgalactosaminyltransferase activity(GO:0004653) |
| 0.0 | 0.1 | GO:0005298 | proline:sodium symporter activity(GO:0005298) |
| 0.0 | 0.2 | GO:0052845 | endopolyphosphatase activity(GO:0000298) diphosphoinositol-polyphosphate diphosphatase activity(GO:0008486) bis(5'-adenosyl)-hexaphosphatase activity(GO:0034431) bis(5'-adenosyl)-pentaphosphatase activity(GO:0034432) inositol diphosphate tetrakisphosphate diphosphatase activity(GO:0052840) inositol bisdiphosphate tetrakisphosphate diphosphatase activity(GO:0052841) inositol diphosphate pentakisphosphate diphosphatase activity(GO:0052842) inositol-1-diphosphate-2,3,4,5,6-pentakisphosphate diphosphatase activity(GO:0052843) inositol-3-diphosphate-1,2,4,5,6-pentakisphosphate diphosphatase activity(GO:0052844) inositol-5-diphosphate-1,2,3,4,6-pentakisphosphate diphosphatase activity(GO:0052845) inositol-1,5-bisdiphosphate-2,3,4,6-tetrakisphosphate 1-diphosphatase activity(GO:0052846) inositol-1,5-bisdiphosphate-2,3,4,6-tetrakisphosphate 5-diphosphatase activity(GO:0052847) inositol-3,5-bisdiphosphate-2,3,4,6-tetrakisphosphate 5-diphosphatase activity(GO:0052848) |
| 0.0 | 0.2 | GO:0000309 | nicotinamide-nucleotide adenylyltransferase activity(GO:0000309) |
| 0.0 | 0.2 | GO:0016206 | catechol O-methyltransferase activity(GO:0016206) |
| 0.0 | 0.8 | GO:0005104 | fibroblast growth factor receptor binding(GO:0005104) |
| 0.0 | 0.2 | GO:0008131 | primary amine oxidase activity(GO:0008131) |
| 0.0 | 0.7 | GO:0008510 | sodium:bicarbonate symporter activity(GO:0008510) |
| 0.0 | 0.3 | GO:0031386 | protein tag(GO:0031386) |
| 0.0 | 0.1 | GO:0033829 | O-fucosylpeptide 3-beta-N-acetylglucosaminyltransferase activity(GO:0033829) |
| 0.0 | 0.2 | GO:0046899 | nucleoside triphosphate adenylate kinase activity(GO:0046899) |
| 0.0 | 0.2 | GO:0043142 | single-stranded DNA-dependent ATPase activity(GO:0043142) |
| 0.0 | 0.5 | GO:0042809 | vitamin D receptor binding(GO:0042809) |
| 0.0 | 0.2 | GO:0004832 | valine-tRNA ligase activity(GO:0004832) |
| 0.0 | 0.1 | GO:0004996 | thyroid-stimulating hormone receptor activity(GO:0004996) |
| 0.0 | 0.1 | GO:0004660 | protein farnesyltransferase activity(GO:0004660) |
| 0.0 | 0.1 | GO:0035403 | histone kinase activity (H3-T6 specific)(GO:0035403) |
| 0.0 | 0.1 | GO:0017002 | activin-activated receptor activity(GO:0017002) |
| 0.0 | 0.1 | GO:0016768 | spermine synthase activity(GO:0016768) |
| 0.0 | 0.3 | GO:0038036 | sphingosine-1-phosphate receptor activity(GO:0038036) |
| 0.0 | 0.3 | GO:0097617 | annealing helicase activity(GO:0036310) annealing activity(GO:0097617) |
| 0.0 | 0.2 | GO:0003747 | translation release factor activity(GO:0003747) translation termination factor activity(GO:0008079) |
| 0.0 | 0.2 | GO:0016929 | SUMO-specific protease activity(GO:0016929) |
| 0.0 | 0.2 | GO:0043426 | MRF binding(GO:0043426) |
| 0.0 | 0.2 | GO:0030160 | GKAP/Homer scaffold activity(GO:0030160) |
| 0.0 | 0.2 | GO:0035198 | miRNA binding(GO:0035198) |
| 0.0 | 0.5 | GO:0008179 | adenylate cyclase binding(GO:0008179) |
| 0.0 | 0.2 | GO:0060072 | large conductance calcium-activated potassium channel activity(GO:0060072) |
| 0.0 | 0.2 | GO:0003828 | alpha-N-acetylneuraminate alpha-2,8-sialyltransferase activity(GO:0003828) |
| 0.0 | 0.1 | GO:0000155 | phosphorelay sensor kinase activity(GO:0000155) |
| 0.0 | 0.1 | GO:0034511 | U3 snoRNA binding(GO:0034511) |
| 0.0 | 0.1 | GO:0023030 | MHC class Ib protein complex binding(GO:0023025) MHC class Ib protein binding, via antigen binding groove(GO:0023030) |
| 0.0 | 0.0 | GO:0097322 | 7SK snRNA binding(GO:0097322) |
| 0.0 | 0.1 | GO:0003839 | gamma-glutamylcyclotransferase activity(GO:0003839) |
| 0.0 | 0.0 | GO:0004886 | 9-cis retinoic acid receptor activity(GO:0004886) |
| 0.0 | 0.2 | GO:0017040 | ceramidase activity(GO:0017040) |
| 0.0 | 0.1 | GO:0004157 | dihydropyrimidinase activity(GO:0004157) |
| 0.0 | 0.1 | GO:0017098 | sulfonylurea receptor binding(GO:0017098) |
| 0.0 | 0.1 | GO:0004740 | pyruvate dehydrogenase (acetyl-transferring) kinase activity(GO:0004740) |
| 0.0 | 0.1 | GO:0044736 | acid-sensing ion channel activity(GO:0044736) |
| 0.0 | 0.3 | GO:0004652 | polynucleotide adenylyltransferase activity(GO:0004652) |
| 0.0 | 0.1 | GO:0008073 | ornithine decarboxylase inhibitor activity(GO:0008073) |
| 0.0 | 0.1 | GO:0005173 | stem cell factor receptor binding(GO:0005173) |
| 0.0 | 0.4 | GO:0045295 | gamma-catenin binding(GO:0045295) |
| 0.0 | 0.2 | GO:0008449 | N-acetylglucosamine-6-sulfatase activity(GO:0008449) |
| 0.0 | 0.1 | GO:0036440 | citrate (Si)-synthase activity(GO:0004108) citrate synthase activity(GO:0036440) |
| 0.0 | 0.2 | GO:0004865 | protein serine/threonine phosphatase inhibitor activity(GO:0004865) |
| 0.0 | 0.1 | GO:0004613 | phosphoenolpyruvate carboxykinase activity(GO:0004611) phosphoenolpyruvate carboxykinase (GTP) activity(GO:0004613) |
| 0.0 | 0.1 | GO:0070320 | inward rectifier potassium channel inhibitor activity(GO:0070320) |
| 0.0 | 0.4 | GO:0004579 | dolichyl-diphosphooligosaccharide-protein glycotransferase activity(GO:0004579) |
| 0.0 | 0.2 | GO:0042835 | BRE binding(GO:0042835) |
| 0.0 | 0.1 | GO:0008020 | G-protein coupled photoreceptor activity(GO:0008020) |
| 0.0 | 0.0 | GO:0015018 | galactosylgalactosylxylosylprotein 3-beta-glucuronosyltransferase activity(GO:0015018) |
| 0.0 | 0.2 | GO:0008526 | phosphatidylinositol transporter activity(GO:0008526) |
| 0.0 | 0.5 | GO:0008266 | poly(U) RNA binding(GO:0008266) |
| 0.0 | 0.2 | GO:0042731 | PH domain binding(GO:0042731) |
| 0.0 | 0.2 | GO:0005005 | transmembrane-ephrin receptor activity(GO:0005005) |
| 0.0 | 0.1 | GO:0004756 | selenide, water dikinase activity(GO:0004756) phosphotransferase activity, paired acceptors(GO:0016781) |
| 0.0 | 0.1 | GO:0035500 | MH2 domain binding(GO:0035500) |
| 0.0 | 0.1 | GO:0019960 | C-X3-C chemokine binding(GO:0019960) |
| 0.0 | 0.2 | GO:1990247 | N6-methyladenosine-containing RNA binding(GO:1990247) |
| 0.0 | 0.1 | GO:0004991 | parathyroid hormone receptor activity(GO:0004991) |
| 0.0 | 0.7 | GO:0030553 | cGMP binding(GO:0030553) |
| 0.0 | 0.1 | GO:0034186 | apolipoprotein A-I binding(GO:0034186) |
| 0.0 | 0.1 | GO:0034235 | GPI anchor binding(GO:0034235) |
| 0.0 | 0.5 | GO:0102391 | decanoate--CoA ligase activity(GO:0102391) |
| 0.0 | 0.0 | GO:0038025 | reelin receptor activity(GO:0038025) |
| 0.0 | 0.2 | GO:0070016 | armadillo repeat domain binding(GO:0070016) |
| 0.0 | 0.6 | GO:0015002 | cytochrome-c oxidase activity(GO:0004129) heme-copper terminal oxidase activity(GO:0015002) oxidoreductase activity, acting on a heme group of donors, oxygen as acceptor(GO:0016676) |
| 0.0 | 0.2 | GO:0030548 | acetylcholine receptor regulator activity(GO:0030548) neurotransmitter receptor regulator activity(GO:0099602) |
| 0.0 | 0.1 | GO:0004936 | alpha-adrenergic receptor activity(GO:0004936) |
| 0.0 | 0.1 | GO:0016015 | morphogen activity(GO:0016015) |
| 0.0 | 0.2 | GO:0033170 | DNA clamp loader activity(GO:0003689) protein-DNA loading ATPase activity(GO:0033170) |
| 0.0 | 0.2 | GO:0045545 | syndecan binding(GO:0045545) |
| 0.0 | 0.0 | GO:0098821 | BMP receptor activity(GO:0098821) |
| 0.0 | 0.1 | GO:0004483 | mRNA (nucleoside-2'-O-)-methyltransferase activity(GO:0004483) |
| 0.0 | 0.0 | GO:0071208 | histone pre-mRNA DCP binding(GO:0071208) |
| 0.0 | 0.2 | GO:0003835 | beta-galactoside alpha-2,6-sialyltransferase activity(GO:0003835) |
| 0.0 | 0.1 | GO:0004614 | phosphoglucomutase activity(GO:0004614) |
| 0.0 | 0.1 | GO:0000146 | microfilament motor activity(GO:0000146) |
| 0.0 | 0.2 | GO:0070181 | small ribosomal subunit rRNA binding(GO:0070181) |
| 0.0 | 2.3 | GO:0004843 | thiol-dependent ubiquitin-specific protease activity(GO:0004843) |
| 0.0 | 0.3 | GO:0004571 | mannosyl-oligosaccharide 1,2-alpha-mannosidase activity(GO:0004571) |
| 0.0 | 0.1 | GO:0004176 | ATP-dependent peptidase activity(GO:0004176) |
| 0.0 | 5.1 | GO:0042393 | histone binding(GO:0042393) |
| 0.0 | 0.8 | GO:0008139 | nuclear localization sequence binding(GO:0008139) |
| 0.0 | 0.5 | GO:0070034 | telomerase RNA binding(GO:0070034) |
| 0.0 | 0.1 | GO:0090541 | MIT domain binding(GO:0090541) |
| 0.0 | 0.1 | GO:0071253 | connexin binding(GO:0071253) |
| 0.0 | 0.1 | GO:0097001 | ceramide binding(GO:0097001) |
| 0.0 | 0.1 | GO:0008174 | mRNA methyltransferase activity(GO:0008174) |
| 0.0 | 0.1 | GO:0038132 | neuregulin binding(GO:0038132) |
| 0.0 | 0.1 | GO:0051734 | ATP-dependent polydeoxyribonucleotide 5'-hydroxyl-kinase activity(GO:0046404) polydeoxyribonucleotide kinase activity(GO:0051733) ATP-dependent polynucleotide kinase activity(GO:0051734) |
| 0.0 | 0.8 | GO:0051959 | dynein light intermediate chain binding(GO:0051959) |
| 0.0 | 0.1 | GO:0001641 | group II metabotropic glutamate receptor activity(GO:0001641) |
| 0.0 | 0.8 | GO:0001671 | ATPase activator activity(GO:0001671) |
| 0.0 | 0.3 | GO:0016861 | intramolecular oxidoreductase activity, interconverting aldoses and ketoses(GO:0016861) |
| 0.0 | 0.1 | GO:0097677 | STAT family protein binding(GO:0097677) |
| 0.0 | 0.3 | GO:0042608 | T cell receptor binding(GO:0042608) |
| 0.0 | 0.2 | GO:0035312 | 5'-3' exodeoxyribonuclease activity(GO:0035312) |
| 0.0 | 0.1 | GO:0052591 | sn-glycerol-3-phosphate:ubiquinone oxidoreductase activity(GO:0052590) sn-glycerol-3-phosphate:ubiquinone-8 oxidoreductase activity(GO:0052591) |
| 0.0 | 0.0 | GO:0004139 | deoxyribose-phosphate aldolase activity(GO:0004139) |
| 0.0 | 0.1 | GO:0005087 | Ran guanyl-nucleotide exchange factor activity(GO:0005087) |
| 0.0 | 0.1 | GO:0004822 | isoleucine-tRNA ligase activity(GO:0004822) |
| 0.0 | 0.1 | GO:0015111 | iodide transmembrane transporter activity(GO:0015111) |
| 0.0 | 0.2 | GO:0042296 | ISG15 transferase activity(GO:0042296) |
| 0.0 | 0.2 | GO:0015280 | ligand-gated sodium channel activity(GO:0015280) |
| 0.0 | 0.5 | GO:0051537 | 2 iron, 2 sulfur cluster binding(GO:0051537) |
| 0.0 | 0.2 | GO:0043138 | 3'-5' DNA helicase activity(GO:0043138) |
| 0.0 | 0.1 | GO:0031849 | olfactory receptor binding(GO:0031849) |
| 0.0 | 0.1 | GO:0061665 | SUMO ligase activity(GO:0061665) |
| 0.0 | 0.3 | GO:0015095 | magnesium ion transmembrane transporter activity(GO:0015095) |
| 0.0 | 0.1 | GO:0046921 | glycoprotein 6-alpha-L-fucosyltransferase activity(GO:0008424) alpha-(1->6)-fucosyltransferase activity(GO:0046921) |
| 0.0 | 0.1 | GO:0005157 | macrophage colony-stimulating factor receptor binding(GO:0005157) |
| 0.0 | 0.1 | GO:0008172 | S-methyltransferase activity(GO:0008172) |
| 0.0 | 0.5 | GO:0003951 | NAD+ kinase activity(GO:0003951) |
| 0.0 | 0.1 | GO:0030957 | Tat protein binding(GO:0030957) |
| 0.0 | 0.1 | GO:0046790 | virion binding(GO:0046790) |
| 0.0 | 0.1 | GO:0030172 | troponin C binding(GO:0030172) |
| 0.0 | 0.0 | GO:0033149 | FFAT motif binding(GO:0033149) |
| 0.0 | 0.1 | GO:0031078 | histone deacetylase activity (H3-K14 specific)(GO:0031078) NAD-dependent histone deacetylase activity (H3-K14 specific)(GO:0032041) |
| 0.0 | 0.1 | GO:0004768 | stearoyl-CoA 9-desaturase activity(GO:0004768) acyl-CoA desaturase activity(GO:0016215) |
| 0.0 | 0.0 | GO:0000405 | bubble DNA binding(GO:0000405) |
| 0.0 | 0.2 | GO:0005537 | mannose binding(GO:0005537) |
| 0.0 | 0.4 | GO:0005520 | insulin-like growth factor binding(GO:0005520) |
| 0.0 | 0.1 | GO:0003998 | acylphosphatase activity(GO:0003998) |
| 0.0 | 0.1 | GO:0034056 | estrogen response element binding(GO:0034056) |
| 0.0 | 0.1 | GO:0019213 | deacetylase activity(GO:0019213) |
| 0.0 | 0.1 | GO:0016165 | linoleate 13S-lipoxygenase activity(GO:0016165) hepoxilin-epoxide hydrolase activity(GO:0047977) |
| 0.0 | 0.2 | GO:0016301 | kinase activity(GO:0016301) |
| 0.0 | 0.7 | GO:0030507 | spectrin binding(GO:0030507) |
| 0.0 | 0.1 | GO:0030614 | oxidoreductase activity, acting on a sulfur group of donors, quinone or similar compound as acceptor(GO:0016672) oxidoreductase activity, acting on phosphorus or arsenic in donors(GO:0030613) oxidoreductase activity, acting on phosphorus or arsenic in donors, disulfide as acceptor(GO:0030614) glutathione dehydrogenase (ascorbate) activity(GO:0045174) methylarsonate reductase activity(GO:0050610) |
| 0.0 | 0.0 | GO:0050659 | N-acetylgalactosamine 4-sulfate 6-O-sulfotransferase activity(GO:0050659) |
| 0.0 | 0.1 | GO:0046975 | histone methyltransferase activity (H3-K36 specific)(GO:0046975) |
| 0.0 | 0.1 | GO:1990239 | steroid hormone binding(GO:1990239) |
| 0.0 | 0.1 | GO:0051371 | muscle alpha-actinin binding(GO:0051371) |
| 0.0 | 0.4 | GO:0008157 | protein phosphatase 1 binding(GO:0008157) |
| 0.0 | 0.1 | GO:0016416 | O-palmitoyltransferase activity(GO:0016416) |
| 0.0 | 0.4 | GO:0048027 | mRNA 5'-UTR binding(GO:0048027) |
| 0.0 | 0.2 | GO:0051011 | microtubule minus-end binding(GO:0051011) |
| 0.0 | 0.4 | GO:0070300 | phosphatidic acid binding(GO:0070300) |
| 0.0 | 0.1 | GO:0070087 | chromo shadow domain binding(GO:0070087) |
| 0.0 | 0.1 | GO:0001665 | alpha-N-acetylgalactosaminide alpha-2,6-sialyltransferase activity(GO:0001665) |
| 0.0 | 0.4 | GO:0030371 | translation repressor activity(GO:0030371) |
| 0.0 | 0.2 | GO:0047134 | protein-disulfide reductase activity(GO:0047134) |
| 0.0 | 0.0 | GO:0009041 | uridylate kinase activity(GO:0009041) |
| 0.0 | 0.0 | GO:0004897 | ciliary neurotrophic factor receptor activity(GO:0004897) |
| 0.0 | 0.0 | GO:0004915 | interleukin-6 receptor activity(GO:0004915) leukemia inhibitory factor receptor activity(GO:0004923) interleukin-6 binding(GO:0019981) |
| 0.0 | 0.1 | GO:1903136 | cuprous ion binding(GO:1903136) |
| 0.0 | 0.1 | GO:0051721 | protein phosphatase 2A binding(GO:0051721) |
| 0.0 | 0.4 | GO:0000175 | 3'-5'-exoribonuclease activity(GO:0000175) |
| 0.0 | 0.1 | GO:0061133 | endopeptidase activator activity(GO:0061133) |
| 0.0 | 0.1 | GO:0043024 | ribosomal small subunit binding(GO:0043024) |
| 0.0 | 0.1 | GO:0001025 | RNA polymerase III transcription factor binding(GO:0001025) |
| 0.0 | 0.1 | GO:0003996 | acyl-CoA ligase activity(GO:0003996) |
| 0.0 | 0.3 | GO:0017166 | vinculin binding(GO:0017166) |
| 0.0 | 0.6 | GO:0030374 | ligand-dependent nuclear receptor transcription coactivator activity(GO:0030374) |
| 0.0 | 0.2 | GO:0050811 | GABA receptor binding(GO:0050811) |
| 0.0 | 0.2 | GO:0097602 | cullin family protein binding(GO:0097602) |
| 0.0 | 0.5 | GO:0019783 | ubiquitin-like protein-specific protease activity(GO:0019783) |
| 0.0 | 0.1 | GO:0019855 | calcium channel inhibitor activity(GO:0019855) |
| 0.0 | 0.9 | GO:0017112 | Rab guanyl-nucleotide exchange factor activity(GO:0017112) |
Gene overrepresentation in C2:CP category:
| Log-likelihood per target | Total log-likelihood | Term | Description |
|---|---|---|---|
| 0.1 | 0.2 | PID ER NONGENOMIC PATHWAY | Plasma membrane estrogen receptor signaling |
| 0.1 | 1.4 | SA REG CASCADE OF CYCLIN EXPR | Expression of cyclins regulates progression through the cell cycle by activating cyclin-dependent kinases. |
| 0.0 | 0.2 | PID ALK1 PATHWAY | ALK1 signaling events |
| 0.0 | 0.5 | ST JAK STAT PATHWAY | Jak-STAT Pathway |
| 0.0 | 0.6 | PID TCR RAS PATHWAY | Ras signaling in the CD4+ TCR pathway |
| 0.0 | 0.7 | PID ALK2 PATHWAY | ALK2 signaling events |
| 0.0 | 2.9 | PID PLK1 PATHWAY | PLK1 signaling events |
| 0.0 | 1.8 | PID TCR CALCIUM PATHWAY | Calcium signaling in the CD4+ TCR pathway |
| 0.0 | 0.1 | PID ERB GENOMIC PATHWAY | Validated nuclear estrogen receptor beta network |
| 0.0 | 0.8 | PID PRL SIGNALING EVENTS PATHWAY | Signaling events mediated by PRL |
| 0.0 | 0.4 | PID S1P S1P4 PATHWAY | S1P4 pathway |
| 0.0 | 0.3 | ST INTEGRIN SIGNALING PATHWAY | Integrin Signaling Pathway |
| 0.0 | 0.2 | SA G2 AND M PHASES | Cdc25 activates the cdc2/cyclin B complex to induce the G2/M transition. |
| 0.0 | 2.3 | PID AR TF PATHWAY | Regulation of Androgen receptor activity |
| 0.0 | 0.9 | PID SMAD2 3PATHWAY | Regulation of cytoplasmic and nuclear SMAD2/3 signaling |
| 0.0 | 0.3 | PID RANBP2 PATHWAY | Sumoylation by RanBP2 regulates transcriptional repression |
| 0.0 | 1.3 | PID HES HEY PATHWAY | Notch-mediated HES/HEY network |
| 0.0 | 0.9 | PID LIS1 PATHWAY | Lissencephaly gene (LIS1) in neuronal migration and development |
| 0.0 | 1.1 | PID ATR PATHWAY | ATR signaling pathway |
| 0.0 | 0.4 | PID IL5 PATHWAY | IL5-mediated signaling events |
| 0.0 | 0.3 | PID VEGF VEGFR PATHWAY | VEGF and VEGFR signaling network |
| 0.0 | 0.2 | PID IGF1 PATHWAY | IGF1 pathway |
| 0.0 | 0.3 | PID VEGFR1 PATHWAY | VEGFR1 specific signals |
| 0.0 | 0.3 | PID A6B1 A6B4 INTEGRIN PATHWAY | a6b1 and a6b4 Integrin signaling |
| 0.0 | 0.6 | PID CXCR3 PATHWAY | CXCR3-mediated signaling events |
| 0.0 | 0.3 | PID BARD1 PATHWAY | BARD1 signaling events |
| 0.0 | 0.1 | PID IL27 PATHWAY | IL27-mediated signaling events |
| 0.0 | 1.2 | PID RAC1 PATHWAY | RAC1 signaling pathway |
| 0.0 | 0.1 | SA G1 AND S PHASES | Cdk2, 4, and 6 bind cyclin D in G1, while cdk2/cyclin E promotes the G1/S transition. |
| 0.0 | 0.9 | PID AURORA B PATHWAY | Aurora B signaling |
| 0.0 | 0.7 | ST P38 MAPK PATHWAY | p38 MAPK Pathway |
| 0.0 | 1.1 | PID REG GR PATHWAY | Glucocorticoid receptor regulatory network |
| 0.0 | 0.4 | PID ALPHA SYNUCLEIN PATHWAY | Alpha-synuclein signaling |
| 0.0 | 0.2 | PID CDC42 REG PATHWAY | Regulation of CDC42 activity |
Gene overrepresentation in C2:CP:REACTOME category:
| Log-likelihood per target | Total log-likelihood | Term | Description |
|---|---|---|---|
| 0.1 | 1.0 | REACTOME APOBEC3G MEDIATED RESISTANCE TO HIV1 INFECTION | Genes involved in APOBEC3G mediated resistance to HIV-1 infection |
| 0.1 | 0.1 | REACTOME NEP NS2 INTERACTS WITH THE CELLULAR EXPORT MACHINERY | Genes involved in NEP/NS2 Interacts with the Cellular Export Machinery |
| 0.1 | 0.2 | REACTOME E2F ENABLED INHIBITION OF PRE REPLICATION COMPLEX FORMATION | Genes involved in E2F-enabled inhibition of pre-replication complex formation |
| 0.1 | 1.0 | REACTOME DSCAM INTERACTIONS | Genes involved in DSCAM interactions |
| 0.0 | 1.3 | REACTOME PROCESSING OF INTRONLESS PRE MRNAS | Genes involved in Processing of Intronless Pre-mRNAs |
| 0.0 | 0.9 | REACTOME APOPTOSIS INDUCED DNA FRAGMENTATION | Genes involved in Apoptosis induced DNA fragmentation |
| 0.0 | 0.2 | REACTOME PEPTIDE CHAIN ELONGATION | Genes involved in Peptide chain elongation |
| 0.0 | 0.4 | REACTOME MEMBRANE BINDING AND TARGETTING OF GAG PROTEINS | Genes involved in Membrane binding and targetting of GAG proteins |
| 0.0 | 0.8 | REACTOME NOTCH HLH TRANSCRIPTION PATHWAY | Genes involved in Notch-HLH transcription pathway |
| 0.0 | 0.5 | REACTOME SYNTHESIS SECRETION AND INACTIVATION OF GIP | Genes involved in Synthesis, Secretion, and Inactivation of Glucose-dependent Insulinotropic Polypeptide (GIP) |
| 0.0 | 0.2 | REACTOME RNA POL I PROMOTER OPENING | Genes involved in RNA Polymerase I Promoter Opening |
| 0.0 | 0.8 | REACTOME APOPTOTIC CLEAVAGE OF CELL ADHESION PROTEINS | Genes involved in Apoptotic cleavage of cell adhesion proteins |
| 0.0 | 2.4 | REACTOME G1 PHASE | Genes involved in G1 Phase |
| 0.0 | 0.4 | REACTOME RECEPTOR LIGAND BINDING INITIATES THE SECOND PROTEOLYTIC CLEAVAGE OF NOTCH RECEPTOR | Genes involved in Receptor-ligand binding initiates the second proteolytic cleavage of Notch receptor |
| 0.0 | 0.9 | REACTOME G0 AND EARLY G1 | Genes involved in G0 and Early G1 |
| 0.0 | 0.1 | REACTOME P75NTR RECRUITS SIGNALLING COMPLEXES | Genes involved in p75NTR recruits signalling complexes |
| 0.0 | 0.4 | REACTOME FGFR4 LIGAND BINDING AND ACTIVATION | Genes involved in FGFR4 ligand binding and activation |
| 0.0 | 1.2 | REACTOME KINESINS | Genes involved in Kinesins |
| 0.0 | 0.4 | REACTOME EARLY PHASE OF HIV LIFE CYCLE | Genes involved in Early Phase of HIV Life Cycle |
| 0.0 | 0.5 | REACTOME VITAMIN B5 PANTOTHENATE METABOLISM | Genes involved in Vitamin B5 (pantothenate) metabolism |
| 0.0 | 0.1 | REACTOME ACTIVATION OF NF KAPPAB IN B CELLS | Genes involved in Activation of NF-kappaB in B Cells |
| 0.0 | 0.1 | REACTOME SPRY REGULATION OF FGF SIGNALING | Genes involved in Spry regulation of FGF signaling |
| 0.0 | 0.1 | REACTOME INFLUENZA LIFE CYCLE | Genes involved in Influenza Life Cycle |
| 0.0 | 0.1 | REACTOME AQUAPORIN MEDIATED TRANSPORT | Genes involved in Aquaporin-mediated transport |
| 0.0 | 0.7 | REACTOME SYNTHESIS OF GLYCOSYLPHOSPHATIDYLINOSITOL GPI | Genes involved in Synthesis of glycosylphosphatidylinositol (GPI) |
| 0.0 | 0.9 | REACTOME PKA MEDIATED PHOSPHORYLATION OF CREB | Genes involved in PKA-mediated phosphorylation of CREB |
| 0.0 | 1.1 | REACTOME ACTIVATION OF ATR IN RESPONSE TO REPLICATION STRESS | Genes involved in Activation of ATR in response to replication stress |
| 0.0 | 0.5 | REACTOME SEMA3A PLEXIN REPULSION SIGNALING BY INHIBITING INTEGRIN ADHESION | Genes involved in SEMA3A-Plexin repulsion signaling by inhibiting Integrin adhesion |
| 0.0 | 0.5 | REACTOME GLUCURONIDATION | Genes involved in Glucuronidation |
| 0.0 | 0.5 | REACTOME FORMATION OF INCISION COMPLEX IN GG NER | Genes involved in Formation of incision complex in GG-NER |
| 0.0 | 0.7 | REACTOME SYNTHESIS OF VERY LONG CHAIN FATTY ACYL COAS | Genes involved in Synthesis of very long-chain fatty acyl-CoAs |
| 0.0 | 0.5 | REACTOME IL 7 SIGNALING | Genes involved in Interleukin-7 signaling |
| 0.0 | 0.4 | REACTOME MRNA DECAY BY 5 TO 3 EXORIBONUCLEASE | Genes involved in mRNA Decay by 5' to 3' Exoribonuclease |
| 0.0 | 0.3 | REACTOME RECYCLING PATHWAY OF L1 | Genes involved in Recycling pathway of L1 |
| 0.0 | 1.6 | REACTOME O LINKED GLYCOSYLATION OF MUCINS | Genes involved in O-linked glycosylation of mucins |
| 0.0 | 0.3 | REACTOME SYNTHESIS OF PIPS AT THE LATE ENDOSOME MEMBRANE | Genes involved in Synthesis of PIPs at the late endosome membrane |
| 0.0 | 0.3 | REACTOME TRYPTOPHAN CATABOLISM | Genes involved in Tryptophan catabolism |
| 0.0 | 0.6 | REACTOME AMINO ACID SYNTHESIS AND INTERCONVERSION TRANSAMINATION | Genes involved in Amino acid synthesis and interconversion (transamination) |
| 0.0 | 0.1 | REACTOME INHIBITION OF REPLICATION INITIATION OF DAMAGED DNA BY RB1 E2F1 | Genes involved in Inhibition of replication initiation of damaged DNA by RB1/E2F1 |
| 0.0 | 0.1 | REACTOME G ALPHA Z SIGNALLING EVENTS | Genes involved in G alpha (z) signalling events |
| 0.0 | 0.4 | REACTOME REGULATION OF IFNG SIGNALING | Genes involved in Regulation of IFNG signaling |
| 0.0 | 0.1 | REACTOME ALPHA LINOLENIC ACID ALA METABOLISM | Genes involved in alpha-linolenic acid (ALA) metabolism |
| 0.0 | 0.3 | REACTOME REGULATION OF PYRUVATE DEHYDROGENASE PDH COMPLEX | Genes involved in Regulation of pyruvate dehydrogenase (PDH) complex |
| 0.0 | 0.3 | REACTOME CTNNB1 PHOSPHORYLATION CASCADE | Genes involved in Beta-catenin phosphorylation cascade |
| 0.0 | 0.3 | REACTOME E2F MEDIATED REGULATION OF DNA REPLICATION | Genes involved in E2F mediated regulation of DNA replication |
| 0.0 | 0.9 | REACTOME SPHINGOLIPID DE NOVO BIOSYNTHESIS | Genes involved in Sphingolipid de novo biosynthesis |
| 0.0 | 0.4 | REACTOME FORMATION OF ATP BY CHEMIOSMOTIC COUPLING | Genes involved in Formation of ATP by chemiosmotic coupling |
| 0.0 | 0.1 | REACTOME UNWINDING OF DNA | Genes involved in Unwinding of DNA |
| 0.0 | 0.3 | REACTOME NEF MEDIATED DOWNREGULATION OF MHC CLASS I COMPLEX CELL SURFACE EXPRESSION | Genes involved in Nef mediated downregulation of MHC class I complex cell surface expression |
| 0.0 | 0.4 | REACTOME ENDOSOMAL SORTING COMPLEX REQUIRED FOR TRANSPORT ESCRT | Genes involved in Endosomal Sorting Complex Required For Transport (ESCRT) |
| 0.0 | 0.7 | REACTOME CGMP EFFECTS | Genes involved in cGMP effects |
| 0.0 | 1.0 | REACTOME MYOGENESIS | Genes involved in Myogenesis |
| 0.0 | 0.6 | REACTOME DARPP 32 EVENTS | Genes involved in DARPP-32 events |
| 0.0 | 1.0 | REACTOME BMAL1 CLOCK NPAS2 ACTIVATES CIRCADIAN EXPRESSION | Genes involved in BMAL1:CLOCK/NPAS2 Activates Circadian Expression |
| 0.0 | 1.2 | REACTOME GOLGI ASSOCIATED VESICLE BIOGENESIS | Genes involved in Golgi Associated Vesicle Biogenesis |
| 0.0 | 0.6 | REACTOME PEROXISOMAL LIPID METABOLISM | Genes involved in Peroxisomal lipid metabolism |
| 0.0 | 0.2 | REACTOME ACTIVATION OF CHAPERONE GENES BY ATF6 ALPHA | Genes involved in Activation of Chaperone Genes by ATF6-alpha |
| 0.0 | 1.7 | REACTOME MITOTIC PROMETAPHASE | Genes involved in Mitotic Prometaphase |
| 0.0 | 0.1 | REACTOME ACYL CHAIN REMODELLING OF PG | Genes involved in Acyl chain remodelling of PG |
| 0.0 | 0.2 | REACTOME TGF BETA RECEPTOR SIGNALING IN EMT EPITHELIAL TO MESENCHYMAL TRANSITION | Genes involved in TGF-beta receptor signaling in EMT (epithelial to mesenchymal transition) |
| 0.0 | 0.2 | REACTOME DEPOSITION OF NEW CENPA CONTAINING NUCLEOSOMES AT THE CENTROMERE | Genes involved in Deposition of New CENPA-containing Nucleosomes at the Centromere |
| 0.0 | 0.3 | REACTOME PROLONGED ERK ACTIVATION EVENTS | Genes involved in Prolonged ERK activation events |
| 0.0 | 0.7 | REACTOME STRIATED MUSCLE CONTRACTION | Genes involved in Striated Muscle Contraction |
| 0.0 | 0.2 | REACTOME REGULATION OF KIT SIGNALING | Genes involved in Regulation of KIT signaling |
| 0.0 | 0.3 | REACTOME SYNTHESIS OF PC | Genes involved in Synthesis of PC |
| 0.0 | 0.3 | REACTOME AMINE LIGAND BINDING RECEPTORS | Genes involved in Amine ligand-binding receptors |
| 0.0 | 0.1 | REACTOME ORGANIC CATION ANION ZWITTERION TRANSPORT | Genes involved in Organic cation/anion/zwitterion transport |
| 0.0 | 0.2 | REACTOME PRE NOTCH PROCESSING IN GOLGI | Genes involved in Pre-NOTCH Processing in Golgi |
| 0.0 | 0.3 | REACTOME METABOLISM OF NON CODING RNA | Genes involved in Metabolism of non-coding RNA |