Project
avrg: GSE58827: Dynamics of the Mouse Liver
Navigation
Downloads
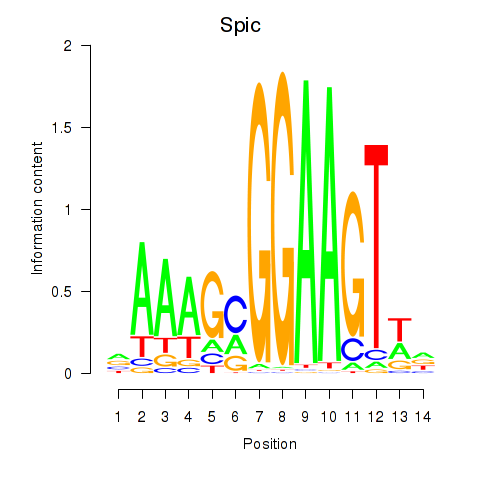
Results for Spic
Z-value: 7.61
Motif logo
Transcription factors associated with Spic
| Gene Symbol | Gene ID | Gene Info |
|---|---|---|
|
Spic
|
ENSMUSG00000004359.17 | Spic |
Activity-expression correlation:
| Gene | Promoter | Pearson corr. coef. | P-value | Plot |
|---|---|---|---|---|
| Spic | mm39_v1_chr10_-_88518878_88518892 | 0.96 | 2.7e-20 | Click! |
Activity profile of Spic motif
Sorted Z-values of Spic motif
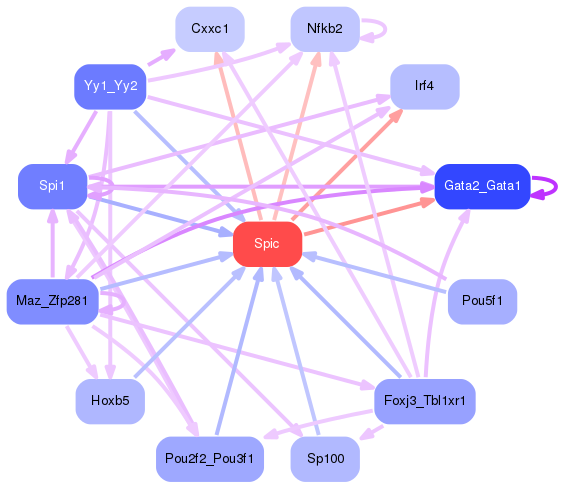
Network of associatons between targets according to the STRING database.

First level regulatory network of Spic
| Promoter | Score | Transcript | Gene | Gene Info |
|---|---|---|---|---|
| chr11_+_87684299 | 52.25 |
ENSMUST00000020779.11
|
Mpo
|
myeloperoxidase |
| chr10_+_79715448 | 50.13 |
ENSMUST00000006679.15
|
Prtn3
|
proteinase 3 |
| chr2_-_165242307 | 44.90 |
ENSMUST00000029213.5
|
Ocstamp
|
osteoclast stimulatory transmembrane protein |
| chr11_+_87684548 | 38.63 |
ENSMUST00000143021.9
|
Mpo
|
myeloperoxidase |
| chr14_+_80237691 | 35.89 |
ENSMUST00000228749.2
ENSMUST00000088735.4 |
Olfm4
|
olfactomedin 4 |
| chr6_-_136918671 | 32.21 |
ENSMUST00000032344.12
|
Arhgdib
|
Rho, GDP dissociation inhibitor (GDI) beta |
| chr6_-_136918844 | 30.36 |
ENSMUST00000204934.2
|
Arhgdib
|
Rho, GDP dissociation inhibitor (GDI) beta |
| chr7_-_126303351 | 27.54 |
ENSMUST00000106364.8
|
Coro1a
|
coronin, actin binding protein 1A |
| chr7_-_126303887 | 26.86 |
ENSMUST00000131415.8
|
Coro1a
|
coronin, actin binding protein 1A |
| chr11_+_98798627 | 25.76 |
ENSMUST00000092706.13
|
Cdc6
|
cell division cycle 6 |
| chr5_+_149201577 | 25.15 |
ENSMUST00000071130.5
|
Alox5ap
|
arachidonate 5-lipoxygenase activating protein |
| chr5_+_149202157 | 23.84 |
ENSMUST00000200806.4
|
Alox5ap
|
arachidonate 5-lipoxygenase activating protein |
| chr6_-_136918885 | 23.84 |
ENSMUST00000111891.4
|
Arhgdib
|
Rho, GDP dissociation inhibitor (GDI) beta |
| chr15_+_78128990 | 23.63 |
ENSMUST00000096357.12
|
Ncf4
|
neutrophil cytosolic factor 4 |
| chr9_+_7558449 | 23.53 |
ENSMUST00000018765.4
|
Mmp8
|
matrix metallopeptidase 8 |
| chr5_-_138169509 | 23.53 |
ENSMUST00000153867.8
|
Mcm7
|
minichromosome maintenance complex component 7 |
| chr5_-_134258435 | 23.31 |
ENSMUST00000016094.13
ENSMUST00000111275.8 ENSMUST00000144086.2 |
Ncf1
|
neutrophil cytosolic factor 1 |
| chr5_-_138169253 | 22.59 |
ENSMUST00000139983.8
|
Mcm7
|
minichromosome maintenance complex component 7 |
| chr8_-_123159639 | 22.13 |
ENSMUST00000212600.2
|
Cyba
|
cytochrome b-245, alpha polypeptide |
| chrX_+_8137372 | 21.93 |
ENSMUST00000127103.8
ENSMUST00000115591.8 |
Slc38a5
|
solute carrier family 38, member 5 |
| chr10_-_117118226 | 21.61 |
ENSMUST00000092163.9
|
Lyz2
|
lysozyme 2 |
| chr7_-_44888220 | 20.85 |
ENSMUST00000210372.2
ENSMUST00000209779.2 ENSMUST00000098461.10 ENSMUST00000211373.2 |
Cd37
|
CD37 antigen |
| chr7_+_28682253 | 20.76 |
ENSMUST00000085835.8
|
Map4k1
|
mitogen-activated protein kinase kinase kinase kinase 1 |
| chrX_+_8137620 | 20.28 |
ENSMUST00000033512.11
|
Slc38a5
|
solute carrier family 38, member 5 |
| chr19_+_6135013 | 19.97 |
ENSMUST00000025704.3
|
Cdca5
|
cell division cycle associated 5 |
| chr7_-_126303689 | 19.56 |
ENSMUST00000135087.8
|
Coro1a
|
coronin, actin binding protein 1A |
| chr2_+_152689881 | 19.44 |
ENSMUST00000164120.8
ENSMUST00000178997.8 ENSMUST00000109816.8 |
Tpx2
|
TPX2, microtubule-associated |
| chr7_-_126641593 | 19.32 |
ENSMUST00000032915.8
|
Kif22
|
kinesin family member 22 |
| chr7_+_142014546 | 18.59 |
ENSMUST00000105968.8
ENSMUST00000018963.11 ENSMUST00000105967.8 |
Lsp1
|
lymphocyte specific 1 |
| chr9_-_114610879 | 18.17 |
ENSMUST00000084867.9
ENSMUST00000216760.2 ENSMUST00000035009.16 |
Cmtm7
|
CKLF-like MARVEL transmembrane domain containing 7 |
| chr15_-_63932176 | 18.14 |
ENSMUST00000226675.2
ENSMUST00000228226.2 ENSMUST00000227024.2 |
Cyrib
|
CYFIP related Rac1 interactor B |
| chr15_+_78129040 | 17.75 |
ENSMUST00000133618.3
|
Ncf4
|
neutrophil cytosolic factor 4 |
| chr1_+_87548026 | 17.19 |
ENSMUST00000169754.8
ENSMUST00000042275.15 ENSMUST00000168783.8 |
Inpp5d
|
inositol polyphosphate-5-phosphatase D |
| chr8_-_123159663 | 17.08 |
ENSMUST00000017604.10
|
Cyba
|
cytochrome b-245, alpha polypeptide |
| chr10_+_75778885 | 17.04 |
ENSMUST00000121151.2
|
Vpreb3
|
pre-B lymphocyte gene 3 |
| chr8_+_85428059 | 16.40 |
ENSMUST00000238364.2
ENSMUST00000238562.2 ENSMUST00000037165.6 |
Lyl1
|
lymphoblastomic leukemia 1 |
| chr1_-_20890437 | 16.35 |
ENSMUST00000053266.11
|
Mcm3
|
minichromosome maintenance complex component 3 |
| chr7_-_19005721 | 16.29 |
ENSMUST00000032561.9
|
Vasp
|
vasodilator-stimulated phosphoprotein |
| chr4_-_133601990 | 16.25 |
ENSMUST00000168974.9
|
Rps6ka1
|
ribosomal protein S6 kinase polypeptide 1 |
| chr17_+_57586094 | 16.18 |
ENSMUST00000169220.9
ENSMUST00000005889.16 ENSMUST00000112870.5 |
Vav1
|
vav 1 oncogene |
| chr10_+_115653152 | 16.12 |
ENSMUST00000080630.11
ENSMUST00000179196.3 ENSMUST00000035563.15 |
Tspan8
|
tetraspanin 8 |
| chr7_+_127661835 | 15.86 |
ENSMUST00000106242.10
ENSMUST00000120355.8 ENSMUST00000106240.9 ENSMUST00000098015.10 |
Itgam
Gm49368
|
integrin alpha M predicted gene, 49368 |
| chr9_-_20556031 | 15.85 |
ENSMUST00000148631.8
ENSMUST00000131128.2 ENSMUST00000151861.9 ENSMUST00000131343.8 ENSMUST00000086458.10 |
Fbxl12
|
F-box and leucine-rich repeat protein 12 |
| chr4_+_130640436 | 15.84 |
ENSMUST00000151698.8
|
Laptm5
|
lysosomal-associated protein transmembrane 5 |
| chr5_-_116162415 | 15.54 |
ENSMUST00000031486.14
ENSMUST00000111999.8 |
Prkab1
|
protein kinase, AMP-activated, beta 1 non-catalytic subunit |
| chr4_+_130640611 | 15.04 |
ENSMUST00000156225.8
ENSMUST00000156742.8 |
Laptm5
|
lysosomal-associated protein transmembrane 5 |
| chr2_+_152689913 | 14.90 |
ENSMUST00000028969.9
|
Tpx2
|
TPX2, microtubule-associated |
| chr7_-_126641565 | 14.77 |
ENSMUST00000205806.2
|
Kif22
|
kinesin family member 22 |
| chr6_-_136918495 | 14.66 |
ENSMUST00000111892.8
|
Arhgdib
|
Rho, GDP dissociation inhibitor (GDI) beta |
| chr8_+_95722289 | 14.60 |
ENSMUST00000211984.2
|
Adgrg1
|
adhesion G protein-coupled receptor G1 |
| chr8_+_118225008 | 14.49 |
ENSMUST00000081232.9
|
Plcg2
|
phospholipase C, gamma 2 |
| chr15_+_103362195 | 14.40 |
ENSMUST00000047405.9
|
Nckap1l
|
NCK associated protein 1 like |
| chr8_+_70826191 | 14.20 |
ENSMUST00000003659.9
|
Comp
|
cartilage oligomeric matrix protein |
| chr7_+_28140352 | 14.10 |
ENSMUST00000078845.13
|
Gmfg
|
glia maturation factor, gamma |
| chr17_-_6923299 | 14.08 |
ENSMUST00000179554.3
|
Dynlt1f
|
dynein light chain Tctex-type 1F |
| chr7_-_44888532 | 14.08 |
ENSMUST00000033063.15
|
Cd37
|
CD37 antigen |
| chr13_-_97274360 | 13.94 |
ENSMUST00000225410.2
|
Nsa2
|
NSA2 ribosome biogenesis homolog |
| chr1_-_144651157 | 13.76 |
ENSMUST00000027603.4
|
Rgs18
|
regulator of G-protein signaling 18 |
| chr2_+_24235300 | 13.74 |
ENSMUST00000114485.9
ENSMUST00000114482.3 |
Il1rn
|
interleukin 1 receptor antagonist |
| chr2_+_22664094 | 13.45 |
ENSMUST00000014290.15
|
Apbb1ip
|
amyloid beta (A4) precursor protein-binding, family B, member 1 interacting protein |
| chr16_-_75706161 | 13.36 |
ENSMUST00000114239.9
|
Samsn1
|
SAM domain, SH3 domain and nuclear localization signals, 1 |
| chr4_-_41314877 | 13.30 |
ENSMUST00000030145.9
|
Dcaf12
|
DDB1 and CUL4 associated factor 12 |
| chr17_-_6367692 | 13.19 |
ENSMUST00000232499.2
ENSMUST00000169415.3 |
Dynlt1a
|
dynein light chain Tctex-type 1A |
| chr1_+_152683627 | 13.09 |
ENSMUST00000027754.7
|
Ncf2
|
neutrophil cytosolic factor 2 |
| chr7_-_44888465 | 13.01 |
ENSMUST00000210078.2
|
Cd37
|
CD37 antigen |
| chr1_+_40123858 | 13.00 |
ENSMUST00000027243.13
|
Il1r2
|
interleukin 1 receptor, type II |
| chr17_+_6869070 | 12.60 |
ENSMUST00000092966.5
|
Dynlt1c
|
dynein light chain Tctex-type 1C |
| chrX_-_165992311 | 12.42 |
ENSMUST00000112172.4
|
Tmsb4x
|
thymosin, beta 4, X chromosome |
| chr5_-_138169476 | 12.40 |
ENSMUST00000147920.2
|
Mcm7
|
minichromosome maintenance complex component 7 |
| chr11_-_16958647 | 12.38 |
ENSMUST00000102881.10
|
Plek
|
pleckstrin |
| chr11_-_79414542 | 12.26 |
ENSMUST00000179322.2
|
Evi2b
|
ecotropic viral integration site 2b |
| chr17_+_47905553 | 12.21 |
ENSMUST00000182846.3
|
Ccnd3
|
cyclin D3 |
| chr15_-_78189917 | 12.14 |
ENSMUST00000096356.5
|
Csf2rb2
|
colony stimulating factor 2 receptor, beta 2, low-affinity (granulocyte-macrophage) |
| chr13_-_110493665 | 12.14 |
ENSMUST00000058806.7
ENSMUST00000224534.2 |
Gapt
|
Grb2-binding adaptor, transmembrane |
| chrX_-_48877080 | 12.13 |
ENSMUST00000114893.8
|
Igsf1
|
immunoglobulin superfamily, member 1 |
| chr9_+_109704609 | 11.68 |
ENSMUST00000094324.8
|
Cdc25a
|
cell division cycle 25A |
| chr6_+_129326927 | 11.46 |
ENSMUST00000065289.6
|
Clec12a
|
C-type lectin domain family 12, member a |
| chr5_+_35156389 | 11.39 |
ENSMUST00000114281.8
ENSMUST00000114280.8 |
Rgs12
|
regulator of G-protein signaling 12 |
| chr13_-_97274430 | 11.39 |
ENSMUST00000073456.9
|
Nsa2
|
NSA2 ribosome biogenesis homolog |
| chr6_+_123206802 | 11.34 |
ENSMUST00000112554.9
ENSMUST00000024118.11 ENSMUST00000117130.8 |
Clec4n
|
C-type lectin domain family 4, member n |
| chr19_+_4204605 | 11.32 |
ENSMUST00000061086.9
|
Ptprcap
|
protein tyrosine phosphatase, receptor type, C polypeptide-associated protein |
| chr14_-_56026266 | 11.29 |
ENSMUST00000168716.8
ENSMUST00000178399.3 ENSMUST00000022830.14 |
Ripk3
|
receptor-interacting serine-threonine kinase 3 |
| chr7_+_28140450 | 11.27 |
ENSMUST00000135686.2
|
Gmfg
|
glia maturation factor, gamma |
| chr7_+_43057611 | 10.97 |
ENSMUST00000005592.7
|
Siglecg
|
sialic acid binding Ig-like lectin G |
| chr4_+_140428777 | 10.68 |
ENSMUST00000138808.8
ENSMUST00000038893.6 |
Rcc2
|
regulator of chromosome condensation 2 |
| chr17_+_8144822 | 10.39 |
ENSMUST00000036370.8
|
Tagap
|
T cell activation Rho GTPase activating protein |
| chr7_+_28533279 | 10.38 |
ENSMUST00000208971.2
ENSMUST00000066723.15 |
Lgals4
|
lectin, galactose binding, soluble 4 |
| chr11_+_32226400 | 10.33 |
ENSMUST00000020531.9
|
Hba-x
|
hemoglobin X, alpha-like embryonic chain in Hba complex |
| chr3_-_67371161 | 10.31 |
ENSMUST00000058981.3
|
Lxn
|
latexin |
| chr11_-_115024807 | 10.11 |
ENSMUST00000106561.8
ENSMUST00000051264.14 ENSMUST00000106562.3 |
Cd300lf
|
CD300 molecule like family member F |
| chr2_+_163916042 | 10.11 |
ENSMUST00000018353.14
|
Stk4
|
serine/threonine kinase 4 |
| chr1_+_152683568 | 10.11 |
ENSMUST00000190323.7
|
Ncf2
|
neutrophil cytosolic factor 2 |
| chr2_+_164647002 | 10.08 |
ENSMUST00000052107.5
|
Zswim3
|
zinc finger SWIM-type containing 3 |
| chr16_+_91203123 | 10.08 |
ENSMUST00000023691.12
|
Il10rb
|
interleukin 10 receptor, beta |
| chr17_-_34174631 | 10.07 |
ENSMUST00000174609.9
ENSMUST00000008812.9 |
Rps18
|
ribosomal protein S18 |
| chr15_-_78189822 | 9.96 |
ENSMUST00000230115.3
|
Csf2rb2
|
colony stimulating factor 2 receptor, beta 2, low-affinity (granulocyte-macrophage) |
| chr1_-_170886924 | 9.94 |
ENSMUST00000164044.8
ENSMUST00000169017.8 |
Fcgr3
|
Fc receptor, IgG, low affinity III |
| chr4_-_86775602 | 9.90 |
ENSMUST00000102814.5
|
Rps6
|
ribosomal protein S6 |
| chrX_+_20570145 | 9.59 |
ENSMUST00000033383.3
|
Usp11
|
ubiquitin specific peptidase 11 |
| chr1_+_153628598 | 9.57 |
ENSMUST00000182538.3
|
Rnasel
|
ribonuclease L (2', 5'-oligoisoadenylate synthetase-dependent) |
| chr12_+_98234884 | 9.50 |
ENSMUST00000075072.6
|
Gpr65
|
G-protein coupled receptor 65 |
| chr1_-_167112784 | 9.43 |
ENSMUST00000053686.9
|
Uck2
|
uridine-cytidine kinase 2 |
| chr11_+_120348919 | 9.37 |
ENSMUST00000058370.14
ENSMUST00000175970.8 ENSMUST00000176120.2 |
Ccdc137
|
coiled-coil domain containing 137 |
| chr7_+_126808016 | 9.34 |
ENSMUST00000206204.2
ENSMUST00000206772.2 |
Mylpf
|
myosin light chain, phosphorylatable, fast skeletal muscle |
| chr7_+_127661807 | 9.25 |
ENSMUST00000064821.14
|
Itgam
|
integrin alpha M |
| chr16_+_36755338 | 9.24 |
ENSMUST00000023531.15
|
Hcls1
|
hematopoietic cell specific Lyn substrate 1 |
| chr7_-_4728081 | 9.22 |
ENSMUST00000086363.5
ENSMUST00000086364.11 |
Tmem150b
|
transmembrane protein 150B |
| chr8_+_94941192 | 9.13 |
ENSMUST00000079961.14
ENSMUST00000212824.2 |
Nup93
|
nucleoporin 93 |
| chr7_-_100613579 | 9.08 |
ENSMUST00000060174.6
|
P2ry6
|
pyrimidinergic receptor P2Y, G-protein coupled, 6 |
| chr1_+_179373935 | 9.06 |
ENSMUST00000040706.9
|
Cnst
|
consortin, connexin sorting protein |
| chr2_+_91480460 | 9.06 |
ENSMUST00000111331.9
|
Arhgap1
|
Rho GTPase activating protein 1 |
| chr3_+_88528410 | 9.02 |
ENSMUST00000029694.14
ENSMUST00000176804.8 |
Arhgef2
|
rho/rac guanine nucleotide exchange factor (GEF) 2 |
| chr14_-_47514248 | 8.95 |
ENSMUST00000187531.8
ENSMUST00000111790.2 |
Wdhd1
|
WD repeat and HMG-box DNA binding protein 1 |
| chr17_+_34823236 | 8.95 |
ENSMUST00000174041.8
|
Agpat1
|
1-acylglycerol-3-phosphate O-acyltransferase 1 (lysophosphatidic acid acyltransferase, alpha) |
| chr2_+_120294046 | 8.89 |
ENSMUST00000028749.15
ENSMUST00000110721.9 ENSMUST00000239364.2 |
Capn3
|
calpain 3 |
| chr1_-_33708876 | 8.80 |
ENSMUST00000027312.11
|
Prim2
|
DNA primase, p58 subunit |
| chr8_+_85428391 | 8.80 |
ENSMUST00000238338.2
|
Lyl1
|
lymphoblastomic leukemia 1 |
| chr7_-_35096133 | 8.79 |
ENSMUST00000154597.2
ENSMUST00000032704.12 |
Faap24
|
Fanconi anemia core complex associated protein 24 |
| chr2_+_166857113 | 8.78 |
ENSMUST00000018143.16
ENSMUST00000176066.8 ENSMUST00000150571.2 |
Ddx27
|
DEAD box helicase 27 |
| chrX_-_7830405 | 8.76 |
ENSMUST00000128449.2
|
Gata1
|
GATA binding protein 1 |
| chr1_-_170755136 | 8.75 |
ENSMUST00000046322.14
ENSMUST00000159171.2 |
Fcrla
|
Fc receptor-like A |
| chr7_-_100505486 | 8.65 |
ENSMUST00000139604.8
|
Relt
|
RELT tumor necrosis factor receptor |
| chr11_-_102771751 | 8.53 |
ENSMUST00000021306.14
|
Eftud2
|
elongation factor Tu GTP binding domain containing 2 |
| chr10_-_128462616 | 8.50 |
ENSMUST00000026420.7
|
Rps26
|
ribosomal protein S26 |
| chr15_-_66684442 | 8.34 |
ENSMUST00000100572.10
|
Sla
|
src-like adaptor |
| chr11_-_102771806 | 8.32 |
ENSMUST00000107060.8
|
Eftud2
|
elongation factor Tu GTP binding domain containing 2 |
| chr14_-_47514308 | 8.28 |
ENSMUST00000111792.9
|
Wdhd1
|
WD repeat and HMG-box DNA binding protein 1 |
| chr3_-_106697459 | 8.25 |
ENSMUST00000038845.10
|
Cd53
|
CD53 antigen |
| chr19_-_40982576 | 8.17 |
ENSMUST00000117695.8
|
Blnk
|
B cell linker |
| chr2_+_118943274 | 8.17 |
ENSMUST00000140939.8
ENSMUST00000028795.10 |
Rad51
|
RAD51 recombinase |
| chr8_+_123829089 | 8.12 |
ENSMUST00000000756.6
|
Rpl13
|
ribosomal protein L13 |
| chr4_-_43562397 | 8.12 |
ENSMUST00000030187.14
|
Tln1
|
talin 1 |
| chr12_-_79027531 | 8.04 |
ENSMUST00000174072.8
|
Tmem229b
|
transmembrane protein 229B |
| chrX_-_56371953 | 8.01 |
ENSMUST00000176986.8
|
Arhgef6
|
Rac/Cdc42 guanine nucleotide exchange factor (GEF) 6 |
| chr2_+_91480513 | 7.97 |
ENSMUST00000090614.11
|
Arhgap1
|
Rho GTPase activating protein 1 |
| chr4_-_136620376 | 7.97 |
ENSMUST00000046332.6
|
C1qc
|
complement component 1, q subcomponent, C chain |
| chr3_+_109030419 | 7.77 |
ENSMUST00000029477.11
|
Slc25a24
|
solute carrier family 25 (mitochondrial carrier, phosphate carrier), member 24 |
| chr3_-_105839980 | 7.75 |
ENSMUST00000098758.5
|
I830077J02Rik
|
RIKEN cDNA I830077J02 gene |
| chr8_-_71349927 | 7.64 |
ENSMUST00000212709.2
ENSMUST00000212796.2 ENSMUST00000212378.2 ENSMUST00000054220.10 ENSMUST00000212494.2 |
Rpl18a
|
ribosomal protein L18A |
| chr7_+_126184108 | 7.64 |
ENSMUST00000039522.8
|
Apobr
|
apolipoprotein B receptor |
| chr1_+_72750418 | 7.60 |
ENSMUST00000059980.11
|
Rpl37a
|
ribosomal protein L37a |
| chr17_+_29579882 | 7.45 |
ENSMUST00000024810.8
|
Fgd2
|
FYVE, RhoGEF and PH domain containing 2 |
| chr8_-_123278054 | 7.38 |
ENSMUST00000156333.9
ENSMUST00000067252.14 |
Piezo1
|
piezo-type mechanosensitive ion channel component 1 |
| chr7_-_121732067 | 7.37 |
ENSMUST00000106469.8
ENSMUST00000063587.13 ENSMUST00000106468.7 ENSMUST00000098068.10 |
Palb2
|
partner and localizer of BRCA2 |
| chr9_+_108385247 | 7.34 |
ENSMUST00000207810.2
ENSMUST00000207862.2 ENSMUST00000208581.2 ENSMUST00000134939.9 ENSMUST00000207713.2 |
Qars
|
glutaminyl-tRNA synthetase |
| chr7_+_99030621 | 7.33 |
ENSMUST00000037528.10
|
Gdpd5
|
glycerophosphodiester phosphodiesterase domain containing 5 |
| chr7_-_43193842 | 7.08 |
ENSMUST00000039861.7
|
Cd33
|
CD33 antigen |
| chr10_-_116899239 | 6.99 |
ENSMUST00000219036.2
ENSMUST00000218059.2 |
Cct2
|
chaperonin containing Tcp1, subunit 2 (beta) |
| chr13_+_30933209 | 6.95 |
ENSMUST00000021784.10
ENSMUST00000110307.3 ENSMUST00000222125.2 |
Irf4
|
interferon regulatory factor 4 |
| chr5_-_137145030 | 6.78 |
ENSMUST00000054384.6
ENSMUST00000152207.2 |
Trim56
|
tripartite motif-containing 56 |
| chr4_-_116484675 | 6.77 |
ENSMUST00000081182.5
ENSMUST00000030457.12 |
Nasp
|
nuclear autoantigenic sperm protein (histone-binding) |
| chr12_+_112727089 | 6.77 |
ENSMUST00000063888.5
|
Pld4
|
phospholipase D family, member 4 |
| chr5_+_35156454 | 6.69 |
ENSMUST00000114283.8
|
Rgs12
|
regulator of G-protein signaling 12 |
| chr11_+_70396070 | 6.66 |
ENSMUST00000019063.3
|
Tm4sf5
|
transmembrane 4 superfamily member 5 |
| chr19_+_53517528 | 6.60 |
ENSMUST00000038287.7
|
Dusp5
|
dual specificity phosphatase 5 |
| chr1_+_171668173 | 6.36 |
ENSMUST00000136479.8
|
Cd84
|
CD84 antigen |
| chr4_-_136613498 | 6.28 |
ENSMUST00000046384.9
|
C1qb
|
complement component 1, q subcomponent, beta polypeptide |
| chr6_-_56681657 | 6.17 |
ENSMUST00000176595.3
ENSMUST00000170382.5 ENSMUST00000203958.2 |
Lsm5
|
LSM5 homolog, U6 small nuclear RNA and mRNA degradation associated |
| chr5_+_143803540 | 6.16 |
ENSMUST00000100487.6
|
Eif2ak1
|
eukaryotic translation initiation factor 2 alpha kinase 1 |
| chr3_-_95799242 | 6.12 |
ENSMUST00000171519.2
ENSMUST00000036360.13 ENSMUST00000090476.10 |
BC028528
|
cDNA sequence BC028528 |
| chr2_+_164782642 | 6.08 |
ENSMUST00000137626.2
|
Mmp9
|
matrix metallopeptidase 9 |
| chr7_+_35096470 | 6.08 |
ENSMUST00000079414.12
|
Cep89
|
centrosomal protein 89 |
| chr4_-_117749191 | 6.04 |
ENSMUST00000030265.4
|
Dph2
|
DPH2 homolog |
| chr14_+_117163215 | 5.98 |
ENSMUST00000078849.12
|
Gpc6
|
glypican 6 |
| chr1_+_191058109 | 5.97 |
ENSMUST00000027940.6
|
Pacc1
|
proton activated chloride channel 1 |
| chr11_-_98291278 | 5.96 |
ENSMUST00000090827.12
|
Pgap3
|
post-GPI attachment to proteins 3 |
| chr5_-_110987441 | 5.95 |
ENSMUST00000145318.2
|
Hscb
|
HscB iron-sulfur cluster co-chaperone |
| chr1_-_149836974 | 5.88 |
ENSMUST00000190507.2
ENSMUST00000070200.15 |
Pla2g4a
|
phospholipase A2, group IVA (cytosolic, calcium-dependent) |
| chr3_+_96069271 | 5.76 |
ENSMUST00000054356.16
|
Mtmr11
|
myotubularin related protein 11 |
| chr7_-_19338349 | 5.71 |
ENSMUST00000086041.7
|
Clasrp
|
CLK4-associating serine/arginine rich protein |
| chr13_-_58276353 | 5.68 |
ENSMUST00000007980.7
|
Hnrnpa0
|
heterogeneous nuclear ribonucleoprotein A0 |
| chr18_-_24736848 | 5.67 |
ENSMUST00000070726.10
|
Slc39a6
|
solute carrier family 39 (metal ion transporter), member 6 |
| chr6_-_124710030 | 5.65 |
ENSMUST00000173647.2
|
Ptpn6
|
protein tyrosine phosphatase, non-receptor type 6 |
| chr14_+_117162914 | 5.64 |
ENSMUST00000125435.2
|
Gpc6
|
glypican 6 |
| chr11_-_97673203 | 5.60 |
ENSMUST00000128801.2
ENSMUST00000103146.5 |
Rpl23
|
ribosomal protein L23 |
| chr19_-_41884599 | 5.54 |
ENSMUST00000038677.5
|
Rrp12
|
ribosomal RNA processing 12 homolog |
| chr8_+_95393349 | 5.51 |
ENSMUST00000109527.6
|
Arl2bp
|
ADP-ribosylation factor-like 2 binding protein |
| chr14_+_30201569 | 5.49 |
ENSMUST00000022535.9
ENSMUST00000223658.2 |
Dcp1a
|
decapping mRNA 1A |
| chr2_+_43638814 | 5.46 |
ENSMUST00000112824.8
ENSMUST00000055776.8 |
Arhgap15
|
Rho GTPase activating protein 15 |
| chr11_+_31823096 | 5.46 |
ENSMUST00000155278.2
|
Cpeb4
|
cytoplasmic polyadenylation element binding protein 4 |
| chr4_-_136626073 | 5.45 |
ENSMUST00000046285.6
|
C1qa
|
complement component 1, q subcomponent, alpha polypeptide |
| chr17_+_35354655 | 5.30 |
ENSMUST00000174478.8
ENSMUST00000174281.9 ENSMUST00000173550.8 |
Bag6
|
BCL2-associated athanogene 6 |
| chr8_+_107783502 | 5.25 |
ENSMUST00000034392.13
ENSMUST00000170962.3 |
Nip7
|
NIP7, nucleolar pre-rRNA processing protein |
| chr19_-_11582207 | 5.21 |
ENSMUST00000025582.11
|
Ms4a6d
|
membrane-spanning 4-domains, subfamily A, member 6D |
| chr17_-_24292453 | 5.19 |
ENSMUST00000017090.6
|
Kctd5
|
potassium channel tetramerisation domain containing 5 |
| chr2_+_179899166 | 5.18 |
ENSMUST00000059080.7
|
Rps21
|
ribosomal protein S21 |
| chr7_-_126807581 | 5.17 |
ENSMUST00000120705.3
|
Tbc1d10b
|
TBC1 domain family, member 10b |
| chr17_+_35354430 | 5.16 |
ENSMUST00000173535.8
ENSMUST00000173952.8 |
Bag6
|
BCL2-associated athanogene 6 |
| chr2_+_129434738 | 5.15 |
ENSMUST00000153491.8
ENSMUST00000161620.8 ENSMUST00000179001.8 |
Sirpa
|
signal-regulatory protein alpha |
| chr10_-_116899664 | 5.11 |
ENSMUST00000218719.2
ENSMUST00000219573.2 ENSMUST00000047672.9 |
Cct2
|
chaperonin containing Tcp1, subunit 2 (beta) |
| chr4_-_116485118 | 5.07 |
ENSMUST00000030456.14
|
Nasp
|
nuclear autoantigenic sperm protein (histone-binding) |
| chr1_-_170755109 | 5.06 |
ENSMUST00000162136.2
ENSMUST00000162887.2 |
Fcrla
|
Fc receptor-like A |
| chr18_+_12261798 | 5.02 |
ENSMUST00000025270.8
|
Riok3
|
RIO kinase 3 |
| chr7_-_44773750 | 4.99 |
ENSMUST00000211725.2
ENSMUST00000003521.10 |
Rps11
|
ribosomal protein S11 |
| chr15_+_102058936 | 4.90 |
ENSMUST00000023806.14
|
Soat2
|
sterol O-acyltransferase 2 |
| chr11_+_101623776 | 4.79 |
ENSMUST00000039152.14
|
Dhx8
|
DEAH (Asp-Glu-Ala-His) box polypeptide 8 |
| chr10_+_122514669 | 4.76 |
ENSMUST00000161487.8
ENSMUST00000067918.12 |
Ppm1h
|
protein phosphatase 1H (PP2C domain containing) |
| chr5_+_66018555 | 4.71 |
ENSMUST00000031106.8
|
Rhoh
|
ras homolog family member H |
| chr8_+_93581946 | 4.69 |
ENSMUST00000046290.3
ENSMUST00000210099.2 |
Lpcat2
|
lysophosphatidylcholine acyltransferase 2 |
| chr13_-_98399533 | 4.69 |
ENSMUST00000040972.4
|
Utp15
|
UTP15 small subunit processome component |
Gene Ontology Analysis
Gene overrepresentation in biological process category:
| Log-likelihood per target | Total log-likelihood | Term | Description |
|---|---|---|---|
| 30.3 | 90.9 | GO:0002148 | hypochlorous acid metabolic process(GO:0002148) hypochlorous acid biosynthetic process(GO:0002149) |
| 13.1 | 39.2 | GO:0014805 | smooth muscle adaptation(GO:0014805) |
| 11.2 | 101.1 | GO:1901164 | negative regulation of trophoblast cell migration(GO:1901164) |
| 11.2 | 44.9 | GO:0090290 | positive regulation of osteoclast proliferation(GO:0090290) |
| 10.0 | 50.1 | GO:0097029 | mature conventional dendritic cell differentiation(GO:0097029) |
| 9.2 | 74.0 | GO:0061502 | uropod organization(GO:0032796) early endosome to recycling endosome transport(GO:0061502) |
| 8.5 | 25.4 | GO:0071846 | actin filament debranching(GO:0071846) |
| 8.2 | 49.0 | GO:0002540 | leukotriene production involved in inflammatory response(GO:0002540) |
| 7.8 | 23.3 | GO:0070947 | neutrophil mediated killing of fungus(GO:0070947) |
| 5.6 | 66.7 | GO:0006268 | DNA unwinding involved in DNA replication(GO:0006268) |
| 5.3 | 26.7 | GO:2000660 | negative regulation of interleukin-1-mediated signaling pathway(GO:2000660) |
| 4.6 | 23.2 | GO:0006742 | NADP catabolic process(GO:0006742) |
| 4.4 | 13.2 | GO:0010924 | regulation of inositol-polyphosphate 5-phosphatase activity(GO:0010924) positive regulation of inositol-polyphosphate 5-phosphatase activity(GO:0010925) phospholipase C-inhibiting G-protein coupled receptor signaling pathway(GO:0030845) regulation of cell diameter(GO:0060305) |
| 4.4 | 47.9 | GO:0030886 | negative regulation of myeloid dendritic cell activation(GO:0030886) |
| 4.3 | 17.2 | GO:0045659 | negative regulation of neutrophil differentiation(GO:0045659) |
| 4.0 | 20.0 | GO:0071922 | establishment of sister chromatid cohesion(GO:0034085) cohesin loading(GO:0071921) regulation of cohesin loading(GO:0071922) |
| 3.6 | 18.1 | GO:0038032 | termination of G-protein coupled receptor signaling pathway(GO:0038032) |
| 3.6 | 14.4 | GO:0043376 | regulation of CD8-positive, alpha-beta T cell differentiation(GO:0043376) actin polymerization-dependent cell motility(GO:0070358) |
| 3.6 | 10.7 | GO:0072356 | chromosome passenger complex localization to kinetochore(GO:0072356) |
| 3.4 | 17.2 | GO:0070829 | heterochromatin maintenance(GO:0070829) |
| 3.4 | 13.8 | GO:0002337 | B-1a B cell differentiation(GO:0002337) |
| 3.3 | 9.9 | GO:0001788 | antibody-dependent cellular cytotoxicity(GO:0001788) |
| 3.1 | 9.4 | GO:0046035 | CMP salvage(GO:0006238) CMP biosynthetic process(GO:0009224) pyrimidine ribonucleotide salvage(GO:0010138) pyrimidine nucleotide salvage(GO:0032262) UMP salvage(GO:0044206) CMP metabolic process(GO:0046035) |
| 3.1 | 25.1 | GO:0014004 | microglia differentiation(GO:0014004) microglia development(GO:0014005) |
| 2.9 | 8.8 | GO:0030221 | basophil differentiation(GO:0030221) |
| 2.8 | 17.0 | GO:1903336 | endosome localization(GO:0032439) negative regulation of vacuolar transport(GO:1903336) |
| 2.8 | 11.3 | GO:2000449 | regulation of CD8-positive, alpha-beta T cell extravasation(GO:2000449) |
| 2.8 | 5.6 | GO:0072717 | cellular response to actinomycin D(GO:0072717) |
| 2.6 | 21.1 | GO:0033277 | abortive mitotic cell cycle(GO:0033277) |
| 2.5 | 10.1 | GO:2000426 | TRIF-dependent toll-like receptor signaling pathway(GO:0035666) interleukin-4-mediated signaling pathway(GO:0035771) response to interleukin-13(GO:0035962) cellular response to interleukin-13(GO:0035963) negative regulation of apoptotic cell clearance(GO:2000426) |
| 2.5 | 10.1 | GO:0060800 | regulation of cell differentiation involved in embryonic placenta development(GO:0060800) |
| 2.3 | 42.2 | GO:0015816 | glycine transport(GO:0015816) |
| 2.3 | 7.0 | GO:0070476 | rRNA (guanine-N7)-methylation(GO:0070476) |
| 2.3 | 7.0 | GO:0042091 | interleukin-10 biosynthetic process(GO:0042091) interleukin-13 biosynthetic process(GO:0042231) regulation of interleukin-10 biosynthetic process(GO:0045074) positive regulation of interleukin-4 biosynthetic process(GO:0045404) |
| 2.3 | 9.1 | GO:0090004 | positive regulation of Golgi to plasma membrane protein transport(GO:0042998) positive regulation of establishment of protein localization to plasma membrane(GO:0090004) |
| 2.3 | 9.0 | GO:1904569 | regulation of selenocysteine incorporation(GO:1904569) |
| 2.2 | 4.5 | GO:0060557 | positive regulation of vitamin metabolic process(GO:0046136) positive regulation of vitamin D biosynthetic process(GO:0060557) positive regulation of calcidiol 1-monooxygenase activity(GO:0060559) |
| 2.2 | 8.9 | GO:1990091 | sodium-dependent self proteolysis(GO:1990091) |
| 2.2 | 8.8 | GO:0006269 | DNA replication, synthesis of RNA primer(GO:0006269) |
| 2.1 | 17.1 | GO:0036506 | maintenance of unfolded protein(GO:0036506) maintenance of unfolded protein involved in ERAD pathway(GO:1904378) |
| 2.1 | 25.2 | GO:0001955 | blood vessel maturation(GO:0001955) |
| 2.0 | 6.1 | GO:0071460 | cellular response to cell-matrix adhesion(GO:0071460) |
| 1.9 | 9.6 | GO:0002322 | B cell proliferation involved in immune response(GO:0002322) |
| 1.9 | 13.4 | GO:0002291 | T cell activation via T cell receptor contact with antigen bound to MHC molecule on antigen presenting cell(GO:0002291) |
| 1.8 | 14.5 | GO:0032237 | activation of store-operated calcium channel activity(GO:0032237) |
| 1.8 | 9.0 | GO:0002309 | T cell proliferation involved in immune response(GO:0002309) |
| 1.8 | 16.2 | GO:2000491 | positive regulation of hepatic stellate cell activation(GO:2000491) |
| 1.7 | 3.4 | GO:0032741 | positive regulation of interleukin-18 production(GO:0032741) |
| 1.7 | 17.0 | GO:0051025 | negative regulation of immunoglobulin secretion(GO:0051025) |
| 1.7 | 5.1 | GO:0032685 | negative regulation of granulocyte macrophage colony-stimulating factor production(GO:0032685) |
| 1.7 | 21.6 | GO:0016998 | cell wall macromolecule catabolic process(GO:0016998) |
| 1.6 | 4.9 | GO:0007439 | ectodermal digestive tract development(GO:0007439) embryonic ectodermal digestive tract development(GO:0048611) |
| 1.6 | 12.7 | GO:0090666 | scaRNA localization to Cajal body(GO:0090666) |
| 1.6 | 10.9 | GO:0033625 | positive regulation of integrin activation(GO:0033625) |
| 1.5 | 9.2 | GO:0015867 | ATP transport(GO:0015867) |
| 1.5 | 3.0 | GO:1903969 | regulation of macrophage colony-stimulating factor signaling pathway(GO:1902226) regulation of response to macrophage colony-stimulating factor(GO:1903969) regulation of cellular response to macrophage colony-stimulating factor stimulus(GO:1903972) |
| 1.3 | 9.1 | GO:0090521 | glomerular visceral epithelial cell migration(GO:0090521) |
| 1.3 | 5.1 | GO:0010847 | regulation of chromatin assembly(GO:0010847) |
| 1.3 | 41.4 | GO:0045730 | respiratory burst(GO:0045730) |
| 1.2 | 6.2 | GO:0046501 | protoporphyrinogen IX metabolic process(GO:0046501) |
| 1.2 | 6.0 | GO:0017182 | peptidyl-diphthamide metabolic process(GO:0017182) peptidyl-diphthamide biosynthetic process from peptidyl-histidine(GO:0017183) |
| 1.2 | 42.1 | GO:0006270 | DNA replication initiation(GO:0006270) |
| 1.2 | 23.1 | GO:0030574 | collagen catabolic process(GO:0030574) |
| 1.1 | 10.3 | GO:0015671 | oxygen transport(GO:0015671) |
| 1.1 | 9.0 | GO:0071802 | negative regulation of podosome assembly(GO:0071802) |
| 1.1 | 34.1 | GO:0007080 | mitotic metaphase plate congression(GO:0007080) |
| 1.1 | 11.8 | GO:0006335 | DNA replication-dependent nucleosome assembly(GO:0006335) DNA replication-dependent nucleosome organization(GO:0034723) |
| 1.0 | 9.1 | GO:0030321 | transepithelial chloride transport(GO:0030321) |
| 1.0 | 3.0 | GO:0090673 | endothelial cell-matrix adhesion(GO:0090673) |
| 1.0 | 8.0 | GO:0045650 | negative regulation of macrophage differentiation(GO:0045650) |
| 1.0 | 7.0 | GO:1905244 | regulation of modification of synaptic structure(GO:1905244) |
| 1.0 | 5.9 | GO:2001280 | positive regulation of prostaglandin biosynthetic process(GO:0031394) positive regulation of unsaturated fatty acid biosynthetic process(GO:2001280) |
| 1.0 | 2.9 | GO:1903904 | negative regulation of establishment of T cell polarity(GO:1903904) |
| 0.9 | 4.7 | GO:0036151 | phosphatidylcholine acyl-chain remodeling(GO:0036151) |
| 0.9 | 33.1 | GO:0000460 | maturation of 5.8S rRNA(GO:0000460) |
| 0.9 | 10.0 | GO:0035878 | nail development(GO:0035878) |
| 0.9 | 2.7 | GO:0046203 | peptidyl-lysine modification to peptidyl-hypusine(GO:0008612) spermidine catabolic process(GO:0046203) |
| 0.9 | 1.8 | GO:0002649 | regulation of tolerance induction to self antigen(GO:0002649) |
| 0.9 | 5.2 | GO:1990481 | mRNA pseudouridine synthesis(GO:1990481) |
| 0.9 | 2.6 | GO:0032066 | nucleolus to nucleoplasm transport(GO:0032066) |
| 0.8 | 4.2 | GO:1903378 | positive regulation of oxidative stress-induced neuron intrinsic apoptotic signaling pathway(GO:1903378) |
| 0.8 | 5.0 | GO:0039534 | negative regulation of MDA-5 signaling pathway(GO:0039534) |
| 0.8 | 4.9 | GO:0034379 | very-low-density lipoprotein particle assembly(GO:0034379) |
| 0.7 | 6.0 | GO:0097428 | protein maturation by iron-sulfur cluster transfer(GO:0097428) |
| 0.7 | 2.8 | GO:0071348 | cellular response to interleukin-11(GO:0071348) |
| 0.7 | 2.8 | GO:0060830 | ciliary receptor clustering involved in smoothened signaling pathway(GO:0060830) |
| 0.7 | 12.4 | GO:0051152 | positive regulation of smooth muscle cell differentiation(GO:0051152) |
| 0.7 | 4.1 | GO:0010897 | negative regulation of triglyceride catabolic process(GO:0010897) |
| 0.7 | 5.5 | GO:2000766 | negative regulation of cytoplasmic translation(GO:2000766) |
| 0.7 | 3.4 | GO:0042631 | cellular response to water deprivation(GO:0042631) |
| 0.7 | 5.4 | GO:0051533 | positive regulation of NFAT protein import into nucleus(GO:0051533) |
| 0.7 | 9.2 | GO:0030854 | positive regulation of granulocyte differentiation(GO:0030854) positive regulation of macrophage differentiation(GO:0045651) |
| 0.6 | 2.5 | GO:1904579 | response to thapsigargin(GO:1904578) cellular response to thapsigargin(GO:1904579) |
| 0.6 | 5.5 | GO:0031087 | deadenylation-independent decapping of nuclear-transcribed mRNA(GO:0031087) |
| 0.6 | 14.6 | GO:0021796 | cerebral cortex regionalization(GO:0021796) |
| 0.6 | 8.1 | GO:0007016 | cytoskeletal anchoring at plasma membrane(GO:0007016) |
| 0.6 | 3.3 | GO:2000676 | positive regulation of type B pancreatic cell apoptotic process(GO:2000676) |
| 0.5 | 36.6 | GO:1900026 | positive regulation of substrate adhesion-dependent cell spreading(GO:1900026) |
| 0.5 | 23.1 | GO:0060236 | regulation of mitotic spindle organization(GO:0060236) |
| 0.5 | 12.2 | GO:0030213 | hyaluronan biosynthetic process(GO:0030213) |
| 0.5 | 8.9 | GO:0006654 | phosphatidic acid biosynthetic process(GO:0006654) |
| 0.5 | 4.7 | GO:0090070 | positive regulation of ribosome biogenesis(GO:0090070) positive regulation of rRNA processing(GO:2000234) |
| 0.5 | 1.6 | GO:0006393 | termination of mitochondrial transcription(GO:0006393) |
| 0.5 | 1.5 | GO:0001180 | transcription initiation from RNA polymerase I promoter for nuclear large rRNA transcript(GO:0001180) |
| 0.5 | 9.6 | GO:0071578 | zinc II ion transmembrane import(GO:0071578) |
| 0.5 | 2.0 | GO:0061187 | regulation of chromatin silencing at rDNA(GO:0061187) negative regulation of chromatin silencing at rDNA(GO:0061188) |
| 0.5 | 15.0 | GO:0050832 | defense response to fungus(GO:0050832) |
| 0.5 | 1.9 | GO:0002266 | follicular dendritic cell activation(GO:0002266) follicular dendritic cell differentiation(GO:0002268) |
| 0.5 | 8.9 | GO:0006910 | phagocytosis, recognition(GO:0006910) |
| 0.4 | 6.6 | GO:0035970 | peptidyl-threonine dephosphorylation(GO:0035970) |
| 0.4 | 2.2 | GO:0097309 | cap1 mRNA methylation(GO:0097309) |
| 0.4 | 3.5 | GO:0035542 | regulation of SNARE complex assembly(GO:0035542) |
| 0.4 | 11.2 | GO:0003417 | growth plate cartilage development(GO:0003417) |
| 0.4 | 2.1 | GO:0006420 | arginyl-tRNA aminoacylation(GO:0006420) |
| 0.4 | 8.9 | GO:0051457 | maintenance of protein location in nucleus(GO:0051457) |
| 0.4 | 9.6 | GO:2001275 | positive regulation of glucose import in response to insulin stimulus(GO:2001275) |
| 0.4 | 10.3 | GO:0050965 | detection of temperature stimulus involved in sensory perception(GO:0050961) detection of temperature stimulus involved in sensory perception of pain(GO:0050965) |
| 0.4 | 11.7 | GO:1902751 | positive regulation of cell cycle G2/M phase transition(GO:1902751) |
| 0.4 | 4.2 | GO:0034244 | negative regulation of transcription elongation from RNA polymerase II promoter(GO:0034244) |
| 0.4 | 4.5 | GO:0051415 | interphase microtubule nucleation by interphase microtubule organizing center(GO:0051415) microtubule nucleation by microtubule organizing center(GO:0051418) |
| 0.4 | 9.5 | GO:0010447 | response to acidic pH(GO:0010447) |
| 0.4 | 2.6 | GO:0046784 | viral mRNA export from host cell nucleus(GO:0046784) |
| 0.4 | 2.9 | GO:1900262 | regulation of DNA-directed DNA polymerase activity(GO:1900262) positive regulation of DNA-directed DNA polymerase activity(GO:1900264) |
| 0.4 | 2.5 | GO:0051013 | microtubule severing(GO:0051013) |
| 0.4 | 2.8 | GO:0071763 | nuclear membrane organization(GO:0071763) |
| 0.3 | 1.0 | GO:1900222 | negative regulation of beta-amyloid clearance(GO:1900222) |
| 0.3 | 8.3 | GO:1901741 | positive regulation of myoblast fusion(GO:1901741) |
| 0.3 | 1.0 | GO:0010387 | COP9 signalosome assembly(GO:0010387) |
| 0.3 | 6.4 | GO:0001833 | inner cell mass cell proliferation(GO:0001833) |
| 0.3 | 4.8 | GO:0010886 | positive regulation of cholesterol storage(GO:0010886) |
| 0.3 | 7.3 | GO:0021895 | cerebral cortex neuron differentiation(GO:0021895) |
| 0.3 | 5.7 | GO:0070935 | 3'-UTR-mediated mRNA stabilization(GO:0070935) |
| 0.3 | 13.7 | GO:0033119 | negative regulation of RNA splicing(GO:0033119) |
| 0.3 | 6.8 | GO:1902187 | negative regulation of viral release from host cell(GO:1902187) |
| 0.3 | 1.5 | GO:0055005 | ventricular cardiac myofibril assembly(GO:0055005) |
| 0.3 | 4.3 | GO:0060837 | blood vessel endothelial cell differentiation(GO:0060837) |
| 0.3 | 16.1 | GO:0030195 | negative regulation of blood coagulation(GO:0030195) negative regulation of hemostasis(GO:1900047) |
| 0.3 | 1.9 | GO:0035405 | histone-threonine phosphorylation(GO:0035405) |
| 0.3 | 13.5 | GO:0010501 | RNA secondary structure unwinding(GO:0010501) |
| 0.3 | 3.1 | GO:0000492 | box C/D snoRNP assembly(GO:0000492) |
| 0.2 | 2.7 | GO:0001682 | tRNA 5'-leader removal(GO:0001682) |
| 0.2 | 3.2 | GO:0051014 | actin filament severing(GO:0051014) |
| 0.2 | 10.7 | GO:0045954 | positive regulation of natural killer cell mediated cytotoxicity(GO:0045954) |
| 0.2 | 0.9 | GO:0034499 | late endosome to Golgi transport(GO:0034499) |
| 0.2 | 2.4 | GO:2000601 | positive regulation of Arp2/3 complex-mediated actin nucleation(GO:2000601) |
| 0.2 | 2.1 | GO:1900246 | positive regulation of RIG-I signaling pathway(GO:1900246) |
| 0.2 | 0.9 | GO:1902410 | mitotic cytokinetic process(GO:1902410) |
| 0.2 | 9.7 | GO:0006506 | GPI anchor biosynthetic process(GO:0006506) |
| 0.2 | 2.0 | GO:0000963 | mitochondrial RNA processing(GO:0000963) |
| 0.2 | 1.1 | GO:1902261 | positive regulation of delayed rectifier potassium channel activity(GO:1902261) |
| 0.2 | 0.7 | GO:0018211 | protein C-linked glycosylation(GO:0018103) peptidyl-tryptophan modification(GO:0018211) protein C-linked glycosylation via tryptophan(GO:0018317) protein C-linked glycosylation via 2'-alpha-mannosyl-L-tryptophan(GO:0018406) |
| 0.2 | 2.5 | GO:0035330 | regulation of hippo signaling(GO:0035330) |
| 0.2 | 2.4 | GO:1901096 | regulation of autophagosome maturation(GO:1901096) |
| 0.2 | 2.8 | GO:0090161 | Golgi ribbon formation(GO:0090161) |
| 0.2 | 2.8 | GO:0030388 | fructose 1,6-bisphosphate metabolic process(GO:0030388) |
| 0.2 | 0.7 | GO:1902683 | regulation of receptor localization to synapse(GO:1902683) |
| 0.2 | 31.8 | GO:1990823 | response to leukemia inhibitory factor(GO:1990823) cellular response to leukemia inhibitory factor(GO:1990830) |
| 0.2 | 2.5 | GO:0034498 | early endosome to Golgi transport(GO:0034498) |
| 0.2 | 3.6 | GO:0006744 | ubiquinone biosynthetic process(GO:0006744) |
| 0.1 | 0.6 | GO:0071477 | hypotonic salinity response(GO:0042539) cellular hypotonic salinity response(GO:0071477) |
| 0.1 | 16.3 | GO:0051289 | protein homotetramerization(GO:0051289) |
| 0.1 | 1.4 | GO:0035493 | SNARE complex assembly(GO:0035493) |
| 0.1 | 4.5 | GO:0034314 | Arp2/3 complex-mediated actin nucleation(GO:0034314) |
| 0.1 | 2.2 | GO:0001522 | pseudouridine synthesis(GO:0001522) |
| 0.1 | 4.2 | GO:0034508 | centromere complex assembly(GO:0034508) |
| 0.1 | 0.7 | GO:0000738 | DNA catabolic process, exonucleolytic(GO:0000738) |
| 0.1 | 2.2 | GO:1902083 | negative regulation of peptidyl-cysteine S-nitrosylation(GO:1902083) |
| 0.1 | 0.4 | GO:0060988 | lipid tube assembly(GO:0060988) |
| 0.1 | 0.9 | GO:0002553 | histamine production involved in inflammatory response(GO:0002349) histamine secretion involved in inflammatory response(GO:0002441) histamine secretion by mast cell(GO:0002553) |
| 0.1 | 14.6 | GO:0006958 | complement activation, classical pathway(GO:0006958) |
| 0.1 | 0.6 | GO:0000469 | cleavage involved in rRNA processing(GO:0000469) |
| 0.1 | 5.2 | GO:0031338 | regulation of vesicle fusion(GO:0031338) |
| 0.1 | 5.3 | GO:0042255 | ribosome assembly(GO:0042255) |
| 0.1 | 0.8 | GO:0002361 | CD4-positive, CD25-positive, alpha-beta regulatory T cell differentiation(GO:0002361) |
| 0.1 | 8.3 | GO:0038083 | peptidyl-tyrosine autophosphorylation(GO:0038083) |
| 0.1 | 2.7 | GO:0045724 | positive regulation of cilium assembly(GO:0045724) |
| 0.1 | 0.7 | GO:0002903 | negative regulation of B cell apoptotic process(GO:0002903) |
| 0.1 | 0.4 | GO:0045359 | positive regulation of interferon-beta biosynthetic process(GO:0045359) |
| 0.1 | 1.4 | GO:0043982 | histone H4-K5 acetylation(GO:0043981) histone H4-K8 acetylation(GO:0043982) |
| 0.1 | 0.8 | GO:0048742 | regulation of skeletal muscle fiber development(GO:0048742) |
| 0.1 | 1.6 | GO:0051443 | positive regulation of ubiquitin-protein transferase activity(GO:0051443) |
| 0.0 | 0.2 | GO:0006362 | transcription elongation from RNA polymerase I promoter(GO:0006362) |
| 0.0 | 18.2 | GO:0018105 | peptidyl-serine phosphorylation(GO:0018105) |
| 0.0 | 2.5 | GO:0051568 | histone H3-K4 methylation(GO:0051568) |
| 0.0 | 3.4 | GO:0032272 | negative regulation of protein polymerization(GO:0032272) |
| 0.0 | 4.5 | GO:0000956 | nuclear-transcribed mRNA catabolic process(GO:0000956) |
| 0.0 | 0.9 | GO:0043968 | histone H2A acetylation(GO:0043968) |
| 0.0 | 1.1 | GO:0030033 | microvillus assembly(GO:0030033) |
| 0.0 | 4.7 | GO:0035305 | negative regulation of dephosphorylation(GO:0035305) negative regulation of protein dephosphorylation(GO:0035308) |
| 0.0 | 1.6 | GO:0010107 | potassium ion import(GO:0010107) |
| 0.0 | 6.5 | GO:0035023 | regulation of Rho protein signal transduction(GO:0035023) |
| 0.0 | 0.3 | GO:0071231 | neural crest cell migration involved in heart formation(GO:0003147) anterior neural tube closure(GO:0061713) cellular response to folic acid(GO:0071231) |
| 0.0 | 0.4 | GO:0043649 | dicarboxylic acid catabolic process(GO:0043649) |
| 0.0 | 1.3 | GO:0030199 | collagen fibril organization(GO:0030199) |
| 0.0 | 0.5 | GO:0015937 | coenzyme A biosynthetic process(GO:0015937) |
| 0.0 | 5.6 | GO:0051607 | defense response to virus(GO:0051607) |
| 0.0 | 0.7 | GO:0090083 | regulation of inclusion body assembly(GO:0090083) |
| 0.0 | 9.5 | GO:0006397 | mRNA processing(GO:0006397) |
| 0.0 | 1.6 | GO:0006367 | transcription initiation from RNA polymerase II promoter(GO:0006367) |
| 0.0 | 0.6 | GO:0031146 | SCF-dependent proteasomal ubiquitin-dependent protein catabolic process(GO:0031146) |
| 0.0 | 2.5 | GO:0050821 | protein stabilization(GO:0050821) |
| 0.0 | 1.1 | GO:0045761 | regulation of adenylate cyclase activity(GO:0045761) |
| 0.0 | 0.4 | GO:0045026 | plasma membrane fusion(GO:0045026) |
| 0.0 | 0.1 | GO:0007406 | negative regulation of neuroblast proliferation(GO:0007406) |
| 0.0 | 0.4 | GO:0043001 | Golgi to plasma membrane protein transport(GO:0043001) |
Gene overrepresentation in cellular component category:
| Log-likelihood per target | Total log-likelihood | Term | Description |
|---|---|---|---|
| 8.5 | 127.1 | GO:0043020 | NADPH oxidase complex(GO:0043020) |
| 5.3 | 90.9 | GO:0005766 | primary lysosome(GO:0005766) azurophil granule(GO:0042582) |
| 4.7 | 74.9 | GO:0042555 | MCM complex(GO:0042555) |
| 3.2 | 22.6 | GO:0048237 | rough endoplasmic reticulum lumen(GO:0048237) |
| 3.0 | 74.0 | GO:0032426 | stereocilium tip(GO:0032426) |
| 2.6 | 34.3 | GO:0005818 | aster(GO:0005818) |
| 2.4 | 17.0 | GO:0097443 | sorting endosome(GO:0097443) |
| 2.1 | 37.3 | GO:0042581 | specific granule(GO:0042581) |
| 1.9 | 17.1 | GO:0072379 | BAT3 complex(GO:0071818) ER membrane insertion complex(GO:0072379) |
| 1.8 | 21.1 | GO:0042105 | alpha-beta T cell receptor complex(GO:0042105) |
| 1.7 | 20.0 | GO:0008278 | cohesin complex(GO:0008278) |
| 1.6 | 17.9 | GO:0097451 | glial limiting end-foot(GO:0097451) |
| 1.3 | 10.3 | GO:0005833 | hemoglobin complex(GO:0005833) |
| 1.3 | 8.8 | GO:0005658 | alpha DNA polymerase:primase complex(GO:0005658) |
| 1.2 | 13.4 | GO:0042101 | T cell receptor complex(GO:0042101) |
| 1.1 | 11.3 | GO:0097342 | ripoptosome(GO:0097342) |
| 1.1 | 4.5 | GO:0008275 | gamma-tubulin small complex(GO:0008275) |
| 1.1 | 5.3 | GO:0005944 | phosphatidylinositol 3-kinase complex, class IB(GO:0005944) |
| 1.0 | 15.3 | GO:0031209 | SCAR complex(GO:0031209) |
| 1.0 | 31.4 | GO:0046540 | U4/U6 x U5 tri-snRNP complex(GO:0046540) |
| 1.0 | 56.4 | GO:0001772 | immunological synapse(GO:0001772) |
| 1.0 | 4.9 | GO:0000938 | GARP complex(GO:0000938) EARP complex(GO:1990745) |
| 0.9 | 3.7 | GO:0032021 | NELF complex(GO:0032021) |
| 0.9 | 29.4 | GO:0030687 | preribosome, large subunit precursor(GO:0030687) |
| 0.9 | 29.1 | GO:0005868 | cytoplasmic dynein complex(GO:0005868) |
| 0.9 | 7.0 | GO:0098837 | postsynaptic recycling endosome(GO:0098837) |
| 0.8 | 2.5 | GO:0070985 | TFIIK complex(GO:0070985) |
| 0.8 | 35.1 | GO:0051233 | spindle midzone(GO:0051233) |
| 0.7 | 2.9 | GO:0060171 | stereocilium membrane(GO:0060171) |
| 0.7 | 18.8 | GO:0031588 | nucleotide-activated protein kinase complex(GO:0031588) |
| 0.6 | 38.6 | GO:0022627 | cytosolic small ribosomal subunit(GO:0022627) |
| 0.6 | 2.5 | GO:0097543 | ciliary inversin compartment(GO:0097543) |
| 0.6 | 12.7 | GO:0002199 | zona pellucida receptor complex(GO:0002199) |
| 0.6 | 9.5 | GO:0017101 | aminoacyl-tRNA synthetase multienzyme complex(GO:0017101) |
| 0.6 | 24.5 | GO:0008305 | integrin complex(GO:0008305) |
| 0.6 | 7.0 | GO:0000788 | nuclear nucleosome(GO:0000788) |
| 0.6 | 3.4 | GO:0036019 | endolysosome(GO:0036019) |
| 0.6 | 9.6 | GO:0031258 | lamellipodium membrane(GO:0031258) |
| 0.5 | 12.2 | GO:0034362 | low-density lipoprotein particle(GO:0034362) |
| 0.5 | 2.9 | GO:0005663 | DNA replication factor C complex(GO:0005663) |
| 0.5 | 8.8 | GO:0043240 | Fanconi anaemia nuclear complex(GO:0043240) |
| 0.5 | 5.0 | GO:0030688 | preribosome, small subunit precursor(GO:0030688) |
| 0.5 | 2.7 | GO:0000172 | ribonuclease MRP complex(GO:0000172) |
| 0.4 | 3.0 | GO:0030485 | smooth muscle contractile fiber(GO:0030485) |
| 0.4 | 15.8 | GO:0080008 | Cul4-RING E3 ubiquitin ligase complex(GO:0080008) |
| 0.4 | 5.8 | GO:0005862 | muscle thin filament tropomyosin(GO:0005862) |
| 0.4 | 1.9 | GO:0033257 | Bcl3/NF-kappaB2 complex(GO:0033257) |
| 0.4 | 29.0 | GO:0022625 | cytosolic large ribosomal subunit(GO:0022625) |
| 0.4 | 2.2 | GO:0005850 | eukaryotic translation initiation factor 2 complex(GO:0005850) |
| 0.4 | 4.2 | GO:0097136 | Bcl-2 family protein complex(GO:0097136) |
| 0.4 | 2.8 | GO:0033263 | CORVET complex(GO:0033263) |
| 0.3 | 24.2 | GO:0005871 | kinesin complex(GO:0005871) |
| 0.3 | 6.1 | GO:0097539 | ciliary transition fiber(GO:0097539) |
| 0.3 | 15.7 | GO:0097440 | apical dendrite(GO:0097440) |
| 0.3 | 1.9 | GO:0030670 | phagocytic vesicle membrane(GO:0030670) |
| 0.3 | 12.2 | GO:0002102 | podosome(GO:0002102) |
| 0.3 | 2.6 | GO:0000347 | THO complex(GO:0000347) THO complex part of transcription export complex(GO:0000445) |
| 0.3 | 4.8 | GO:0005885 | Arp2/3 protein complex(GO:0005885) |
| 0.2 | 9.3 | GO:0032588 | trans-Golgi network membrane(GO:0032588) |
| 0.2 | 5.5 | GO:1990124 | messenger ribonucleoprotein complex(GO:1990124) |
| 0.2 | 9.0 | GO:0035145 | exon-exon junction complex(GO:0035145) |
| 0.2 | 7.3 | GO:0097038 | perinuclear endoplasmic reticulum(GO:0097038) |
| 0.2 | 1.9 | GO:0072357 | PTW/PP1 phosphatase complex(GO:0072357) |
| 0.2 | 2.2 | GO:0034709 | methylosome(GO:0034709) |
| 0.2 | 1.6 | GO:0008282 | ATP-sensitive potassium channel complex(GO:0008282) |
| 0.2 | 12.2 | GO:0000307 | cyclin-dependent protein kinase holoenzyme complex(GO:0000307) |
| 0.2 | 99.2 | GO:0031012 | extracellular matrix(GO:0031012) |
| 0.2 | 19.1 | GO:0005581 | collagen trimer(GO:0005581) |
| 0.2 | 8.2 | GO:0035861 | site of double-strand break(GO:0035861) |
| 0.2 | 2.3 | GO:0005916 | fascia adherens(GO:0005916) |
| 0.2 | 3.4 | GO:0046930 | pore complex(GO:0046930) |
| 0.2 | 3.4 | GO:0031011 | Ino80 complex(GO:0031011) |
| 0.1 | 49.4 | GO:0031965 | nuclear membrane(GO:0031965) |
| 0.1 | 2.1 | GO:0005686 | U2 snRNP(GO:0005686) |
| 0.1 | 18.3 | GO:0030863 | cortical cytoskeleton(GO:0030863) |
| 0.1 | 2.5 | GO:0048188 | Set1C/COMPASS complex(GO:0048188) |
| 0.1 | 16.2 | GO:0030175 | filopodium(GO:0030175) |
| 0.1 | 23.4 | GO:0001726 | ruffle(GO:0001726) |
| 0.1 | 9.3 | GO:0016459 | myosin complex(GO:0016459) |
| 0.1 | 23.8 | GO:0000775 | chromosome, centromeric region(GO:0000775) |
| 0.1 | 1.5 | GO:0005736 | DNA-directed RNA polymerase I complex(GO:0005736) |
| 0.1 | 0.9 | GO:0071014 | post-mRNA release spliceosomal complex(GO:0071014) |
| 0.1 | 13.3 | GO:0017053 | transcriptional repressor complex(GO:0017053) |
| 0.1 | 10.0 | GO:0030315 | T-tubule(GO:0030315) |
| 0.1 | 3.6 | GO:0005669 | transcription factor TFIID complex(GO:0005669) |
| 0.1 | 2.5 | GO:0031307 | integral component of mitochondrial outer membrane(GO:0031307) |
| 0.1 | 8.0 | GO:0005758 | mitochondrial intermembrane space(GO:0005758) |
| 0.1 | 7.7 | GO:0016363 | nuclear matrix(GO:0016363) |
| 0.1 | 0.6 | GO:0033588 | Elongator holoenzyme complex(GO:0033588) |
| 0.1 | 6.5 | GO:0031463 | Cul3-RING ubiquitin ligase complex(GO:0031463) |
| 0.1 | 2.5 | GO:0030904 | retromer complex(GO:0030904) |
| 0.1 | 3.6 | GO:0030173 | integral component of Golgi membrane(GO:0030173) |
| 0.1 | 1.9 | GO:0097610 | cleavage furrow(GO:0032154) cell surface furrow(GO:0097610) |
| 0.1 | 13.7 | GO:0005765 | lysosomal membrane(GO:0005765) lytic vacuole membrane(GO:0098852) |
| 0.1 | 0.3 | GO:0016602 | CCAAT-binding factor complex(GO:0016602) |
| 0.1 | 10.6 | GO:0001650 | fibrillar center(GO:0001650) |
| 0.1 | 1.5 | GO:0042588 | zymogen granule(GO:0042588) |
| 0.1 | 0.9 | GO:0071339 | MLL1/2 complex(GO:0044665) MLL1 complex(GO:0071339) |
| 0.1 | 4.7 | GO:0005795 | Golgi stack(GO:0005795) |
| 0.1 | 5.9 | GO:0000932 | cytoplasmic mRNA processing body(GO:0000932) |
| 0.1 | 13.5 | GO:0000151 | ubiquitin ligase complex(GO:0000151) |
| 0.0 | 0.9 | GO:1902562 | NuA4 histone acetyltransferase complex(GO:0035267) H4/H2A histone acetyltransferase complex(GO:0043189) H4 histone acetyltransferase complex(GO:1902562) |
| 0.0 | 14.9 | GO:0009897 | external side of plasma membrane(GO:0009897) |
| 0.0 | 2.7 | GO:0071013 | catalytic step 2 spliceosome(GO:0071013) |
| 0.0 | 2.2 | GO:0005905 | clathrin-coated pit(GO:0005905) |
| 0.0 | 10.4 | GO:0009986 | cell surface(GO:0009986) |
| 0.0 | 43.8 | GO:0005615 | extracellular space(GO:0005615) |
| 0.0 | 1.2 | GO:0030667 | secretory granule membrane(GO:0030667) |
| 0.0 | 14.9 | GO:0005911 | cell-cell junction(GO:0005911) |
| 0.0 | 9.0 | GO:0016323 | basolateral plasma membrane(GO:0016323) |
| 0.0 | 5.2 | GO:0031234 | extrinsic component of cytoplasmic side of plasma membrane(GO:0031234) |
| 0.0 | 0.6 | GO:0030686 | 90S preribosome(GO:0030686) |
| 0.0 | 37.1 | GO:0005887 | integral component of plasma membrane(GO:0005887) |
| 0.0 | 1.4 | GO:0000123 | histone acetyltransferase complex(GO:0000123) |
| 0.0 | 3.3 | GO:0000794 | condensed nuclear chromosome(GO:0000794) |
| 0.0 | 3.1 | GO:0005819 | spindle(GO:0005819) |
| 0.0 | 0.7 | GO:0016235 | aggresome(GO:0016235) |
| 0.0 | 1.1 | GO:0030139 | endocytic vesicle(GO:0030139) |
| 0.0 | 1.3 | GO:0055037 | recycling endosome(GO:0055037) |
Gene overrepresentation in molecular function category:
| Log-likelihood per target | Total log-likelihood | Term | Description |
|---|---|---|---|
| 11.2 | 101.1 | GO:0005094 | Rho GDP-dissociation inhibitor activity(GO:0005094) |
| 9.8 | 49.0 | GO:0004051 | arachidonate 5-lipoxygenase activity(GO:0004051) |
| 6.8 | 87.9 | GO:0016176 | superoxide-generating NADPH oxidase activator activity(GO:0016176) |
| 4.6 | 13.7 | GO:0005152 | interleukin-1 receptor antagonist activity(GO:0005152) |
| 3.9 | 39.2 | GO:0016175 | superoxide-generating NADPH oxidase activity(GO:0016175) |
| 3.8 | 34.3 | GO:0061676 | importin-alpha family protein binding(GO:0061676) |
| 3.6 | 25.1 | GO:0001851 | complement component C3b binding(GO:0001851) |
| 3.5 | 74.0 | GO:0032036 | myosin heavy chain binding(GO:0032036) |
| 3.0 | 42.2 | GO:0015187 | glycine transmembrane transporter activity(GO:0015187) |
| 2.9 | 8.8 | GO:0003896 | DNA primase activity(GO:0003896) |
| 2.5 | 10.1 | GO:0005136 | interleukin-4 receptor binding(GO:0005136) |
| 2.4 | 7.3 | GO:0004819 | glutamine-tRNA ligase activity(GO:0004819) |
| 2.3 | 9.1 | GO:0071553 | uridine nucleotide receptor activity(GO:0015065) G-protein coupled pyrimidinergic nucleotide receptor activity(GO:0071553) |
| 2.1 | 17.2 | GO:0016312 | inositol bisphosphate phosphatase activity(GO:0016312) PTB domain binding(GO:0051425) |
| 1.9 | 13.2 | GO:0070180 | large ribosomal subunit rRNA binding(GO:0070180) |
| 1.8 | 7.3 | GO:0047389 | glycerophosphocholine phosphodiesterase activity(GO:0047389) |
| 1.8 | 25.4 | GO:0071933 | Arp2/3 complex binding(GO:0071933) |
| 1.8 | 14.2 | GO:0005499 | vitamin D binding(GO:0005499) |
| 1.7 | 21.6 | GO:0003796 | lysozyme activity(GO:0003796) |
| 1.6 | 21.1 | GO:0019198 | transmembrane receptor protein tyrosine phosphatase activity(GO:0005001) transmembrane receptor protein phosphatase activity(GO:0019198) |
| 1.6 | 11.3 | GO:0004704 | NF-kappaB-inducing kinase activity(GO:0004704) |
| 1.6 | 4.7 | GO:0047192 | 1-alkylglycerophosphocholine O-acetyltransferase activity(GO:0047192) |
| 1.5 | 1.5 | GO:0001179 | RNA polymerase I transcription factor binding(GO:0001179) |
| 1.5 | 6.2 | GO:0004694 | eukaryotic translation initiation factor 2alpha kinase activity(GO:0004694) |
| 1.4 | 13.0 | GO:0019966 | interleukin-1 binding(GO:0019966) |
| 1.4 | 10.1 | GO:0004920 | interleukin-10 receptor activity(GO:0004920) |
| 1.3 | 12.1 | GO:0034711 | inhibin binding(GO:0034711) |
| 1.3 | 9.4 | GO:0004849 | uridine kinase activity(GO:0004849) |
| 1.3 | 57.1 | GO:0004003 | ATP-dependent DNA helicase activity(GO:0004003) |
| 1.3 | 20.8 | GO:0008349 | MAP kinase kinase kinase kinase activity(GO:0008349) |
| 1.2 | 3.6 | GO:0046964 | 3'-phosphoadenosine 5'-phosphosulfate transmembrane transporter activity(GO:0046964) |
| 1.2 | 3.6 | GO:0001129 | RNA polymerase II transcription factor activity, TBP-class protein binding, involved in preinitiation complex assembly(GO:0001129) RNA polymerase II transcription factor activity, TBP-class protein binding(GO:0001132) |
| 1.1 | 10.3 | GO:0005344 | oxygen transporter activity(GO:0005344) |
| 1.1 | 76.9 | GO:0004601 | peroxidase activity(GO:0004601) |
| 1.0 | 3.1 | GO:0030622 | U4atac snRNA binding(GO:0030622) |
| 1.0 | 16.3 | GO:0005522 | profilin binding(GO:0005522) |
| 1.0 | 3.0 | GO:0005157 | macrophage colony-stimulating factor receptor binding(GO:0005157) |
| 1.0 | 5.9 | GO:0045322 | unmethylated CpG binding(GO:0045322) |
| 0.9 | 7.4 | GO:0030229 | very-low-density lipoprotein particle receptor activity(GO:0030229) |
| 0.9 | 11.0 | GO:0043142 | single-stranded DNA-dependent ATPase activity(GO:0043142) |
| 0.9 | 1.8 | GO:0030621 | U4 snRNA binding(GO:0030621) |
| 0.9 | 10.5 | GO:0071253 | connexin binding(GO:0071253) |
| 0.9 | 3.5 | GO:0035673 | oligopeptide transmembrane transporter activity(GO:0035673) |
| 0.9 | 17.1 | GO:0015643 | toxic substance binding(GO:0015643) |
| 0.9 | 18.8 | GO:0004679 | AMP-activated protein kinase activity(GO:0004679) |
| 0.8 | 9.0 | GO:0035368 | selenocysteine insertion sequence binding(GO:0035368) |
| 0.7 | 5.0 | GO:0089720 | caspase binding(GO:0089720) |
| 0.7 | 7.8 | GO:0000295 | adenine nucleotide transmembrane transporter activity(GO:0000295) purine ribonucleotide transmembrane transporter activity(GO:0005346) purine nucleotide transmembrane transporter activity(GO:0015216) |
| 0.7 | 25.2 | GO:0030676 | Rac guanyl-nucleotide exchange factor activity(GO:0030676) |
| 0.7 | 7.4 | GO:0008381 | mechanically-gated ion channel activity(GO:0008381) mechanically gated channel activity(GO:0022833) |
| 0.7 | 2.6 | GO:0004566 | beta-glucuronidase activity(GO:0004566) |
| 0.7 | 5.9 | GO:0047498 | calcium-dependent phospholipase A2 activity(GO:0047498) |
| 0.6 | 8.1 | GO:0030274 | LIM domain binding(GO:0030274) |
| 0.6 | 8.9 | GO:0031432 | titin binding(GO:0031432) |
| 0.6 | 1.8 | GO:0005026 | transforming growth factor beta receptor activity, type II(GO:0005026) |
| 0.6 | 1.2 | GO:0046935 | 1-phosphatidylinositol-3-kinase regulator activity(GO:0046935) |
| 0.6 | 8.2 | GO:0005068 | transmembrane receptor protein tyrosine kinase adaptor activity(GO:0005068) |
| 0.5 | 1.6 | GO:0008281 | sulfonylurea receptor activity(GO:0008281) |
| 0.5 | 2.1 | GO:0005459 | UDP-galactose transmembrane transporter activity(GO:0005459) |
| 0.5 | 2.6 | GO:0016435 | rRNA (guanine) methyltransferase activity(GO:0016435) |
| 0.5 | 18.5 | GO:0043394 | proteoglycan binding(GO:0043394) |
| 0.5 | 8.8 | GO:0008301 | DNA binding, bending(GO:0008301) |
| 0.5 | 10.3 | GO:0008191 | metalloendopeptidase inhibitor activity(GO:0008191) |
| 0.5 | 1.9 | GO:0035402 | histone kinase activity (H3-T11 specific)(GO:0035402) |
| 0.4 | 2.1 | GO:0004814 | arginine-tRNA ligase activity(GO:0004814) |
| 0.4 | 4.2 | GO:0051434 | BH3 domain binding(GO:0051434) |
| 0.4 | 6.6 | GO:0017017 | MAP kinase tyrosine/serine/threonine phosphatase activity(GO:0017017) |
| 0.4 | 2.5 | GO:0008568 | microtubule-severing ATPase activity(GO:0008568) |
| 0.4 | 7.4 | GO:0009982 | pseudouridine synthase activity(GO:0009982) |
| 0.4 | 40.5 | GO:0045309 | protein phosphorylated amino acid binding(GO:0045309) |
| 0.4 | 8.9 | GO:0003841 | 1-acylglycerol-3-phosphate O-acyltransferase activity(GO:0003841) |
| 0.4 | 10.3 | GO:0097602 | cullin family protein binding(GO:0097602) |
| 0.4 | 2.2 | GO:0004483 | mRNA (nucleoside-2'-O-)-methyltransferase activity(GO:0004483) |
| 0.4 | 16.2 | GO:0043027 | cysteine-type endopeptidase inhibitor activity involved in apoptotic process(GO:0043027) |
| 0.3 | 4.1 | GO:0052813 | phosphatidylinositol-4,5-bisphosphate 3-kinase activity(GO:0046934) phosphatidylinositol bisphosphate kinase activity(GO:0052813) |
| 0.3 | 3.4 | GO:0015288 | porin activity(GO:0015288) |
| 0.3 | 72.7 | GO:0004252 | serine-type endopeptidase activity(GO:0004252) |
| 0.3 | 13.2 | GO:0043325 | phosphatidylinositol-3,4-bisphosphate binding(GO:0043325) |
| 0.3 | 2.7 | GO:0016936 | galactoside binding(GO:0016936) |
| 0.3 | 12.4 | GO:0003785 | actin monomer binding(GO:0003785) |
| 0.3 | 2.8 | GO:0004332 | fructose-bisphosphate aldolase activity(GO:0004332) |
| 0.3 | 17.1 | GO:0070063 | RNA polymerase binding(GO:0070063) |
| 0.3 | 2.7 | GO:0004526 | ribonuclease P activity(GO:0004526) |
| 0.3 | 19.9 | GO:0019843 | rRNA binding(GO:0019843) |
| 0.3 | 18.0 | GO:0004004 | RNA helicase activity(GO:0003724) ATP-dependent RNA helicase activity(GO:0004004) ATP-dependent helicase activity(GO:0008026) RNA-dependent ATPase activity(GO:0008186) purine NTP-dependent helicase activity(GO:0070035) |
| 0.3 | 8.7 | GO:0005035 | tumor necrosis factor-activated receptor activity(GO:0005031) death receptor activity(GO:0005035) |
| 0.3 | 14.8 | GO:0004693 | cyclin-dependent protein serine/threonine kinase activity(GO:0004693) |
| 0.2 | 15.7 | GO:0001965 | G-protein alpha-subunit binding(GO:0001965) |
| 0.2 | 15.1 | GO:0008307 | structural constituent of muscle(GO:0008307) |
| 0.2 | 4.8 | GO:0030169 | low-density lipoprotein particle binding(GO:0030169) |
| 0.2 | 0.7 | GO:0001160 | transcription termination site sequence-specific DNA binding(GO:0001147) transcription termination site DNA binding(GO:0001160) |
| 0.2 | 14.2 | GO:0048365 | Rac GTPase binding(GO:0048365) |
| 0.2 | 4.5 | GO:0051011 | microtubule minus-end binding(GO:0051011) |
| 0.2 | 10.4 | GO:0051879 | Hsp90 protein binding(GO:0051879) |
| 0.2 | 14.6 | GO:0050840 | extracellular matrix binding(GO:0050840) |
| 0.2 | 33.9 | GO:0003735 | structural constituent of ribosome(GO:0003735) |
| 0.2 | 8.3 | GO:0005070 | SH3/SH2 adaptor activity(GO:0005070) |
| 0.2 | 16.3 | GO:0004386 | helicase activity(GO:0004386) |
| 0.2 | 68.7 | GO:0005096 | GTPase activator activity(GO:0005096) |
| 0.2 | 2.5 | GO:0000900 | translation repressor activity, nucleic acid binding(GO:0000900) |
| 0.2 | 2.9 | GO:0071889 | 14-3-3 protein binding(GO:0071889) |
| 0.2 | 1.0 | GO:0070326 | very-low-density lipoprotein particle receptor binding(GO:0070326) |
| 0.2 | 2.5 | GO:0051400 | BH domain binding(GO:0051400) |
| 0.2 | 0.5 | GO:0004140 | dephospho-CoA kinase activity(GO:0004140) |
| 0.1 | 2.1 | GO:0017151 | DEAD/H-box RNA helicase binding(GO:0017151) |
| 0.1 | 0.6 | GO:0035827 | rubidium ion transmembrane transporter activity(GO:0035827) |
| 0.1 | 18.4 | GO:0004896 | cytokine receptor activity(GO:0004896) |
| 0.1 | 5.7 | GO:0017091 | AU-rich element binding(GO:0017091) |
| 0.1 | 0.8 | GO:0001226 | RNA polymerase II transcription corepressor binding(GO:0001226) |
| 0.1 | 5.2 | GO:0030742 | GTP-dependent protein binding(GO:0030742) |
| 0.1 | 4.9 | GO:0000062 | fatty-acyl-CoA binding(GO:0000062) |
| 0.1 | 1.4 | GO:0043996 | histone acetyltransferase activity (H4-K5 specific)(GO:0043995) histone acetyltransferase activity (H4-K8 specific)(GO:0043996) histone acetyltransferase activity (H4-K16 specific)(GO:0046972) |
| 0.1 | 14.0 | GO:0008276 | protein methyltransferase activity(GO:0008276) |
| 0.1 | 13.7 | GO:0051087 | chaperone binding(GO:0051087) |
| 0.1 | 13.0 | GO:0003777 | microtubule motor activity(GO:0003777) |
| 0.1 | 2.8 | GO:0004550 | nucleoside diphosphate kinase activity(GO:0004550) |
| 0.1 | 2.2 | GO:0008327 | methyl-CpG binding(GO:0008327) |
| 0.1 | 15.6 | GO:0005178 | integrin binding(GO:0005178) |
| 0.1 | 10.1 | GO:0005089 | Rho guanyl-nucleotide exchange factor activity(GO:0005089) |
| 0.1 | 21.8 | GO:0005125 | cytokine activity(GO:0005125) |
| 0.1 | 2.9 | GO:0032183 | SUMO binding(GO:0032183) |
| 0.1 | 0.9 | GO:0017166 | vinculin binding(GO:0017166) |
| 0.1 | 2.0 | GO:0032454 | histone demethylase activity (H3-K9 specific)(GO:0032454) |
| 0.1 | 10.0 | GO:0019905 | syntaxin binding(GO:0019905) |
| 0.1 | 5.5 | GO:0019894 | kinesin binding(GO:0019894) |
| 0.1 | 2.9 | GO:0044183 | protein binding involved in protein folding(GO:0044183) |
| 0.1 | 8.2 | GO:0001085 | RNA polymerase II transcription factor binding(GO:0001085) |
| 0.1 | 1.9 | GO:0070840 | dynein complex binding(GO:0070840) |
| 0.1 | 0.4 | GO:0004535 | poly(A)-specific ribonuclease activity(GO:0004535) |
| 0.1 | 0.3 | GO:0070012 | oligopeptidase activity(GO:0070012) |
| 0.1 | 1.3 | GO:0016864 | protein disulfide isomerase activity(GO:0003756) intramolecular oxidoreductase activity, transposing S-S bonds(GO:0016864) |
| 0.1 | 0.5 | GO:0098519 | nucleotide phosphatase activity, acting on free nucleotides(GO:0098519) |
| 0.1 | 6.4 | GO:0004843 | thiol-dependent ubiquitin-specific protease activity(GO:0004843) |
| 0.1 | 2.5 | GO:0005385 | zinc ion transmembrane transporter activity(GO:0005385) |
| 0.1 | 4.8 | GO:0005200 | structural constituent of cytoskeleton(GO:0005200) |
| 0.1 | 4.6 | GO:0004722 | protein serine/threonine phosphatase activity(GO:0004722) |
| 0.1 | 1.9 | GO:0005044 | scavenger receptor activity(GO:0005044) |
| 0.1 | 1.1 | GO:0008179 | adenylate cyclase binding(GO:0008179) |
| 0.1 | 1.1 | GO:0016208 | AMP binding(GO:0016208) |
| 0.1 | 41.4 | GO:0003682 | chromatin binding(GO:0003682) |
| 0.0 | 19.6 | GO:0045296 | cadherin binding(GO:0045296) |
| 0.0 | 1.4 | GO:0005544 | calcium-dependent phospholipid binding(GO:0005544) |
| 0.0 | 3.4 | GO:0016765 | transferase activity, transferring alkyl or aryl (other than methyl) groups(GO:0016765) |
| 0.0 | 0.2 | GO:0009019 | tRNA (guanine-N1-)-methyltransferase activity(GO:0009019) |
| 0.0 | 0.2 | GO:0030306 | ADP-ribosylation factor binding(GO:0030306) |
| 0.0 | 3.2 | GO:0042393 | histone binding(GO:0042393) |
| 0.0 | 1.1 | GO:0071949 | FAD binding(GO:0071949) |
| 0.0 | 5.2 | GO:0019903 | protein phosphatase binding(GO:0019903) |
| 0.0 | 0.7 | GO:0000030 | mannosyltransferase activity(GO:0000030) |
| 0.0 | 0.3 | GO:0051870 | methotrexate binding(GO:0051870) |
| 0.0 | 0.4 | GO:0016290 | palmitoyl-CoA hydrolase activity(GO:0016290) |
| 0.0 | 10.5 | GO:0003779 | actin binding(GO:0003779) |
| 0.0 | 2.1 | GO:0030674 | protein binding, bridging(GO:0030674) |
| 0.0 | 35.5 | GO:0003723 | RNA binding(GO:0003723) |
| 0.0 | 2.8 | GO:0034987 | immunoglobulin receptor binding(GO:0034987) |
| 0.0 | 11.8 | GO:0000977 | RNA polymerase II regulatory region sequence-specific DNA binding(GO:0000977) RNA polymerase II regulatory region DNA binding(GO:0001012) |
| 0.0 | 0.1 | GO:0015279 | store-operated calcium channel activity(GO:0015279) |
Gene overrepresentation in curated gene sets: canonical pathways category:
| Log-likelihood per target | Total log-likelihood | Term | Description |
|---|---|---|---|
| 2.0 | 110.7 | PID ATR PATHWAY | ATR signaling pathway |
| 1.4 | 23.9 | PID TCR JNK PATHWAY | JNK signaling in the CD4+ TCR pathway |
| 1.4 | 85.6 | PID IL23 PATHWAY | IL23-mediated signaling events |
| 1.1 | 122.1 | PID RHOA REG PATHWAY | Regulation of RhoA activity |
| 1.1 | 90.3 | PID RAC1 PATHWAY | RAC1 signaling pathway |
| 1.1 | 52.8 | PID EPO PATHWAY | EPO signaling pathway |
| 1.0 | 24.4 | SA B CELL RECEPTOR COMPLEXES | Antigen binding to B cell receptors activates protein tyrosine kinases, such as the Src family, which ultimate activate MAP kinases. |
| 0.7 | 34.6 | PID AURORA A PATHWAY | Aurora A signaling |
| 0.7 | 25.1 | PID INTEGRIN2 PATHWAY | Beta2 integrin cell surface interactions |
| 0.6 | 18.6 | PID P38 MK2 PATHWAY | p38 signaling mediated by MAPKAP kinases |
| 0.5 | 25.0 | PID RAC1 REG PATHWAY | Regulation of RAC1 activity |
| 0.5 | 9.9 | PID IL2 PI3K PATHWAY | IL2 signaling events mediated by PI3K |
| 0.4 | 58.3 | PID CMYB PATHWAY | C-MYB transcription factor network |
| 0.4 | 2.5 | SA G2 AND M PHASES | Cdc25 activates the cdc2/cyclin B complex to induce the G2/M transition. |
| 0.4 | 6.1 | PID AVB3 OPN PATHWAY | Osteopontin-mediated events |
| 0.4 | 21.8 | PID LKB1 PATHWAY | LKB1 signaling events |
| 0.4 | 8.1 | PID NECTIN PATHWAY | Nectin adhesion pathway |
| 0.4 | 16.3 | SIG REGULATION OF THE ACTIN CYTOSKELETON BY RHO GTPASES | Genes related to regulation of the actin cytoskeleton |
| 0.4 | 12.2 | PID IL2 STAT5 PATHWAY | IL2 signaling events mediated by STAT5 |
| 0.3 | 9.7 | PID IL1 PATHWAY | IL1-mediated signaling events |
| 0.3 | 7.4 | PID FANCONI PATHWAY | Fanconi anemia pathway |
| 0.3 | 4.3 | PID P38 ALPHA BETA PATHWAY | Regulation of p38-alpha and p38-beta |
| 0.2 | 16.2 | PID E2F PATHWAY | E2F transcription factor network |
| 0.2 | 4.1 | PID ARF 3PATHWAY | Arf1 pathway |
| 0.2 | 22.9 | PID PDGFRB PATHWAY | PDGFR-beta signaling pathway |
| 0.2 | 45.6 | NABA ECM AFFILIATED | Genes encoding proteins affiliated structurally or functionally to extracellular matrix proteins |
| 0.2 | 7.0 | PID IL4 2PATHWAY | IL4-mediated signaling events |
| 0.2 | 1.9 | PID P38 GAMMA DELTA PATHWAY | Signaling mediated by p38-gamma and p38-delta |
| 0.2 | 5.5 | PID ATF2 PATHWAY | ATF-2 transcription factor network |
| 0.1 | 4.1 | PID INTEGRIN3 PATHWAY | Beta3 integrin cell surface interactions |
| 0.1 | 2.6 | PID INTEGRIN A9B1 PATHWAY | Alpha9 beta1 integrin signaling events |
| 0.1 | 3.5 | PID TCR PATHWAY | TCR signaling in naïve CD4+ T cells |
| 0.1 | 15.8 | NABA ECM GLYCOPROTEINS | Genes encoding structural ECM glycoproteins |
| 0.1 | 2.4 | PID IL12 2PATHWAY | IL12-mediated signaling events |
| 0.1 | 1.4 | PID FRA PATHWAY | Validated transcriptional targets of AP1 family members Fra1 and Fra2 |
| 0.1 | 14.5 | NABA ECM REGULATORS | Genes encoding enzymes and their regulators involved in the remodeling of the extracellular matrix |
| 0.0 | 1.7 | PID LIS1 PATHWAY | Lissencephaly gene (LIS1) in neuronal migration and development |
| 0.0 | 0.7 | PID BCR 5PATHWAY | BCR signaling pathway |
| 0.0 | 3.6 | PID SMAD2 3NUCLEAR PATHWAY | Regulation of nuclear SMAD2/3 signaling |
| 0.0 | 1.0 | PID P38 ALPHA BETA DOWNSTREAM PATHWAY | Signaling mediated by p38-alpha and p38-beta |
| 0.0 | 0.7 | PID ALPHA SYNUCLEIN PATHWAY | Alpha-synuclein signaling |
| 0.0 | 1.1 | SIG INSULIN RECEPTOR PATHWAY IN CARDIAC MYOCYTES | Genes related to the insulin receptor pathway |
| 0.0 | 2.3 | PID MYC ACTIV PATHWAY | Validated targets of C-MYC transcriptional activation |
| 0.0 | 0.7 | PID ILK PATHWAY | Integrin-linked kinase signaling |
Gene overrepresentation in curated gene sets: REACTOME pathways category:
| Log-likelihood per target | Total log-likelihood | Term | Description |
|---|---|---|---|
| 4.7 | 74.9 | REACTOME UNWINDING OF DNA | Genes involved in Unwinding of DNA |
| 3.9 | 11.7 | REACTOME E2F ENABLED INHIBITION OF PRE REPLICATION COMPLEX FORMATION | Genes involved in E2F-enabled inhibition of pre-replication complex formation |
| 2.5 | 19.7 | REACTOME CREATION OF C4 AND C2 ACTIVATORS | Genes involved in Creation of C4 and C2 activators |
| 2.0 | 98.2 | REACTOME LATENT INFECTION OF HOMO SAPIENS WITH MYCOBACTERIUM TUBERCULOSIS | Genes involved in Latent infection of Homo sapiens with Mycobacterium tuberculosis |
| 1.7 | 25.8 | REACTOME CDC6 ASSOCIATION WITH THE ORC ORIGIN COMPLEX | Genes involved in CDC6 association with the ORC:origin complex |
| 1.5 | 21.6 | REACTOME GRB2 SOS PROVIDES LINKAGE TO MAPK SIGNALING FOR INTERGRINS | Genes involved in GRB2:SOS provides linkage to MAPK signaling for Intergrins |
| 1.3 | 18.8 | REACTOME REGULATION OF RHEB GTPASE ACTIVITY BY AMPK | Genes involved in Regulation of Rheb GTPase activity by AMPK |
| 1.1 | 16.2 | REACTOME CD28 DEPENDENT VAV1 PATHWAY | Genes involved in CD28 dependent Vav1 pathway |
| 1.0 | 3.1 | REACTOME ENDOSOMAL VACUOLAR PATHWAY | Genes involved in Endosomal/Vacuolar pathway |
| 1.0 | 33.6 | REACTOME SIGNAL REGULATORY PROTEIN SIRP FAMILY INTERACTIONS | Genes involved in Signal regulatory protein (SIRP) family interactions |
| 0.8 | 25.0 | REACTOME CELL EXTRACELLULAR MATRIX INTERACTIONS | Genes involved in Cell-extracellular matrix interactions |
| 0.7 | 23.2 | REACTOME DEGRADATION OF THE EXTRACELLULAR MATRIX | Genes involved in Degradation of the extracellular matrix |
| 0.7 | 24.0 | REACTOME KINESINS | Genes involved in Kinesins |
| 0.7 | 155.1 | REACTOME SIGNALING BY RHO GTPASES | Genes involved in Signaling by Rho GTPases |
| 0.7 | 8.8 | REACTOME INHIBITION OF REPLICATION INITIATION OF DAMAGED DNA BY RB1 E2F1 | Genes involved in Inhibition of replication initiation of damaged DNA by RB1/E2F1 |
| 0.6 | 42.0 | REACTOME FORMATION OF THE TERNARY COMPLEX AND SUBSEQUENTLY THE 43S COMPLEX | Genes involved in Formation of the ternary complex, and subsequently, the 43S complex |
| 0.6 | 40.7 | REACTOME AMINO ACID TRANSPORT ACROSS THE PLASMA MEMBRANE | Genes involved in Amino acid transport across the plasma membrane |
| 0.5 | 13.1 | REACTOME HS GAG DEGRADATION | Genes involved in HS-GAG degradation |
| 0.5 | 11.7 | REACTOME MRNA DECAY BY 5 TO 3 EXORIBONUCLEASE | Genes involved in mRNA Decay by 5' to 3' Exoribonuclease |
| 0.5 | 6.3 | REACTOME TRAFFICKING AND PROCESSING OF ENDOSOMAL TLR | Genes involved in Trafficking and processing of endosomal TLR |
| 0.5 | 8.2 | REACTOME REGULATION OF SIGNALING BY CBL | Genes involved in Regulation of signaling by CBL |
| 0.5 | 13.2 | REACTOME RIP MEDIATED NFKB ACTIVATION VIA DAI | Genes involved in RIP-mediated NFkB activation via DAI |
| 0.5 | 23.5 | REACTOME ASSOCIATION OF TRIC CCT WITH TARGET PROTEINS DURING BIOSYNTHESIS | Genes involved in Association of TriC/CCT with target proteins during biosynthesis |
| 0.4 | 19.8 | REACTOME GPVI MEDIATED ACTIVATION CASCADE | Genes involved in GPVI-mediated activation cascade |
| 0.4 | 8.2 | REACTOME HOMOLOGOUS RECOMBINATION REPAIR OF REPLICATION INDEPENDENT DOUBLE STRAND BREAKS | Genes involved in Homologous recombination repair of replication-independent double-strand breaks |
| 0.4 | 11.4 | REACTOME ACYL CHAIN REMODELLING OF PC | Genes involved in Acyl chain remodelling of PC |
| 0.4 | 20.3 | REACTOME MRNA SPLICING MINOR PATHWAY | Genes involved in mRNA Splicing - Minor Pathway |
| 0.4 | 13.8 | REACTOME SIGNALING BY HIPPO | Genes involved in Signaling by Hippo |
| 0.4 | 17.7 | REACTOME ERK MAPK TARGETS | Genes involved in ERK/MAPK targets |
| 0.4 | 29.0 | REACTOME PEPTIDE CHAIN ELONGATION | Genes involved in Peptide chain elongation |
| 0.4 | 2.6 | REACTOME SIGNALING BY EGFR IN CANCER | Genes involved in Signaling by EGFR in Cancer |
| 0.4 | 3.0 | REACTOME PECAM1 INTERACTIONS | Genes involved in PECAM1 interactions |
| 0.4 | 7.4 | REACTOME FANCONI ANEMIA PATHWAY | Genes involved in Fanconi Anemia pathway |
| 0.4 | 9.6 | REACTOME ZINC TRANSPORTERS | Genes involved in Zinc transporters |
| 0.3 | 25.1 | REACTOME CELL SURFACE INTERACTIONS AT THE VASCULAR WALL | Genes involved in Cell surface interactions at the vascular wall |
| 0.3 | 7.3 | REACTOME MITOCHONDRIAL TRNA AMINOACYLATION | Genes involved in Mitochondrial tRNA aminoacylation |
| 0.3 | 9.0 | REACTOME NONSENSE MEDIATED DECAY ENHANCED BY THE EXON JUNCTION COMPLEX | Genes involved in Nonsense Mediated Decay Enhanced by the Exon Junction Complex |
| 0.3 | 14.8 | REACTOME G1 PHASE | Genes involved in G1 Phase |
| 0.3 | 4.5 | REACTOME RECRUITMENT OF NUMA TO MITOTIC CENTROSOMES | Genes involved in Recruitment of NuMA to mitotic centrosomes |
| 0.3 | 12.8 | REACTOME IL1 SIGNALING | Genes involved in Interleukin-1 signaling |
| 0.3 | 9.4 | REACTOME PYRIMIDINE METABOLISM | Genes involved in Pyrimidine metabolism |
| 0.2 | 26.7 | REACTOME RESPONSE TO ELEVATED PLATELET CYTOSOLIC CA2 | Genes involved in Response to elevated platelet cytosolic Ca2+ |
| 0.2 | 4.3 | REACTOME PROTEOLYTIC CLEAVAGE OF SNARE COMPLEX PROTEINS | Genes involved in Proteolytic cleavage of SNARE complex proteins |
| 0.2 | 4.2 | REACTOME P2Y RECEPTORS | Genes involved in P2Y receptors |
| 0.2 | 4.6 | REACTOME DEPOSITION OF NEW CENPA CONTAINING NUCLEOSOMES AT THE CENTROMERE | Genes involved in Deposition of New CENPA-containing Nucleosomes at the Centromere |
| 0.2 | 2.9 | REACTOME ACTIVATION OF ATR IN RESPONSE TO REPLICATION STRESS | Genes involved in Activation of ATR in response to replication stress |
| 0.2 | 6.0 | REACTOME TRANSPORT OF RIBONUCLEOPROTEINS INTO THE HOST NUCLEUS | Genes involved in Transport of Ribonucleoproteins into the Host Nucleus |
| 0.1 | 5.8 | REACTOME SMOOTH MUSCLE CONTRACTION | Genes involved in Smooth Muscle Contraction |
| 0.1 | 1.8 | REACTOME TGF BETA RECEPTOR SIGNALING IN EMT EPITHELIAL TO MESENCHYMAL TRANSITION | Genes involved in TGF-beta receptor signaling in EMT (epithelial to mesenchymal transition) |
| 0.1 | 12.4 | REACTOME MRNA SPLICING | Genes involved in mRNA Splicing |
| 0.1 | 2.7 | REACTOME PTM GAMMA CARBOXYLATION HYPUSINE FORMATION AND ARYLSULFATASE ACTIVATION | Genes involved in PTM: gamma carboxylation, hypusine formation and arylsulfatase activation |
| 0.1 | 0.9 | REACTOME NUCLEOTIDE LIKE PURINERGIC RECEPTORS | Genes involved in Nucleotide-like (purinergic) receptors |
| 0.1 | 6.0 | REACTOME MITOCHONDRIAL PROTEIN IMPORT | Genes involved in Mitochondrial Protein Import |
| 0.1 | 9.3 | REACTOME MITOTIC PROMETAPHASE | Genes involved in Mitotic Prometaphase |
| 0.1 | 3.4 | REACTOME RAP1 SIGNALLING | Genes involved in Rap1 signalling |
| 0.1 | 2.1 | REACTOME TRNA AMINOACYLATION | Genes involved in tRNA Aminoacylation |
| 0.1 | 17.9 | REACTOME G ALPHA I SIGNALLING EVENTS | Genes involved in G alpha (i) signalling events |
| 0.1 | 1.4 | REACTOME GAP JUNCTION DEGRADATION | Genes involved in Gap junction degradation |
| 0.1 | 2.8 | REACTOME GLYCOLYSIS | Genes involved in Glycolysis |
| 0.0 | 3.4 | REACTOME INTERFERON ALPHA BETA SIGNALING | Genes involved in Interferon alpha/beta signaling |
| 0.0 | 1.6 | REACTOME INWARDLY RECTIFYING K CHANNELS | Genes involved in Inwardly rectifying K+ channels |
| 0.0 | 2.1 | REACTOME TRANSPORT OF VITAMINS NUCLEOSIDES AND RELATED MOLECULES | Genes involved in Transport of vitamins, nucleosides, and related molecules |
| 0.0 | 0.4 | REACTOME ACTIVATION OF IRF3 IRF7 MEDIATED BY TBK1 IKK EPSILON | Genes involved in Activation of IRF3/IRF7 mediated by TBK1/IKK epsilon |
| 0.0 | 0.7 | REACTOME SEMA4D IN SEMAPHORIN SIGNALING | Genes involved in Sema4D in semaphorin signaling |
| 0.0 | 2.6 | REACTOME CLASS A1 RHODOPSIN LIKE RECEPTORS | Genes involved in Class A/1 (Rhodopsin-like receptors) |
| 0.0 | 0.4 | REACTOME SYNTHESIS OF BILE ACIDS AND BILE SALTS VIA 7ALPHA HYDROXYCHOLESTEROL | Genes involved in Synthesis of bile acids and bile salts via 7alpha-hydroxycholesterol |
| 0.0 | 1.2 | REACTOME TRIGLYCERIDE BIOSYNTHESIS | Genes involved in Triglyceride Biosynthesis |
| 0.0 | 1.4 | REACTOME FACTORS INVOLVED IN MEGAKARYOCYTE DEVELOPMENT AND PLATELET PRODUCTION | Genes involved in Factors involved in megakaryocyte development and platelet production |
| 0.0 | 0.8 | REACTOME NOTCH1 INTRACELLULAR DOMAIN REGULATES TRANSCRIPTION | Genes involved in NOTCH1 Intracellular Domain Regulates Transcription |
| 0.0 | 0.2 | REACTOME FORMATION OF TRANSCRIPTION COUPLED NER TC NER REPAIR COMPLEX | Genes involved in Formation of transcription-coupled NER (TC-NER) repair complex |