Project
avrg: GSE58827: Dynamics of the Mouse Liver
Navigation
Downloads
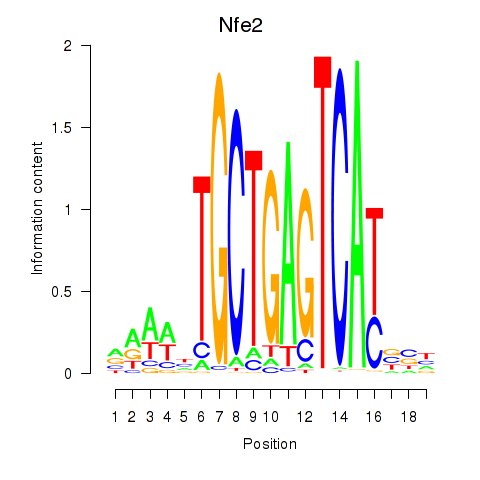
Results for Nfe2_Bach1_Mafk
Z-value: 2.02
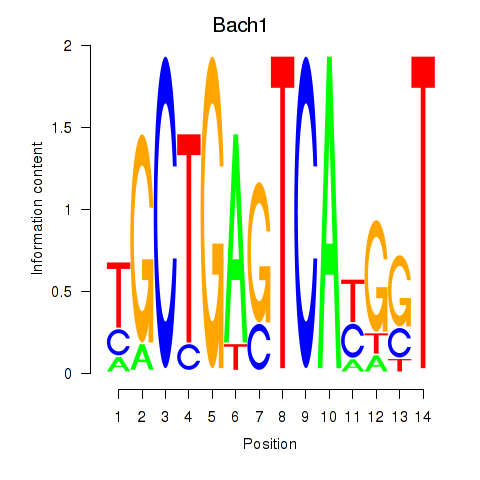
Motif logo

Transcription factors associated with Nfe2_Bach1_Mafk
| Gene Symbol | Gene ID | Gene Info |
|---|---|---|
|
Nfe2
|
ENSMUSG00000058794.13 | Nfe2 |
|
Bach1
|
ENSMUSG00000025612.6 | Bach1 |
|
Mafk
|
ENSMUSG00000018143.11 | Mafk |
Activity-expression correlation:
| Gene | Promoter | Pearson corr. coef. | P-value | Plot |
|---|---|---|---|---|
| Nfe2 | mm39_v1_chr15_-_103163860_103163879 | -0.59 | 1.5e-04 | Click! |
| Mafk | mm39_v1_chr5_+_139777263_139777271 | -0.49 | 2.6e-03 | Click! |
| Bach1 | mm39_v1_chr16_+_87495792_87495872 | 0.03 | 8.6e-01 | Click! |
Activity profile of Nfe2_Bach1_Mafk motif
Sorted Z-values of Nfe2_Bach1_Mafk motif
Network of associatons between targets according to the STRING database.

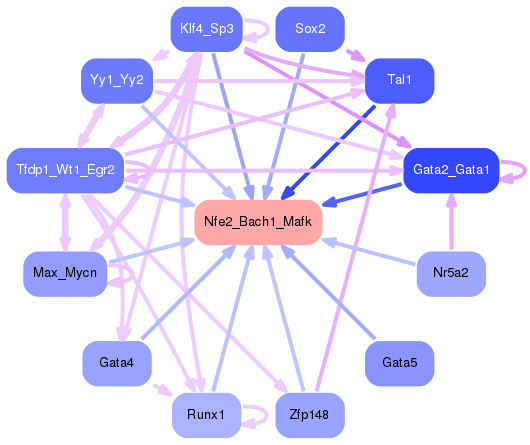
First level regulatory network of Nfe2_Bach1_Mafk
| Promoter | Score | Transcript | Gene | Gene Info |
|---|---|---|---|---|
| chr9_-_86577940 | 23.25 |
ENSMUST00000034989.15
|
Me1
|
malic enzyme 1, NADP(+)-dependent, cytosolic |
| chr1_+_58069090 | 11.97 |
ENSMUST00000001027.7
|
Aox1
|
aldehyde oxidase 1 |
| chr19_+_12610870 | 10.91 |
ENSMUST00000119960.2
|
Glyat
|
glycine-N-acyltransferase |
| chr19_-_4087907 | 8.73 |
ENSMUST00000237982.2
|
Gstp1
|
glutathione S-transferase, pi 1 |
| chr19_-_4087940 | 8.61 |
ENSMUST00000237893.2
ENSMUST00000169613.4 |
Gstp1
|
glutathione S-transferase, pi 1 |
| chr19_-_4092218 | 8.27 |
ENSMUST00000237999.2
ENSMUST00000042700.12 |
Gstp2
|
glutathione S-transferase, pi 2 |
| chr19_+_12610668 | 7.57 |
ENSMUST00000044976.12
|
Glyat
|
glycine-N-acyltransferase |
| chr6_+_129510331 | 6.89 |
ENSMUST00000204956.2
ENSMUST00000204639.2 |
Gabarapl1
|
gamma-aminobutyric acid (GABA) A receptor-associated protein-like 1 |
| chr1_+_165596961 | 6.06 |
ENSMUST00000040298.5
|
Creg1
|
cellular repressor of E1A-stimulated genes 1 |
| chr16_+_90017634 | 5.69 |
ENSMUST00000023707.11
|
Sod1
|
superoxide dismutase 1, soluble |
| chr5_-_108823435 | 5.67 |
ENSMUST00000051757.14
|
Slc26a1
|
solute carrier family 26 (sulfate transporter), member 1 |
| chr11_+_80319424 | 5.58 |
ENSMUST00000173938.8
ENSMUST00000017572.14 |
Psmd11
|
proteasome (prosome, macropain) 26S subunit, non-ATPase, 11 |
| chr18_+_24786748 | 4.79 |
ENSMUST00000068006.9
|
Mocos
|
molybdenum cofactor sulfurase |
| chr8_+_120163857 | 4.55 |
ENSMUST00000152420.8
ENSMUST00000212112.2 ENSMUST00000098365.4 |
Osgin1
|
oxidative stress induced growth inhibitor 1 |
| chr5_-_24963006 | 4.51 |
ENSMUST00000047119.5
|
Crygn
|
crystallin, gamma N |
| chr11_-_50101592 | 4.47 |
ENSMUST00000143379.2
ENSMUST00000015981.12 ENSMUST00000102774.11 |
Sqstm1
|
sequestosome 1 |
| chr7_-_140856642 | 4.39 |
ENSMUST00000080654.7
ENSMUST00000167263.9 |
Cdhr5
|
cadherin-related family member 5 |
| chr3_+_123061094 | 4.30 |
ENSMUST00000047923.12
ENSMUST00000200333.2 |
Sec24d
|
Sec24 related gene family, member D (S. cerevisiae) |
| chr5_-_65585720 | 4.04 |
ENSMUST00000131263.3
|
Ugdh
|
UDP-glucose dehydrogenase |
| chr7_+_127399789 | 3.95 |
ENSMUST00000125188.8
|
Hsd3b7
|
hydroxy-delta-5-steroid dehydrogenase, 3 beta- and steroid delta-isomerase 7 |
| chr7_+_127399776 | 3.84 |
ENSMUST00000046863.12
ENSMUST00000206674.2 ENSMUST00000106272.8 |
Hsd3b7
|
hydroxy-delta-5-steroid dehydrogenase, 3 beta- and steroid delta-isomerase 7 |
| chr6_+_129510117 | 3.71 |
ENSMUST00000032264.9
|
Gabarapl1
|
gamma-aminobutyric acid (GABA) A receptor-associated protein-like 1 |
| chr15_-_82291372 | 3.60 |
ENSMUST00000230198.2
ENSMUST00000230248.2 ENSMUST00000072776.5 ENSMUST00000229911.2 |
Cyp2d10
|
cytochrome P450, family 2, subfamily d, polypeptide 10 |
| chr18_-_3281089 | 3.22 |
ENSMUST00000139537.2
ENSMUST00000124747.8 |
Crem
|
cAMP responsive element modulator |
| chr11_-_50216426 | 3.22 |
ENSMUST00000179865.8
ENSMUST00000020637.9 |
Canx
|
calnexin |
| chr2_+_25318642 | 3.18 |
ENSMUST00000102919.4
|
Abca2
|
ATP-binding cassette, sub-family A (ABC1), member 2 |
| chr12_-_84447702 | 3.16 |
ENSMUST00000122194.8
|
Entpd5
|
ectonucleoside triphosphate diphosphohydrolase 5 |
| chr11_-_69696428 | 2.94 |
ENSMUST00000051025.5
|
Tmem102
|
transmembrane protein 102 |
| chr6_-_72212547 | 2.91 |
ENSMUST00000042646.8
|
Atoh8
|
atonal bHLH transcription factor 8 |
| chr18_+_12776358 | 2.91 |
ENSMUST00000234966.2
ENSMUST00000025294.9 |
Ttc39c
|
tetratricopeptide repeat domain 39C |
| chr7_+_127400016 | 2.90 |
ENSMUST00000106271.2
ENSMUST00000138432.2 |
Hsd3b7
|
hydroxy-delta-5-steroid dehydrogenase, 3 beta- and steroid delta-isomerase 7 |
| chr12_-_84447625 | 2.85 |
ENSMUST00000117286.2
|
Entpd5
|
ectonucleoside triphosphate diphosphohydrolase 5 |
| chr5_-_147831610 | 2.70 |
ENSMUST00000118527.8
ENSMUST00000031655.4 ENSMUST00000138244.2 |
Slc46a3
|
solute carrier family 46, member 3 |
| chr4_+_116542741 | 2.67 |
ENSMUST00000135573.8
ENSMUST00000151129.8 |
Prdx1
|
peroxiredoxin 1 |
| chr1_-_180027151 | 2.42 |
ENSMUST00000161743.3
|
Coq8a
|
coenzyme Q8A |
| chr11_-_120521382 | 2.42 |
ENSMUST00000106181.8
|
Mafg
|
v-maf musculoaponeurotic fibrosarcoma oncogene family, protein G (avian) |
| chr8_+_105996469 | 2.38 |
ENSMUST00000172525.8
ENSMUST00000174837.8 ENSMUST00000173859.2 |
Hsf4
|
heat shock transcription factor 4 |
| chr13_-_12476313 | 2.38 |
ENSMUST00000143693.8
ENSMUST00000144283.2 ENSMUST00000099820.10 ENSMUST00000135166.8 |
Lgals8
|
lectin, galactose binding, soluble 8 |
| chr14_+_66872699 | 2.37 |
ENSMUST00000159365.8
ENSMUST00000054661.8 ENSMUST00000225182.2 ENSMUST00000159068.2 |
Adra1a
|
adrenergic receptor, alpha 1a |
| chr6_+_138118565 | 2.37 |
ENSMUST00000118091.8
|
Mgst1
|
microsomal glutathione S-transferase 1 |
| chr9_-_106353571 | 2.34 |
ENSMUST00000123555.8
ENSMUST00000125850.2 |
Parp3
|
poly (ADP-ribose) polymerase family, member 3 |
| chr4_+_116543045 | 2.28 |
ENSMUST00000129315.8
ENSMUST00000106470.8 |
Prdx1
|
peroxiredoxin 1 |
| chr7_+_127399848 | 2.20 |
ENSMUST00000139068.8
|
Hsd3b7
|
hydroxy-delta-5-steroid dehydrogenase, 3 beta- and steroid delta-isomerase 7 |
| chr13_-_58363431 | 2.19 |
ENSMUST00000076454.8
ENSMUST00000058735.12 |
Ubqln1
|
ubiquilin 1 |
| chrX_+_163052367 | 2.17 |
ENSMUST00000145412.8
ENSMUST00000033749.9 |
Pir
|
pirin |
| chr8_+_105996419 | 2.16 |
ENSMUST00000036127.9
ENSMUST00000163734.9 |
Hsf4
|
heat shock transcription factor 4 |
| chr2_+_151947444 | 2.12 |
ENSMUST00000041500.8
|
Srxn1
|
sulfiredoxin 1 homolog (S. cerevisiae) |
| chr7_+_143028831 | 2.11 |
ENSMUST00000105917.3
|
Slc22a18
|
solute carrier family 22 (organic cation transporter), member 18 |
| chr1_+_33947250 | 2.11 |
ENSMUST00000183034.5
|
Dst
|
dystonin |
| chr11_+_120564185 | 2.10 |
ENSMUST00000135346.8
ENSMUST00000127269.8 ENSMUST00000131727.9 ENSMUST00000149389.8 ENSMUST00000153346.8 |
Aspscr1
|
alveolar soft part sarcoma chromosome region, candidate 1 (human) |
| chr15_-_98575332 | 2.09 |
ENSMUST00000120997.2
ENSMUST00000109149.9 ENSMUST00000003451.11 |
Rnd1
|
Rho family GTPase 1 |
| chr9_-_106353792 | 2.06 |
ENSMUST00000214682.2
ENSMUST00000112479.9 |
Parp3
|
poly (ADP-ribose) polymerase family, member 3 |
| chr4_-_57956411 | 2.03 |
ENSMUST00000030051.6
|
Txn1
|
thioredoxin 1 |
| chr10_+_60113449 | 2.01 |
ENSMUST00000105465.8
ENSMUST00000179238.8 ENSMUST00000177779.8 ENSMUST00000004316.15 |
Psap
|
prosaposin |
| chr10_+_128769642 | 1.99 |
ENSMUST00000099112.4
ENSMUST00000218290.2 |
Itga7
|
integrin alpha 7 |
| chr15_+_54434576 | 1.97 |
ENSMUST00000025356.4
|
Mal2
|
mal, T cell differentiation protein 2 |
| chr19_+_8816663 | 1.97 |
ENSMUST00000160556.8
|
Bscl2
|
Berardinelli-Seip congenital lipodystrophy 2 (seipin) |
| chr18_-_35087355 | 1.92 |
ENSMUST00000025217.11
|
Hspa9
|
heat shock protein 9 |
| chr2_-_32271833 | 1.84 |
ENSMUST00000146423.2
|
1110008P14Rik
|
RIKEN cDNA 1110008P14 gene |
| chr5_+_30971915 | 1.83 |
ENSMUST00000031058.15
|
Mapre3
|
microtubule-associated protein, RP/EB family, member 3 |
| chr18_-_3280999 | 1.83 |
ENSMUST00000049942.13
|
Crem
|
cAMP responsive element modulator |
| chr12_+_71021395 | 1.79 |
ENSMUST00000160027.8
ENSMUST00000160864.8 |
Psma3
|
proteasome subunit alpha 3 |
| chr5_+_30972067 | 1.79 |
ENSMUST00000200692.4
|
Mapre3
|
microtubule-associated protein, RP/EB family, member 3 |
| chr16_+_20367327 | 1.73 |
ENSMUST00000003319.6
ENSMUST00000232680.2 ENSMUST00000232490.2 |
Abcf3
|
ATP-binding cassette, sub-family F (GCN20), member 3 |
| chr15_+_10224052 | 1.54 |
ENSMUST00000128450.8
ENSMUST00000148257.8 ENSMUST00000128921.8 |
Prlr
|
prolactin receptor |
| chr18_+_12637217 | 1.53 |
ENSMUST00000188815.2
|
Lama3
|
laminin, alpha 3 |
| chr9_-_43151179 | 1.52 |
ENSMUST00000034512.7
|
Oaf
|
out at first homolog |
| chr14_+_67953584 | 1.51 |
ENSMUST00000145542.8
ENSMUST00000125212.2 |
Kctd9
|
potassium channel tetramerisation domain containing 9 |
| chr10_-_34294461 | 1.48 |
ENSMUST00000213269.2
ENSMUST00000099973.4 ENSMUST00000105512.8 ENSMUST00000047885.14 |
Nt5dc1
|
5'-nucleotidase domain containing 1 |
| chr15_+_3300249 | 1.46 |
ENSMUST00000082424.12
ENSMUST00000159158.9 ENSMUST00000159216.10 ENSMUST00000160311.3 |
Selenop
|
selenoprotein P |
| chr4_-_42665763 | 1.45 |
ENSMUST00000238770.2
|
Il11ra2
|
interleukin 11 receptor, alpha chain 2 |
| chr4_-_42168603 | 1.44 |
ENSMUST00000098121.4
|
Gm13305
|
predicted gene 13305 |
| chr2_+_11710633 | 1.44 |
ENSMUST00000114832.3
|
Il15ra
|
interleukin 15 receptor, alpha chain |
| chr14_+_67953687 | 1.42 |
ENSMUST00000150768.8
|
Kctd9
|
potassium channel tetramerisation domain containing 9 |
| chr1_-_173195236 | 1.41 |
ENSMUST00000005470.5
ENSMUST00000111220.8 |
Cadm3
|
cell adhesion molecule 3 |
| chr6_+_17463925 | 1.37 |
ENSMUST00000115442.8
|
Met
|
met proto-oncogene |
| chr7_+_139414057 | 1.33 |
ENSMUST00000026548.14
|
Adgra1
|
adhesion G protein-coupled receptor A1 |
| chr7_+_101032021 | 1.31 |
ENSMUST00000141083.9
|
Arap1
|
ArfGAP with RhoGAP domain, ankyrin repeat and PH domain 1 |
| chr9_+_7272514 | 1.31 |
ENSMUST00000015394.10
|
Mmp13
|
matrix metallopeptidase 13 |
| chr15_+_80139371 | 1.31 |
ENSMUST00000109605.5
ENSMUST00000229828.2 |
Atf4
|
activating transcription factor 4 |
| chr11_+_120421496 | 1.29 |
ENSMUST00000026119.8
|
Gcgr
|
glucagon receptor |
| chr5_-_108022900 | 1.27 |
ENSMUST00000138111.8
ENSMUST00000112642.8 |
Evi5
|
ecotropic viral integration site 5 |
| chr15_-_75886166 | 1.27 |
ENSMUST00000060807.12
|
Fam83h
|
family with sequence similarity 83, member H |
| chr14_+_28740162 | 1.23 |
ENSMUST00000055662.4
|
Lrtm1
|
leucine-rich repeats and transmembrane domains 1 |
| chr11_-_116080361 | 1.23 |
ENSMUST00000148601.2
|
Acox1
|
acyl-Coenzyme A oxidase 1, palmitoyl |
| chr13_+_41040657 | 1.22 |
ENSMUST00000069958.15
|
Gcnt2
|
glucosaminyl (N-acetyl) transferase 2, I-branching enzyme |
| chr15_-_76079891 | 1.21 |
ENSMUST00000023226.13
|
Plec
|
plectin |
| chr6_+_17463748 | 1.20 |
ENSMUST00000115443.8
|
Met
|
met proto-oncogene |
| chr7_-_44320244 | 1.19 |
ENSMUST00000048102.15
|
Myh14
|
myosin, heavy polypeptide 14 |
| chr14_-_20844074 | 1.19 |
ENSMUST00000080440.14
ENSMUST00000100837.11 ENSMUST00000071816.7 |
Camk2g
|
calcium/calmodulin-dependent protein kinase II gamma |
| chr12_+_111504640 | 1.19 |
ENSMUST00000222375.2
ENSMUST00000222388.2 |
Eif5
|
eukaryotic translation initiation factor 5 |
| chr17_-_24439712 | 1.18 |
ENSMUST00000024930.8
|
Tedc2
|
tubulin epsilon and delta complex 2 |
| chr11_+_60619224 | 1.18 |
ENSMUST00000018743.5
|
Mief2
|
mitochondrial elongation factor 2 |
| chr10_-_81262948 | 1.17 |
ENSMUST00000078185.14
ENSMUST00000020461.15 ENSMUST00000105321.10 |
Nfic
|
nuclear factor I/C |
| chr14_+_67953547 | 1.16 |
ENSMUST00000078053.13
|
Kctd9
|
potassium channel tetramerisation domain containing 9 |
| chr15_+_25933632 | 1.13 |
ENSMUST00000228327.2
|
Retreg1
|
reticulophagy regulator 1 |
| chr11_-_106378622 | 1.13 |
ENSMUST00000001059.9
ENSMUST00000106799.2 ENSMUST00000106800.2 |
Ern1
|
endoplasmic reticulum (ER) to nucleus signalling 1 |
| chr11_+_120563844 | 1.10 |
ENSMUST00000106158.9
ENSMUST00000103016.8 ENSMUST00000168714.9 |
Aspscr1
|
alveolar soft part sarcoma chromosome region, candidate 1 (human) |
| chr5_+_147797425 | 1.09 |
ENSMUST00000201376.4
ENSMUST00000201120.2 |
Pomp
|
proteasome maturation protein |
| chr10_+_127894816 | 1.08 |
ENSMUST00000052798.14
|
Ptges3
|
prostaglandin E synthase 3 |
| chrX_+_73468140 | 1.08 |
ENSMUST00000135165.8
ENSMUST00000114128.8 ENSMUST00000004330.10 ENSMUST00000114133.9 ENSMUST00000114129.9 ENSMUST00000132749.2 |
Ikbkg
|
inhibitor of kappaB kinase gamma |
| chr5_+_34683141 | 1.08 |
ENSMUST00000125817.8
ENSMUST00000067638.14 |
Sh3bp2
|
SH3-domain binding protein 2 |
| chr9_+_32135540 | 1.07 |
ENSMUST00000168954.9
|
Arhgap32
|
Rho GTPase activating protein 32 |
| chr9_-_121745354 | 1.07 |
ENSMUST00000062474.5
|
Cyp8b1
|
cytochrome P450, family 8, subfamily b, polypeptide 1 |
| chr3_+_122039206 | 1.06 |
ENSMUST00000029769.14
|
Gclm
|
glutamate-cysteine ligase, modifier subunit |
| chr1_-_74932266 | 1.05 |
ENSMUST00000006721.3
|
Cryba2
|
crystallin, beta A2 |
| chr19_+_57599452 | 1.05 |
ENSMUST00000077282.7
|
Atrnl1
|
attractin like 1 |
| chr9_+_108566513 | 1.04 |
ENSMUST00000192344.2
|
Prkar2a
|
protein kinase, cAMP dependent regulatory, type II alpha |
| chr11_-_120520954 | 1.03 |
ENSMUST00000106180.2
|
Mafg
|
v-maf musculoaponeurotic fibrosarcoma oncogene family, protein G (avian) |
| chr14_-_21898992 | 1.03 |
ENSMUST00000124549.9
|
Comtd1
|
catechol-O-methyltransferase domain containing 1 |
| chr1_+_107517726 | 1.03 |
ENSMUST00000000514.11
ENSMUST00000112706.4 |
Serpinb8
|
serine (or cysteine) peptidase inhibitor, clade B, member 8 |
| chr5_+_147797258 | 1.01 |
ENSMUST00000031654.10
|
Pomp
|
proteasome maturation protein |
| chr9_-_25063068 | 1.00 |
ENSMUST00000008573.9
|
Herpud2
|
HERPUD family member 2 |
| chr8_-_3767547 | 1.00 |
ENSMUST00000058040.7
|
Clec4g
|
C-type lectin domain family 4, member g |
| chr13_-_23894828 | 1.00 |
ENSMUST00000091706.14
|
Hfe
|
homeostatic iron regulator |
| chr10_+_127894843 | 1.00 |
ENSMUST00000084771.3
|
Ptges3
|
prostaglandin E synthase 3 |
| chr19_-_4384029 | 1.00 |
ENSMUST00000176653.2
|
Kdm2a
|
lysine (K)-specific demethylase 2A |
| chr10_+_43777777 | 0.98 |
ENSMUST00000054418.12
|
Rtn4ip1
|
reticulon 4 interacting protein 1 |
| chr7_-_119461027 | 0.97 |
ENSMUST00000137888.2
ENSMUST00000142120.2 |
Dcun1d3
|
DCN1, defective in cullin neddylation 1, domain containing 3 (S. cerevisiae) |
| chr13_-_23894697 | 0.97 |
ENSMUST00000091707.13
ENSMUST00000006787.8 |
Hfe
|
homeostatic iron regulator |
| chr3_-_84128160 | 0.97 |
ENSMUST00000154152.2
ENSMUST00000107693.9 ENSMUST00000107695.9 |
Trim2
|
tripartite motif-containing 2 |
| chr14_+_4230569 | 0.95 |
ENSMUST00000090543.6
|
Nr1d2
|
nuclear receptor subfamily 1, group D, member 2 |
| chr11_-_30599510 | 0.95 |
ENSMUST00000074613.4
|
Acyp2
|
acylphosphatase 2, muscle type |
| chr2_+_160722562 | 0.94 |
ENSMUST00000109456.9
|
Lpin3
|
lipin 3 |
| chr5_+_43390513 | 0.94 |
ENSMUST00000166713.9
ENSMUST00000169035.8 ENSMUST00000114065.9 |
Cpeb2
|
cytoplasmic polyadenylation element binding protein 2 |
| chr12_+_111504450 | 0.94 |
ENSMUST00000166123.9
ENSMUST00000222441.2 |
Eif5
|
eukaryotic translation initiation factor 5 |
| chr3_-_88460166 | 0.93 |
ENSMUST00000119002.2
ENSMUST00000029698.15 |
Lamtor2
|
late endosomal/lysosomal adaptor, MAPK and MTOR activator 2 |
| chr12_+_82303350 | 0.92 |
ENSMUST00000222714.2
|
Sipa1l1
|
signal-induced proliferation-associated 1 like 1 |
| chr6_-_83633064 | 0.91 |
ENSMUST00000014686.3
|
Clec4f
|
C-type lectin domain family 4, member f |
| chr11_+_87482971 | 0.90 |
ENSMUST00000103179.10
ENSMUST00000092802.12 ENSMUST00000146871.8 |
Mtmr4
|
myotubularin related protein 4 |
| chr2_+_143757193 | 0.90 |
ENSMUST00000103172.4
|
Dstn
|
destrin |
| chr15_-_100497863 | 0.90 |
ENSMUST00000073837.13
|
Pou6f1
|
POU domain, class 6, transcription factor 1 |
| chr8_+_106052970 | 0.89 |
ENSMUST00000015000.12
ENSMUST00000098453.9 |
Tmem208
|
transmembrane protein 208 |
| chr19_+_5927821 | 0.89 |
ENSMUST00000145200.8
ENSMUST00000025732.14 ENSMUST00000125114.8 ENSMUST00000155697.8 |
Slc25a45
|
solute carrier family 25, member 45 |
| chr8_-_71308040 | 0.88 |
ENSMUST00000212509.3
|
Kcnn1
|
potassium intermediate/small conductance calcium-activated channel, subfamily N, member 1 |
| chr19_+_5927876 | 0.87 |
ENSMUST00000235340.2
|
Slc25a45
|
solute carrier family 25, member 45 |
| chr17_+_25059079 | 0.87 |
ENSMUST00000164251.8
|
Hagh
|
hydroxyacyl glutathione hydrolase |
| chr11_+_78068931 | 0.86 |
ENSMUST00000147819.8
|
Tlcd1
|
TLC domain containing 1 |
| chr11_+_121036969 | 0.86 |
ENSMUST00000039088.9
ENSMUST00000155694.2 |
Tex19.1
|
testis expressed gene 19.1 |
| chr19_-_41252370 | 0.86 |
ENSMUST00000237871.2
ENSMUST00000025989.10 |
Tm9sf3
|
transmembrane 9 superfamily member 3 |
| chr6_-_146403410 | 0.86 |
ENSMUST00000053273.15
|
Itpr2
|
inositol 1,4,5-triphosphate receptor 2 |
| chr12_+_35097179 | 0.85 |
ENSMUST00000163677.3
ENSMUST00000048519.17 |
Snx13
|
sorting nexin 13 |
| chr12_+_111132908 | 0.85 |
ENSMUST00000139162.8
ENSMUST00000060274.7 |
Traf3
|
TNF receptor-associated factor 3 |
| chr6_+_17463819 | 0.84 |
ENSMUST00000140070.8
|
Met
|
met proto-oncogene |
| chr3_+_81906768 | 0.84 |
ENSMUST00000107736.2
|
Asic5
|
acid-sensing (proton-gated) ion channel family member 5 |
| chr1_-_75195127 | 0.84 |
ENSMUST00000079464.13
|
Tuba4a
|
tubulin, alpha 4A |
| chr9_-_107556823 | 0.83 |
ENSMUST00000010205.9
|
Gnat1
|
guanine nucleotide binding protein, alpha transducing 1 |
| chr14_-_36857083 | 0.82 |
ENSMUST00000042564.17
|
Ghitm
|
growth hormone inducible transmembrane protein |
| chrX_+_5959507 | 0.81 |
ENSMUST00000103007.4
|
Nudt11
|
nudix (nucleoside diphosphate linked moiety X)-type motif 11 |
| chr11_-_98329782 | 0.81 |
ENSMUST00000002655.8
|
Mien1
|
migration and invasion enhancer 1 |
| chr11_+_107370375 | 0.80 |
ENSMUST00000106750.5
|
Psmd12
|
proteasome (prosome, macropain) 26S subunit, non-ATPase, 12 |
| chr11_+_107370303 | 0.80 |
ENSMUST00000021063.13
ENSMUST00000106752.10 |
Psmd12
|
proteasome (prosome, macropain) 26S subunit, non-ATPase, 12 |
| chr17_-_24863956 | 0.79 |
ENSMUST00000019684.13
|
Slc9a3r2
|
solute carrier family 9 (sodium/hydrogen exchanger), member 3 regulator 2 |
| chr1_+_191710209 | 0.78 |
ENSMUST00000175680.3
|
Rd3
|
retinal degeneration 3 |
| chr9_-_106353303 | 0.78 |
ENSMUST00000156426.8
|
Parp3
|
poly (ADP-ribose) polymerase family, member 3 |
| chr2_+_163389068 | 0.76 |
ENSMUST00000109411.8
ENSMUST00000018094.13 |
Hnf4a
|
hepatic nuclear factor 4, alpha |
| chr12_+_111505253 | 0.73 |
ENSMUST00000220803.2
|
Eif5
|
eukaryotic translation initiation factor 5 |
| chr13_-_65353757 | 0.73 |
ENSMUST00000223418.2
ENSMUST00000222559.2 ENSMUST00000221659.2 ENSMUST00000222273.2 |
Nlrp4f
|
NLR family, pyrin domain containing 4F |
| chr13_-_8921732 | 0.72 |
ENSMUST00000054251.13
ENSMUST00000176813.8 ENSMUST00000175958.2 |
Wdr37
|
WD repeat domain 37 |
| chr18_-_63825491 | 0.72 |
ENSMUST00000237004.2
|
Txnl1
|
thioredoxin-like 1 |
| chr9_-_110571645 | 0.72 |
ENSMUST00000006005.12
|
Pth1r
|
parathyroid hormone 1 receptor |
| chr19_-_38113056 | 0.72 |
ENSMUST00000236283.2
|
Rbp4
|
retinol binding protein 4, plasma |
| chr12_+_111505216 | 0.71 |
ENSMUST00000050993.11
|
Eif5
|
eukaryotic translation initiation factor 5 |
| chr17_-_24863907 | 0.71 |
ENSMUST00000234505.2
|
Slc9a3r2
|
solute carrier family 9 (sodium/hydrogen exchanger), member 3 regulator 2 |
| chr15_-_76501525 | 0.71 |
ENSMUST00000230977.2
|
Slc39a4
|
solute carrier family 39 (zinc transporter), member 4 |
| chr11_-_121009503 | 0.70 |
ENSMUST00000039146.4
|
Tex19.2
|
testis expressed gene 19.2 |
| chr16_+_58548273 | 0.70 |
ENSMUST00000023426.12
ENSMUST00000162057.8 ENSMUST00000162191.2 |
Cldnd1
|
claudin domain containing 1 |
| chr6_+_30509826 | 0.69 |
ENSMUST00000031797.11
|
Ssmem1
|
serine-rich single-pass membrane protein 1 |
| chr14_-_36857202 | 0.69 |
ENSMUST00000165649.4
ENSMUST00000224769.2 |
Ghitm
|
growth hormone inducible transmembrane protein |
| chr7_+_49408847 | 0.69 |
ENSMUST00000085272.7
ENSMUST00000207895.2 |
Htatip2
|
HIV-1 Tat interactive protein 2 |
| chr9_+_54858066 | 0.68 |
ENSMUST00000034848.14
|
Psma4
|
proteasome subunit alpha 4 |
| chr18_-_63825380 | 0.68 |
ENSMUST00000025476.4
|
Txnl1
|
thioredoxin-like 1 |
| chr12_-_85335193 | 0.67 |
ENSMUST00000121930.2
|
Acyp1
|
acylphosphatase 1, erythrocyte (common) type |
| chr3_+_137923521 | 0.67 |
ENSMUST00000090171.7
|
Adh7
|
alcohol dehydrogenase 7 (class IV), mu or sigma polypeptide |
| chr12_+_86999366 | 0.67 |
ENSMUST00000191463.2
|
Cipc
|
CLOCK interacting protein, circadian |
| chr14_-_34032311 | 0.67 |
ENSMUST00000111917.3
ENSMUST00000228704.2 |
Shld2
|
shieldin complex subunit 2 |
| chr7_+_28466160 | 0.66 |
ENSMUST00000122915.8
ENSMUST00000072965.5 ENSMUST00000170068.9 |
Sirt2
|
sirtuin 2 |
| chr5_-_122640255 | 0.65 |
ENSMUST00000031423.10
|
Atp2a2
|
ATPase, Ca++ transporting, cardiac muscle, slow twitch 2 |
| chr18_-_10030017 | 0.65 |
ENSMUST00000116669.2
ENSMUST00000092096.14 |
Usp14
|
ubiquitin specific peptidase 14 |
| chr2_+_91087668 | 0.65 |
ENSMUST00000111349.9
ENSMUST00000131711.8 |
Pacsin3
|
protein kinase C and casein kinase substrate in neurons 3 |
| chr3_+_144283355 | 0.63 |
ENSMUST00000151086.3
|
Selenof
|
selenoprotein F |
| chr7_-_103964662 | 0.62 |
ENSMUST00000106837.8
ENSMUST00000106839.9 ENSMUST00000070943.7 |
Trim12a
|
tripartite motif-containing 12A |
| chr2_+_136555364 | 0.62 |
ENSMUST00000028727.11
ENSMUST00000110098.4 |
Snap25
|
synaptosomal-associated protein 25 |
| chr6_-_146403638 | 0.62 |
ENSMUST00000079573.13
|
Itpr2
|
inositol 1,4,5-triphosphate receptor 2 |
| chr2_+_29968225 | 0.61 |
ENSMUST00000150770.8
|
Pkn3
|
protein kinase N3 |
| chr11_-_106378659 | 0.61 |
ENSMUST00000106801.8
|
Ern1
|
endoplasmic reticulum (ER) to nucleus signalling 1 |
| chr7_+_126365506 | 0.60 |
ENSMUST00000032944.9
|
Gdpd3
|
glycerophosphodiester phosphodiesterase domain containing 3 |
| chr5_-_122639840 | 0.59 |
ENSMUST00000177974.8
|
Atp2a2
|
ATPase, Ca++ transporting, cardiac muscle, slow twitch 2 |
| chr11_+_106146966 | 0.59 |
ENSMUST00000021049.9
|
Psmc5
|
protease (prosome, macropain) 26S subunit, ATPase 5 |
| chr9_-_103243039 | 0.58 |
ENSMUST00000035484.11
|
Cdv3
|
carnitine deficiency-associated gene expressed in ventricle 3 |
| chr2_+_11710246 | 0.58 |
ENSMUST00000148748.8
|
Il15ra
|
interleukin 15 receptor, alpha chain |
| chr3_+_122039274 | 0.58 |
ENSMUST00000178826.8
|
Gclm
|
glutamate-cysteine ligase, modifier subunit |
| chr9_+_54858388 | 0.58 |
ENSMUST00000171900.2
|
Psma4
|
proteasome subunit alpha 4 |
| chr12_+_55445560 | 0.57 |
ENSMUST00000021412.9
|
Psma6
|
proteasome subunit alpha 6 |
| chr9_+_54858092 | 0.56 |
ENSMUST00000172407.8
|
Psma4
|
proteasome subunit alpha 4 |
| chr14_-_20529974 | 0.56 |
ENSMUST00000224975.2
|
Anxa7
|
annexin A7 |
| chr8_-_71308229 | 0.56 |
ENSMUST00000212086.2
|
Kcnn1
|
potassium intermediate/small conductance calcium-activated channel, subfamily N, member 1 |
| chr2_-_20948230 | 0.55 |
ENSMUST00000140230.2
|
Arhgap21
|
Rho GTPase activating protein 21 |
| chr12_-_101943134 | 0.54 |
ENSMUST00000221227.2
|
Ndufb1
|
NADH:ubiquinone oxidoreductase subunit B1 |
| chr13_-_64460491 | 0.54 |
ENSMUST00000222570.2
ENSMUST00000220895.2 |
Prxl2c
|
peroxiredoxin like 2C |
Gene Ontology Analysis
Gene overrepresentation in biological process category:
| Log-likelihood per target | Total log-likelihood | Term | Description |
|---|---|---|---|
| 5.8 | 17.3 | GO:2000469 | negative regulation of peroxidase activity(GO:2000469) |
| 2.9 | 23.3 | GO:1902031 | regulation of NADP metabolic process(GO:1902031) |
| 2.4 | 12.0 | GO:0009115 | xanthine catabolic process(GO:0009115) |
| 1.2 | 12.9 | GO:0035754 | B cell chemotaxis(GO:0035754) |
| 0.9 | 3.6 | GO:1903033 | regulation of microtubule plus-end binding(GO:1903031) positive regulation of microtubule plus-end binding(GO:1903033) |
| 0.9 | 4.4 | GO:1904970 | brush border assembly(GO:1904970) |
| 0.9 | 5.2 | GO:1990166 | protein localization to site of double-strand break(GO:1990166) |
| 0.8 | 2.4 | GO:0001983 | baroreceptor response to increased systemic arterial blood pressure(GO:0001983) |
| 0.7 | 2.2 | GO:0035973 | aggrephagy(GO:0035973) |
| 0.7 | 10.6 | GO:0043562 | cellular response to nitrogen starvation(GO:0006995) cellular response to nitrogen levels(GO:0043562) |
| 0.7 | 2.0 | GO:0034758 | negative regulation of antigen processing and presentation of peptide antigen via MHC class I(GO:0002590) regulation of T cell antigen processing and presentation(GO:0002625) positive regulation of iron ion transport(GO:0034758) positive regulation of iron ion transmembrane transport(GO:0034761) regulation of iron ion import(GO:1900390) regulation of ferrous iron import into cell(GO:1903989) positive regulation of ferrous iron import into cell(GO:1903991) regulation of ferrous iron binding(GO:1904432) positive regulation of ferrous iron binding(GO:1904434) regulation of transferrin receptor binding(GO:1904435) positive regulation of transferrin receptor binding(GO:1904437) regulation of ferrous iron import across plasma membrane(GO:1904438) positive regulation of ferrous iron import across plasma membrane(GO:1904440) |
| 0.6 | 5.7 | GO:0019532 | oxalate transport(GO:0019532) |
| 0.6 | 4.8 | GO:0019720 | Mo-molybdopterin cofactor biosynthetic process(GO:0006777) Mo-molybdopterin cofactor metabolic process(GO:0019720) |
| 0.6 | 2.4 | GO:0071449 | cellular response to lipid hydroperoxide(GO:0071449) |
| 0.5 | 5.7 | GO:0090206 | negative regulation of cholesterol biosynthetic process(GO:0045541) negative regulation of cholesterol metabolic process(GO:0090206) |
| 0.5 | 3.4 | GO:0070494 | regulation of thrombin receptor signaling pathway(GO:0070494) negative regulation of thrombin receptor signaling pathway(GO:0070495) |
| 0.5 | 1.9 | GO:1902037 | negative regulation of hematopoietic stem cell differentiation(GO:1902037) |
| 0.5 | 7.7 | GO:0043248 | proteasome assembly(GO:0043248) |
| 0.5 | 3.2 | GO:0032377 | regulation of intracellular lipid transport(GO:0032377) regulation of intracellular sterol transport(GO:0032380) regulation of intracellular cholesterol transport(GO:0032383) |
| 0.4 | 1.3 | GO:0036091 | positive regulation of transcription from RNA polymerase II promoter in response to oxidative stress(GO:0036091) |
| 0.4 | 1.2 | GO:1903233 | regulation of calcium ion-dependent exocytosis of neurotransmitter(GO:1903233) |
| 0.4 | 4.6 | GO:0061635 | regulation of protein complex stability(GO:0061635) |
| 0.3 | 2.4 | GO:0002317 | plasma cell differentiation(GO:0002317) |
| 0.3 | 1.3 | GO:0090187 | positive regulation of pancreatic juice secretion(GO:0090187) |
| 0.3 | 0.9 | GO:1900195 | positive regulation of oocyte maturation(GO:1900195) positive regulation of proteasomal ubiquitin-dependent protein catabolic process involved in cellular response to hypoxia(GO:2000777) |
| 0.3 | 0.9 | GO:0060722 | spongiotrophoblast cell proliferation(GO:0060720) cell proliferation involved in embryonic placenta development(GO:0060722) |
| 0.3 | 1.5 | GO:0038161 | prolactin signaling pathway(GO:0038161) |
| 0.3 | 0.8 | GO:0042977 | regulation of activation of JAK2 kinase activity(GO:0010534) activation of JAK2 kinase activity(GO:0042977) negative regulation of activation of JAK2 kinase activity(GO:1902569) |
| 0.3 | 1.8 | GO:0006987 | activation of signaling protein activity involved in unfolded protein response(GO:0006987) |
| 0.2 | 0.7 | GO:0043323 | positive regulation of natural killer cell degranulation(GO:0043323) |
| 0.2 | 4.3 | GO:0090110 | cargo loading into COPII-coated vesicle(GO:0090110) |
| 0.2 | 0.7 | GO:0046021 | regulation of transcription from RNA polymerase II promoter, mitotic(GO:0046021) positive regulation of transcription from RNA polymerase II promoter during mitosis(GO:0046022) |
| 0.2 | 0.7 | GO:0006069 | ethanol oxidation(GO:0006069) |
| 0.2 | 0.9 | GO:0006624 | vacuolar protein processing(GO:0006624) |
| 0.2 | 3.3 | GO:0031581 | hemidesmosome assembly(GO:0031581) |
| 0.2 | 2.9 | GO:0010820 | positive regulation of T cell chemotaxis(GO:0010820) |
| 0.2 | 3.6 | GO:0001731 | formation of translation preinitiation complex(GO:0001731) |
| 0.2 | 0.6 | GO:1990926 | short-term synaptic potentiation(GO:1990926) |
| 0.2 | 1.6 | GO:0051409 | response to nitrosative stress(GO:0051409) |
| 0.2 | 1.2 | GO:0033540 | fatty acid beta-oxidation using acyl-CoA oxidase(GO:0033540) |
| 0.2 | 2.0 | GO:0001766 | membrane raft polarization(GO:0001766) membrane raft distribution(GO:0031580) |
| 0.2 | 4.5 | GO:0033169 | histone H3-K9 demethylation(GO:0033169) |
| 0.2 | 6.0 | GO:0045821 | positive regulation of glycolytic process(GO:0045821) |
| 0.2 | 2.0 | GO:0046826 | negative regulation of protein export from nucleus(GO:0046826) |
| 0.2 | 1.5 | GO:0001887 | selenium compound metabolic process(GO:0001887) |
| 0.2 | 0.5 | GO:1904020 | regulation of G-protein coupled receptor internalization(GO:1904020) |
| 0.2 | 0.2 | GO:0009609 | response to symbiont(GO:0009608) response to symbiotic bacterium(GO:0009609) |
| 0.2 | 5.0 | GO:0042744 | hydrogen peroxide catabolic process(GO:0042744) |
| 0.2 | 1.2 | GO:0036438 | maintenance of lens transparency(GO:0036438) |
| 0.2 | 0.7 | GO:1903070 | negative regulation of ER-associated ubiquitin-dependent protein catabolic process(GO:1903070) |
| 0.2 | 1.3 | GO:0033762 | response to glucagon(GO:0033762) |
| 0.2 | 0.2 | GO:0090265 | immune complex clearance by monocytes and macrophages(GO:0002436) regulation of immune complex clearance by monocytes and macrophages(GO:0090264) positive regulation of immune complex clearance by monocytes and macrophages(GO:0090265) |
| 0.2 | 0.5 | GO:1904117 | activation of meiosis involved in egg activation(GO:0060466) response to fluoride(GO:1902617) response to vasopressin(GO:1904116) cellular response to vasopressin(GO:1904117) |
| 0.1 | 0.9 | GO:0030043 | actin filament fragmentation(GO:0030043) |
| 0.1 | 2.1 | GO:0070389 | chaperone cofactor-dependent protein refolding(GO:0070389) |
| 0.1 | 2.9 | GO:0051450 | myoblast proliferation(GO:0051450) |
| 0.1 | 0.7 | GO:0048807 | female genitalia morphogenesis(GO:0048807) |
| 0.1 | 0.7 | GO:0034224 | cellular response to zinc ion starvation(GO:0034224) |
| 0.1 | 1.2 | GO:0061709 | reticulophagy(GO:0061709) |
| 0.1 | 0.8 | GO:0051342 | sensory perception of umami taste(GO:0050917) regulation of cyclic-nucleotide phosphodiesterase activity(GO:0051342) |
| 0.1 | 0.7 | GO:0010499 | proteasomal ubiquitin-independent protein catabolic process(GO:0010499) |
| 0.1 | 2.5 | GO:0060736 | prostate gland growth(GO:0060736) |
| 0.1 | 0.9 | GO:0045900 | negative regulation of translational elongation(GO:0045900) |
| 0.1 | 1.0 | GO:0033184 | positive regulation of histone ubiquitination(GO:0033184) histone H3-K36 demethylation(GO:0070544) |
| 0.1 | 0.6 | GO:0006421 | asparaginyl-tRNA aminoacylation(GO:0006421) |
| 0.1 | 0.6 | GO:0071921 | establishment of sister chromatid cohesion(GO:0034085) cohesin loading(GO:0071921) regulation of cohesin loading(GO:0071922) |
| 0.1 | 9.1 | GO:0006749 | glutathione metabolic process(GO:0006749) |
| 0.1 | 0.8 | GO:1901906 | diphosphoinositol polyphosphate metabolic process(GO:0071543) diadenosine pentaphosphate metabolic process(GO:1901906) diadenosine pentaphosphate catabolic process(GO:1901907) diadenosine hexaphosphate metabolic process(GO:1901908) diadenosine hexaphosphate catabolic process(GO:1901909) adenosine 5'-(hexahydrogen pentaphosphate) metabolic process(GO:1901910) adenosine 5'-(hexahydrogen pentaphosphate) catabolic process(GO:1901911) |
| 0.1 | 0.6 | GO:0061086 | negative regulation of histone H3-K27 methylation(GO:0061086) |
| 0.1 | 0.6 | GO:0051684 | maintenance of Golgi location(GO:0051684) |
| 0.1 | 0.4 | GO:0071431 | tRNA export from nucleus(GO:0006409) tRNA-containing ribonucleoprotein complex export from nucleus(GO:0071431) |
| 0.1 | 0.4 | GO:0042335 | cuticle development(GO:0042335) |
| 0.1 | 1.5 | GO:0071361 | cellular response to ethanol(GO:0071361) |
| 0.1 | 0.2 | GO:0033693 | neurofilament bundle assembly(GO:0033693) |
| 0.1 | 2.6 | GO:0032825 | positive regulation of natural killer cell differentiation(GO:0032825) |
| 0.1 | 0.5 | GO:0048852 | diencephalon morphogenesis(GO:0048852) |
| 0.1 | 2.4 | GO:0006744 | ubiquinone biosynthetic process(GO:0006744) |
| 0.1 | 0.3 | GO:0015881 | creatine transport(GO:0015881) |
| 0.1 | 0.7 | GO:0015862 | uridine transport(GO:0015862) |
| 0.1 | 0.5 | GO:0035660 | MyD88-dependent toll-like receptor 4 signaling pathway(GO:0035660) |
| 0.1 | 0.4 | GO:0009992 | cellular water homeostasis(GO:0009992) |
| 0.1 | 2.1 | GO:0008090 | retrograde axonal transport(GO:0008090) |
| 0.1 | 0.5 | GO:1901674 | histone H3-K27 acetylation(GO:0043974) spongiotrophoblast differentiation(GO:0060708) regulation of histone H3-K27 acetylation(GO:1901674) |
| 0.1 | 2.0 | GO:0034389 | lipid particle organization(GO:0034389) |
| 0.1 | 0.3 | GO:0075044 | autophagy of host cells involved in interaction with symbiont(GO:0075044) autophagy involved in symbiotic interaction(GO:0075071) |
| 0.1 | 0.4 | GO:0007253 | cytoplasmic sequestering of NF-kappaB(GO:0007253) |
| 0.1 | 2.0 | GO:0016322 | neuron remodeling(GO:0016322) |
| 0.1 | 0.2 | GO:0045643 | regulation of eosinophil differentiation(GO:0045643) positive regulation of eosinophil differentiation(GO:0045645) |
| 0.1 | 0.3 | GO:2000705 | regulation of dense core granule biogenesis(GO:2000705) |
| 0.1 | 0.9 | GO:2000580 | regulation of ATP-dependent microtubule motor activity, plus-end-directed(GO:2000580) positive regulation of ATP-dependent microtubule motor activity, plus-end-directed(GO:2000582) |
| 0.1 | 4.0 | GO:0001702 | gastrulation with mouth forming second(GO:0001702) |
| 0.1 | 0.8 | GO:0008063 | Toll signaling pathway(GO:0008063) |
| 0.1 | 0.4 | GO:0006172 | ADP biosynthetic process(GO:0006172) |
| 0.1 | 5.3 | GO:0006687 | glycosphingolipid metabolic process(GO:0006687) |
| 0.1 | 1.2 | GO:0090141 | positive regulation of mitochondrial fission(GO:0090141) |
| 0.1 | 13.0 | GO:0009636 | response to toxic substance(GO:0009636) |
| 0.1 | 0.3 | GO:0072733 | response to staurosporine(GO:0072733) cellular response to staurosporine(GO:0072734) |
| 0.1 | 0.9 | GO:0045899 | positive regulation of RNA polymerase II transcriptional preinitiation complex assembly(GO:0045899) |
| 0.1 | 0.3 | GO:0044565 | dendritic cell proliferation(GO:0044565) |
| 0.1 | 2.2 | GO:0030224 | monocyte differentiation(GO:0030224) |
| 0.1 | 1.7 | GO:0014067 | negative regulation of phosphatidylinositol 3-kinase signaling(GO:0014067) |
| 0.1 | 1.0 | GO:0090136 | epithelial cell-cell adhesion(GO:0090136) |
| 0.1 | 1.5 | GO:0042118 | endothelial cell activation(GO:0042118) |
| 0.1 | 3.8 | GO:0045604 | regulation of epidermal cell differentiation(GO:0045604) |
| 0.1 | 1.1 | GO:0002710 | negative regulation of T cell mediated immunity(GO:0002710) |
| 0.1 | 0.5 | GO:0002551 | mast cell chemotaxis(GO:0002551) mast cell migration(GO:0097531) |
| 0.1 | 0.2 | GO:1900126 | negative regulation of hyaluronan biosynthetic process(GO:1900126) |
| 0.1 | 1.2 | GO:1901897 | regulation of relaxation of cardiac muscle(GO:1901897) |
| 0.0 | 1.0 | GO:2000480 | negative regulation of cAMP-dependent protein kinase activity(GO:2000480) |
| 0.0 | 0.4 | GO:0042148 | strand invasion(GO:0042148) |
| 0.0 | 0.6 | GO:0035092 | sperm chromatin condensation(GO:0035092) |
| 0.0 | 2.2 | GO:0015893 | drug transport(GO:0015893) |
| 0.0 | 0.7 | GO:0060732 | positive regulation of inositol phosphate biosynthetic process(GO:0060732) |
| 0.0 | 1.4 | GO:2000505 | regulation of energy homeostasis(GO:2000505) |
| 0.0 | 0.2 | GO:0086046 | membrane depolarization during SA node cell action potential(GO:0086046) |
| 0.0 | 1.1 | GO:0007250 | activation of NF-kappaB-inducing kinase activity(GO:0007250) |
| 0.0 | 0.3 | GO:0001712 | ectoderm formation(GO:0001705) ectodermal cell fate commitment(GO:0001712) |
| 0.0 | 1.0 | GO:0010225 | response to UV-C(GO:0010225) |
| 0.0 | 0.3 | GO:0035553 | oxidative single-stranded RNA demethylation(GO:0035553) |
| 0.0 | 2.8 | GO:0048488 | synaptic vesicle endocytosis(GO:0048488) |
| 0.0 | 0.4 | GO:0035021 | negative regulation of Rac protein signal transduction(GO:0035021) |
| 0.0 | 0.4 | GO:0010992 | ubiquitin homeostasis(GO:0010992) |
| 0.0 | 0.9 | GO:0070584 | mitochondrion morphogenesis(GO:0070584) |
| 0.0 | 2.1 | GO:0051491 | positive regulation of filopodium assembly(GO:0051491) |
| 0.0 | 0.4 | GO:0010839 | negative regulation of keratinocyte proliferation(GO:0010839) |
| 0.0 | 0.2 | GO:0071475 | cellular hyperosmotic salinity response(GO:0071475) |
| 0.0 | 0.5 | GO:0048672 | positive regulation of collateral sprouting(GO:0048672) |
| 0.0 | 0.2 | GO:2000195 | negative regulation of female gonad development(GO:2000195) |
| 0.0 | 0.1 | GO:0035747 | negative regulation of glial cell apoptotic process(GO:0034351) natural killer cell chemotaxis(GO:0035747) regulation of natural killer cell chemotaxis(GO:2000501) |
| 0.0 | 0.2 | GO:0009405 | pathogenesis(GO:0009405) |
| 0.0 | 0.1 | GO:0097534 | lymphoid lineage cell migration(GO:0097534) lymphoid lineage cell migration into thymus(GO:0097535) |
| 0.0 | 0.2 | GO:0000821 | regulation of arginine metabolic process(GO:0000821) |
| 0.0 | 0.3 | GO:2000483 | negative regulation of interleukin-8 secretion(GO:2000483) |
| 0.0 | 0.5 | GO:1902857 | positive regulation of nonmotile primary cilium assembly(GO:1902857) embryonic brain development(GO:1990403) |
| 0.0 | 1.5 | GO:0044380 | protein localization to cytoskeleton(GO:0044380) |
| 0.0 | 0.5 | GO:0006620 | posttranslational protein targeting to membrane(GO:0006620) |
| 0.0 | 0.2 | GO:0043653 | mitochondrial fragmentation involved in apoptotic process(GO:0043653) |
| 0.0 | 0.4 | GO:0014850 | response to muscle activity(GO:0014850) |
| 0.0 | 0.6 | GO:0097320 | membrane tubulation(GO:0097320) |
| 0.0 | 0.4 | GO:0097150 | neuronal stem cell population maintenance(GO:0097150) |
| 0.0 | 0.9 | GO:0032008 | positive regulation of TOR signaling(GO:0032008) |
| 0.0 | 0.2 | GO:0042226 | interleukin-6 biosynthetic process(GO:0042226) |
| 0.0 | 2.2 | GO:0046324 | regulation of glucose import(GO:0046324) |
| 0.0 | 2.2 | GO:0090630 | activation of GTPase activity(GO:0090630) |
| 0.0 | 0.2 | GO:2000344 | positive regulation of acrosome reaction(GO:2000344) |
| 0.0 | 0.1 | GO:2000253 | positive regulation of feeding behavior(GO:2000253) |
| 0.0 | 0.3 | GO:0048484 | enteric nervous system development(GO:0048484) |
| 0.0 | 0.6 | GO:0000470 | maturation of LSU-rRNA(GO:0000470) |
| 0.0 | 0.4 | GO:2000269 | regulation of fibroblast apoptotic process(GO:2000269) |
| 0.0 | 0.1 | GO:0021769 | orbitofrontal cortex development(GO:0021769) motogenic signaling involved in postnatal olfactory bulb interneuron migration(GO:0021837) fibroblast growth factor receptor signaling pathway involved in orbitofrontal cortex development(GO:0035607) positive regulation of mitotic cell cycle DNA replication(GO:1903465) |
| 0.0 | 1.0 | GO:0045454 | cell redox homeostasis(GO:0045454) |
| 0.0 | 1.3 | GO:1904893 | negative regulation of JAK-STAT cascade(GO:0046426) negative regulation of STAT cascade(GO:1904893) |
| 0.0 | 0.6 | GO:0007026 | negative regulation of microtubule depolymerization(GO:0007026) |
| 0.0 | 1.2 | GO:0007157 | heterophilic cell-cell adhesion via plasma membrane cell adhesion molecules(GO:0007157) |
| 0.0 | 1.2 | GO:0042475 | odontogenesis of dentin-containing tooth(GO:0042475) |
| 0.0 | 0.3 | GO:0001553 | luteinization(GO:0001553) |
| 0.0 | 0.3 | GO:0071549 | cellular response to dexamethasone stimulus(GO:0071549) |
| 0.0 | 0.2 | GO:0046548 | retinal rod cell development(GO:0046548) |
| 0.0 | 0.1 | GO:0007527 | adult somatic muscle development(GO:0007527) |
| 0.0 | 0.4 | GO:0032212 | positive regulation of telomere maintenance via telomerase(GO:0032212) |
| 0.0 | 0.4 | GO:0032011 | ARF protein signal transduction(GO:0032011) regulation of ARF protein signal transduction(GO:0032012) |
Gene overrepresentation in cellular component category:
| Log-likelihood per target | Total log-likelihood | Term | Description |
|---|---|---|---|
| 5.1 | 25.6 | GO:0097057 | TRAF2-GSTP1 complex(GO:0097057) |
| 1.5 | 4.5 | GO:0044753 | amphisome(GO:0044753) |
| 0.7 | 2.0 | GO:0034677 | integrin alpha7-beta1 complex(GO:0034677) |
| 0.6 | 7.2 | GO:0008541 | proteasome regulatory particle, lid subcomplex(GO:0008541) |
| 0.6 | 1.7 | GO:1990630 | IRE1-RACK1-PP2A complex(GO:1990630) |
| 0.5 | 1.6 | GO:0017109 | glutamate-cysteine ligase complex(GO:0017109) |
| 0.5 | 19.5 | GO:0032839 | dendrite cytoplasm(GO:0032839) |
| 0.4 | 4.4 | GO:0044214 | spanning component of plasma membrane(GO:0044214) spanning component of membrane(GO:0089717) |
| 0.4 | 1.2 | GO:0014801 | longitudinal sarcoplasmic reticulum(GO:0014801) |
| 0.4 | 1.5 | GO:0005608 | laminin-3 complex(GO:0005608) |
| 0.3 | 1.3 | GO:1990589 | Lewy body core(GO:1990037) ATF4-CREB1 transcription factor complex(GO:1990589) ATF1-ATF4 transcription factor complex(GO:1990590) |
| 0.3 | 0.9 | GO:1990257 | piccolo-bassoon transport vesicle(GO:1990257) |
| 0.3 | 2.1 | GO:0031673 | H zone(GO:0031673) |
| 0.2 | 3.0 | GO:0019773 | proteasome core complex, alpha-subunit complex(GO:0019773) |
| 0.2 | 4.3 | GO:0030127 | COPII vesicle coat(GO:0030127) |
| 0.2 | 2.0 | GO:1990357 | terminal web(GO:1990357) |
| 0.2 | 1.2 | GO:0097513 | myosin II filament(GO:0097513) |
| 0.2 | 1.8 | GO:0031597 | cytosolic proteasome complex(GO:0031597) |
| 0.2 | 5.0 | GO:0005782 | peroxisomal matrix(GO:0005782) microbody lumen(GO:0031907) |
| 0.1 | 0.6 | GO:0070032 | synaptobrevin 2-SNAP-25-syntaxin-1a-complexin I complex(GO:0070032) synaptobrevin 2-SNAP-25-syntaxin-1a-complexin II complex(GO:0070033) |
| 0.1 | 0.9 | GO:0071986 | Ragulator complex(GO:0071986) |
| 0.1 | 5.8 | GO:0035861 | site of double-strand break(GO:0035861) |
| 0.1 | 0.4 | GO:0042584 | chromaffin granule membrane(GO:0042584) |
| 0.1 | 0.9 | GO:0033010 | paranodal junction(GO:0033010) |
| 0.1 | 0.7 | GO:0070545 | PeBoW complex(GO:0070545) |
| 0.1 | 0.2 | GO:0098855 | HCN channel complex(GO:0098855) |
| 0.1 | 1.7 | GO:0030056 | hemidesmosome(GO:0030056) |
| 0.1 | 3.6 | GO:0035371 | microtubule plus-end(GO:0035371) |
| 0.1 | 1.3 | GO:0046581 | intercellular canaliculus(GO:0046581) |
| 0.1 | 1.1 | GO:0008385 | IkappaB kinase complex(GO:0008385) |
| 0.1 | 0.8 | GO:0035631 | CD40 receptor complex(GO:0035631) |
| 0.1 | 0.4 | GO:0043293 | apoptosome(GO:0043293) |
| 0.1 | 1.0 | GO:0005952 | cAMP-dependent protein kinase complex(GO:0005952) |
| 0.1 | 0.5 | GO:0097550 | transcriptional preinitiation complex(GO:0097550) |
| 0.1 | 4.0 | GO:0000502 | proteasome complex(GO:0000502) |
| 0.0 | 0.6 | GO:0008278 | cohesin complex(GO:0008278) |
| 0.0 | 1.4 | GO:0005697 | telomerase holoenzyme complex(GO:0005697) |
| 0.0 | 0.2 | GO:0035841 | new growing cell tip(GO:0035841) |
| 0.0 | 0.2 | GO:0043564 | Ku70:Ku80 complex(GO:0043564) |
| 0.0 | 1.3 | GO:0045095 | keratin filament(GO:0045095) |
| 0.0 | 0.8 | GO:0031235 | intrinsic component of the cytoplasmic side of the plasma membrane(GO:0031235) |
| 0.0 | 0.9 | GO:1990124 | messenger ribonucleoprotein complex(GO:1990124) |
| 0.0 | 3.4 | GO:0044439 | peroxisomal membrane(GO:0005778) microbody membrane(GO:0031903) microbody part(GO:0044438) peroxisomal part(GO:0044439) |
| 0.0 | 0.3 | GO:0031313 | extrinsic component of endosome membrane(GO:0031313) |
| 0.0 | 0.4 | GO:0001520 | outer dense fiber(GO:0001520) |
| 0.0 | 2.3 | GO:0009925 | basal plasma membrane(GO:0009925) |
| 0.0 | 1.7 | GO:0009295 | nucleoid(GO:0009295) mitochondrial nucleoid(GO:0042645) |
| 0.0 | 0.2 | GO:0031523 | Myb complex(GO:0031523) |
| 0.0 | 0.3 | GO:0044754 | autolysosome(GO:0044754) |
| 0.0 | 0.1 | GO:0098592 | cytoplasmic side of apical plasma membrane(GO:0098592) |
| 0.0 | 0.8 | GO:0032588 | trans-Golgi network membrane(GO:0032588) |
| 0.0 | 1.6 | GO:0032420 | stereocilium(GO:0032420) |
| 0.0 | 0.2 | GO:0044299 | C-fiber(GO:0044299) |
| 0.0 | 12.0 | GO:0005667 | transcription factor complex(GO:0005667) |
| 0.0 | 0.2 | GO:0005883 | neurofilament(GO:0005883) |
| 0.0 | 0.8 | GO:0032391 | photoreceptor connecting cilium(GO:0032391) |
| 0.0 | 1.2 | GO:0016529 | sarcoplasmic reticulum(GO:0016529) |
| 0.0 | 3.2 | GO:0030176 | integral component of endoplasmic reticulum membrane(GO:0030176) |
| 0.0 | 0.7 | GO:0030131 | clathrin adaptor complex(GO:0030131) |
| 0.0 | 0.5 | GO:0071565 | nBAF complex(GO:0071565) |
| 0.0 | 0.4 | GO:0045334 | clathrin-coated endocytic vesicle(GO:0045334) |
| 0.0 | 0.1 | GO:0005594 | collagen type IX trimer(GO:0005594) |
| 0.0 | 0.2 | GO:0033179 | proton-transporting V-type ATPase, V0 domain(GO:0033179) |
| 0.0 | 0.4 | GO:0030134 | ER to Golgi transport vesicle(GO:0030134) |
| 0.0 | 0.1 | GO:0005796 | Golgi lumen(GO:0005796) |
| 0.0 | 0.5 | GO:0035869 | ciliary transition zone(GO:0035869) |
| 0.0 | 0.1 | GO:1990316 | ATG1/ULK1 kinase complex(GO:1990316) |
| 0.0 | 0.4 | GO:0043034 | costamere(GO:0043034) |
| 0.0 | 1.3 | GO:0030315 | T-tubule(GO:0030315) |
| 0.0 | 2.3 | GO:0001650 | fibrillar center(GO:0001650) |
| 0.0 | 0.1 | GO:0036157 | outer dynein arm(GO:0036157) |
| 0.0 | 0.4 | GO:0001533 | cornified envelope(GO:0001533) |
Gene overrepresentation in molecular function category:
| Log-likelihood per target | Total log-likelihood | Term | Description |
|---|---|---|---|
| 8.5 | 25.6 | GO:0035731 | S-nitrosoglutathione binding(GO:0035730) dinitrosyl-iron complex binding(GO:0035731) |
| 7.8 | 23.3 | GO:0004473 | malic enzyme activity(GO:0004470) malate dehydrogenase (decarboxylating) (NAD+) activity(GO:0004471) malate dehydrogenase (decarboxylating) (NADP+) activity(GO:0004473) |
| 4.6 | 18.5 | GO:0047961 | glycine N-acyltransferase activity(GO:0047961) |
| 3.2 | 12.9 | GO:0047016 | cholest-5-ene-3-beta,7-alpha-diol 3-beta-dehydrogenase activity(GO:0047016) |
| 2.5 | 12.6 | GO:0016623 | aldehyde oxidase activity(GO:0004031) oxidoreductase activity, acting on the aldehyde or oxo group of donors, oxygen as acceptor(GO:0016623) |
| 1.6 | 4.8 | GO:0030151 | molybdenum ion binding(GO:0030151) |
| 1.2 | 6.0 | GO:0004382 | guanosine-diphosphatase activity(GO:0004382) |
| 0.9 | 5.5 | GO:0004784 | superoxide dismutase activity(GO:0004784) oxidoreductase activity, acting on superoxide radicals as acceptor(GO:0016721) |
| 0.9 | 3.4 | GO:0005008 | hepatocyte growth factor-activated receptor activity(GO:0005008) |
| 0.7 | 2.2 | GO:0008127 | quercetin 2,3-dioxygenase activity(GO:0008127) |
| 0.6 | 2.4 | GO:0004937 | alpha1-adrenergic receptor activity(GO:0004937) |
| 0.5 | 1.6 | GO:0004357 | glutamate-cysteine ligase activity(GO:0004357) |
| 0.5 | 10.6 | GO:0030957 | Tat protein binding(GO:0030957) |
| 0.5 | 2.1 | GO:0050220 | prostaglandin-E synthase activity(GO:0050220) |
| 0.5 | 5.2 | GO:0003909 | DNA ligase activity(GO:0003909) DNA ligase (ATP) activity(GO:0003910) |
| 0.4 | 3.6 | GO:0071074 | eukaryotic initiation factor eIF2 binding(GO:0071074) |
| 0.4 | 1.3 | GO:0004967 | glucagon receptor activity(GO:0004967) |
| 0.4 | 1.3 | GO:1990254 | keratin filament binding(GO:1990254) |
| 0.4 | 1.6 | GO:0003998 | acylphosphatase activity(GO:0003998) |
| 0.4 | 3.4 | GO:0047134 | protein-disulfide reductase activity(GO:0047134) |
| 0.4 | 5.6 | GO:0008379 | thioredoxin peroxidase activity(GO:0008379) |
| 0.3 | 5.7 | GO:0019531 | oxalate transmembrane transporter activity(GO:0019531) |
| 0.3 | 1.5 | GO:0004925 | prolactin receptor activity(GO:0004925) |
| 0.3 | 1.2 | GO:0008109 | N-acetyllactosaminide beta-1,6-N-acetylglucosaminyltransferase activity(GO:0008109) |
| 0.3 | 1.5 | GO:0005220 | inositol 1,4,5-trisphosphate-sensitive calcium-release channel activity(GO:0005220) |
| 0.3 | 0.8 | GO:0070540 | stearic acid binding(GO:0070540) |
| 0.2 | 0.7 | GO:0034632 | retinol transporter activity(GO:0034632) |
| 0.2 | 2.0 | GO:0004565 | beta-galactosidase activity(GO:0004565) |
| 0.2 | 0.9 | GO:0034739 | histone deacetylase activity (H4-K16 specific)(GO:0034739) |
| 0.2 | 6.1 | GO:0070530 | K63-linked polyubiquitin binding(GO:0070530) |
| 0.2 | 0.6 | GO:0031531 | thyrotropin-releasing hormone receptor binding(GO:0031531) |
| 0.2 | 5.1 | GO:0097602 | cullin family protein binding(GO:0097602) |
| 0.2 | 1.2 | GO:0016401 | palmitoyl-CoA oxidase activity(GO:0016401) |
| 0.2 | 1.0 | GO:0045322 | unmethylated CpG binding(GO:0045322) |
| 0.2 | 1.4 | GO:0016286 | small conductance calcium-activated potassium channel activity(GO:0016286) |
| 0.2 | 2.0 | GO:0039706 | co-receptor binding(GO:0039706) |
| 0.2 | 0.6 | GO:0004816 | asparagine-tRNA ligase activity(GO:0004816) |
| 0.2 | 0.5 | GO:0031798 | type 1 metabotropic glutamate receptor binding(GO:0031798) RNA polymerase II transcription factor activity, estrogen-activated sequence-specific DNA binding(GO:0038052) |
| 0.1 | 2.2 | GO:0019215 | intermediate filament binding(GO:0019215) |
| 0.1 | 1.5 | GO:0008430 | selenium binding(GO:0008430) |
| 0.1 | 2.0 | GO:0019911 | structural constituent of myelin sheath(GO:0019911) |
| 0.1 | 0.5 | GO:0005146 | leukemia inhibitory factor receptor binding(GO:0005146) |
| 0.1 | 0.4 | GO:0016005 | phospholipase A2 activator activity(GO:0016005) |
| 0.1 | 3.2 | GO:0034185 | apolipoprotein binding(GO:0034185) |
| 0.1 | 0.8 | GO:0034431 | endopolyphosphatase activity(GO:0000298) diphosphoinositol-polyphosphate diphosphatase activity(GO:0008486) bis(5'-adenosyl)-hexaphosphatase activity(GO:0034431) bis(5'-adenosyl)-pentaphosphatase activity(GO:0034432) |
| 0.1 | 3.0 | GO:0004298 | threonine-type endopeptidase activity(GO:0004298) threonine-type peptidase activity(GO:0070003) |
| 0.1 | 0.9 | GO:0005534 | galactose binding(GO:0005534) |
| 0.1 | 0.9 | GO:0004416 | hydroxyacylglutathione hydrolase activity(GO:0004416) |
| 0.1 | 1.4 | GO:0004887 | thyroid hormone receptor activity(GO:0004887) |
| 0.1 | 3.6 | GO:0070330 | aromatase activity(GO:0070330) |
| 0.1 | 0.7 | GO:0004991 | parathyroid hormone receptor activity(GO:0004991) |
| 0.1 | 1.6 | GO:0001011 | transcription factor activity, sequence-specific DNA binding, RNA polymerase recruiting(GO:0001011) transcription factor activity, TFIIB-class binding(GO:0001087) |
| 0.1 | 0.3 | GO:0005308 | creatine transmembrane transporter activity(GO:0005308) |
| 0.1 | 2.4 | GO:0043295 | glutathione binding(GO:0043295) oligopeptide binding(GO:1900750) |
| 0.1 | 0.3 | GO:0001962 | alpha-1,3-galactosyltransferase activity(GO:0001962) |
| 0.1 | 0.9 | GO:0045504 | dynein heavy chain binding(GO:0045504) |
| 0.1 | 0.8 | GO:0015252 | hydrogen ion channel activity(GO:0015252) |
| 0.1 | 1.2 | GO:0031996 | thioesterase binding(GO:0031996) |
| 0.1 | 0.2 | GO:0005137 | interleukin-5 receptor binding(GO:0005137) |
| 0.1 | 1.3 | GO:0043522 | leucine zipper domain binding(GO:0043522) |
| 0.1 | 0.3 | GO:0030144 | alpha-1,6-mannosylglycoprotein 6-beta-N-acetylglucosaminyltransferase activity(GO:0030144) |
| 0.1 | 1.2 | GO:0030898 | actin-dependent ATPase activity(GO:0030898) |
| 0.1 | 4.2 | GO:0043531 | ADP binding(GO:0043531) |
| 0.1 | 1.0 | GO:0008603 | cAMP-dependent protein kinase regulator activity(GO:0008603) |
| 0.1 | 3.0 | GO:0050750 | low-density lipoprotein particle receptor binding(GO:0050750) |
| 0.1 | 0.1 | GO:0004499 | N,N-dimethylaniline monooxygenase activity(GO:0004499) |
| 0.1 | 4.7 | GO:0051287 | NAD binding(GO:0051287) |
| 0.1 | 1.5 | GO:0008253 | 5'-nucleotidase activity(GO:0008253) |
| 0.1 | 2.0 | GO:0015238 | drug transmembrane transporter activity(GO:0015238) |
| 0.1 | 0.4 | GO:0036402 | proteasome-activating ATPase activity(GO:0036402) |
| 0.1 | 0.9 | GO:0035925 | mRNA 3'-UTR AU-rich region binding(GO:0035925) |
| 0.1 | 1.5 | GO:0005388 | calcium-transporting ATPase activity(GO:0005388) |
| 0.1 | 0.2 | GO:0031727 | CCR2 chemokine receptor binding(GO:0031727) |
| 0.1 | 0.7 | GO:0097200 | cysteine-type endopeptidase activity involved in execution phase of apoptosis(GO:0097200) |
| 0.1 | 0.2 | GO:0050253 | retinyl-palmitate esterase activity(GO:0050253) |
| 0.1 | 0.4 | GO:0030549 | acetylcholine receptor activator activity(GO:0030549) |
| 0.1 | 1.3 | GO:0005212 | structural constituent of eye lens(GO:0005212) |
| 0.0 | 0.4 | GO:0000150 | recombinase activity(GO:0000150) |
| 0.0 | 2.0 | GO:0017134 | fibroblast growth factor binding(GO:0017134) |
| 0.0 | 0.2 | GO:0005250 | A-type (transient outward) potassium channel activity(GO:0005250) |
| 0.0 | 0.4 | GO:0004931 | extracellular ATP-gated cation channel activity(GO:0004931) ATP-gated ion channel activity(GO:0035381) |
| 0.0 | 0.6 | GO:0019855 | calcium channel inhibitor activity(GO:0019855) |
| 0.0 | 2.8 | GO:0070888 | E-box binding(GO:0070888) |
| 0.0 | 0.3 | GO:0035515 | oxidative RNA demethylase activity(GO:0035515) |
| 0.0 | 0.5 | GO:0019957 | C-C chemokine binding(GO:0019957) |
| 0.0 | 1.7 | GO:0030506 | ankyrin binding(GO:0030506) |
| 0.0 | 0.2 | GO:0005222 | intracellular cAMP activated cation channel activity(GO:0005222) |
| 0.0 | 0.5 | GO:0019841 | retinol binding(GO:0019841) |
| 0.0 | 2.7 | GO:0016209 | antioxidant activity(GO:0016209) |
| 0.0 | 1.0 | GO:0030247 | pattern binding(GO:0001871) polysaccharide binding(GO:0030247) |
| 0.0 | 0.2 | GO:0047288 | monosialoganglioside sialyltransferase activity(GO:0047288) |
| 0.0 | 0.4 | GO:0004017 | adenylate kinase activity(GO:0004017) |
| 0.0 | 0.9 | GO:0008171 | O-methyltransferase activity(GO:0008171) |
| 0.0 | 0.1 | GO:0046979 | TAP1 binding(GO:0046978) TAP2 binding(GO:0046979) |
| 0.0 | 4.1 | GO:0008013 | beta-catenin binding(GO:0008013) |
| 0.0 | 0.6 | GO:0004622 | lysophospholipase activity(GO:0004622) |
| 0.0 | 3.4 | GO:0042626 | ATPase activity, coupled to transmembrane movement of substances(GO:0042626) |
| 0.0 | 0.7 | GO:0004697 | protein kinase C activity(GO:0004697) |
| 0.0 | 0.7 | GO:0070628 | proteasome binding(GO:0070628) |
| 0.0 | 4.9 | GO:0000149 | SNARE binding(GO:0000149) |
| 0.0 | 5.1 | GO:0001046 | core promoter sequence-specific DNA binding(GO:0001046) |
| 0.0 | 0.1 | GO:0008273 | calcium, potassium:sodium antiporter activity(GO:0008273) |
| 0.0 | 1.2 | GO:0004683 | calmodulin-dependent protein kinase activity(GO:0004683) |
| 0.0 | 1.1 | GO:0008395 | steroid hydroxylase activity(GO:0008395) |
| 0.0 | 0.1 | GO:0043559 | insulin binding(GO:0043559) |
| 0.0 | 0.1 | GO:0071532 | ankyrin repeat binding(GO:0071532) |
| 0.0 | 0.4 | GO:0003993 | acid phosphatase activity(GO:0003993) |
| 0.0 | 0.7 | GO:0005337 | nucleoside transmembrane transporter activity(GO:0005337) |
| 0.0 | 0.1 | GO:0004342 | glucosamine-6-phosphate deaminase activity(GO:0004342) |
| 0.0 | 0.2 | GO:0051575 | 5'-deoxyribose-5-phosphate lyase activity(GO:0051575) |
| 0.0 | 0.7 | GO:0030742 | GTP-dependent protein binding(GO:0030742) |
| 0.0 | 6.1 | GO:0048037 | cofactor binding(GO:0048037) |
| 0.0 | 1.2 | GO:0008138 | protein tyrosine/serine/threonine phosphatase activity(GO:0008138) |
| 0.0 | 3.1 | GO:0005178 | integrin binding(GO:0005178) |
| 0.0 | 0.7 | GO:0005385 | zinc ion transmembrane transporter activity(GO:0005385) |
| 0.0 | 5.4 | GO:0001227 | transcriptional repressor activity, RNA polymerase II transcription regulatory region sequence-specific binding(GO:0001227) |
| 0.0 | 0.2 | GO:0015174 | basic amino acid transmembrane transporter activity(GO:0015174) |
| 0.0 | 0.1 | GO:0005176 | ErbB-2 class receptor binding(GO:0005176) |
| 0.0 | 1.1 | GO:0001784 | phosphotyrosine binding(GO:0001784) |
| 0.0 | 1.1 | GO:0004722 | protein serine/threonine phosphatase activity(GO:0004722) |
| 0.0 | 0.1 | GO:0017040 | ceramidase activity(GO:0017040) |
| 0.0 | 0.4 | GO:0043395 | heparan sulfate proteoglycan binding(GO:0043395) |
| 0.0 | 0.2 | GO:0015643 | toxic substance binding(GO:0015643) |
| 0.0 | 0.9 | GO:0046875 | ephrin receptor binding(GO:0046875) |
| 0.0 | 0.1 | GO:1901612 | cardiolipin binding(GO:1901612) |
| 0.0 | 0.9 | GO:0032266 | phosphatidylinositol-3-phosphate binding(GO:0032266) |
| 0.0 | 0.5 | GO:0050780 | dopamine receptor binding(GO:0050780) |
| 0.0 | 4.3 | GO:0008017 | microtubule binding(GO:0008017) |
| 0.0 | 0.5 | GO:0005246 | calcium channel regulator activity(GO:0005246) |
| 0.0 | 0.3 | GO:0008195 | phosphatidate phosphatase activity(GO:0008195) |
| 0.0 | 0.9 | GO:0017022 | myosin binding(GO:0017022) |
| 0.0 | 1.1 | GO:0032947 | protein complex scaffold(GO:0032947) |
| 0.0 | 0.3 | GO:0005545 | 1-phosphatidylinositol binding(GO:0005545) |
Gene overrepresentation in curated gene sets: canonical pathways category:
| Log-likelihood per target | Total log-likelihood | Term | Description |
|---|---|---|---|
| 0.1 | 1.7 | PID FRA PATHWAY | Validated transcriptional targets of AP1 family members Fra1 and Fra2 |
| 0.1 | 7.3 | PID HNF3A PATHWAY | FOXA1 transcription factor network |
| 0.1 | 5.1 | PID TCR CALCIUM PATHWAY | Calcium signaling in the CD4+ TCR pathway |
| 0.1 | 2.2 | PID CXCR4 PATHWAY | CXCR4-mediated signaling events |
| 0.1 | 1.5 | PID INTEGRIN4 PATHWAY | Alpha6 beta4 integrin-ligand interactions |
| 0.1 | 5.0 | PID IL1 PATHWAY | IL1-mediated signaling events |
| 0.1 | 1.2 | PID LYSOPHOSPHOLIPID PATHWAY | LPA receptor mediated events |
| 0.1 | 2.7 | ST WNT CA2 CYCLIC GMP PATHWAY | Wnt/Ca2+/cyclic GMP signaling. |
| 0.1 | 3.4 | PID ARF6 PATHWAY | Arf6 signaling events |
| 0.1 | 1.4 | PID AP1 PATHWAY | AP-1 transcription factor network |
| 0.1 | 7.1 | PID AR PATHWAY | Coregulation of Androgen receptor activity |
| 0.0 | 1.0 | ST G ALPHA S PATHWAY | G alpha s Pathway |
| 0.0 | 1.1 | PID INTEGRIN CS PATHWAY | Integrin family cell surface interactions |
| 0.0 | 0.9 | PID HDAC CLASSIII PATHWAY | Signaling events mediated by HDAC Class III |
| 0.0 | 0.3 | PID ALK2 PATHWAY | ALK2 signaling events |
| 0.0 | 0.7 | SA CASPASE CASCADE | Apoptosis is mediated by caspases, cysteine proteases arranged in a proteolytic cascade. |
| 0.0 | 1.2 | PID CD40 PATHWAY | CD40/CD40L signaling |
| 0.0 | 1.1 | PID TAP63 PATHWAY | Validated transcriptional targets of TAp63 isoforms |
| 0.0 | 1.4 | PID TELOMERASE PATHWAY | Regulation of Telomerase |
| 0.0 | 1.4 | PID ERBB4 PATHWAY | ErbB4 signaling events |
| 0.0 | 0.4 | ST TUMOR NECROSIS FACTOR PATHWAY | Tumor Necrosis Factor Pathway. |
| 0.0 | 0.2 | PID IL5 PATHWAY | IL5-mediated signaling events |
| 0.0 | 0.9 | PID P73PATHWAY | p73 transcription factor network |
| 0.0 | 1.2 | PID TRKR PATHWAY | Neurotrophic factor-mediated Trk receptor signaling |
| 0.0 | 0.7 | PID HNF3B PATHWAY | FOXA2 and FOXA3 transcription factor networks |
| 0.0 | 0.2 | PID LPA4 PATHWAY | LPA4-mediated signaling events |
Gene overrepresentation in curated gene sets: REACTOME pathways category:
| Log-likelihood per target | Total log-likelihood | Term | Description |
|---|---|---|---|
| 0.9 | 14.0 | REACTOME SYNTHESIS OF BILE ACIDS AND BILE SALTS VIA 24 HYDROXYCHOLESTEROL | Genes involved in Synthesis of bile acids and bile salts via 24-hydroxycholesterol |
| 0.5 | 43.9 | REACTOME PHASE II CONJUGATION | Genes involved in Phase II conjugation |
| 0.4 | 7.5 | REACTOME ANTIGEN PRESENTATION FOLDING ASSEMBLY AND PEPTIDE LOADING OF CLASS I MHC | Genes involved in Antigen Presentation: Folding, assembly and peptide loading of class I MHC |
| 0.3 | 4.5 | REACTOME NFKB IS ACTIVATED AND SIGNALS SURVIVAL | Genes involved in NF-kB is activated and signals survival |
| 0.2 | 12.3 | REACTOME AUTODEGRADATION OF THE E3 UBIQUITIN LIGASE COP1 | Genes involved in Autodegradation of the E3 ubiquitin ligase COP1 |
| 0.2 | 1.3 | REACTOME ACTIVATION OF CHAPERONE GENES BY ATF6 ALPHA | Genes involved in Activation of Chaperone Genes by ATF6-alpha |
| 0.1 | 6.8 | REACTOME SEMA4D IN SEMAPHORIN SIGNALING | Genes involved in Sema4D in semaphorin signaling |
| 0.1 | 1.5 | REACTOME ELEVATION OF CYTOSOLIC CA2 LEVELS | Genes involved in Elevation of cytosolic Ca2+ levels |
| 0.1 | 24.5 | REACTOME PPARA ACTIVATES GENE EXPRESSION | Genes involved in PPARA Activates Gene Expression |
| 0.1 | 1.1 | REACTOME IRAK1 RECRUITS IKK COMPLEX | Genes involved in IRAK1 recruits IKK complex |
| 0.1 | 3.2 | REACTOME ABCA TRANSPORTERS IN LIPID HOMEOSTASIS | Genes involved in ABCA transporters in lipid homeostasis |
| 0.1 | 1.2 | REACTOME PLATELET CALCIUM HOMEOSTASIS | Genes involved in Platelet calcium homeostasis |
| 0.1 | 0.9 | REACTOME ORGANIC CATION ANION ZWITTERION TRANSPORT | Genes involved in Organic cation/anion/zwitterion transport |
| 0.1 | 1.2 | REACTOME ACTIVATION OF IRF3 IRF7 MEDIATED BY TBK1 IKK EPSILON | Genes involved in Activation of IRF3/IRF7 mediated by TBK1/IKK epsilon |
| 0.1 | 4.8 | REACTOME METABOLISM OF VITAMINS AND COFACTORS | Genes involved in Metabolism of vitamins and cofactors |
| 0.1 | 0.7 | REACTOME ETHANOL OXIDATION | Genes involved in Ethanol oxidation |
| 0.1 | 2.4 | REACTOME AMINE LIGAND BINDING RECEPTORS | Genes involved in Amine ligand-binding receptors |
| 0.1 | 1.7 | REACTOME PROLACTIN RECEPTOR SIGNALING | Genes involved in Prolactin receptor signaling |
| 0.1 | 0.6 | REACTOME ACETYLCHOLINE NEUROTRANSMITTER RELEASE CYCLE | Genes involved in Acetylcholine Neurotransmitter Release Cycle |
| 0.1 | 0.2 | REACTOME ADENYLATE CYCLASE ACTIVATING PATHWAY | Genes involved in Adenylate cyclase activating pathway |
| 0.1 | 0.9 | REACTOME SYNTHESIS OF PIPS AT THE LATE ENDOSOME MEMBRANE | Genes involved in Synthesis of PIPs at the late endosome membrane |
| 0.0 | 0.4 | REACTOME ACTIVATION OF NF KAPPAB IN B CELLS | Genes involved in Activation of NF-kappaB in B Cells |
| 0.0 | 2.1 | REACTOME GLYCOSPHINGOLIPID METABOLISM | Genes involved in Glycosphingolipid metabolism |
| 0.0 | 5.3 | REACTOME TRANSPORT OF INORGANIC CATIONS ANIONS AND AMINO ACIDS OLIGOPEPTIDES | Genes involved in Transport of inorganic cations/anions and amino acids/oligopeptides |
| 0.0 | 1.0 | REACTOME PKA MEDIATED PHOSPHORYLATION OF CREB | Genes involved in PKA-mediated phosphorylation of CREB |
| 0.0 | 0.6 | REACTOME POST CHAPERONIN TUBULIN FOLDING PATHWAY | Genes involved in Post-chaperonin tubulin folding pathway |
| 0.0 | 2.5 | REACTOME NUCLEAR RECEPTOR TRANSCRIPTION PATHWAY | Genes involved in Nuclear Receptor transcription pathway |
| 0.0 | 0.7 | REACTOME ZINC TRANSPORTERS | Genes involved in Zinc transporters |
| 0.0 | 1.6 | REACTOME MYOGENESIS | Genes involved in Myogenesis |
| 0.0 | 0.4 | REACTOME ROLE OF DCC IN REGULATING APOPTOSIS | Genes involved in Role of DCC in regulating apoptosis |
| 0.0 | 1.1 | REACTOME MITOCHONDRIAL PROTEIN IMPORT | Genes involved in Mitochondrial Protein Import |
| 0.0 | 0.5 | REACTOME PLC BETA MEDIATED EVENTS | Genes involved in PLC beta mediated events |
| 0.0 | 0.7 | REACTOME TRANSPORT OF VITAMINS NUCLEOSIDES AND RELATED MOLECULES | Genes involved in Transport of vitamins, nucleosides, and related molecules |
| 0.0 | 0.3 | REACTOME SYNTHESIS OF PE | Genes involved in Synthesis of PE |
| 0.0 | 1.6 | REACTOME POTASSIUM CHANNELS | Genes involved in Potassium Channels |
| 0.0 | 0.4 | REACTOME MEIOTIC RECOMBINATION | Genes involved in Meiotic Recombination |
| 0.0 | 0.3 | REACTOME SYNTHESIS SECRETION AND INACTIVATION OF GIP | Genes involved in Synthesis, Secretion, and Inactivation of Glucose-dependent Insulinotropic Polypeptide (GIP) |
| 0.0 | 0.6 | REACTOME CHEMOKINE RECEPTORS BIND CHEMOKINES | Genes involved in Chemokine receptors bind chemokines |
| 0.0 | 0.2 | REACTOME INTEGRATION OF PROVIRUS | Genes involved in Integration of provirus |