Project
avrg: GSE58827: Dynamics of the Mouse Liver
Navigation
Downloads
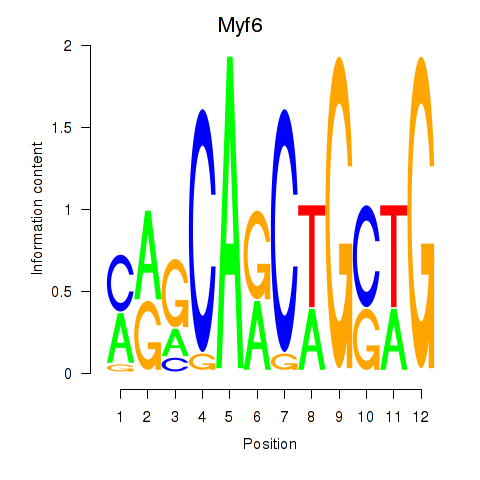
Results for Myf6
Z-value: 7.51
Motif logo
Transcription factors associated with Myf6
| Gene Symbol | Gene ID | Gene Info |
|---|---|---|
|
Myf6
|
ENSMUSG00000035923.5 | Myf6 |
Activity-expression correlation:
| Gene | Promoter | Pearson corr. coef. | P-value | Plot |
|---|---|---|---|---|
| Myf6 | mm39_v1_chr10_-_107330580_107330603 | -0.18 | 3.0e-01 | Click! |
Activity profile of Myf6 motif
Sorted Z-values of Myf6 motif
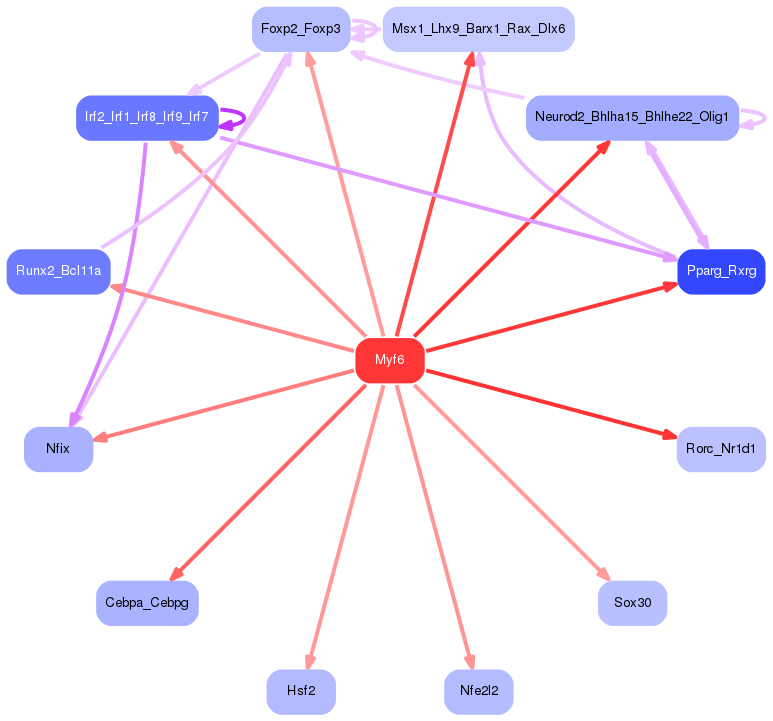
Network of associatons between targets according to the STRING database.

First level regulatory network of Myf6
| Promoter | Score | Transcript | Gene | Gene Info |
|---|---|---|---|---|
| chr4_-_60777462 | 68.50 |
ENSMUST00000211875.2
|
Mup22
|
major urinary protein 22 |
| chr4_-_60377932 | 66.62 |
ENSMUST00000107506.9
ENSMUST00000122381.8 ENSMUST00000118759.8 ENSMUST00000132829.3 |
Mup9
|
major urinary protein 9 |
| chr4_-_61259997 | 64.07 |
ENSMUST00000071005.9
ENSMUST00000075206.12 |
Mup14
|
major urinary protein 14 |
| chr4_-_60070411 | 61.55 |
ENSMUST00000079697.10
ENSMUST00000125282.2 ENSMUST00000166098.8 |
Mup7
|
major urinary protein 7 |
| chr4_-_60618357 | 61.47 |
ENSMUST00000084544.5
ENSMUST00000098046.10 |
Mup11
|
major urinary protein 11 |
| chr4_-_60139857 | 60.99 |
ENSMUST00000107490.5
ENSMUST00000074700.9 |
Mup2
|
major urinary protein 2 |
| chr4_-_60222580 | 59.80 |
ENSMUST00000095058.5
ENSMUST00000163931.8 |
Mup8
|
major urinary protein 8 |
| chr4_-_61259801 | 59.09 |
ENSMUST00000125461.8
|
Mup14
|
major urinary protein 14 |
| chr4_-_61592331 | 58.18 |
ENSMUST00000098040.4
|
Mup18
|
major urinary protein 18 |
| chr4_-_60457902 | 55.43 |
ENSMUST00000084548.11
ENSMUST00000103012.10 ENSMUST00000107499.4 |
Mup1
|
major urinary protein 1 |
| chr10_+_87696339 | 54.52 |
ENSMUST00000121161.8
|
Igf1
|
insulin-like growth factor 1 |
| chr4_-_61437704 | 51.56 |
ENSMUST00000095051.6
ENSMUST00000107483.8 |
Mup16
|
major urinary protein 16 |
| chr4_-_60697274 | 50.40 |
ENSMUST00000117932.2
|
Mup12
|
major urinary protein 12 |
| chr10_-_128796834 | 36.18 |
ENSMUST00000026398.5
|
Mettl7b
|
methyltransferase like 7B |
| chr10_+_87695886 | 35.61 |
ENSMUST00000062862.13
|
Igf1
|
insulin-like growth factor 1 |
| chr7_+_26821266 | 30.86 |
ENSMUST00000206552.2
|
Cyp2f2
|
cytochrome P450, family 2, subfamily f, polypeptide 2 |
| chr7_+_51528715 | 28.75 |
ENSMUST00000051912.13
|
Gas2
|
growth arrest specific 2 |
| chr7_+_51528788 | 25.88 |
ENSMUST00000107591.9
|
Gas2
|
growth arrest specific 2 |
| chr15_-_3612078 | 25.32 |
ENSMUST00000161770.2
|
Ghr
|
growth hormone receptor |
| chr7_-_114162125 | 23.72 |
ENSMUST00000211506.2
ENSMUST00000119712.8 ENSMUST00000032908.15 |
Cyp2r1
|
cytochrome P450, family 2, subfamily r, polypeptide 1 |
| chr15_+_76582372 | 22.84 |
ENSMUST00000229140.2
|
Gpt
|
glutamic pyruvic transaminase, soluble |
| chr17_-_34219225 | 22.15 |
ENSMUST00000238098.2
ENSMUST00000087189.7 ENSMUST00000173075.3 ENSMUST00000172912.8 ENSMUST00000236740.2 ENSMUST00000025181.18 |
H2-K1
|
histocompatibility 2, K1, K region |
| chr11_+_99764215 | 21.87 |
ENSMUST00000093936.5
|
Krtap9-1
|
keratin associated protein 9-1 |
| chr10_+_127702326 | 20.98 |
ENSMUST00000092058.4
|
Rdh16f2
|
RDH16 family member 2 |
| chr1_-_121255753 | 18.98 |
ENSMUST00000003818.14
|
Insig2
|
insulin induced gene 2 |
| chr2_+_34661982 | 17.19 |
ENSMUST00000028222.13
ENSMUST00000100171.3 |
Hspa5
|
heat shock protein 5 |
| chr1_-_180023467 | 16.43 |
ENSMUST00000161746.2
ENSMUST00000160879.7 |
Coq8a
|
coenzyme Q8A |
| chr7_-_140856642 | 16.40 |
ENSMUST00000080654.7
ENSMUST00000167263.9 |
Cdhr5
|
cadherin-related family member 5 |
| chr14_+_66205932 | 16.05 |
ENSMUST00000022616.14
|
Clu
|
clusterin |
| chr1_-_180023518 | 15.91 |
ENSMUST00000162769.8
ENSMUST00000161379.2 ENSMUST00000027766.13 ENSMUST00000161814.8 |
Coq8a
|
coenzyme Q8A |
| chr10_+_127637015 | 15.88 |
ENSMUST00000071646.2
|
Rdh16
|
retinol dehydrogenase 16 |
| chr15_-_3612628 | 15.21 |
ENSMUST00000110698.9
|
Ghr
|
growth hormone receptor |
| chr1_-_121255503 | 15.06 |
ENSMUST00000160688.2
|
Insig2
|
insulin induced gene 2 |
| chr15_+_88703786 | 14.95 |
ENSMUST00000024042.5
|
Creld2
|
cysteine-rich with EGF-like domains 2 |
| chr9_-_43151179 | 14.27 |
ENSMUST00000034512.7
|
Oaf
|
out at first homolog |
| chr15_-_89258012 | 14.24 |
ENSMUST00000167643.4
|
Sco2
|
SCO2 cytochrome c oxidase assembly protein |
| chr16_-_46317135 | 14.16 |
ENSMUST00000149901.2
ENSMUST00000096052.9 |
Nectin3
|
nectin cell adhesion molecule 3 |
| chr15_-_89258034 | 13.67 |
ENSMUST00000228977.2
|
Sco2
|
SCO2 cytochrome c oxidase assembly protein |
| chr17_+_35539505 | 13.39 |
ENSMUST00000105041.10
ENSMUST00000073208.6 |
H2-Q1
|
histocompatibility 2, Q region locus 1 |
| chr7_-_12732067 | 13.36 |
ENSMUST00000032539.14
ENSMUST00000120903.8 |
Slc27a5
|
solute carrier family 27 (fatty acid transporter), member 5 |
| chr18_+_60936910 | 13.28 |
ENSMUST00000097563.9
ENSMUST00000050487.16 ENSMUST00000167610.2 |
Cd74
|
CD74 antigen (invariant polypeptide of major histocompatibility complex, class II antigen-associated) |
| chr11_+_99770013 | 13.04 |
ENSMUST00000078442.4
|
Gm11567
|
predicted gene 11567 |
| chr15_-_3612703 | 12.73 |
ENSMUST00000069451.11
|
Ghr
|
growth hormone receptor |
| chr7_-_12731594 | 12.66 |
ENSMUST00000133977.3
|
Slc27a5
|
solute carrier family 27 (fatty acid transporter), member 5 |
| chr10_+_75729237 | 12.22 |
ENSMUST00000009236.6
ENSMUST00000217811.2 |
Derl3
|
Der1-like domain family, member 3 |
| chr14_+_66208613 | 12.19 |
ENSMUST00000144619.2
|
Clu
|
clusterin |
| chr6_-_138013901 | 12.08 |
ENSMUST00000150278.3
|
Slc15a5
|
solute carrier family 15, member 5 |
| chr12_+_108300599 | 11.91 |
ENSMUST00000021684.6
|
Cyp46a1
|
cytochrome P450, family 46, subfamily a, polypeptide 1 |
| chr17_-_57535003 | 11.71 |
ENSMUST00000177046.2
ENSMUST00000024988.15 |
C3
|
complement component 3 |
| chr6_+_72575458 | 11.64 |
ENSMUST00000070597.13
ENSMUST00000176364.8 ENSMUST00000176168.3 |
Retsat
|
retinol saturase (all trans retinol 13,14 reductase) |
| chr8_-_95422851 | 11.60 |
ENSMUST00000034227.6
|
Pllp
|
plasma membrane proteolipid |
| chr3_+_94280101 | 11.47 |
ENSMUST00000029795.10
|
Rorc
|
RAR-related orphan receptor gamma |
| chr16_+_91066602 | 11.15 |
ENSMUST00000056882.7
|
Olig1
|
oligodendrocyte transcription factor 1 |
| chr1_+_167426019 | 11.01 |
ENSMUST00000111386.8
ENSMUST00000111384.8 |
Rxrg
|
retinoid X receptor gamma |
| chr17_+_35482063 | 10.96 |
ENSMUST00000172503.3
|
H2-D1
|
histocompatibility 2, D region locus 1 |
| chr11_+_99755302 | 10.78 |
ENSMUST00000092694.4
|
Gm11559
|
predicted gene 11559 |
| chr1_+_72863641 | 10.68 |
ENSMUST00000047328.11
|
Igfbp2
|
insulin-like growth factor binding protein 2 |
| chr17_+_35481702 | 10.51 |
ENSMUST00000172785.8
|
H2-D1
|
histocompatibility 2, D region locus 1 |
| chr4_+_133280680 | 10.30 |
ENSMUST00000042706.3
|
Nr0b2
|
nuclear receptor subfamily 0, group B, member 2 |
| chr17_-_33166346 | 10.15 |
ENSMUST00000139353.8
|
Cyp4f13
|
cytochrome P450, family 4, subfamily f, polypeptide 13 |
| chr19_+_26582450 | 9.99 |
ENSMUST00000176769.9
ENSMUST00000208163.2 ENSMUST00000025862.15 ENSMUST00000176030.8 |
Smarca2
|
SWI/SNF related, matrix associated, actin dependent regulator of chromatin, subfamily a, member 2 |
| chr4_-_124744266 | 9.59 |
ENSMUST00000137769.3
|
1110065P20Rik
|
RIKEN cDNA 1110065P20 gene |
| chr6_+_6863769 | 9.52 |
ENSMUST00000031768.8
|
Dlx6
|
distal-less homeobox 6 |
| chr4_-_124744454 | 9.49 |
ENSMUST00000125776.8
ENSMUST00000163946.2 ENSMUST00000106190.10 |
1110065P20Rik
|
RIKEN cDNA 1110065P20 gene |
| chr6_-_120271520 | 9.38 |
ENSMUST00000057283.8
ENSMUST00000212457.2 |
B4galnt3
|
beta-1,4-N-acetyl-galactosaminyl transferase 3 |
| chr16_-_20440005 | 9.34 |
ENSMUST00000052939.4
|
Camk2n2
|
calcium/calmodulin-dependent protein kinase II inhibitor 2 |
| chr13_+_64309675 | 9.30 |
ENSMUST00000021929.10
|
Habp4
|
hyaluronic acid binding protein 4 |
| chr6_-_21851827 | 9.23 |
ENSMUST00000202353.2
ENSMUST00000134635.2 ENSMUST00000123116.8 ENSMUST00000120965.8 ENSMUST00000143531.2 |
Tspan12
|
tetraspanin 12 |
| chr7_+_24181416 | 9.20 |
ENSMUST00000068023.8
|
Cadm4
|
cell adhesion molecule 4 |
| chr4_+_43631935 | 9.16 |
ENSMUST00000030191.15
|
Npr2
|
natriuretic peptide receptor 2 |
| chr16_-_46317318 | 9.13 |
ENSMUST00000023335.13
ENSMUST00000023334.15 |
Nectin3
|
nectin cell adhesion molecule 3 |
| chr6_+_90527762 | 8.83 |
ENSMUST00000130418.8
ENSMUST00000032175.11 ENSMUST00000203111.2 |
Aldh1l1
|
aldehyde dehydrogenase 1 family, member L1 |
| chr17_+_87590308 | 8.66 |
ENSMUST00000041110.12
ENSMUST00000125875.8 |
Ttc7
|
tetratricopeptide repeat domain 7 |
| chr5_+_87148697 | 8.65 |
ENSMUST00000031186.9
|
Ugt2b35
|
UDP glucuronosyltransferase 2 family, polypeptide B35 |
| chr8_+_13209141 | 8.60 |
ENSMUST00000033824.8
|
Lamp1
|
lysosomal-associated membrane protein 1 |
| chr17_+_26332260 | 8.59 |
ENSMUST00000235821.2
ENSMUST00000025010.14 ENSMUST00000237058.2 |
Pgap6
|
post-glycosylphosphatidylinositol attachment to proteins 6 |
| chr1_-_133849131 | 8.56 |
ENSMUST00000048432.6
|
Prelp
|
proline arginine-rich end leucine-rich repeat |
| chr2_+_25318642 | 8.55 |
ENSMUST00000102919.4
|
Abca2
|
ATP-binding cassette, sub-family A (ABC1), member 2 |
| chr4_+_115375461 | 8.51 |
ENSMUST00000058785.10
ENSMUST00000094886.4 |
Cyp4a10
|
cytochrome P450, family 4, subfamily a, polypeptide 10 |
| chr17_-_33166362 | 8.46 |
ENSMUST00000234083.2
ENSMUST00000075253.13 |
Cyp4f13
|
cytochrome P450, family 4, subfamily f, polypeptide 13 |
| chr19_+_7034149 | 8.36 |
ENSMUST00000040261.7
|
Macrod1
|
mono-ADP ribosylhydrolase 1 |
| chr19_-_6117815 | 8.36 |
ENSMUST00000162575.8
ENSMUST00000159084.8 ENSMUST00000161718.8 ENSMUST00000162810.8 ENSMUST00000025713.12 ENSMUST00000113543.9 ENSMUST00000160417.8 ENSMUST00000161528.2 |
Tm7sf2
|
transmembrane 7 superfamily member 2 |
| chr6_-_47790272 | 8.32 |
ENSMUST00000077290.9
|
Pdia4
|
protein disulfide isomerase associated 4 |
| chr1_+_88022776 | 8.26 |
ENSMUST00000150634.8
ENSMUST00000058237.14 |
Ugt1a7c
|
UDP glucuronosyltransferase 1 family, polypeptide A7C |
| chr10_-_93375832 | 8.21 |
ENSMUST00000016034.3
|
Amdhd1
|
amidohydrolase domain containing 1 |
| chr16_+_17884267 | 8.06 |
ENSMUST00000151266.8
ENSMUST00000066027.14 ENSMUST00000155387.8 |
Dgcr6
|
DiGeorge syndrome critical region gene 6 |
| chr4_+_135648041 | 8.04 |
ENSMUST00000030434.5
|
Fuca1
|
fucosidase, alpha-L- 1, tissue |
| chr2_-_26494277 | 7.94 |
ENSMUST00000028286.12
|
Agpat2
|
1-acylglycerol-3-phosphate O-acyltransferase 2 (lysophosphatidic acid acyltransferase, beta) |
| chr7_+_34818709 | 7.76 |
ENSMUST00000205391.2
ENSMUST00000042985.11 |
Cebpa
|
CCAAT/enhancer binding protein (C/EBP), alpha |
| chr18_+_32055339 | 7.75 |
ENSMUST00000233994.2
|
Lims2
|
LIM and senescent cell antigen like domains 2 |
| chr4_+_43632185 | 7.69 |
ENSMUST00000107874.9
|
Npr2
|
natriuretic peptide receptor 2 |
| chr1_+_167425953 | 7.65 |
ENSMUST00000015987.10
|
Rxrg
|
retinoid X receptor gamma |
| chr11_+_102652228 | 7.49 |
ENSMUST00000103081.10
ENSMUST00000068150.7 |
Adam11
|
a disintegrin and metallopeptidase domain 11 |
| chr2_-_23938869 | 7.44 |
ENSMUST00000114497.2
|
Hnmt
|
histamine N-methyltransferase |
| chr1_+_88128323 | 7.44 |
ENSMUST00000049289.9
|
Ugt1a2
|
UDP glucuronosyltransferase 1 family, polypeptide A2 |
| chr13_-_56444118 | 7.40 |
ENSMUST00000224801.2
|
Cxcl14
|
chemokine (C-X-C motif) ligand 14 |
| chr4_+_144619397 | 7.31 |
ENSMUST00000105744.8
ENSMUST00000171001.8 |
Dhrs3
|
dehydrogenase/reductase (SDR family) member 3 |
| chr6_-_85114725 | 7.24 |
ENSMUST00000174769.2
ENSMUST00000174286.3 ENSMUST00000045986.8 |
Spr
|
sepiapterin reductase |
| chr2_-_164285097 | 7.12 |
ENSMUST00000017153.4
|
Sdc4
|
syndecan 4 |
| chr2_+_48839505 | 7.06 |
ENSMUST00000112745.8
ENSMUST00000112754.8 |
Mbd5
|
methyl-CpG binding domain protein 5 |
| chr2_+_172994841 | 7.05 |
ENSMUST00000029017.6
|
Pck1
|
phosphoenolpyruvate carboxykinase 1, cytosolic |
| chr10_+_116137277 | 7.01 |
ENSMUST00000092167.7
|
Ptprb
|
protein tyrosine phosphatase, receptor type, B |
| chr4_+_144619647 | 7.00 |
ENSMUST00000154208.8
|
Dhrs3
|
dehydrogenase/reductase (SDR family) member 3 |
| chr11_-_115078653 | 6.94 |
ENSMUST00000103041.8
|
Nat9
|
N-acetyltransferase 9 (GCN5-related, putative) |
| chr11_+_115054157 | 6.94 |
ENSMUST00000021077.4
|
Slc9a3r1
|
solute carrier family 9 (sodium/hydrogen exchanger), member 3 regulator 1 |
| chr3_+_95226093 | 6.68 |
ENSMUST00000139866.2
|
Cers2
|
ceramide synthase 2 |
| chr4_+_144619696 | 6.64 |
ENSMUST00000142808.8
|
Dhrs3
|
dehydrogenase/reductase (SDR family) member 3 |
| chr14_-_20844074 | 6.58 |
ENSMUST00000080440.14
ENSMUST00000100837.11 ENSMUST00000071816.7 |
Camk2g
|
calcium/calmodulin-dependent protein kinase II gamma |
| chr4_+_60003438 | 6.48 |
ENSMUST00000107517.8
ENSMUST00000107520.2 |
Mup6
|
major urinary protein 6 |
| chr6_-_85684840 | 6.48 |
ENSMUST00000179613.2
|
Nat8f7
|
N-acetyltransferase 8 (GCN5-related) family member 7 |
| chr10_-_127724557 | 6.34 |
ENSMUST00000047199.5
|
Rdh7
|
retinol dehydrogenase 7 |
| chr10_+_7465555 | 6.34 |
ENSMUST00000134346.8
ENSMUST00000019931.12 ENSMUST00000130590.8 |
Lrp11
|
low density lipoprotein receptor-related protein 11 |
| chr13_+_93908138 | 6.29 |
ENSMUST00000091403.6
|
Arsb
|
arylsulfatase B |
| chr10_+_61531282 | 6.27 |
ENSMUST00000020284.5
|
Tysnd1
|
trypsin domain containing 1 |
| chr12_-_108241597 | 6.23 |
ENSMUST00000222310.2
|
Ccdc85c
|
coiled-coil domain containing 85C |
| chr2_+_22958956 | 6.23 |
ENSMUST00000226571.2
ENSMUST00000114529.10 ENSMUST00000114526.9 ENSMUST00000228050.2 |
Acbd5
|
acyl-Coenzyme A binding domain containing 5 |
| chr11_+_102326167 | 6.15 |
ENSMUST00000177428.2
|
Grn
|
granulin |
| chr17_+_32725420 | 6.14 |
ENSMUST00000235238.2
ENSMUST00000165999.2 |
Cyp4f17
|
cytochrome P450, family 4, subfamily f, polypeptide 17 |
| chr7_-_18883113 | 5.97 |
ENSMUST00000032566.3
|
Qpctl
|
glutaminyl-peptide cyclotransferase-like |
| chr11_-_120675009 | 5.96 |
ENSMUST00000026156.8
|
Rfng
|
RFNG O-fucosylpeptide 3-beta-N-acetylglucosaminyltransferase |
| chr8_-_85500010 | 5.92 |
ENSMUST00000109764.8
|
Nfix
|
nuclear factor I/X |
| chr1_+_57416752 | 5.88 |
ENSMUST00000042734.3
|
1700066M21Rik
|
RIKEN cDNA 1700066M21 gene |
| chr11_+_99748741 | 5.88 |
ENSMUST00000107434.2
|
Gm11568
|
predicted gene 11568 |
| chr6_-_11907392 | 5.86 |
ENSMUST00000204084.3
ENSMUST00000031637.8 ENSMUST00000204978.3 ENSMUST00000204714.2 |
Ndufa4
|
Ndufa4, mitochondrial complex associated |
| chrX_-_154121454 | 5.82 |
ENSMUST00000026328.11
|
Prdx4
|
peroxiredoxin 4 |
| chr11_-_100595019 | 5.78 |
ENSMUST00000017974.13
|
Dhx58
|
DEXH (Asp-Glu-X-His) box polypeptide 58 |
| chr1_-_84262144 | 5.70 |
ENSMUST00000176720.2
|
Pid1
|
phosphotyrosine interaction domain containing 1 |
| chr9_+_47441471 | 5.70 |
ENSMUST00000114548.8
ENSMUST00000152459.8 ENSMUST00000143026.9 ENSMUST00000085909.9 ENSMUST00000114547.8 ENSMUST00000239368.2 ENSMUST00000214542.2 ENSMUST00000034581.4 |
Cadm1
|
cell adhesion molecule 1 |
| chr10_-_61288437 | 5.69 |
ENSMUST00000167087.2
ENSMUST00000020288.15 |
Eif4ebp2
|
eukaryotic translation initiation factor 4E binding protein 2 |
| chr6_+_107506678 | 5.68 |
ENSMUST00000049285.10
|
Lrrn1
|
leucine rich repeat protein 1, neuronal |
| chr4_-_107780716 | 5.68 |
ENSMUST00000106719.8
ENSMUST00000106720.9 ENSMUST00000131644.2 ENSMUST00000030345.15 |
Cpt2
|
carnitine palmitoyltransferase 2 |
| chr11_-_53782462 | 5.57 |
ENSMUST00000019044.8
|
Slc22a5
|
solute carrier family 22 (organic cation transporter), member 5 |
| chr2_+_22959223 | 5.56 |
ENSMUST00000114523.10
|
Acbd5
|
acyl-Coenzyme A binding domain containing 5 |
| chr2_+_130748380 | 5.54 |
ENSMUST00000028781.9
|
Atrn
|
attractin |
| chr9_+_45817795 | 5.52 |
ENSMUST00000039059.8
|
Pcsk7
|
proprotein convertase subtilisin/kexin type 7 |
| chr9_+_22365586 | 5.49 |
ENSMUST00000168332.2
|
Gm17545
|
predicted gene, 17545 |
| chr11_-_120348762 | 5.44 |
ENSMUST00000137632.2
ENSMUST00000044007.3 |
Oxld1
|
oxidoreductase like domain containing 1 |
| chr10_-_24712034 | 5.41 |
ENSMUST00000218044.2
ENSMUST00000020169.9 |
Enpp3
|
ectonucleotide pyrophosphatase/phosphodiesterase 3 |
| chr10_-_127457001 | 5.34 |
ENSMUST00000049149.15
|
Lrp1
|
low density lipoprotein receptor-related protein 1 |
| chr11_+_104122216 | 5.22 |
ENSMUST00000106992.10
|
Mapt
|
microtubule-associated protein tau |
| chr16_+_23338960 | 5.21 |
ENSMUST00000211460.2
ENSMUST00000210658.2 ENSMUST00000209198.2 ENSMUST00000210371.2 ENSMUST00000211499.2 ENSMUST00000210795.2 ENSMUST00000209422.2 |
Gm45338
Rtp4
|
predicted gene 45338 receptor transporter protein 4 |
| chr11_+_102326109 | 5.19 |
ENSMUST00000125819.9
|
Grn
|
granulin |
| chr4_-_46991842 | 5.19 |
ENSMUST00000107749.4
|
Gabbr2
|
gamma-aminobutyric acid (GABA) B receptor, 2 |
| chr6_-_126717590 | 5.18 |
ENSMUST00000185333.2
|
Kcna6
|
potassium voltage-gated channel, shaker-related, subfamily, member 6 |
| chr19_+_5088854 | 5.16 |
ENSMUST00000053705.8
ENSMUST00000235776.2 |
B4gat1
|
beta-1,4-glucuronyltransferase 1 |
| chr2_-_91025208 | 5.16 |
ENSMUST00000111355.8
|
Nr1h3
|
nuclear receptor subfamily 1, group H, member 3 |
| chr3_-_89230190 | 5.14 |
ENSMUST00000200436.2
ENSMUST00000029673.10 |
Efna3
|
ephrin A3 |
| chr19_+_4905158 | 5.14 |
ENSMUST00000119694.3
ENSMUST00000237504.2 ENSMUST00000237011.2 |
Ctsf
|
cathepsin F |
| chr5_-_88823989 | 5.12 |
ENSMUST00000078945.12
|
Grsf1
|
G-rich RNA sequence binding factor 1 |
| chr6_+_54249817 | 5.12 |
ENSMUST00000204921.3
ENSMUST00000203091.3 ENSMUST00000204115.3 ENSMUST00000203941.3 ENSMUST00000204746.2 |
Chn2
|
chimerin 2 |
| chr11_-_106378622 | 5.11 |
ENSMUST00000001059.9
ENSMUST00000106799.2 ENSMUST00000106800.2 |
Ern1
|
endoplasmic reticulum (ER) to nucleus signalling 1 |
| chr17_-_45046499 | 5.11 |
ENSMUST00000162373.8
ENSMUST00000162878.8 |
Runx2
|
runt related transcription factor 2 |
| chr4_+_105014536 | 5.10 |
ENSMUST00000064139.8
|
Plpp3
|
phospholipid phosphatase 3 |
| chr6_-_83098255 | 5.10 |
ENSMUST00000205023.2
ENSMUST00000146328.4 ENSMUST00000151393.7 ENSMUST00000032111.11 ENSMUST00000113936.10 |
Wbp1
|
WW domain binding protein 1 |
| chr11_-_95966407 | 5.07 |
ENSMUST00000107686.8
ENSMUST00000107684.2 |
Atp5g1
|
ATP synthase, H+ transporting, mitochondrial F0 complex, subunit C1 (subunit 9) |
| chr2_-_91025492 | 5.04 |
ENSMUST00000111354.2
|
Nr1h3
|
nuclear receptor subfamily 1, group H, member 3 |
| chr4_-_148234123 | 5.02 |
ENSMUST00000126615.8
|
Fbxo6
|
F-box protein 6 |
| chrX_-_71699740 | 5.00 |
ENSMUST00000055966.13
|
Gabra3
|
gamma-aminobutyric acid (GABA) A receptor, subunit alpha 3 |
| chr17_-_45906768 | 5.00 |
ENSMUST00000164618.8
ENSMUST00000097317.10 ENSMUST00000170113.8 |
Slc29a1
|
solute carrier family 29 (nucleoside transporters), member 1 |
| chr9_-_108444561 | 4.99 |
ENSMUST00000074208.6
|
Ndufaf3
|
NADH:ubiquinone oxidoreductase complex assembly factor 3 |
| chr13_+_38529062 | 4.92 |
ENSMUST00000171970.3
|
Bmp6
|
bone morphogenetic protein 6 |
| chr16_+_17026467 | 4.92 |
ENSMUST00000169803.5
|
Rimbp3
|
RIMS binding protein 3 |
| chr2_+_112285342 | 4.90 |
ENSMUST00000069747.6
|
Emc7
|
ER membrane protein complex subunit 7 |
| chr19_+_36532061 | 4.88 |
ENSMUST00000169036.9
ENSMUST00000047247.12 |
Hectd2
|
HECT domain E3 ubiquitin protein ligase 2 |
| chr7_+_80707328 | 4.86 |
ENSMUST00000107348.2
|
Alpk3
|
alpha-kinase 3 |
| chr6_-_126717114 | 4.79 |
ENSMUST00000112242.2
|
Kcna6
|
potassium voltage-gated channel, shaker-related, subfamily, member 6 |
| chr7_-_29935150 | 4.72 |
ENSMUST00000189482.2
|
Ovol3
|
ovo like zinc finger 3 |
| chr8_-_125448695 | 4.71 |
ENSMUST00000117624.9
ENSMUST00000231984.2 ENSMUST00000041614.15 ENSMUST00000214828.2 ENSMUST00000118134.3 |
Ttc13
|
tetratricopeptide repeat domain 13 |
| chr9_-_108141105 | 4.69 |
ENSMUST00000166905.8
ENSMUST00000191899.6 |
Dag1
|
dystroglycan 1 |
| chr17_-_36440317 | 4.68 |
ENSMUST00000046131.16
ENSMUST00000173322.8 ENSMUST00000172968.2 |
Gm7030
|
predicted gene 7030 |
| chr17_-_45906428 | 4.68 |
ENSMUST00000171081.8
ENSMUST00000172301.8 ENSMUST00000167332.8 ENSMUST00000170488.8 ENSMUST00000167195.8 ENSMUST00000064889.13 ENSMUST00000051574.13 ENSMUST00000164217.8 |
Slc29a1
|
solute carrier family 29 (nucleoside transporters), member 1 |
| chr11_+_104122399 | 4.60 |
ENSMUST00000132977.8
ENSMUST00000132245.8 ENSMUST00000100347.11 |
Mapt
|
microtubule-associated protein tau |
| chr12_+_105302853 | 4.55 |
ENSMUST00000180458.9
|
Tunar
|
Tcl1 upstream neural differentiation associated RNA |
| chr4_+_40143079 | 4.55 |
ENSMUST00000102973.4
|
Aco1
|
aconitase 1 |
| chr4_-_138095277 | 4.52 |
ENSMUST00000030535.4
|
Cda
|
cytidine deaminase |
| chr8_-_13544478 | 4.44 |
ENSMUST00000033828.7
|
Gas6
|
growth arrest specific 6 |
| chr14_-_20844034 | 4.42 |
ENSMUST00000226630.2
|
Camk2g
|
calcium/calmodulin-dependent protein kinase II gamma |
| chrX_-_73067351 | 4.42 |
ENSMUST00000114353.10
ENSMUST00000101458.9 |
Irak1
|
interleukin-1 receptor-associated kinase 1 |
| chr16_+_37688744 | 4.40 |
ENSMUST00000078717.7
|
Lrrc58
|
leucine rich repeat containing 58 |
| chr7_-_27037096 | 4.40 |
ENSMUST00000038618.13
ENSMUST00000108369.9 |
Ltbp4
|
latent transforming growth factor beta binding protein 4 |
| chr3_+_135144202 | 4.39 |
ENSMUST00000166033.6
|
Ube2d3
|
ubiquitin-conjugating enzyme E2D 3 |
| chr6_-_99703344 | 4.38 |
ENSMUST00000008273.8
ENSMUST00000101120.11 ENSMUST00000203738.2 |
Prok2
|
prokineticin 2 |
| chr5_-_148489457 | 4.38 |
ENSMUST00000079324.14
|
Ubl3
|
ubiquitin-like 3 |
| chr11_+_77353431 | 4.38 |
ENSMUST00000130255.2
|
Coro6
|
coronin 6 |
| chr15_+_9071331 | 4.37 |
ENSMUST00000190591.10
|
Nadk2
|
NAD kinase 2, mitochondrial |
| chr13_-_23894697 | 4.35 |
ENSMUST00000091707.13
ENSMUST00000006787.8 |
Hfe
|
homeostatic iron regulator |
| chr2_-_26028814 | 4.35 |
ENSMUST00000163836.2
|
Tmem250-ps
|
transmembrane protein 250, pseudogene |
| chr4_+_53440516 | 4.34 |
ENSMUST00000107651.9
ENSMUST00000107647.8 |
Slc44a1
|
solute carrier family 44, member 1 |
| chr2_-_180681079 | 4.32 |
ENSMUST00000067120.14
|
Chrna4
|
cholinergic receptor, nicotinic, alpha polypeptide 4 |
| chr16_+_93404719 | 4.31 |
ENSMUST00000039659.9
ENSMUST00000231762.2 |
Cbr1
|
carbonyl reductase 1 |
| chr8_+_47192767 | 4.26 |
ENSMUST00000034041.9
ENSMUST00000208507.2 ENSMUST00000207105.2 |
Irf2
|
interferon regulatory factor 2 |
| chr2_-_75534985 | 4.16 |
ENSMUST00000102672.5
|
Nfe2l2
|
nuclear factor, erythroid derived 2, like 2 |
| chr5_-_137598912 | 4.15 |
ENSMUST00000111007.8
ENSMUST00000133705.2 |
Mospd3
|
motile sperm domain containing 3 |
| chr17_-_27158514 | 4.14 |
ENSMUST00000114935.9
ENSMUST00000025027.10 |
Cuta
|
cutA divalent cation tolerance homolog |
| chr11_+_104122341 | 4.12 |
ENSMUST00000106993.10
|
Mapt
|
microtubule-associated protein tau |
| chr11_-_106378659 | 4.11 |
ENSMUST00000106801.8
|
Ern1
|
endoplasmic reticulum (ER) to nucleus signalling 1 |
| chr4_-_132990362 | 4.11 |
ENSMUST00000105908.10
ENSMUST00000030674.8 |
Sytl1
|
synaptotagmin-like 1 |
| chr10_-_76949510 | 4.07 |
ENSMUST00000105409.8
|
Col18a1
|
collagen, type XVIII, alpha 1 |
| chr1_-_75156993 | 4.06 |
ENSMUST00000027396.15
|
Abcb6
|
ATP-binding cassette, sub-family B (MDR/TAP), member 6 |
| chr10_-_128727542 | 4.03 |
ENSMUST00000026408.7
|
Gdf11
|
growth differentiation factor 11 |
Gene Ontology Analysis
Gene overrepresentation in biological process category:
| Log-likelihood per target | Total log-likelihood | Term | Description |
|---|---|---|---|
| 12.9 | 90.1 | GO:1904073 | regulation of trophectodermal cell proliferation(GO:1904073) positive regulation of trophectodermal cell proliferation(GO:1904075) |
| 10.3 | 30.9 | GO:0018931 | naphthalene metabolic process(GO:0018931) naphthalene-containing compound metabolic process(GO:0090420) |
| 9.7 | 116.9 | GO:0071394 | cellular response to testosterone stimulus(GO:0071394) |
| 8.7 | 43.6 | GO:0002485 | antigen processing and presentation of endogenous peptide antigen via MHC class I via ER pathway(GO:0002484) antigen processing and presentation of endogenous peptide antigen via MHC class I via ER pathway, TAP-dependent(GO:0002485) |
| 6.5 | 26.0 | GO:0046951 | ketone body biosynthetic process(GO:0046951) |
| 5.8 | 17.5 | GO:0021577 | hindbrain structural organization(GO:0021577) cerebellum structural organization(GO:0021589) |
| 4.8 | 53.3 | GO:0000255 | allantoin metabolic process(GO:0000255) |
| 4.7 | 28.2 | GO:1902998 | regulation of neuronal signal transduction(GO:1902847) positive regulation of neurofibrillary tangle assembly(GO:1902998) |
| 4.4 | 4.4 | GO:1900141 | regulation of oligodendrocyte apoptotic process(GO:1900141) negative regulation of oligodendrocyte apoptotic process(GO:1900142) |
| 3.8 | 11.3 | GO:0021682 | nerve maturation(GO:0021682) |
| 3.3 | 16.4 | GO:1904970 | brush border assembly(GO:1904970) |
| 2.9 | 8.8 | GO:0009258 | 10-formyltetrahydrofolate catabolic process(GO:0009258) folic acid-containing compound catabolic process(GO:0009397) pteridine-containing compound catabolic process(GO:0042560) |
| 2.9 | 11.7 | GO:0001970 | positive regulation of activation of membrane attack complex(GO:0001970) |
| 2.9 | 8.6 | GO:0043323 | positive regulation of natural killer cell degranulation(GO:0043323) |
| 2.8 | 8.3 | GO:1903334 | positive regulation of protein folding(GO:1903334) |
| 2.8 | 8.3 | GO:0034758 | regulation of antigen processing and presentation of peptide antigen via MHC class I(GO:0002589) negative regulation of antigen processing and presentation of peptide antigen via MHC class I(GO:0002590) regulation of T cell antigen processing and presentation(GO:0002625) positive regulation of iron ion transport(GO:0034758) positive regulation of iron ion transmembrane transport(GO:0034761) regulation of iron ion import(GO:1900390) regulation of ferrous iron import into cell(GO:1903989) positive regulation of ferrous iron import into cell(GO:1903991) regulation of ferrous iron binding(GO:1904432) positive regulation of ferrous iron binding(GO:1904434) regulation of transferrin receptor binding(GO:1904435) positive regulation of transferrin receptor binding(GO:1904437) regulation of ferrous iron import across plasma membrane(GO:1904438) positive regulation of ferrous iron import across plasma membrane(GO:1904440) |
| 2.8 | 8.3 | GO:0006711 | estrogen catabolic process(GO:0006711) |
| 2.7 | 13.3 | GO:0002906 | mature B cell apoptotic process(GO:0002901) regulation of mature B cell apoptotic process(GO:0002905) negative regulation of mature B cell apoptotic process(GO:0002906) |
| 2.6 | 7.8 | GO:1903048 | regulation of acetylcholine-gated cation channel activity(GO:1903048) |
| 2.5 | 10.2 | GO:0090341 | negative regulation of secretion of lysosomal enzymes(GO:0090341) |
| 2.3 | 6.9 | GO:0032416 | negative regulation of sodium:proton antiporter activity(GO:0032416) |
| 2.3 | 9.2 | GO:1905167 | positive regulation of lysosomal protein catabolic process(GO:1905167) |
| 2.2 | 15.7 | GO:0052805 | imidazole-containing compound catabolic process(GO:0052805) |
| 1.8 | 7.4 | GO:2000503 | positive regulation of natural killer cell chemotaxis(GO:2000503) |
| 1.8 | 8.9 | GO:0060983 | epicardium-derived cardiac vascular smooth muscle cell differentiation(GO:0060983) |
| 1.8 | 5.4 | GO:0021666 | rhombomere formation(GO:0021594) rhombomere 3 formation(GO:0021660) rhombomere 5 morphogenesis(GO:0021664) rhombomere 5 formation(GO:0021666) |
| 1.8 | 17.8 | GO:1900034 | regulation of cellular response to heat(GO:1900034) |
| 1.8 | 35.5 | GO:0045717 | negative regulation of fatty acid biosynthetic process(GO:0045717) |
| 1.8 | 15.9 | GO:0042904 | 9-cis-retinoic acid biosynthetic process(GO:0042904) 9-cis-retinoic acid metabolic process(GO:0042905) |
| 1.8 | 7.0 | GO:0006114 | glycerol biosynthetic process(GO:0006114) alditol biosynthetic process(GO:0019401) positive regulation of transcription from RNA polymerase II promoter in response to acidic pH(GO:0061402) |
| 1.7 | 16.9 | GO:0007168 | receptor guanylyl cyclase signaling pathway(GO:0007168) |
| 1.6 | 16.0 | GO:0031580 | membrane raft polarization(GO:0001766) membrane raft distribution(GO:0031580) |
| 1.6 | 37.6 | GO:0006744 | ubiquinone biosynthetic process(GO:0006744) |
| 1.5 | 9.2 | GO:0006987 | activation of signaling protein activity involved in unfolded protein response(GO:0006987) |
| 1.5 | 4.5 | GO:0046087 | cytidine catabolic process(GO:0006216) cytidine deamination(GO:0009972) cytidine metabolic process(GO:0046087) |
| 1.5 | 4.4 | GO:1990167 | protein K27-linked deubiquitination(GO:1990167) |
| 1.4 | 15.3 | GO:0030242 | pexophagy(GO:0030242) |
| 1.4 | 4.2 | GO:0043387 | mycotoxin catabolic process(GO:0043387) aflatoxin catabolic process(GO:0046223) organic heteropentacyclic compound catabolic process(GO:1901377) negative regulation of vascular associated smooth muscle cell migration(GO:1904753) |
| 1.4 | 9.7 | GO:0015862 | uridine transport(GO:0015862) |
| 1.4 | 15.1 | GO:1900383 | regulation of synaptic plasticity by receptor localization to synapse(GO:1900383) |
| 1.4 | 4.1 | GO:0018199 | peptidyl-glutamine modification(GO:0018199) |
| 1.3 | 9.2 | GO:0009414 | response to water deprivation(GO:0009414) |
| 1.3 | 3.9 | GO:0035544 | negative regulation of SNARE complex assembly(GO:0035544) |
| 1.3 | 11.3 | GO:0071684 | blastocyst hatching(GO:0001835) hatching(GO:0035188) organism emergence from protective structure(GO:0071684) |
| 1.2 | 10.0 | GO:0035887 | aortic smooth muscle cell differentiation(GO:0035887) |
| 1.2 | 4.9 | GO:1903976 | negative regulation of glial cell migration(GO:1903976) |
| 1.2 | 27.9 | GO:0008535 | respiratory chain complex IV assembly(GO:0008535) |
| 1.2 | 3.6 | GO:0002658 | positive regulation of tolerance induction dependent upon immune response(GO:0002654) regulation of peripheral tolerance induction(GO:0002658) positive regulation of peripheral tolerance induction(GO:0002660) regulation of peripheral T cell tolerance induction(GO:0002849) positive regulation of peripheral T cell tolerance induction(GO:0002851) |
| 1.2 | 8.4 | GO:0051725 | protein de-ADP-ribosylation(GO:0051725) |
| 1.2 | 7.1 | GO:1903553 | positive regulation of extracellular exosome assembly(GO:1903553) |
| 1.2 | 5.8 | GO:0022417 | protein maturation by protein folding(GO:0022417) |
| 1.1 | 26.3 | GO:0042572 | retinol metabolic process(GO:0042572) |
| 1.1 | 5.7 | GO:0070346 | positive regulation of fat cell proliferation(GO:0070346) negative regulation of glucose import in response to insulin stimulus(GO:2001274) |
| 1.1 | 5.7 | GO:0042271 | susceptibility to natural killer cell mediated cytotoxicity(GO:0042271) |
| 1.1 | 5.6 | GO:0060729 | intestinal epithelial structure maintenance(GO:0060729) |
| 1.1 | 23.1 | GO:0042359 | vitamin D metabolic process(GO:0042359) |
| 1.1 | 12.0 | GO:0070862 | negative regulation of protein exit from endoplasmic reticulum(GO:0070862) negative regulation of retrograde protein transport, ER to cytosol(GO:1904153) |
| 1.1 | 3.2 | GO:0097535 | lymphoid lineage cell migration(GO:0097534) lymphoid lineage cell migration into thymus(GO:0097535) |
| 1.0 | 11.5 | GO:0072615 | interleukin-17 secretion(GO:0072615) |
| 1.0 | 3.1 | GO:0090076 | relaxation of skeletal muscle(GO:0090076) |
| 1.0 | 5.0 | GO:0014735 | regulation of muscle atrophy(GO:0014735) |
| 1.0 | 2.0 | GO:0021933 | radial glia guided migration of cerebellar granule cell(GO:0021933) |
| 1.0 | 2.9 | GO:1903413 | response to bile acid(GO:1903412) cellular response to bile acid(GO:1903413) |
| 1.0 | 19.4 | GO:1902414 | protein localization to cell junction(GO:1902414) |
| 1.0 | 1.9 | GO:0032286 | central nervous system myelin maintenance(GO:0032286) |
| 1.0 | 5.8 | GO:1900245 | positive regulation of MDA-5 signaling pathway(GO:1900245) |
| 0.9 | 1.9 | GO:1902623 | negative regulation of neutrophil migration(GO:1902623) |
| 0.9 | 6.5 | GO:0032380 | regulation of intracellular lipid transport(GO:0032377) regulation of intracellular sterol transport(GO:0032380) regulation of intracellular cholesterol transport(GO:0032383) |
| 0.9 | 10.1 | GO:0072513 | positive regulation of secondary heart field cardioblast proliferation(GO:0072513) |
| 0.9 | 4.5 | GO:0010040 | response to iron(II) ion(GO:0010040) |
| 0.9 | 1.8 | GO:0097212 | lysosomal membrane organization(GO:0097212) |
| 0.9 | 3.5 | GO:0002949 | tRNA threonylcarbamoyladenosine modification(GO:0002949) |
| 0.9 | 2.6 | GO:2000536 | negative regulation of entry of bacterium into host cell(GO:2000536) |
| 0.9 | 4.3 | GO:0042373 | vitamin K metabolic process(GO:0042373) |
| 0.8 | 3.3 | GO:0048102 | autophagic cell death(GO:0048102) |
| 0.8 | 7.3 | GO:0060024 | rhythmic synaptic transmission(GO:0060024) |
| 0.8 | 7.2 | GO:0050882 | voluntary musculoskeletal movement(GO:0050882) |
| 0.8 | 3.2 | GO:0038163 | endomitotic cell cycle(GO:0007113) thrombopoietin-mediated signaling pathway(GO:0038163) |
| 0.8 | 2.4 | GO:0021966 | corticospinal neuron axon guidance(GO:0021966) |
| 0.8 | 11.9 | GO:0006707 | cholesterol catabolic process(GO:0006707) sterol catabolic process(GO:0016127) |
| 0.8 | 12.6 | GO:0060134 | prepulse inhibition(GO:0060134) |
| 0.7 | 3.7 | GO:0042412 | taurine biosynthetic process(GO:0042412) |
| 0.7 | 7.4 | GO:0052697 | flavonoid glucuronidation(GO:0052696) xenobiotic glucuronidation(GO:0052697) |
| 0.7 | 5.1 | GO:0015871 | choline transport(GO:0015871) |
| 0.7 | 3.5 | GO:0044861 | protein transport into plasma membrane raft(GO:0044861) |
| 0.7 | 4.2 | GO:0060082 | response to carbon monoxide(GO:0034465) eye blink reflex(GO:0060082) |
| 0.7 | 7.8 | GO:2000346 | negative regulation of hepatocyte proliferation(GO:2000346) |
| 0.7 | 4.9 | GO:0032346 | positive regulation of aldosterone metabolic process(GO:0032346) positive regulation of aldosterone biosynthetic process(GO:0032349) |
| 0.7 | 14.7 | GO:0021707 | cerebellar granular layer formation(GO:0021684) cerebellar granule cell differentiation(GO:0021707) |
| 0.7 | 2.1 | GO:0099552 | trans-synaptic signaling by lipid, modulating synaptic transmission(GO:0099552) trans-synaptic signaling by endocannabinoid, modulating synaptic transmission(GO:0099553) regulation of intracellular calcium activated chloride channel activity(GO:1902938) |
| 0.7 | 6.3 | GO:0046959 | habituation(GO:0046959) |
| 0.7 | 4.0 | GO:0048105 | establishment of body hair or bristle planar orientation(GO:0048104) establishment of body hair planar orientation(GO:0048105) |
| 0.6 | 3.8 | GO:0060455 | negative regulation of gastric acid secretion(GO:0060455) |
| 0.6 | 1.9 | GO:2001055 | positive regulation of mesenchymal cell apoptotic process(GO:2001055) |
| 0.6 | 1.2 | GO:2001013 | epithelial cell proliferation involved in renal tubule morphogenesis(GO:2001013) |
| 0.6 | 2.4 | GO:0060988 | lipid tube assembly(GO:0060988) |
| 0.6 | 7.8 | GO:0045945 | positive regulation of transcription from RNA polymerase III promoter(GO:0045945) |
| 0.6 | 3.6 | GO:0050968 | detection of chemical stimulus involved in sensory perception of pain(GO:0050968) |
| 0.6 | 1.2 | GO:0060849 | regulation of transcription involved in lymphatic endothelial cell fate commitment(GO:0060849) |
| 0.6 | 4.1 | GO:0015886 | heme transport(GO:0015886) |
| 0.6 | 5.1 | GO:0090520 | sphingolipid mediated signaling pathway(GO:0090520) |
| 0.6 | 14.1 | GO:1901897 | regulation of relaxation of cardiac muscle(GO:1901897) |
| 0.6 | 23.0 | GO:1901522 | positive regulation of transcription from RNA polymerase II promoter involved in cellular response to chemical stimulus(GO:1901522) |
| 0.6 | 3.3 | GO:0002528 | regulation of vascular permeability involved in acute inflammatory response(GO:0002528) |
| 0.6 | 2.8 | GO:0061086 | negative regulation of histone H3-K27 methylation(GO:0061086) |
| 0.6 | 4.4 | GO:0090370 | negative regulation of cholesterol efflux(GO:0090370) |
| 0.5 | 2.2 | GO:0045077 | negative regulation of interferon-gamma biosynthetic process(GO:0045077) |
| 0.5 | 1.6 | GO:1902630 | regulation of membrane hyperpolarization(GO:1902630) |
| 0.5 | 6.5 | GO:0030948 | negative regulation of vascular endothelial growth factor receptor signaling pathway(GO:0030948) |
| 0.5 | 0.5 | GO:0046544 | development of secondary male sexual characteristics(GO:0046544) |
| 0.5 | 1.6 | GO:0090403 | oxidative stress-induced premature senescence(GO:0090403) |
| 0.5 | 4.7 | GO:0006705 | mineralocorticoid biosynthetic process(GO:0006705) mineralocorticoid metabolic process(GO:0008212) |
| 0.5 | 3.1 | GO:0032290 | peripheral nervous system myelin formation(GO:0032290) |
| 0.5 | 3.0 | GO:0070459 | prolactin secretion(GO:0070459) |
| 0.5 | 1.9 | GO:2000211 | regulation of glutamate metabolic process(GO:2000211) |
| 0.5 | 1.4 | GO:0046038 | GMP catabolic process(GO:0046038) |
| 0.5 | 7.9 | GO:0006654 | phosphatidic acid biosynthetic process(GO:0006654) |
| 0.5 | 0.9 | GO:0014734 | skeletal muscle hypertrophy(GO:0014734) |
| 0.5 | 4.6 | GO:1901727 | positive regulation of histone deacetylase activity(GO:1901727) |
| 0.5 | 9.5 | GO:0043567 | regulation of insulin-like growth factor receptor signaling pathway(GO:0043567) |
| 0.4 | 3.1 | GO:0070072 | vacuolar proton-transporting V-type ATPase complex assembly(GO:0070072) |
| 0.4 | 1.3 | GO:0031443 | fast-twitch skeletal muscle fiber contraction(GO:0031443) |
| 0.4 | 3.5 | GO:0070317 | negative regulation of G0 to G1 transition(GO:0070317) |
| 0.4 | 3.4 | GO:2000189 | positive regulation of cholesterol homeostasis(GO:2000189) |
| 0.4 | 2.1 | GO:0060083 | smooth muscle contraction involved in micturition(GO:0060083) |
| 0.4 | 2.1 | GO:0051122 | hepoxilin metabolic process(GO:0051121) hepoxilin biosynthetic process(GO:0051122) |
| 0.4 | 1.7 | GO:1902309 | negative regulation of peptidyl-serine dephosphorylation(GO:1902309) |
| 0.4 | 2.5 | GO:0032423 | regulation of mismatch repair(GO:0032423) |
| 0.4 | 1.6 | GO:0072137 | condensed mesenchymal cell proliferation(GO:0072137) |
| 0.4 | 2.3 | GO:0071698 | olfactory placode formation(GO:0030910) olfactory placode development(GO:0071698) olfactory placode morphogenesis(GO:0071699) |
| 0.4 | 1.2 | GO:0043366 | beta selection(GO:0043366) |
| 0.4 | 3.5 | GO:0048208 | vesicle targeting, rough ER to cis-Golgi(GO:0048207) COPII vesicle coating(GO:0048208) |
| 0.4 | 1.9 | GO:1904048 | negative regulation of synaptic vesicle recycling(GO:1903422) regulation of spontaneous neurotransmitter secretion(GO:1904048) |
| 0.4 | 1.5 | GO:1904451 | regulation of hydrogen:potassium-exchanging ATPase activity(GO:1904451) positive regulation of hydrogen:potassium-exchanging ATPase activity(GO:1904453) |
| 0.4 | 1.5 | GO:2000973 | regulation of pro-B cell differentiation(GO:2000973) |
| 0.4 | 2.2 | GO:0043654 | recognition of apoptotic cell(GO:0043654) |
| 0.4 | 1.5 | GO:1900738 | positive regulation of phospholipase C-activating G-protein coupled receptor signaling pathway(GO:1900738) |
| 0.4 | 2.2 | GO:0070094 | positive regulation of glucagon secretion(GO:0070094) |
| 0.4 | 2.2 | GO:0018242 | protein O-linked glycosylation via serine(GO:0018242) |
| 0.4 | 4.4 | GO:0003172 | primary heart field specification(GO:0003138) sinoatrial valve development(GO:0003172) sinoatrial valve morphogenesis(GO:0003185) positive regulation of macrophage apoptotic process(GO:2000111) |
| 0.4 | 1.5 | GO:0034334 | adherens junction maintenance(GO:0034334) |
| 0.4 | 2.2 | GO:0015015 | heparan sulfate proteoglycan biosynthetic process, enzymatic modification(GO:0015015) |
| 0.4 | 3.7 | GO:0060836 | lymphatic endothelial cell differentiation(GO:0060836) |
| 0.4 | 3.3 | GO:1990118 | sodium ion import across plasma membrane(GO:0098719) sodium ion import into cell(GO:1990118) |
| 0.4 | 1.8 | GO:0009912 | auditory receptor cell fate commitment(GO:0009912) inner ear receptor cell fate commitment(GO:0060120) |
| 0.4 | 0.4 | GO:0021644 | vagus nerve morphogenesis(GO:0021644) |
| 0.4 | 5.4 | GO:0009143 | nucleoside triphosphate catabolic process(GO:0009143) |
| 0.4 | 1.4 | GO:1903999 | negative regulation of eating behavior(GO:1903999) |
| 0.4 | 1.8 | GO:0044727 | DNA demethylation of male pronucleus(GO:0044727) |
| 0.4 | 2.8 | GO:0006741 | NADP biosynthetic process(GO:0006741) |
| 0.4 | 1.8 | GO:0048165 | ovarian cumulus expansion(GO:0001550) fused antrum stage(GO:0048165) |
| 0.4 | 1.4 | GO:0010046 | response to mycotoxin(GO:0010046) |
| 0.3 | 1.7 | GO:1905150 | regulation of voltage-gated sodium channel activity(GO:1905150) |
| 0.3 | 1.7 | GO:0007207 | adenylate cyclase-inhibiting G-protein coupled acetylcholine receptor signaling pathway(GO:0007197) phospholipase C-activating G-protein coupled acetylcholine receptor signaling pathway(GO:0007207) |
| 0.3 | 14.1 | GO:0007214 | gamma-aminobutyric acid signaling pathway(GO:0007214) |
| 0.3 | 13.4 | GO:0070979 | protein K11-linked ubiquitination(GO:0070979) |
| 0.3 | 1.0 | GO:2000546 | positive regulation of cell chemotaxis to fibroblast growth factor(GO:1904849) positive regulation of endothelial cell chemotaxis to fibroblast growth factor(GO:2000546) |
| 0.3 | 2.0 | GO:2000676 | positive regulation of type B pancreatic cell apoptotic process(GO:2000676) |
| 0.3 | 3.3 | GO:1990573 | potassium ion import across plasma membrane(GO:1990573) |
| 0.3 | 0.3 | GO:0061300 | cerebellum vasculature development(GO:0061300) |
| 0.3 | 2.8 | GO:0006004 | fucose metabolic process(GO:0006004) |
| 0.3 | 5.2 | GO:0043653 | mitochondrial fragmentation involved in apoptotic process(GO:0043653) |
| 0.3 | 7.6 | GO:0035641 | locomotory exploration behavior(GO:0035641) |
| 0.3 | 1.8 | GO:0006287 | base-excision repair, gap-filling(GO:0006287) |
| 0.3 | 1.8 | GO:2000317 | negative regulation of T-helper 17 type immune response(GO:2000317) negative regulation of T-helper 17 cell differentiation(GO:2000320) |
| 0.3 | 1.2 | GO:0061196 | fungiform papilla development(GO:0061196) |
| 0.3 | 2.6 | GO:0051835 | positive regulation of synapse structural plasticity(GO:0051835) |
| 0.3 | 4.1 | GO:0010642 | negative regulation of platelet-derived growth factor receptor signaling pathway(GO:0010642) |
| 0.3 | 0.3 | GO:0015864 | pyrimidine nucleoside transport(GO:0015864) |
| 0.3 | 0.3 | GO:0032055 | negative regulation of translation in response to stress(GO:0032055) |
| 0.3 | 1.1 | GO:0021564 | vagus nerve development(GO:0021564) |
| 0.3 | 2.5 | GO:0033353 | S-adenosylmethionine cycle(GO:0033353) |
| 0.3 | 5.2 | GO:0001580 | detection of chemical stimulus involved in sensory perception of bitter taste(GO:0001580) |
| 0.3 | 1.1 | GO:0031635 | adenylate cyclase-inhibiting opioid receptor signaling pathway(GO:0031635) |
| 0.3 | 1.9 | GO:0006627 | protein processing involved in protein targeting to mitochondrion(GO:0006627) |
| 0.3 | 3.2 | GO:0010839 | negative regulation of keratinocyte proliferation(GO:0010839) |
| 0.3 | 6.6 | GO:0045475 | locomotor rhythm(GO:0045475) |
| 0.3 | 1.3 | GO:0021853 | cerebral cortex GABAergic interneuron migration(GO:0021853) interneuron migration(GO:1904936) |
| 0.3 | 8.9 | GO:0015985 | energy coupled proton transport, down electrochemical gradient(GO:0015985) ATP synthesis coupled proton transport(GO:0015986) |
| 0.3 | 2.4 | GO:0021840 | directional guidance of interneurons involved in migration from the subpallium to the cortex(GO:0021840) chemorepulsion involved in interneuron migration from the subpallium to the cortex(GO:0021842) |
| 0.3 | 6.3 | GO:0031998 | regulation of fatty acid beta-oxidation(GO:0031998) |
| 0.3 | 5.7 | GO:0045947 | negative regulation of translational initiation(GO:0045947) |
| 0.3 | 9.2 | GO:0010842 | retina layer formation(GO:0010842) |
| 0.3 | 1.5 | GO:0060335 | positive regulation of response to interferon-gamma(GO:0060332) positive regulation of interferon-gamma-mediated signaling pathway(GO:0060335) |
| 0.3 | 1.0 | GO:0050912 | detection of chemical stimulus involved in sensory perception of taste(GO:0050912) |
| 0.3 | 1.0 | GO:0019509 | L-methionine biosynthetic process from methylthioadenosine(GO:0019509) |
| 0.3 | 0.5 | GO:0002652 | regulation of tolerance induction dependent upon immune response(GO:0002652) |
| 0.2 | 0.7 | GO:0090427 | inhibitory G-protein coupled receptor phosphorylation(GO:0002030) activation of meiosis involved in egg activation(GO:0060466) activation of meiosis(GO:0090427) |
| 0.2 | 3.0 | GO:0019800 | peptide cross-linking via chondroitin 4-sulfate glycosaminoglycan(GO:0019800) |
| 0.2 | 3.9 | GO:0006488 | dolichol-linked oligosaccharide biosynthetic process(GO:0006488) |
| 0.2 | 1.7 | GO:2000382 | positive regulation of mesoderm development(GO:2000382) |
| 0.2 | 0.7 | GO:0046333 | octopamine biosynthetic process(GO:0006589) octopamine metabolic process(GO:0046333) |
| 0.2 | 0.9 | GO:0035802 | adrenal cortex development(GO:0035801) adrenal cortex formation(GO:0035802) |
| 0.2 | 9.8 | GO:0048791 | calcium ion-regulated exocytosis of neurotransmitter(GO:0048791) |
| 0.2 | 1.1 | GO:0015808 | L-alanine transport(GO:0015808) |
| 0.2 | 2.5 | GO:0042473 | outer ear morphogenesis(GO:0042473) |
| 0.2 | 1.8 | GO:0034141 | positive regulation of toll-like receptor 3 signaling pathway(GO:0034141) |
| 0.2 | 3.6 | GO:0050849 | negative regulation of calcium-mediated signaling(GO:0050849) |
| 0.2 | 6.7 | GO:0006691 | leukotriene metabolic process(GO:0006691) |
| 0.2 | 1.1 | GO:0051464 | positive regulation of cortisol secretion(GO:0051464) |
| 0.2 | 0.9 | GO:0060399 | positive regulation of growth hormone receptor signaling pathway(GO:0060399) |
| 0.2 | 4.9 | GO:0071625 | vocalization behavior(GO:0071625) |
| 0.2 | 3.4 | GO:0030223 | neutrophil differentiation(GO:0030223) |
| 0.2 | 9.1 | GO:0071260 | cellular response to mechanical stimulus(GO:0071260) |
| 0.2 | 1.7 | GO:0060594 | neural crest formation(GO:0014029) mammary gland specification(GO:0060594) |
| 0.2 | 0.8 | GO:1904016 | regulation of glycolytic process by negative regulation of transcription from RNA polymerase II promoter(GO:0072362) regulation of lipid transport by negative regulation of transcription from RNA polymerase II promoter(GO:0072368) response to Thyroglobulin triiodothyronine(GO:1904016) cellular response to Thyroglobulin triiodothyronine(GO:1904017) |
| 0.2 | 2.3 | GO:0007320 | insemination(GO:0007320) |
| 0.2 | 0.6 | GO:0035754 | B cell chemotaxis(GO:0035754) |
| 0.2 | 4.7 | GO:0001964 | startle response(GO:0001964) |
| 0.2 | 2.6 | GO:2000465 | regulation of glycogen (starch) synthase activity(GO:2000465) |
| 0.2 | 1.0 | GO:0048619 | embryonic hindgut morphogenesis(GO:0048619) |
| 0.2 | 4.6 | GO:0035563 | positive regulation of chromatin binding(GO:0035563) |
| 0.2 | 0.6 | GO:0043382 | defense response to nematode(GO:0002215) positive regulation of memory T cell differentiation(GO:0043382) |
| 0.2 | 0.8 | GO:0051584 | dopamine uptake involved in synaptic transmission(GO:0051583) regulation of dopamine uptake involved in synaptic transmission(GO:0051584) catecholamine uptake involved in synaptic transmission(GO:0051934) regulation of catecholamine uptake involved in synaptic transmission(GO:0051940) |
| 0.2 | 1.0 | GO:0038026 | reelin-mediated signaling pathway(GO:0038026) |
| 0.2 | 0.8 | GO:0003344 | pericardium morphogenesis(GO:0003344) |
| 0.2 | 0.8 | GO:0051533 | positive regulation of NFAT protein import into nucleus(GO:0051533) |
| 0.2 | 8.5 | GO:0097031 | NADH dehydrogenase complex assembly(GO:0010257) mitochondrial respiratory chain complex I assembly(GO:0032981) mitochondrial respiratory chain complex I biogenesis(GO:0097031) |
| 0.2 | 37.0 | GO:0007050 | cell cycle arrest(GO:0007050) |
| 0.2 | 1.9 | GO:0097368 | establishment of Sertoli cell barrier(GO:0097368) |
| 0.2 | 3.0 | GO:0070884 | regulation of calcineurin-NFAT signaling cascade(GO:0070884) |
| 0.2 | 0.7 | GO:0061056 | sclerotome development(GO:0061056) |
| 0.2 | 3.1 | GO:2000463 | positive regulation of excitatory postsynaptic potential(GO:2000463) |
| 0.2 | 2.4 | GO:0007252 | I-kappaB phosphorylation(GO:0007252) |
| 0.2 | 3.1 | GO:1902170 | cellular response to reactive nitrogen species(GO:1902170) |
| 0.2 | 0.9 | GO:0090168 | Golgi reassembly(GO:0090168) |
| 0.2 | 1.2 | GO:0072344 | rescue of stalled ribosome(GO:0072344) |
| 0.2 | 1.6 | GO:0035726 | common myeloid progenitor cell proliferation(GO:0035726) |
| 0.2 | 0.8 | GO:0014028 | notochord formation(GO:0014028) |
| 0.2 | 1.2 | GO:0010807 | regulation of synaptic vesicle priming(GO:0010807) |
| 0.2 | 6.8 | GO:0002474 | antigen processing and presentation of peptide antigen via MHC class I(GO:0002474) |
| 0.2 | 2.0 | GO:0060371 | regulation of atrial cardiac muscle cell membrane depolarization(GO:0060371) |
| 0.2 | 1.8 | GO:0015691 | cadmium ion transport(GO:0015691) cadmium ion transmembrane transport(GO:0070574) |
| 0.2 | 0.5 | GO:0007181 | transforming growth factor beta receptor complex assembly(GO:0007181) |
| 0.2 | 2.1 | GO:0048280 | vesicle fusion with Golgi apparatus(GO:0048280) |
| 0.2 | 7.3 | GO:0051353 | positive regulation of oxidoreductase activity(GO:0051353) |
| 0.2 | 1.7 | GO:0061469 | regulation of type B pancreatic cell proliferation(GO:0061469) |
| 0.2 | 0.8 | GO:0099558 | maintenance of synapse structure(GO:0099558) |
| 0.2 | 2.2 | GO:0033173 | calcineurin-NFAT signaling cascade(GO:0033173) |
| 0.2 | 5.3 | GO:0010596 | negative regulation of endothelial cell migration(GO:0010596) |
| 0.2 | 0.9 | GO:1901580 | post-embryonic appendage morphogenesis(GO:0035120) post-embryonic limb morphogenesis(GO:0035127) post-embryonic forelimb morphogenesis(GO:0035128) telomeric repeat-containing RNA transcription(GO:0097393) telomeric repeat-containing RNA transcription from RNA pol II promoter(GO:0097394) regulation of telomeric RNA transcription from RNA pol II promoter(GO:1901580) negative regulation of telomeric RNA transcription from RNA pol II promoter(GO:1901581) positive regulation of telomeric RNA transcription from RNA pol II promoter(GO:1901582) |
| 0.2 | 3.0 | GO:0036342 | post-anal tail morphogenesis(GO:0036342) |
| 0.2 | 2.3 | GO:2000311 | regulation of alpha-amino-3-hydroxy-5-methyl-4-isoxazole propionate selective glutamate receptor activity(GO:2000311) |
| 0.2 | 0.9 | GO:0033140 | negative regulation of peptidyl-serine phosphorylation of STAT protein(GO:0033140) |
| 0.2 | 3.2 | GO:0061036 | positive regulation of cartilage development(GO:0061036) |
| 0.1 | 8.4 | GO:0006695 | cholesterol biosynthetic process(GO:0006695) |
| 0.1 | 4.0 | GO:0097120 | receptor localization to synapse(GO:0097120) |
| 0.1 | 1.5 | GO:0035021 | negative regulation of Rac protein signal transduction(GO:0035021) |
| 0.1 | 2.0 | GO:0021520 | spinal cord motor neuron cell fate specification(GO:0021520) |
| 0.1 | 0.6 | GO:0044332 | Wnt signaling pathway involved in dorsal/ventral axis specification(GO:0044332) |
| 0.1 | 1.6 | GO:0008627 | intrinsic apoptotic signaling pathway in response to osmotic stress(GO:0008627) |
| 0.1 | 1.8 | GO:0051694 | pointed-end actin filament capping(GO:0051694) |
| 0.1 | 3.3 | GO:0001573 | ganglioside metabolic process(GO:0001573) |
| 0.1 | 1.6 | GO:0043144 | snoRNA processing(GO:0043144) |
| 0.1 | 2.9 | GO:0055012 | ventricular cardiac muscle cell differentiation(GO:0055012) |
| 0.1 | 0.8 | GO:0045059 | positive thymic T cell selection(GO:0045059) |
| 0.1 | 3.1 | GO:0030574 | collagen catabolic process(GO:0030574) |
| 0.1 | 1.4 | GO:2000303 | regulation of ceramide biosynthetic process(GO:2000303) |
| 0.1 | 0.3 | GO:0002125 | maternal aggressive behavior(GO:0002125) |
| 0.1 | 5.0 | GO:0031146 | SCF-dependent proteasomal ubiquitin-dependent protein catabolic process(GO:0031146) |
| 0.1 | 0.9 | GO:1901909 | diphosphoinositol polyphosphate metabolic process(GO:0071543) diadenosine pentaphosphate metabolic process(GO:1901906) diadenosine pentaphosphate catabolic process(GO:1901907) diadenosine hexaphosphate metabolic process(GO:1901908) diadenosine hexaphosphate catabolic process(GO:1901909) adenosine 5'-(hexahydrogen pentaphosphate) metabolic process(GO:1901910) adenosine 5'-(hexahydrogen pentaphosphate) catabolic process(GO:1901911) |
| 0.1 | 2.8 | GO:0046339 | diacylglycerol metabolic process(GO:0046339) |
| 0.1 | 0.8 | GO:0090343 | positive regulation of cell aging(GO:0090343) positive regulation of cellular senescence(GO:2000774) |
| 0.1 | 0.9 | GO:1990034 | calcium ion export from cell(GO:1990034) |
| 0.1 | 4.5 | GO:0035115 | embryonic forelimb morphogenesis(GO:0035115) |
| 0.1 | 0.5 | GO:1903575 | cornified envelope assembly(GO:1903575) |
| 0.1 | 1.6 | GO:0003413 | chondrocyte differentiation involved in endochondral bone morphogenesis(GO:0003413) |
| 0.1 | 0.6 | GO:0007198 | adenylate cyclase-inhibiting serotonin receptor signaling pathway(GO:0007198) |
| 0.1 | 6.9 | GO:0048663 | neuron fate commitment(GO:0048663) |
| 0.1 | 2.7 | GO:0060218 | hematopoietic stem cell differentiation(GO:0060218) |
| 0.1 | 0.7 | GO:0035507 | regulation of myosin-light-chain-phosphatase activity(GO:0035507) |
| 0.1 | 1.7 | GO:0000188 | inactivation of MAPK activity(GO:0000188) |
| 0.1 | 2.6 | GO:0008206 | bile acid metabolic process(GO:0008206) |
| 0.1 | 1.0 | GO:0031119 | tRNA pseudouridine synthesis(GO:0031119) |
| 0.1 | 1.7 | GO:0030388 | fructose 1,6-bisphosphate metabolic process(GO:0030388) |
| 0.1 | 0.4 | GO:0090290 | positive regulation of osteoclast proliferation(GO:0090290) |
| 0.1 | 1.1 | GO:1904262 | negative regulation of TORC1 signaling(GO:1904262) |
| 0.1 | 0.3 | GO:2000821 | regulation of grooming behavior(GO:2000821) |
| 0.1 | 1.3 | GO:0061029 | eyelid development in camera-type eye(GO:0061029) |
| 0.1 | 0.6 | GO:0005513 | detection of calcium ion(GO:0005513) |
| 0.1 | 1.8 | GO:0046475 | glycerophospholipid catabolic process(GO:0046475) |
| 0.1 | 0.5 | GO:0001830 | trophectodermal cell fate commitment(GO:0001830) |
| 0.1 | 1.7 | GO:0000338 | protein deneddylation(GO:0000338) |
| 0.1 | 3.1 | GO:0001921 | positive regulation of receptor recycling(GO:0001921) |
| 0.1 | 0.9 | GO:0060052 | neurofilament cytoskeleton organization(GO:0060052) |
| 0.1 | 3.6 | GO:0009268 | response to pH(GO:0009268) |
| 0.1 | 4.8 | GO:1902476 | chloride transmembrane transport(GO:1902476) |
| 0.1 | 1.9 | GO:0090023 | positive regulation of neutrophil chemotaxis(GO:0090023) |
| 0.1 | 0.4 | GO:2000360 | negative regulation of binding of sperm to zona pellucida(GO:2000360) |
| 0.1 | 1.3 | GO:0043248 | proteasome assembly(GO:0043248) |
| 0.1 | 0.9 | GO:0050884 | neuromuscular process controlling posture(GO:0050884) |
| 0.1 | 1.2 | GO:0046716 | muscle cell cellular homeostasis(GO:0046716) |
| 0.1 | 5.0 | GO:0032024 | positive regulation of insulin secretion(GO:0032024) |
| 0.1 | 1.1 | GO:0051026 | chiasma assembly(GO:0051026) |
| 0.1 | 0.6 | GO:0089711 | L-glutamate transmembrane transport(GO:0089711) |
| 0.1 | 2.8 | GO:0045746 | negative regulation of Notch signaling pathway(GO:0045746) |
| 0.1 | 2.2 | GO:0006515 | misfolded or incompletely synthesized protein catabolic process(GO:0006515) |
| 0.1 | 1.1 | GO:0060065 | uterus development(GO:0060065) |
| 0.1 | 2.5 | GO:0042953 | lipoprotein transport(GO:0042953) lipoprotein localization(GO:0044872) |
| 0.1 | 2.1 | GO:0019068 | virion assembly(GO:0019068) |
| 0.1 | 1.2 | GO:0043984 | histone H4-K16 acetylation(GO:0043984) |
| 0.1 | 6.1 | GO:0051965 | positive regulation of synapse assembly(GO:0051965) |
| 0.1 | 0.1 | GO:1900454 | positive regulation of long term synaptic depression(GO:1900454) |
| 0.1 | 0.5 | GO:0035360 | positive regulation of peroxisome proliferator activated receptor signaling pathway(GO:0035360) |
| 0.1 | 1.1 | GO:0015747 | urate transport(GO:0015747) |
| 0.1 | 1.9 | GO:0060074 | synapse maturation(GO:0060074) |
| 0.1 | 2.6 | GO:0034629 | cellular protein complex localization(GO:0034629) |
| 0.1 | 5.1 | GO:0060021 | palate development(GO:0060021) |
| 0.1 | 2.6 | GO:0006904 | vesicle docking involved in exocytosis(GO:0006904) |
| 0.1 | 2.2 | GO:0018345 | protein palmitoylation(GO:0018345) |
| 0.1 | 5.3 | GO:0008033 | tRNA processing(GO:0008033) |
| 0.1 | 3.2 | GO:0006805 | xenobiotic metabolic process(GO:0006805) |
| 0.1 | 0.5 | GO:0031571 | mitotic G1 DNA damage checkpoint(GO:0031571) |
| 0.1 | 1.0 | GO:0033234 | negative regulation of protein sumoylation(GO:0033234) |
| 0.1 | 0.6 | GO:0031290 | retinal ganglion cell axon guidance(GO:0031290) |
| 0.1 | 1.7 | GO:0070536 | protein K63-linked deubiquitination(GO:0070536) |
| 0.1 | 21.9 | GO:0032259 | methylation(GO:0032259) |
| 0.1 | 0.3 | GO:0098703 | calcium ion import across plasma membrane(GO:0098703) calcium ion import into cell(GO:1990035) |
| 0.1 | 3.4 | GO:0006821 | chloride transport(GO:0006821) |
| 0.1 | 2.8 | GO:1901998 | toxin transport(GO:1901998) |
| 0.1 | 6.3 | GO:0007156 | homophilic cell adhesion via plasma membrane adhesion molecules(GO:0007156) |
| 0.1 | 2.2 | GO:0035773 | insulin secretion involved in cellular response to glucose stimulus(GO:0035773) |
| 0.1 | 4.4 | GO:0007200 | phospholipase C-activating G-protein coupled receptor signaling pathway(GO:0007200) |
| 0.1 | 5.1 | GO:0043473 | pigmentation(GO:0043473) |
| 0.1 | 0.9 | GO:0010719 | negative regulation of epithelial to mesenchymal transition(GO:0010719) |
| 0.1 | 1.6 | GO:0097320 | membrane tubulation(GO:0097320) |
| 0.1 | 2.6 | GO:0002088 | lens development in camera-type eye(GO:0002088) |
| 0.1 | 0.5 | GO:1903818 | positive regulation of voltage-gated potassium channel activity(GO:1903818) |
| 0.0 | 0.7 | GO:0051481 | negative regulation of cytosolic calcium ion concentration(GO:0051481) |
| 0.0 | 1.5 | GO:0008333 | endosome to lysosome transport(GO:0008333) |
| 0.0 | 1.2 | GO:0010800 | positive regulation of peptidyl-threonine phosphorylation(GO:0010800) |
| 0.0 | 1.1 | GO:0033198 | response to ATP(GO:0033198) |
| 0.0 | 0.2 | GO:0051005 | negative regulation of lipoprotein lipase activity(GO:0051005) |
| 0.0 | 0.9 | GO:0046519 | sphingoid metabolic process(GO:0046519) |
| 0.0 | 1.7 | GO:0008089 | anterograde axonal transport(GO:0008089) |
| 0.0 | 1.4 | GO:0006383 | transcription from RNA polymerase III promoter(GO:0006383) |
| 0.0 | 6.4 | GO:0009566 | fertilization(GO:0009566) |
| 0.0 | 1.6 | GO:0035690 | cellular response to drug(GO:0035690) |
| 0.0 | 0.4 | GO:0061302 | smooth muscle cell-matrix adhesion(GO:0061302) |
| 0.0 | 2.1 | GO:0015992 | proton transport(GO:0015992) |
| 0.0 | 1.2 | GO:0032012 | ARF protein signal transduction(GO:0032011) regulation of ARF protein signal transduction(GO:0032012) |
| 0.0 | 0.4 | GO:0048485 | sympathetic nervous system development(GO:0048485) |
| 0.0 | 1.5 | GO:0046579 | positive regulation of Ras protein signal transduction(GO:0046579) |
| 0.0 | 1.8 | GO:0030317 | sperm motility(GO:0030317) |
| 0.0 | 1.2 | GO:0050775 | positive regulation of dendrite morphogenesis(GO:0050775) |
| 0.0 | 0.3 | GO:0003334 | keratinocyte development(GO:0003334) |
| 0.0 | 0.2 | GO:1901409 | positive regulation of phosphorylation of RNA polymerase II C-terminal domain(GO:1901409) |
| 0.0 | 1.4 | GO:0007569 | cell aging(GO:0007569) |
| 0.0 | 0.0 | GO:0021603 | cranial nerve formation(GO:0021603) |
| 0.0 | 0.2 | GO:2000580 | regulation of ATP-dependent microtubule motor activity, plus-end-directed(GO:2000580) positive regulation of ATP-dependent microtubule motor activity, plus-end-directed(GO:2000582) |
| 0.0 | 0.4 | GO:0050910 | detection of mechanical stimulus involved in sensory perception of sound(GO:0050910) |
| 0.0 | 0.5 | GO:0048701 | embryonic cranial skeleton morphogenesis(GO:0048701) |
| 0.0 | 0.5 | GO:2000479 | regulation of cAMP-dependent protein kinase activity(GO:2000479) |
| 0.0 | 0.2 | GO:0046007 | negative regulation of activated T cell proliferation(GO:0046007) |
| 0.0 | 0.3 | GO:0015816 | glycine transport(GO:0015816) |
| 0.0 | 1.7 | GO:0055013 | cardiac muscle cell development(GO:0055013) |
| 0.0 | 1.7 | GO:0009582 | detection of abiotic stimulus(GO:0009582) |
| 0.0 | 0.4 | GO:0050650 | chondroitin sulfate proteoglycan biosynthetic process(GO:0050650) |
| 0.0 | 0.6 | GO:0048013 | ephrin receptor signaling pathway(GO:0048013) |
| 0.0 | 0.1 | GO:0006003 | fructose 2,6-bisphosphate metabolic process(GO:0006003) |
| 0.0 | 0.1 | GO:0016266 | O-glycan processing(GO:0016266) |
| 0.0 | 0.6 | GO:0043171 | peptide catabolic process(GO:0043171) |
| 0.0 | 0.4 | GO:0006613 | cotranslational protein targeting to membrane(GO:0006613) |
| 0.0 | 0.0 | GO:1900365 | cytoplasmic translational elongation(GO:0002182) regulation of cytoplasmic translational elongation(GO:1900247) negative regulation of cytoplasmic translational elongation(GO:1900248) positive regulation of mRNA polyadenylation(GO:1900365) |
| 0.0 | 2.6 | GO:0042787 | protein ubiquitination involved in ubiquitin-dependent protein catabolic process(GO:0042787) |
| 0.0 | 0.2 | GO:0007205 | protein kinase C-activating G-protein coupled receptor signaling pathway(GO:0007205) |
| 0.0 | 0.4 | GO:1903078 | positive regulation of protein localization to plasma membrane(GO:1903078) |
| 0.0 | 0.4 | GO:0015698 | inorganic anion transport(GO:0015698) |
| 0.0 | 3.9 | GO:0006470 | protein dephosphorylation(GO:0006470) |
Gene overrepresentation in cellular component category:
| Log-likelihood per target | Total log-likelihood | Term | Description |
|---|---|---|---|
| 17.8 | 53.3 | GO:0070195 | growth hormone receptor complex(GO:0070195) |
| 9.0 | 90.1 | GO:0042567 | insulin-like growth factor ternary complex(GO:0042567) |
| 4.3 | 34.0 | GO:0032937 | SREBP-SCAP-Insig complex(GO:0032937) |
| 4.1 | 57.4 | GO:0042612 | MHC class I protein complex(GO:0042612) |
| 3.1 | 9.2 | GO:1990630 | IRE1-RACK1-PP2A complex(GO:1990630) |
| 2.9 | 8.6 | GO:0061474 | phagolysosome membrane(GO:0061474) |
| 2.6 | 7.8 | GO:0036488 | CHOP-C/EBP complex(GO:0036488) |
| 2.3 | 16.2 | GO:0005785 | signal recognition particle receptor complex(GO:0005785) |
| 2.3 | 36.1 | GO:0097418 | neurofibrillary tangle(GO:0097418) |
| 1.7 | 25.5 | GO:0034663 | endoplasmic reticulum chaperone complex(GO:0034663) |
| 1.6 | 16.4 | GO:0044214 | spanning component of plasma membrane(GO:0044214) spanning component of membrane(GO:0089717) |
| 1.6 | 6.2 | GO:0034686 | integrin alphav-beta8 complex(GO:0034686) |
| 1.3 | 4.0 | GO:0060187 | cell pole(GO:0060187) |
| 1.1 | 13.3 | GO:0042613 | MHC class II protein complex(GO:0042613) |
| 1.0 | 3.1 | GO:0043291 | RAVE complex(GO:0043291) |
| 1.0 | 5.2 | GO:0038039 | G-protein coupled receptor heterodimeric complex(GO:0038039) |
| 1.0 | 3.9 | GO:0031417 | NatC complex(GO:0031417) |
| 0.9 | 8.3 | GO:1990357 | terminal web(GO:1990357) |
| 0.8 | 3.1 | GO:1990604 | IRE1-TRAF2-ASK1 complex(GO:1990604) |
| 0.8 | 9.0 | GO:0016011 | dystroglycan complex(GO:0016011) |
| 0.7 | 16.9 | GO:0008074 | guanylate cyclase complex, soluble(GO:0008074) |
| 0.7 | 3.9 | GO:0042719 | mitochondrial intermembrane space protein transporter complex(GO:0042719) |
| 0.6 | 1.9 | GO:0042720 | mitochondrial inner membrane peptidase complex(GO:0042720) |
| 0.6 | 2.5 | GO:0002189 | ribose phosphate diphosphokinase complex(GO:0002189) |
| 0.6 | 9.7 | GO:0032580 | Golgi cisterna membrane(GO:0032580) |
| 0.6 | 8.9 | GO:0000276 | mitochondrial proton-transporting ATP synthase complex, coupling factor F(o)(GO:0000276) |
| 0.5 | 5.6 | GO:0005664 | origin recognition complex(GO:0000808) nuclear origin of replication recognition complex(GO:0005664) |
| 0.5 | 11.6 | GO:0005640 | nuclear outer membrane(GO:0005640) |
| 0.5 | 7.3 | GO:0030877 | beta-catenin destruction complex(GO:0030877) |
| 0.5 | 1.4 | GO:1902560 | GMP reductase complex(GO:1902560) |
| 0.5 | 6.8 | GO:0070852 | cell body fiber(GO:0070852) |
| 0.4 | 4.9 | GO:0002177 | manchette(GO:0002177) |
| 0.4 | 1.7 | GO:0005745 | m-AAA complex(GO:0005745) |
| 0.4 | 10.0 | GO:0071564 | npBAF complex(GO:0071564) |
| 0.4 | 5.0 | GO:0044322 | endoplasmic reticulum quality control compartment(GO:0044322) |
| 0.4 | 1.5 | GO:1990795 | lateral part of cell(GO:0097574) basolateral part of cell(GO:1990794) rod bipolar cell terminal bouton(GO:1990795) |
| 0.4 | 4.9 | GO:0072546 | ER membrane protein complex(GO:0072546) |
| 0.4 | 4.9 | GO:0005883 | neurofilament(GO:0005883) |
| 0.4 | 2.2 | GO:0005899 | insulin receptor complex(GO:0005899) |
| 0.4 | 6.1 | GO:0048787 | presynaptic active zone membrane(GO:0048787) |
| 0.4 | 3.5 | GO:0044354 | pinosome(GO:0044352) macropinosome(GO:0044354) |
| 0.3 | 6.9 | GO:0031528 | microvillus membrane(GO:0031528) |
| 0.3 | 1.6 | GO:0044307 | dendritic branch(GO:0044307) |
| 0.3 | 2.6 | GO:0005827 | polar microtubule(GO:0005827) |
| 0.3 | 8.4 | GO:1902710 | GABA receptor complex(GO:1902710) GABA-A receptor complex(GO:1902711) |
| 0.3 | 16.9 | GO:0030173 | integral component of Golgi membrane(GO:0030173) |
| 0.3 | 5.9 | GO:0005751 | mitochondrial respiratory chain complex IV(GO:0005751) |
| 0.3 | 1.5 | GO:0030868 | smooth endoplasmic reticulum membrane(GO:0030868) smooth endoplasmic reticulum part(GO:0097425) |
| 0.3 | 6.3 | GO:0005892 | acetylcholine-gated channel complex(GO:0005892) |
| 0.3 | 5.9 | GO:0031045 | dense core granule(GO:0031045) |
| 0.3 | 1.2 | GO:0070044 | synaptobrevin 2-SNAP-25-syntaxin-1a complex(GO:0070044) |
| 0.3 | 15.7 | GO:0005788 | endoplasmic reticulum lumen(GO:0005788) |
| 0.3 | 8.1 | GO:0005790 | smooth endoplasmic reticulum(GO:0005790) |
| 0.3 | 2.3 | GO:0098554 | cytoplasmic side of endoplasmic reticulum membrane(GO:0098554) |
| 0.3 | 7.1 | GO:0010369 | chromocenter(GO:0010369) |
| 0.3 | 7.8 | GO:0043218 | compact myelin(GO:0043218) |
| 0.2 | 3.5 | GO:0000812 | Swr1 complex(GO:0000812) |
| 0.2 | 0.9 | GO:0005587 | collagen type IV trimer(GO:0005587) network-forming collagen trimer(GO:0098642) collagen network(GO:0098645) basement membrane collagen trimer(GO:0098651) |
| 0.2 | 1.7 | GO:0031313 | extrinsic component of endosome membrane(GO:0031313) |
| 0.2 | 1.5 | GO:0070695 | FHF complex(GO:0070695) |
| 0.2 | 8.5 | GO:0043034 | costamere(GO:0043034) |
| 0.2 | 33.4 | GO:0005913 | cell-cell adherens junction(GO:0005913) |
| 0.2 | 1.8 | GO:0001940 | male pronucleus(GO:0001940) |
| 0.2 | 0.8 | GO:0043083 | synaptic cleft(GO:0043083) |
| 0.2 | 16.4 | GO:0009925 | basal plasma membrane(GO:0009925) |
| 0.2 | 1.4 | GO:0033588 | Elongator holoenzyme complex(GO:0033588) |
| 0.2 | 10.9 | GO:0009295 | nucleoid(GO:0009295) mitochondrial nucleoid(GO:0042645) |
| 0.2 | 1.1 | GO:0005713 | recombination nodule(GO:0005713) |
| 0.2 | 4.4 | GO:0001518 | voltage-gated sodium channel complex(GO:0001518) |
| 0.2 | 11.7 | GO:0005891 | voltage-gated calcium channel complex(GO:0005891) |
| 0.2 | 5.8 | GO:0042470 | melanosome(GO:0042470) pigment granule(GO:0048770) |
| 0.2 | 2.5 | GO:0032279 | asymmetric synapse(GO:0032279) |
| 0.2 | 0.5 | GO:0048179 | activin receptor complex(GO:0048179) |
| 0.2 | 2.1 | GO:0098839 | postsynaptic density membrane(GO:0098839) |
| 0.2 | 3.2 | GO:0032433 | filopodium tip(GO:0032433) |
| 0.2 | 0.8 | GO:0043625 | delta DNA polymerase complex(GO:0043625) |
| 0.2 | 0.5 | GO:0034680 | integrin alpha10-beta1 complex(GO:0034680) |
| 0.2 | 0.9 | GO:0031233 | intrinsic component of external side of plasma membrane(GO:0031233) |
| 0.2 | 0.9 | GO:1990421 | subtelomeric heterochromatin(GO:1990421) nuclear subtelomeric heterochromatin(GO:1990707) |
| 0.2 | 7.4 | GO:0032281 | AMPA glutamate receptor complex(GO:0032281) |
| 0.2 | 5.2 | GO:0000159 | protein phosphatase type 2A complex(GO:0000159) |
| 0.1 | 0.4 | GO:0060473 | cortical granule(GO:0060473) |
| 0.1 | 3.2 | GO:0030057 | desmosome(GO:0030057) |
| 0.1 | 10.0 | GO:0016529 | sarcoplasmic reticulum(GO:0016529) |
| 0.1 | 1.6 | GO:0031264 | death-inducing signaling complex(GO:0031264) |
| 0.1 | 0.5 | GO:0070722 | Tle3-Aes complex(GO:0070722) |
| 0.1 | 1.5 | GO:0008541 | proteasome regulatory particle, lid subcomplex(GO:0008541) |
| 0.1 | 2.3 | GO:0005652 | nuclear lamina(GO:0005652) |
| 0.1 | 3.1 | GO:0034451 | centriolar satellite(GO:0034451) |
| 0.1 | 2.6 | GO:0034704 | calcium channel complex(GO:0034704) |
| 0.1 | 4.1 | GO:0031307 | integral component of mitochondrial outer membrane(GO:0031307) |
| 0.1 | 3.9 | GO:0048786 | presynaptic active zone(GO:0048786) |
| 0.1 | 1.8 | GO:0097512 | cardiac myofibril(GO:0097512) |
| 0.1 | 2.1 | GO:0030914 | STAGA complex(GO:0030914) |
| 0.1 | 8.5 | GO:0005791 | rough endoplasmic reticulum(GO:0005791) |
| 0.1 | 0.7 | GO:0090571 | RNA polymerase II transcription repressor complex(GO:0090571) |
| 0.1 | 9.3 | GO:0005905 | clathrin-coated pit(GO:0005905) |
| 0.1 | 3.4 | GO:0030660 | Golgi-associated vesicle membrane(GO:0030660) |
| 0.1 | 6.4 | GO:0046658 | anchored component of plasma membrane(GO:0046658) |
| 0.1 | 22.4 | GO:0005777 | peroxisome(GO:0005777) microbody(GO:0042579) |
| 0.1 | 2.2 | GO:0097386 | glial cell projection(GO:0097386) |
| 0.1 | 1.3 | GO:0044666 | MLL3/4 complex(GO:0044666) |
| 0.1 | 1.6 | GO:0036056 | filtration diaphragm(GO:0036056) slit diaphragm(GO:0036057) |
| 0.1 | 1.6 | GO:0034045 | pre-autophagosomal structure membrane(GO:0034045) |
| 0.1 | 4.5 | GO:0030315 | T-tubule(GO:0030315) |
| 0.1 | 0.4 | GO:1990696 | USH2 complex(GO:1990696) |
| 0.1 | 5.6 | GO:0045171 | intercellular bridge(GO:0045171) |
| 0.1 | 1.1 | GO:0005614 | interstitial matrix(GO:0005614) |
| 0.1 | 0.6 | GO:0072487 | MSL complex(GO:0072487) |
| 0.1 | 14.5 | GO:0043679 | axon terminus(GO:0043679) |
| 0.1 | 4.2 | GO:0001772 | immunological synapse(GO:0001772) |
| 0.1 | 4.3 | GO:0005902 | microvillus(GO:0005902) |
| 0.1 | 1.0 | GO:0030285 | integral component of synaptic vesicle membrane(GO:0030285) intrinsic component of synaptic vesicle membrane(GO:0098563) |
| 0.1 | 4.4 | GO:0043198 | dendritic shaft(GO:0043198) |
| 0.1 | 0.8 | GO:0042105 | alpha-beta T cell receptor complex(GO:0042105) |
| 0.1 | 1.3 | GO:0042734 | presynaptic membrane(GO:0042734) |
| 0.1 | 17.0 | GO:0045211 | postsynaptic membrane(GO:0045211) |
| 0.1 | 17.7 | GO:0043235 | receptor complex(GO:0043235) |
| 0.1 | 2.5 | GO:0035869 | ciliary transition zone(GO:0035869) |
| 0.1 | 1.1 | GO:0031527 | filopodium membrane(GO:0031527) |
| 0.1 | 0.8 | GO:0036156 | inner dynein arm(GO:0036156) |
| 0.1 | 1.4 | GO:0005666 | DNA-directed RNA polymerase III complex(GO:0005666) |
| 0.1 | 2.8 | GO:0035861 | site of double-strand break(GO:0035861) |
| 0.0 | 0.1 | GO:0043540 | 6-phosphofructo-2-kinase/fructose-2,6-biphosphatase complex(GO:0043540) |
| 0.0 | 7.0 | GO:0005903 | brush border(GO:0005903) |
| 0.0 | 1.1 | GO:0000786 | nucleosome(GO:0000786) |
| 0.0 | 3.4 | GO:0031463 | Cul3-RING ubiquitin ligase complex(GO:0031463) |
| 0.0 | 5.7 | GO:0016323 | basolateral plasma membrane(GO:0016323) |
| 0.0 | 0.5 | GO:1990635 | proximal dendrite(GO:1990635) |
| 0.0 | 0.9 | GO:0035686 | sperm fibrous sheath(GO:0035686) |
| 0.0 | 4.2 | GO:0008021 | synaptic vesicle(GO:0008021) |
| 0.0 | 2.2 | GO:0030175 | filopodium(GO:0030175) |
| 0.0 | 0.5 | GO:0097546 | ciliary base(GO:0097546) |
| 0.0 | 1.4 | GO:0016592 | mediator complex(GO:0016592) |
| 0.0 | 1.6 | GO:0005684 | U2-type spliceosomal complex(GO:0005684) |
| 0.0 | 3.9 | GO:0005923 | bicellular tight junction(GO:0005923) |
| 0.0 | 3.6 | GO:0005770 | late endosome(GO:0005770) |
| 0.0 | 2.5 | GO:0055037 | recycling endosome(GO:0055037) |
| 0.0 | 0.9 | GO:0016235 | aggresome(GO:0016235) |
| 0.0 | 0.7 | GO:0034707 | chloride channel complex(GO:0034707) |
| 0.0 | 0.3 | GO:0097060 | synaptic membrane(GO:0097060) |
| 0.0 | 0.8 | GO:0005581 | collagen trimer(GO:0005581) |
| 0.0 | 15.9 | GO:0005815 | microtubule organizing center(GO:0005815) |
| 0.0 | 1.8 | GO:0005811 | lipid particle(GO:0005811) |
| 0.0 | 0.2 | GO:0008024 | cyclin/CDK positive transcription elongation factor complex(GO:0008024) |
| 0.0 | 0.6 | GO:0044665 | MLL1/2 complex(GO:0044665) MLL1 complex(GO:0071339) |
| 0.0 | 36.3 | GO:0005615 | extracellular space(GO:0005615) |
| 0.0 | 1.2 | GO:0000315 | organellar large ribosomal subunit(GO:0000315) mitochondrial large ribosomal subunit(GO:0005762) |
| 0.0 | 1.0 | GO:0000152 | nuclear ubiquitin ligase complex(GO:0000152) |
| 0.0 | 0.2 | GO:0000164 | protein phosphatase type 1 complex(GO:0000164) |
| 0.0 | 0.2 | GO:0005868 | cytoplasmic dynein complex(GO:0005868) |
Gene overrepresentation in molecular function category:
| Log-likelihood per target | Total log-likelihood | Term | Description |
|---|---|---|---|
| 18.5 | 55.4 | GO:0005009 | insulin-activated receptor activity(GO:0005009) |
| 17.8 | 53.3 | GO:0004903 | growth hormone receptor activity(GO:0004903) |
| 4.6 | 22.8 | GO:0047635 | L-alanine:2-oxoglutarate aminotransferase activity(GO:0004021) alanine-oxo-acid transaminase activity(GO:0047635) |
| 3.9 | 65.6 | GO:0030881 | beta-2-microglobulin binding(GO:0030881) |
| 3.6 | 17.8 | GO:0099609 | microtubule lateral binding(GO:0099609) |
| 3.0 | 21.0 | GO:0052650 | NADP-retinol dehydrogenase activity(GO:0052650) |
| 2.9 | 8.8 | GO:0016155 | formyltetrahydrofolate dehydrogenase activity(GO:0016155) |
| 2.8 | 16.9 | GO:0016941 | natriuretic peptide receptor activity(GO:0016941) |
| 2.5 | 12.5 | GO:0008427 | calcium-dependent protein kinase inhibitor activity(GO:0008427) |
| 2.3 | 7.0 | GO:0004613 | phosphoenolpyruvate carboxykinase activity(GO:0004611) phosphoenolpyruvate carboxykinase (GTP) activity(GO:0004613) |
| 2.2 | 13.3 | GO:0042289 | MHC class II protein binding(GO:0042289) |
| 2.2 | 21.6 | GO:0004886 | 9-cis retinoic acid receptor activity(GO:0004886) |
| 2.0 | 6.0 | GO:0033829 | O-fucosylpeptide 3-beta-N-acetylglucosaminyltransferase activity(GO:0033829) |
| 2.0 | 86.7 | GO:0005159 | insulin-like growth factor receptor binding(GO:0005159) |
| 1.9 | 11.5 | GO:0008142 | oxysterol binding(GO:0008142) |
| 1.8 | 46.2 | GO:0051787 | misfolded protein binding(GO:0051787) |
| 1.7 | 6.9 | GO:0045159 | myosin II binding(GO:0045159) |
| 1.7 | 10.2 | GO:0032810 | sterol response element binding(GO:0032810) |
| 1.5 | 4.5 | GO:0030350 | iron-responsive element binding(GO:0030350) 3 iron, 4 sulfur cluster binding(GO:0051538) |
| 1.5 | 4.4 | GO:0016492 | G-protein coupled neurotensin receptor activity(GO:0016492) |
| 1.4 | 26.0 | GO:0015245 | fatty acid transporter activity(GO:0015245) |
| 1.3 | 5.2 | GO:0000010 | trans-hexaprenyltranstransferase activity(GO:0000010) trans-octaprenyltranstransferase activity(GO:0050347) |
| 1.3 | 5.1 | GO:0042392 | sphingosine-1-phosphate phosphatase activity(GO:0042392) |
| 1.2 | 6.2 | GO:1990430 | extracellular matrix protein binding(GO:1990430) |
| 1.2 | 30.9 | GO:0019825 | oxygen binding(GO:0019825) |
| 1.2 | 7.3 | GO:0016721 | superoxide dismutase activity(GO:0004784) oxidoreductase activity, acting on superoxide radicals as acceptor(GO:0016721) |
| 1.1 | 5.4 | GO:0004528 | phosphodiesterase I activity(GO:0004528) |
| 1.1 | 16.0 | GO:0019911 | structural constituent of myelin sheath(GO:0019911) |
| 0.9 | 5.7 | GO:0004095 | carnitine O-palmitoyltransferase activity(GO:0004095) O-palmitoyltransferase activity(GO:0016416) |
| 0.9 | 2.8 | GO:0004560 | alpha-L-fucosidase activity(GO:0004560) fucosidase activity(GO:0015928) |
| 0.9 | 8.2 | GO:0016812 | hydrolase activity, acting on carbon-nitrogen (but not peptide) bonds, in cyclic amides(GO:0016812) |
| 0.9 | 2.6 | GO:0008775 | acetate CoA-transferase activity(GO:0008775) |
| 0.9 | 5.2 | GO:0004965 | G-protein coupled GABA receptor activity(GO:0004965) |
| 0.8 | 5.1 | GO:0015220 | choline transmembrane transporter activity(GO:0015220) |
| 0.8 | 8.1 | GO:0050291 | sphingosine N-acyltransferase activity(GO:0050291) |
| 0.8 | 2.4 | GO:0086062 | voltage-gated sodium channel activity involved in Purkinje myocyte action potential(GO:0086062) |
| 0.8 | 15.9 | GO:0004745 | retinol dehydrogenase activity(GO:0004745) |
| 0.8 | 5.6 | GO:0042895 | antibiotic transporter activity(GO:0042895) |
| 0.8 | 6.3 | GO:0004065 | arylsulfatase activity(GO:0004065) |
| 0.7 | 5.2 | GO:0031849 | olfactory receptor binding(GO:0031849) |
| 0.7 | 2.2 | GO:0030158 | protein xylosyltransferase activity(GO:0030158) |
| 0.7 | 2.9 | GO:0008332 | low voltage-gated calcium channel activity(GO:0008332) |
| 0.7 | 5.1 | GO:0004035 | alkaline phosphatase activity(GO:0004035) |
| 0.7 | 2.1 | GO:0001639 | PLC activating G-protein coupled glutamate receptor activity(GO:0001639) G-protein coupled receptor activity involved in regulation of postsynaptic membrane potential(GO:0099530) |
| 0.7 | 4.1 | GO:0015232 | heme transporter activity(GO:0015232) |
| 0.7 | 4.0 | GO:0043533 | inositol 1,3,4,5 tetrakisphosphate binding(GO:0043533) |
| 0.6 | 7.1 | GO:0070053 | thrombospondin receptor activity(GO:0070053) |
| 0.6 | 3.8 | GO:0003828 | alpha-N-acetylneuraminate alpha-2,8-sialyltransferase activity(GO:0003828) |
| 0.6 | 3.1 | GO:0086008 | voltage-gated potassium channel activity involved in cardiac muscle cell action potential repolarization(GO:0086008) |
| 0.6 | 25.3 | GO:0015020 | glucuronosyltransferase activity(GO:0015020) |
| 0.6 | 2.5 | GO:0004749 | ribose phosphate diphosphokinase activity(GO:0004749) |
| 0.6 | 7.2 | GO:0001162 | RNA polymerase II intronic transcription regulatory region sequence-specific DNA binding(GO:0001162) |
| 0.6 | 2.3 | GO:2001070 | starch binding(GO:2001070) |
| 0.6 | 11.3 | GO:0002162 | dystroglycan binding(GO:0002162) |
| 0.6 | 0.6 | GO:0030156 | benzodiazepine receptor binding(GO:0030156) |
| 0.5 | 2.2 | GO:0004176 | ATP-dependent peptidase activity(GO:0004176) |
| 0.5 | 3.7 | GO:0004782 | sulfinoalanine decarboxylase activity(GO:0004782) |
| 0.5 | 2.1 | GO:0004995 | tachykinin receptor activity(GO:0004995) |
| 0.5 | 2.1 | GO:0004052 | arachidonate 12-lipoxygenase activity(GO:0004052) |
| 0.5 | 4.2 | GO:0060072 | large conductance calcium-activated potassium channel activity(GO:0060072) |
| 0.5 | 2.6 | GO:2001069 | glycogen binding(GO:2001069) |
| 0.5 | 1.6 | GO:0016005 | phospholipase A2 activator activity(GO:0016005) |
| 0.5 | 4.6 | GO:0031995 | insulin-like growth factor II binding(GO:0031995) |
| 0.5 | 7.1 | GO:0070097 | delta-catenin binding(GO:0070097) |
| 0.5 | 4.5 | GO:0004126 | cytidine deaminase activity(GO:0004126) |
| 0.5 | 0.5 | GO:0017002 | activin receptor activity, type I(GO:0016361) activin-activated receptor activity(GO:0017002) |
| 0.5 | 1.4 | GO:0017099 | very-long-chain-acyl-CoA dehydrogenase activity(GO:0017099) |
| 0.5 | 2.9 | GO:0035877 | death effector domain binding(GO:0035877) |
| 0.5 | 8.9 | GO:0046933 | proton-transporting ATP synthase activity, rotational mechanism(GO:0046933) |
| 0.5 | 1.4 | GO:0003920 | GMP reductase activity(GO:0003920) oxidoreductase activity, acting on NAD(P)H, nitrogenous group as acceptor(GO:0016657) |
| 0.4 | 1.8 | GO:0005134 | interleukin-2 receptor binding(GO:0005134) |
| 0.4 | 3.1 | GO:0004090 | carbonyl reductase (NADPH) activity(GO:0004090) |
| 0.4 | 1.8 | GO:0005025 | transforming growth factor beta receptor activity, type I(GO:0005025) |
| 0.4 | 9.2 | GO:0034185 | apolipoprotein binding(GO:0034185) |
| 0.4 | 1.7 | GO:0016907 | G-protein coupled acetylcholine receptor activity(GO:0016907) |
| 0.4 | 15.3 | GO:0000062 | fatty-acyl-CoA binding(GO:0000062) |
| 0.4 | 3.4 | GO:0004726 | non-membrane spanning protein tyrosine phosphatase activity(GO:0004726) |
| 0.4 | 2.5 | GO:0004013 | adenosylhomocysteinase activity(GO:0004013) trialkylsulfonium hydrolase activity(GO:0016802) |
| 0.4 | 1.2 | GO:0051430 | corticotropin-releasing hormone receptor 1 binding(GO:0051430) |
| 0.4 | 5.7 | GO:0008190 | eukaryotic initiation factor 4E binding(GO:0008190) |
| 0.4 | 1.6 | GO:1904315 | transmitter-gated ion channel activity involved in regulation of postsynaptic membrane potential(GO:1904315) |
| 0.4 | 7.9 | GO:0042166 | acetylcholine-gated cation channel activity(GO:0022848) acetylcholine binding(GO:0042166) |
| 0.4 | 3.9 | GO:0008093 | cytoskeletal adaptor activity(GO:0008093) |
| 0.4 | 20.0 | GO:0071837 | HMG box domain binding(GO:0071837) |
| 0.4 | 32.8 | GO:0005507 | copper ion binding(GO:0005507) |
| 0.4 | 1.5 | GO:0072320 | volume-sensitive chloride channel activity(GO:0072320) |
| 0.4 | 1.1 | GO:0005302 | L-tyrosine transmembrane transporter activity(GO:0005302) |
| 0.4 | 2.2 | GO:0008467 | [heparan sulfate]-glucosamine 3-sulfotransferase 1 activity(GO:0008467) |
| 0.4 | 3.3 | GO:0015386 | potassium:proton antiporter activity(GO:0015386) |
| 0.4 | 3.3 | GO:0015467 | G-protein activated inward rectifier potassium channel activity(GO:0015467) |
| 0.4 | 11.1 | GO:0042975 | peroxisome proliferator activated receptor binding(GO:0042975) |
| 0.4 | 3.2 | GO:0035251 | UDP-glucosyltransferase activity(GO:0035251) |
| 0.4 | 24.3 | GO:0008395 | steroid hydroxylase activity(GO:0008395) |
| 0.3 | 6.6 | GO:0008239 | dipeptidyl-peptidase activity(GO:0008239) |
| 0.3 | 3.4 | GO:0022851 | GABA-gated chloride ion channel activity(GO:0022851) |
| 0.3 | 7.5 | GO:0042043 | neurexin family protein binding(GO:0042043) |
| 0.3 | 2.4 | GO:0097603 | temperature-gated ion channel activity(GO:0097603) |
| 0.3 | 20.8 | GO:0046875 | ephrin receptor binding(GO:0046875) |
| 0.3 | 3.0 | GO:0008597 | calcium-dependent protein serine/threonine phosphatase regulator activity(GO:0008597) |
| 0.3 | 1.7 | GO:0005173 | stem cell factor receptor binding(GO:0005173) |
| 0.3 | 10.0 | GO:0005337 | nucleoside transmembrane transporter activity(GO:0005337) |
| 0.3 | 7.9 | GO:0003841 | 1-acylglycerol-3-phosphate O-acyltransferase activity(GO:0003841) |
| 0.3 | 10.0 | GO:0005251 | delayed rectifier potassium channel activity(GO:0005251) |
| 0.3 | 5.0 | GO:1904264 | ubiquitin protein ligase activity involved in ERAD pathway(GO:1904264) |
| 0.3 | 2.8 | GO:0034711 | inhibin binding(GO:0034711) |
| 0.3 | 8.6 | GO:0010485 | H4 histone acetyltransferase activity(GO:0010485) |
| 0.3 | 16.2 | GO:0061631 | ubiquitin conjugating enzyme activity(GO:0061631) |
| 0.3 | 1.8 | GO:0051575 | 5'-deoxyribose-5-phosphate lyase activity(GO:0051575) |
| 0.3 | 7.4 | GO:0000030 | mannosyltransferase activity(GO:0000030) |
| 0.3 | 5.8 | GO:0005161 | platelet-derived growth factor receptor binding(GO:0005161) |
| 0.3 | 20.0 | GO:0016627 | oxidoreductase activity, acting on the CH-CH group of donors(GO:0016627) |
| 0.3 | 0.6 | GO:0071936 | coreceptor activity involved in Wnt signaling pathway(GO:0071936) |
| 0.3 | 5.4 | GO:0051010 | microtubule plus-end binding(GO:0051010) |
| 0.3 | 9.7 | GO:0008376 | acetylgalactosaminyltransferase activity(GO:0008376) |
| 0.3 | 6.7 | GO:0015269 | calcium-activated potassium channel activity(GO:0015269) |
| 0.3 | 5.8 | GO:0051920 | peroxiredoxin activity(GO:0051920) |
| 0.3 | 4.4 | GO:0048018 | receptor agonist activity(GO:0048018) |
| 0.3 | 1.4 | GO:0008607 | phosphorylase kinase regulator activity(GO:0008607) |
| 0.3 | 2.2 | GO:0004865 | protein serine/threonine phosphatase inhibitor activity(GO:0004865) |
| 0.3 | 5.6 | GO:0042813 | Wnt-activated receptor activity(GO:0042813) |
| 0.3 | 4.5 | GO:0004143 | diacylglycerol kinase activity(GO:0004143) |
| 0.3 | 1.8 | GO:0070579 | methylcytosine dioxygenase activity(GO:0070579) |
| 0.3 | 2.3 | GO:0004723 | calcium-dependent protein serine/threonine phosphatase activity(GO:0004723) |
| 0.2 | 5.0 | GO:0016917 | GABA-A receptor activity(GO:0004890) GABA receptor activity(GO:0016917) |
| 0.2 | 5.6 | GO:0042605 | peptide antigen binding(GO:0042605) |
| 0.2 | 1.2 | GO:0004045 | aminoacyl-tRNA hydrolase activity(GO:0004045) |
| 0.2 | 3.6 | GO:0051525 | NFAT protein binding(GO:0051525) |
| 0.2 | 9.3 | GO:0008009 | chemokine activity(GO:0008009) |
| 0.2 | 1.4 | GO:0033188 | sphingomyelin synthase activity(GO:0033188) ceramide cholinephosphotransferase activity(GO:0047493) |
| 0.2 | 1.6 | GO:0097109 | neuroligin family protein binding(GO:0097109) |
| 0.2 | 1.2 | GO:0005483 | soluble NSF attachment protein activity(GO:0005483) |
| 0.2 | 6.2 | GO:0005540 | hyaluronic acid binding(GO:0005540) |
| 0.2 | 7.3 | GO:1905030 | voltage-gated ion channel activity involved in regulation of postsynaptic membrane potential(GO:1905030) |
| 0.2 | 5.9 | GO:0015002 | cytochrome-c oxidase activity(GO:0004129) heme-copper terminal oxidase activity(GO:0015002) oxidoreductase activity, acting on a heme group of donors, oxygen as acceptor(GO:0016676) |
| 0.2 | 11.0 | GO:0004683 | calmodulin-dependent protein kinase activity(GO:0004683) |
| 0.2 | 2.4 | GO:0005176 | ErbB-2 class receptor binding(GO:0005176) |
| 0.2 | 0.4 | GO:0030297 | transmembrane receptor protein tyrosine kinase activator activity(GO:0030297) |
| 0.2 | 0.8 | GO:0019828 | aspartic-type endopeptidase inhibitor activity(GO:0019828) |
| 0.2 | 1.2 | GO:0071532 | ankyrin repeat binding(GO:0071532) |
| 0.2 | 2.6 | GO:0045294 | alpha-catenin binding(GO:0045294) |
| 0.2 | 1.0 | GO:0005105 | type 1 fibroblast growth factor receptor binding(GO:0005105) |
| 0.2 | 1.2 | GO:0004645 | phosphorylase activity(GO:0004645) |
| 0.2 | 8.5 | GO:0016709 | oxidoreductase activity, acting on paired donors, with incorporation or reduction of molecular oxygen, NAD(P)H as one donor, and incorporation of one atom of oxygen(GO:0016709) |
| 0.2 | 8.3 | GO:0004115 | 3',5'-cyclic-AMP phosphodiesterase activity(GO:0004115) |
| 0.2 | 3.2 | GO:0042301 | phosphate ion binding(GO:0042301) |
| 0.2 | 2.7 | GO:0017151 | DEAD/H-box RNA helicase binding(GO:0017151) |
| 0.2 | 1.1 | GO:0004966 | galanin receptor activity(GO:0004966) |
| 0.2 | 4.4 | GO:0050431 | transforming growth factor beta binding(GO:0050431) |
| 0.2 | 0.9 | GO:0030549 | acetylcholine receptor activator activity(GO:0030549) |
| 0.2 | 1.1 | GO:0004985 | opioid receptor activity(GO:0004985) |
| 0.2 | 1.8 | GO:0008474 | palmitoyl-(protein) hydrolase activity(GO:0008474) palmitoyl hydrolase activity(GO:0098599) |
| 0.2 | 1.1 | GO:0015272 | ATP-activated inward rectifier potassium channel activity(GO:0015272) |
| 0.2 | 3.4 | GO:0005247 | voltage-gated chloride channel activity(GO:0005247) |
| 0.2 | 2.4 | GO:0071933 | Arp2/3 complex binding(GO:0071933) |
| 0.2 | 0.5 | GO:0098640 | integrin binding involved in cell-matrix adhesion(GO:0098640) |
| 0.2 | 2.8 | GO:0003951 | NAD+ kinase activity(GO:0003951) |
| 0.2 | 1.7 | GO:0004332 | fructose-bisphosphate aldolase activity(GO:0004332) |
| 0.2 | 7.0 | GO:0035255 | ionotropic glutamate receptor binding(GO:0035255) |
| 0.2 | 1.5 | GO:0005000 | vasopressin receptor activity(GO:0005000) |
| 0.2 | 0.3 | GO:0005280 | hydrogen:amino acid symporter activity(GO:0005280) |
| 0.2 | 19.8 | GO:0008013 | beta-catenin binding(GO:0008013) |
| 0.2 | 4.1 | GO:0016755 | transferase activity, transferring amino-acyl groups(GO:0016755) |
| 0.2 | 8.7 | GO:0001205 | transcriptional activator activity, RNA polymerase II distal enhancer sequence-specific binding(GO:0001205) |
| 0.2 | 1.5 | GO:0061133 | endopeptidase activator activity(GO:0061133) |
| 0.1 | 4.0 | GO:0015114 | phosphate ion transmembrane transporter activity(GO:0015114) |
| 0.1 | 2.9 | GO:0005149 | interleukin-1 receptor binding(GO:0005149) |
| 0.1 | 0.4 | GO:0070002 | glutamic-type peptidase activity(GO:0070002) |
| 0.1 | 1.6 | GO:0015280 | ligand-gated sodium channel activity(GO:0015280) |
| 0.1 | 4.4 | GO:0005184 | neuropeptide hormone activity(GO:0005184) |
| 0.1 | 2.5 | GO:0003688 | DNA replication origin binding(GO:0003688) |
| 0.1 | 1.6 | GO:0070679 | inositol 1,4,5 trisphosphate binding(GO:0070679) |
| 0.1 | 3.5 | GO:0005388 | calcium-transporting ATPase activity(GO:0005388) |
| 0.1 | 0.9 | GO:0015616 | DNA translocase activity(GO:0015616) |
| 0.1 | 0.9 | GO:0032027 | myosin light chain binding(GO:0032027) |
| 0.1 | 33.8 | GO:0008168 | methyltransferase activity(GO:0008168) |
| 0.1 | 0.9 | GO:0034431 | endopolyphosphatase activity(GO:0000298) diphosphoinositol-polyphosphate diphosphatase activity(GO:0008486) bis(5'-adenosyl)-hexaphosphatase activity(GO:0034431) bis(5'-adenosyl)-pentaphosphatase activity(GO:0034432) |
| 0.1 | 3.3 | GO:0047617 | acyl-CoA hydrolase activity(GO:0047617) |
| 0.1 | 2.2 | GO:0004791 | thioredoxin-disulfide reductase activity(GO:0004791) |
| 0.1 | 2.1 | GO:0038191 | neuropilin binding(GO:0038191) |
| 0.1 | 1.5 | GO:0017034 | Rap guanyl-nucleotide exchange factor activity(GO:0017034) |
| 0.1 | 7.1 | GO:0001105 | RNA polymerase II transcription coactivator activity(GO:0001105) |
| 0.1 | 0.8 | GO:0045499 | chemorepellent activity(GO:0045499) |
| 0.1 | 0.8 | GO:0031698 | beta-2 adrenergic receptor binding(GO:0031698) |
| 0.1 | 2.1 | GO:0008553 | hydrogen-exporting ATPase activity, phosphorylative mechanism(GO:0008553) |
| 0.1 | 2.4 | GO:0008510 | sodium:bicarbonate symporter activity(GO:0008510) |
| 0.1 | 5.6 | GO:0005245 | voltage-gated calcium channel activity(GO:0005245) |
| 0.1 | 7.0 | GO:0019213 | deacetylase activity(GO:0019213) |
| 0.1 | 16.2 | GO:0004725 | protein tyrosine phosphatase activity(GO:0004725) |
| 0.1 | 12.6 | GO:0004222 | metalloendopeptidase activity(GO:0004222) |
| 0.1 | 2.6 | GO:0005212 | structural constituent of eye lens(GO:0005212) |
| 0.1 | 0.5 | GO:0031628 | opioid receptor binding(GO:0031628) |
| 0.1 | 2.3 | GO:0017166 | vinculin binding(GO:0017166) |
| 0.1 | 1.7 | GO:0016500 | protein-hormone receptor activity(GO:0016500) |
| 0.1 | 8.1 | GO:0005546 | phosphatidylinositol-4,5-bisphosphate binding(GO:0005546) |
| 0.1 | 2.3 | GO:0000983 | transcription factor activity, RNA polymerase II core promoter sequence-specific(GO:0000983) |
| 0.1 | 1.0 | GO:0016861 | intramolecular oxidoreductase activity, interconverting aldoses and ketoses(GO:0016861) |
| 0.1 | 1.7 | GO:0005078 | MAP-kinase scaffold activity(GO:0005078) |
| 0.1 | 1.2 | GO:0001972 | retinoic acid binding(GO:0001972) |
| 0.1 | 1.6 | GO:0019855 | calcium channel inhibitor activity(GO:0019855) |
| 0.1 | 0.8 | GO:0070290 | N-acylphosphatidylethanolamine-specific phospholipase D activity(GO:0070290) |
| 0.1 | 0.3 | GO:0004694 | eukaryotic translation initiation factor 2alpha kinase activity(GO:0004694) |
| 0.1 | 1.6 | GO:0043274 | phospholipase binding(GO:0043274) |
| 0.1 | 0.3 | GO:0015275 | stretch-activated, cation-selective, calcium channel activity(GO:0015275) |
| 0.1 | 0.4 | GO:0004736 | pyruvate carboxylase activity(GO:0004736) |
| 0.1 | 0.6 | GO:0000099 | sulfur amino acid transmembrane transporter activity(GO:0000099) |
| 0.1 | 2.0 | GO:0017128 | phospholipid scramblase activity(GO:0017128) |
| 0.1 | 0.9 | GO:0005272 | sodium channel activity(GO:0005272) |
| 0.1 | 1.1 | GO:0030983 | mismatched DNA binding(GO:0030983) |
| 0.1 | 3.5 | GO:0000049 | tRNA binding(GO:0000049) |
| 0.1 | 7.0 | GO:0008080 | N-acetyltransferase activity(GO:0008080) |
| 0.1 | 1.3 | GO:0070628 | proteasome binding(GO:0070628) |
| 0.1 | 3.2 | GO:0005504 | fatty acid binding(GO:0005504) |
| 0.1 | 2.5 | GO:0030676 | Rac guanyl-nucleotide exchange factor activity(GO:0030676) |
| 0.1 | 1.1 | GO:1901702 | urate transmembrane transporter activity(GO:0015143) salt transmembrane transporter activity(GO:1901702) |
| 0.1 | 1.1 | GO:0004445 | inositol-polyphosphate 5-phosphatase activity(GO:0004445) inositol trisphosphate phosphatase activity(GO:0046030) |
| 0.1 | 0.2 | GO:0004489 | methylenetetrahydrofolate reductase (NAD(P)H) activity(GO:0004489) |
| 0.1 | 1.4 | GO:0008191 | metalloendopeptidase inhibitor activity(GO:0008191) |
| 0.1 | 3.6 | GO:0005070 | SH3/SH2 adaptor activity(GO:0005070) |
| 0.1 | 2.2 | GO:0019707 | protein-cysteine S-palmitoyltransferase activity(GO:0019706) protein-cysteine S-acyltransferase activity(GO:0019707) |
| 0.1 | 0.4 | GO:0005237 | inhibitory extracellular ligand-gated ion channel activity(GO:0005237) extracellular-glycine-gated ion channel activity(GO:0016933) extracellular-glycine-gated chloride channel activity(GO:0016934) |
| 0.1 | 3.0 | GO:0043015 | gamma-tubulin binding(GO:0043015) |
| 0.1 | 2.1 | GO:0004497 | monooxygenase activity(GO:0004497) |
| 0.1 | 1.0 | GO:0009982 | pseudouridine synthase activity(GO:0009982) |
| 0.1 | 1.1 | GO:0004435 | phosphatidylinositol phospholipase C activity(GO:0004435) |
| 0.1 | 2.5 | GO:0051959 | dynein light intermediate chain binding(GO:0051959) |
| 0.0 | 0.6 | GO:0051378 | serotonin binding(GO:0051378) |
| 0.0 | 2.2 | GO:0005044 | scavenger receptor activity(GO:0005044) |
| 0.0 | 0.7 | GO:0044548 | S100 protein binding(GO:0044548) |
| 0.0 | 1.6 | GO:0051019 | mitogen-activated protein kinase binding(GO:0051019) |
| 0.0 | 1.8 | GO:0005385 | zinc ion transmembrane transporter activity(GO:0005385) |
| 0.0 | 2.1 | GO:0031624 | ubiquitin conjugating enzyme binding(GO:0031624) |
| 0.0 | 1.1 | GO:0005104 | fibroblast growth factor receptor binding(GO:0005104) |
| 0.0 | 0.4 | GO:0038062 | protein tyrosine kinase collagen receptor activity(GO:0038062) |
| 0.0 | 0.1 | GO:0035252 | UDP-xylosyltransferase activity(GO:0035252) xylosyltransferase activity(GO:0042285) |
| 0.0 | 3.2 | GO:0004721 | phosphoprotein phosphatase activity(GO:0004721) |
| 0.0 | 5.3 | GO:0000149 | SNARE binding(GO:0000149) |
| 0.0 | 1.4 | GO:0005086 | ARF guanyl-nucleotide exchange factor activity(GO:0005086) |
| 0.0 | 1.9 | GO:0031491 | nucleosome binding(GO:0031491) |
| 0.0 | 3.4 | GO:0036459 | thiol-dependent ubiquitinyl hydrolase activity(GO:0036459) ubiquitinyl hydrolase activity(GO:0101005) |
| 0.0 | 0.6 | GO:0070006 | metalloaminopeptidase activity(GO:0070006) |
| 0.0 | 0.2 | GO:0097322 | 7SK snRNA binding(GO:0097322) |
| 0.0 | 3.8 | GO:0004386 | helicase activity(GO:0004386) |
| 0.0 | 0.8 | GO:0008157 | protein phosphatase 1 binding(GO:0008157) |
| 0.0 | 0.9 | GO:0097110 | scaffold protein binding(GO:0097110) |
| 0.0 | 3.2 | GO:0015293 | symporter activity(GO:0015293) |
| 0.0 | 1.6 | GO:0015103 | inorganic anion transmembrane transporter activity(GO:0015103) |
| 0.0 | 0.8 | GO:0043027 | cysteine-type endopeptidase inhibitor activity involved in apoptotic process(GO:0043027) |
| 0.0 | 5.7 | GO:0005549 | odorant binding(GO:0005549) |
| 0.0 | 0.2 | GO:0005030 | neurotrophin receptor activity(GO:0005030) |
| 0.0 | 0.5 | GO:0070064 | proline-rich region binding(GO:0070064) |
| 0.0 | 0.5 | GO:0001106 | RNA polymerase II transcription corepressor activity(GO:0001106) |
| 0.0 | 0.1 | GO:0003873 | 6-phosphofructo-2-kinase activity(GO:0003873) |
| 0.0 | 0.3 | GO:0071855 | neuropeptide receptor binding(GO:0071855) |
| 0.0 | 2.3 | GO:0005125 | cytokine activity(GO:0005125) |
| 0.0 | 0.6 | GO:0070491 | repressing transcription factor binding(GO:0070491) |
| 0.0 | 0.2 | GO:0035613 | RNA stem-loop binding(GO:0035613) |
| 0.0 | 0.3 | GO:0008374 | O-acyltransferase activity(GO:0008374) |
Gene overrepresentation in curated gene sets: canonical pathways category:
| Log-likelihood per target | Total log-likelihood | Term | Description |
|---|---|---|---|
| 1.2 | 83.8 | PID IGF1 PATHWAY | IGF1 pathway |
| 1.1 | 22.0 | PID ERB GENOMIC PATHWAY | Validated nuclear estrogen receptor beta network |
| 1.0 | 17.8 | PID P38 GAMMA DELTA PATHWAY | Signaling mediated by p38-gamma and p38-delta |
| 1.0 | 9.0 | ST PAC1 RECEPTOR PATHWAY | PAC1 Receptor Pathway |
| 0.6 | 31.8 | PID RXR VDR PATHWAY | RXR and RAR heterodimerization with other nuclear receptor |
| 0.6 | 51.5 | PID HES HEY PATHWAY | Notch-mediated HES/HEY network |
| 0.4 | 11.7 | ST WNT CA2 CYCLIC GMP PATHWAY | Wnt/Ca2+/cyclic GMP signaling. |
| 0.3 | 26.3 | PID TAP63 PATHWAY | Validated transcriptional targets of TAp63 isoforms |
| 0.3 | 13.4 | PID BARD1 PATHWAY | BARD1 signaling events |
| 0.3 | 24.3 | PID CASPASE PATHWAY | Caspase cascade in apoptosis |
| 0.3 | 0.5 | PID INTEGRIN5 PATHWAY | Beta5 beta6 beta7 and beta8 integrin cell surface interactions |
| 0.3 | 11.5 | NABA PROTEOGLYCANS | Genes encoding proteoglycans |
| 0.2 | 2.5 | PID RETINOIC ACID PATHWAY | Retinoic acid receptors-mediated signaling |
| 0.2 | 14.8 | PID AR TF PATHWAY | Regulation of Androgen receptor activity |
| 0.2 | 3.3 | PID RB 1PATHWAY | Regulation of retinoblastoma protein |
| 0.2 | 8.3 | PID BMP PATHWAY | BMP receptor signaling |
| 0.2 | 5.3 | PID IL1 PATHWAY | IL1-mediated signaling events |
| 0.2 | 7.8 | PID TCR CALCIUM PATHWAY | Calcium signaling in the CD4+ TCR pathway |
| 0.2 | 7.3 | PID ALK1 PATHWAY | ALK1 signaling events |
| 0.2 | 2.8 | PID ANTHRAX PATHWAY | Cellular roles of Anthrax toxin |
| 0.2 | 5.2 | ST ADRENERGIC | Adrenergic Pathway |
| 0.2 | 3.1 | PID HIV NEF PATHWAY | HIV-1 Nef: Negative effector of Fas and TNF-alpha |
| 0.1 | 2.6 | PID PDGFRA PATHWAY | PDGFR-alpha signaling pathway |
| 0.1 | 5.7 | PID MAPK TRK PATHWAY | Trk receptor signaling mediated by the MAPK pathway |
| 0.1 | 1.7 | PID ERBB2 ERBB3 PATHWAY | ErbB2/ErbB3 signaling events |
| 0.1 | 9.5 | PID MYC REPRESS PATHWAY | Validated targets of C-MYC transcriptional repression |
| 0.1 | 5.2 | PID HNF3A PATHWAY | FOXA1 transcription factor network |
| 0.1 | 5.3 | PID EPHA FWDPATHWAY | EPHA forward signaling |
| 0.1 | 17.9 | PID PDGFRB PATHWAY | PDGFR-beta signaling pathway |
| 0.1 | 7.8 | PID HNF3B PATHWAY | FOXA2 and FOXA3 transcription factor networks |
| 0.1 | 1.5 | ST G ALPHA S PATHWAY | G alpha s Pathway |
| 0.1 | 1.8 | PID DNA PK PATHWAY | DNA-PK pathway in nonhomologous end joining |
| 0.1 | 4.2 | PID LIS1 PATHWAY | Lissencephaly gene (LIS1) in neuronal migration and development |
| 0.1 | 4.6 | PID ILK PATHWAY | Integrin-linked kinase signaling |
| 0.1 | 3.6 | PID NFAT TFPATHWAY | Calcineurin-regulated NFAT-dependent transcription in lymphocytes |
| 0.1 | 2.4 | PID GLYPICAN 1PATHWAY | Glypican 1 network |
| 0.1 | 1.2 | PID SYNDECAN 3 PATHWAY | Syndecan-3-mediated signaling events |
| 0.1 | 2.1 | PID ARF 3PATHWAY | Arf1 pathway |
| 0.1 | 0.8 | PID IL12 STAT4 PATHWAY | IL12 signaling mediated by STAT4 |
| 0.1 | 2.5 | PID FOXM1 PATHWAY | FOXM1 transcription factor network |
| 0.1 | 2.1 | PID IL23 PATHWAY | IL23-mediated signaling events |
| 0.1 | 1.1 | PID NECTIN PATHWAY | Nectin adhesion pathway |
| 0.1 | 14.3 | NABA ECM REGULATORS | Genes encoding enzymes and their regulators involved in the remodeling of the extracellular matrix |
| 0.0 | 1.0 | PID HDAC CLASSIII PATHWAY | Signaling events mediated by HDAC Class III |
| 0.0 | 1.2 | ST T CELL SIGNAL TRANSDUCTION | T Cell Signal Transduction |
| 0.0 | 0.9 | PID HIF2PATHWAY | HIF-2-alpha transcription factor network |
| 0.0 | 1.1 | ST GA13 PATHWAY | G alpha 13 Pathway |
| 0.0 | 0.2 | PID S1P S1P1 PATHWAY | S1P1 pathway |
| 0.0 | 0.8 | PID ALPHA SYNUCLEIN PATHWAY | Alpha-synuclein signaling |
| 0.0 | 2.4 | PID BETA CATENIN NUC PATHWAY | Regulation of nuclear beta catenin signaling and target gene transcription |
| 0.0 | 0.6 | PID NCADHERIN PATHWAY | N-cadherin signaling events |
| 0.0 | 0.7 | PID HDAC CLASSII PATHWAY | Signaling events mediated by HDAC Class II |
| 0.0 | 0.3 | PID RET PATHWAY | Signaling events regulated by Ret tyrosine kinase |
Gene overrepresentation in curated gene sets: REACTOME pathways category:
| Log-likelihood per target | Total log-likelihood | Term | Description |
|---|---|---|---|
| 2.5 | 37.9 | REACTOME SYNTHESIS OF BILE ACIDS AND BILE SALTS VIA 24 HYDROXYCHOLESTEROL | Genes involved in Synthesis of bile acids and bile salts via 24-hydroxycholesterol |
| 1.9 | 70.1 | REACTOME CASPASE MEDIATED CLEAVAGE OF CYTOSKELETAL PROTEINS | Genes involved in Caspase-mediated cleavage of cytoskeletal proteins |
| 1.7 | 17.2 | REACTOME ACTIVATION OF CHAPERONE GENES BY ATF6 ALPHA | Genes involved in Activation of Chaperone Genes by ATF6-alpha |
| 1.6 | 45.6 | REACTOME PROLACTIN RECEPTOR SIGNALING | Genes involved in Prolactin receptor signaling |
| 1.4 | 7.2 | REACTOME TETRAHYDROBIOPTERIN BH4 SYNTHESIS RECYCLING SALVAGE AND REGULATION | Genes involved in Tetrahydrobiopterin (BH4) synthesis, recycling, salvage and regulation |
| 1.0 | 8.9 | REACTOME THE ACTIVATION OF ARYLSULFATASES | Genes involved in The activation of arylsulfatases |
| 0.9 | 5.1 | REACTOME YAP1 AND WWTR1 TAZ STIMULATED GENE EXPRESSION | Genes involved in YAP1- and WWTR1 (TAZ)-stimulated gene expression |
| 0.8 | 11.7 | REACTOME REGULATION OF COMPLEMENT CASCADE | Genes involved in Regulation of Complement cascade |
| 0.7 | 23.9 | REACTOME CYTOCHROME P450 ARRANGED BY SUBSTRATE TYPE | Genes involved in Cytochrome P450 - arranged by substrate type |
| 0.7 | 8.6 | REACTOME KERATAN SULFATE DEGRADATION | Genes involved in Keratan sulfate degradation |
| 0.6 | 13.4 | REACTOME OXYGEN DEPENDENT PROLINE HYDROXYLATION OF HYPOXIA INDUCIBLE FACTOR ALPHA | Genes involved in Oxygen-dependent Proline Hydroxylation of Hypoxia-inducible Factor Alpha |
| 0.5 | 7.9 | REACTOME PRESYNAPTIC NICOTINIC ACETYLCHOLINE RECEPTORS | Genes involved in Presynaptic nicotinic acetylcholine receptors |
| 0.5 | 51.4 | REACTOME NUCLEAR RECEPTOR TRANSCRIPTION PATHWAY | Genes involved in Nuclear Receptor transcription pathway |
| 0.5 | 6.2 | REACTOME IRAK1 RECRUITS IKK COMPLEX | Genes involved in IRAK1 recruits IKK complex |
| 0.4 | 7.0 | REACTOME ABACAVIR TRANSPORT AND METABOLISM | Genes involved in Abacavir transport and metabolism |
| 0.4 | 5.6 | REACTOME E2F ENABLED INHIBITION OF PRE REPLICATION COMPLEX FORMATION | Genes involved in E2F-enabled inhibition of pre-replication complex formation |
| 0.4 | 8.9 | REACTOME FORMATION OF ATP BY CHEMIOSMOTIC COUPLING | Genes involved in Formation of ATP by chemiosmotic coupling |
| 0.4 | 8.9 | REACTOME REGULATION OF INSULIN LIKE GROWTH FACTOR IGF ACTIVITY BY INSULIN LIKE GROWTH FACTOR BINDING PROTEINS IGFBPS | Genes involved in Regulation of Insulin-like Growth Factor (IGF) Activity by Insulin-like Growth Factor Binding Proteins (IGFBPs) |
| 0.4 | 8.4 | REACTOME GABA A RECEPTOR ACTIVATION | Genes involved in GABA A receptor activation |
| 0.3 | 10.6 | REACTOME BIOSYNTHESIS OF THE N GLYCAN PRECURSOR DOLICHOL LIPID LINKED OLIGOSACCHARIDE LLO AND TRANSFER TO A NASCENT PROTEIN | Genes involved in Biosynthesis of the N-glycan precursor (dolichol lipid-linked oligosaccharide, LLO) and transfer to a nascent protein |
| 0.3 | 9.7 | REACTOME ADHERENS JUNCTIONS INTERACTIONS | Genes involved in Adherens junctions interactions |
| 0.3 | 8.4 | REACTOME CHOLESTEROL BIOSYNTHESIS | Genes involved in Cholesterol biosynthesis |
| 0.3 | 5.2 | REACTOME CLASS C 3 METABOTROPIC GLUTAMATE PHEROMONE RECEPTORS | Genes involved in Class C/3 (Metabotropic glutamate/pheromone receptors) |
| 0.2 | 10.1 | REACTOME HS GAG BIOSYNTHESIS | Genes involved in HS-GAG biosynthesis |
| 0.2 | 7.1 | REACTOME TRAF6 MEDIATED IRF7 ACTIVATION | Genes involved in TRAF6 mediated IRF7 activation |
| 0.2 | 13.1 | REACTOME VOLTAGE GATED POTASSIUM CHANNELS | Genes involved in Voltage gated Potassium channels |
| 0.2 | 1.8 | REACTOME RECEPTOR LIGAND BINDING INITIATES THE SECOND PROTEOLYTIC CLEAVAGE OF NOTCH RECEPTOR | Genes involved in Receptor-ligand binding initiates the second proteolytic cleavage of Notch receptor |
| 0.2 | 5.4 | REACTOME SIGNALING BY BMP | Genes involved in Signaling by BMP |
| 0.2 | 5.7 | REACTOME ACTIVATED AMPK STIMULATES FATTY ACID OXIDATION IN MUSCLE | Genes involved in Activated AMPK stimulates fatty-acid oxidation in muscle |
| 0.2 | 10.0 | REACTOME TRANSPORT OF VITAMINS NUCLEOSIDES AND RELATED MOLECULES | Genes involved in Transport of vitamins, nucleosides, and related molecules |
| 0.2 | 2.0 | REACTOME TRANSLOCATION OF ZAP 70 TO IMMUNOLOGICAL SYNAPSE | Genes involved in Translocation of ZAP-70 to Immunological synapse |
| 0.2 | 2.8 | REACTOME IONOTROPIC ACTIVITY OF KAINATE RECEPTORS | Genes involved in Ionotropic activity of Kainate Receptors |
| 0.2 | 3.2 | REACTOME HDL MEDIATED LIPID TRANSPORT | Genes involved in HDL-mediated lipid transport |
| 0.2 | 7.6 | REACTOME SPHINGOLIPID DE NOVO BIOSYNTHESIS | Genes involved in Sphingolipid de novo biosynthesis |
| 0.2 | 1.0 | REACTOME PLATELET SENSITIZATION BY LDL | Genes involved in Platelet sensitization by LDL |
| 0.2 | 11.2 | REACTOME NETRIN1 SIGNALING | Genes involved in Netrin-1 signaling |
| 0.2 | 4.5 | REACTOME AMINO ACID SYNTHESIS AND INTERCONVERSION TRANSAMINATION | Genes involved in Amino acid synthesis and interconversion (transamination) |
| 0.2 | 2.6 | REACTOME PECAM1 INTERACTIONS | Genes involved in PECAM1 interactions |
| 0.1 | 11.3 | REACTOME UNFOLDED PROTEIN RESPONSE | Genes involved in Unfolded Protein Response |
| 0.1 | 3.8 | REACTOME N GLYCAN ANTENNAE ELONGATION | Genes involved in N-Glycan antennae elongation |
| 0.1 | 4.7 | REACTOME SULFUR AMINO ACID METABOLISM | Genes involved in Sulfur amino acid metabolism |
| 0.1 | 3.1 | REACTOME ABCA TRANSPORTERS IN LIPID HOMEOSTASIS | Genes involved in ABCA transporters in lipid homeostasis |
| 0.1 | 1.5 | REACTOME ACTIVATION OF RAC | Genes involved in Activation of Rac |
| 0.1 | 5.1 | REACTOME AMINE COMPOUND SLC TRANSPORTERS | Genes involved in Amine compound SLC transporters |
| 0.1 | 2.8 | REACTOME PRE NOTCH PROCESSING IN GOLGI | Genes involved in Pre-NOTCH Processing in Golgi |
| 0.1 | 5.3 | REACTOME SYNTHESIS OF PA | Genes involved in Synthesis of PA |
| 0.1 | 2.1 | REACTOME PLATELET CALCIUM HOMEOSTASIS | Genes involved in Platelet calcium homeostasis |
| 0.1 | 3.5 | REACTOME CGMP EFFECTS | Genes involved in cGMP effects |
| 0.1 | 2.2 | REACTOME ABC FAMILY PROTEINS MEDIATED TRANSPORT | Genes involved in ABC-family proteins mediated transport |
| 0.1 | 6.1 | REACTOME MYOGENESIS | Genes involved in Myogenesis |
| 0.1 | 1.9 | REACTOME CTNNB1 PHOSPHORYLATION CASCADE | Genes involved in Beta-catenin phosphorylation cascade |
| 0.1 | 14.0 | REACTOME G ALPHA Q SIGNALLING EVENTS | Genes involved in G alpha (q) signalling events |
| 0.1 | 5.9 | REACTOME RESPIRATORY ELECTRON TRANSPORT | Genes involved in Respiratory electron transport |
| 0.1 | 0.5 | REACTOME HORMONE LIGAND BINDING RECEPTORS | Genes involved in Hormone ligand-binding receptors |
| 0.1 | 2.4 | REACTOME EFFECTS OF PIP2 HYDROLYSIS | Genes involved in Effects of PIP2 hydrolysis |
| 0.1 | 2.3 | REACTOME RNA POL III TRANSCRIPTION INITIATION FROM TYPE 3 PROMOTER | Genes involved in RNA Polymerase III Transcription Initiation From Type 3 Promoter |
| 0.1 | 4.3 | REACTOME INWARDLY RECTIFYING K CHANNELS | Genes involved in Inwardly rectifying K+ channels |
| 0.1 | 2.4 | REACTOME UNBLOCKING OF NMDA RECEPTOR GLUTAMATE BINDING AND ACTIVATION | Genes involved in Unblocking of NMDA receptor, glutamate binding and activation |
| 0.1 | 2.2 | REACTOME PRE NOTCH EXPRESSION AND PROCESSING | Genes involved in Pre-NOTCH Expression and Processing |
| 0.1 | 1.8 | REACTOME ZINC TRANSPORTERS | Genes involved in Zinc transporters |
| 0.1 | 0.8 | REACTOME REGULATION OF INSULIN SECRETION BY GLUCAGON LIKE PEPTIDE1 | Genes involved in Regulation of Insulin Secretion by Glucagon-like Peptide-1 |
| 0.1 | 2.1 | REACTOME INSULIN RECEPTOR RECYCLING | Genes involved in Insulin receptor recycling |
| 0.1 | 1.1 | REACTOME PROTEOLYTIC CLEAVAGE OF SNARE COMPLEX PROTEINS | Genes involved in Proteolytic cleavage of SNARE complex proteins |
| 0.1 | 0.8 | REACTOME REMOVAL OF THE FLAP INTERMEDIATE FROM THE C STRAND | Genes involved in Removal of the Flap Intermediate from the C-strand |
| 0.1 | 1.4 | REACTOME PURINE SALVAGE | Genes involved in Purine salvage |
| 0.1 | 0.6 | REACTOME SYNTHESIS OF BILE ACIDS AND BILE SALTS | Genes involved in Synthesis of bile acids and bile salts |
| 0.1 | 1.5 | REACTOME RAP1 SIGNALLING | Genes involved in Rap1 signalling |
| 0.1 | 0.8 | REACTOME N GLYCAN TRIMMING IN THE ER AND CALNEXIN CALRETICULIN CYCLE | Genes involved in N-glycan trimming in the ER and Calnexin/Calreticulin cycle |
| 0.0 | 1.0 | REACTOME FGFR4 LIGAND BINDING AND ACTIVATION | Genes involved in FGFR4 ligand binding and activation |
| 0.0 | 6.9 | REACTOME TRANSPORT OF INORGANIC CATIONS ANIONS AND AMINO ACIDS OLIGOPEPTIDES | Genes involved in Transport of inorganic cations/anions and amino acids/oligopeptides |
| 0.0 | 1.8 | REACTOME GLYCOLYSIS | Genes involved in Glycolysis |
| 0.0 | 1.9 | REACTOME CHEMOKINE RECEPTORS BIND CHEMOKINES | Genes involved in Chemokine receptors bind chemokines |
| 0.0 | 0.8 | REACTOME CIRCADIAN REPRESSION OF EXPRESSION BY REV ERBA | Genes involved in Circadian Repression of Expression by REV-ERBA |
| 0.0 | 1.1 | REACTOME MEIOTIC RECOMBINATION | Genes involved in Meiotic Recombination |
| 0.0 | 0.8 | REACTOME ERK MAPK TARGETS | Genes involved in ERK/MAPK targets |
| 0.0 | 3.9 | REACTOME INFLUENZA VIRAL RNA TRANSCRIPTION AND REPLICATION | Genes involved in Influenza Viral RNA Transcription and Replication |
| 0.0 | 7.4 | REACTOME ANTIGEN PROCESSING UBIQUITINATION PROTEASOME DEGRADATION | Genes involved in Antigen processing: Ubiquitination & Proteasome degradation |
| 0.0 | 0.2 | REACTOME G PROTEIN ACTIVATION | Genes involved in G-protein activation |
| 0.0 | 0.2 | REACTOME ELONGATION ARREST AND RECOVERY | Genes involved in Elongation arrest and recovery |
| 0.0 | 1.1 | REACTOME LOSS OF NLP FROM MITOTIC CENTROSOMES | Genes involved in Loss of Nlp from mitotic centrosomes |
| 0.0 | 0.4 | REACTOME PYRIMIDINE METABOLISM | Genes involved in Pyrimidine metabolism |