Project
avrg: GSE58827: Dynamics of the Mouse Liver
Navigation
Downloads
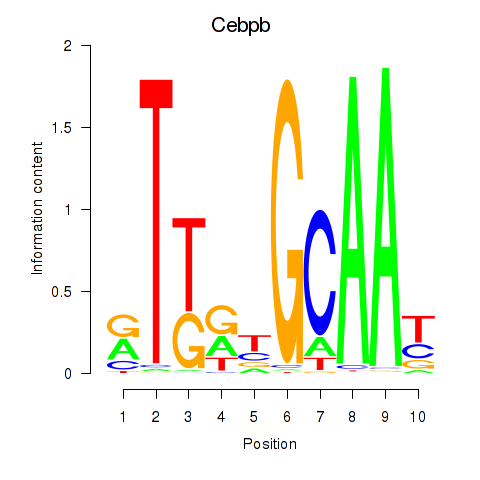
Results for Cebpb
Z-value: 3.45
Motif logo
Transcription factors associated with Cebpb
| Gene Symbol | Gene ID | Gene Info |
|---|---|---|
|
Cebpb
|
ENSMUSG00000056501.4 | Cebpb |
Activity-expression correlation:
| Gene | Promoter | Pearson corr. coef. | P-value | Plot |
|---|---|---|---|---|
| Cebpb | mm39_v1_chr2_+_167530835_167530894 | -0.07 | 7.0e-01 | Click! |
Activity profile of Cebpb motif
Sorted Z-values of Cebpb motif
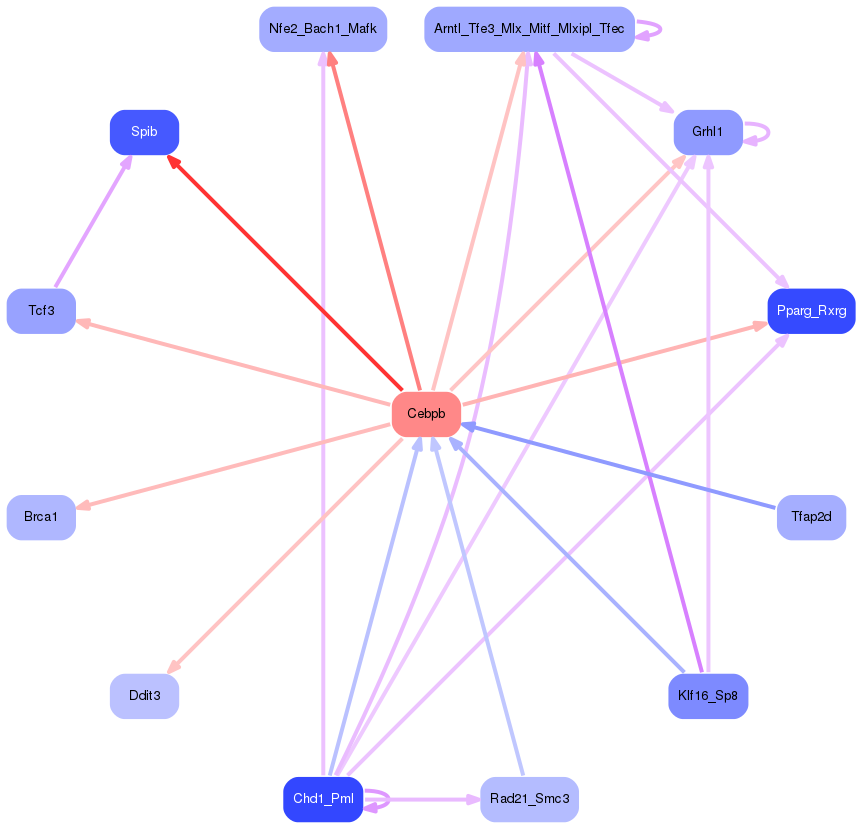
Network of associatons between targets according to the STRING database.

First level regulatory network of Cebpb
| Promoter | Score | Transcript | Gene | Gene Info |
|---|---|---|---|---|
| chr9_-_109678685 | 28.41 |
ENSMUST00000112022.5
|
Camp
|
cathelicidin antimicrobial peptide |
| chr7_+_13467422 | 26.09 |
ENSMUST00000086148.8
|
Sult2a2
|
sulfotransferase family 2A, dehydroepiandrosterone (DHEA)-preferring, member 2 |
| chr9_+_110248815 | 23.01 |
ENSMUST00000035061.9
|
Ngp
|
neutrophilic granule protein |
| chrX_-_161747552 | 19.67 |
ENSMUST00000038769.3
|
S100g
|
S100 calcium binding protein G |
| chr10_+_23727325 | 18.30 |
ENSMUST00000020190.8
|
Vnn3
|
vanin 3 |
| chr2_-_32277773 | 15.94 |
ENSMUST00000050785.14
|
Lcn2
|
lipocalin 2 |
| chr2_-_32278245 | 15.71 |
ENSMUST00000192241.2
|
Lcn2
|
lipocalin 2 |
| chr11_-_99383938 | 14.85 |
ENSMUST00000006969.8
|
Krt23
|
keratin 23 |
| chr8_-_46664321 | 14.55 |
ENSMUST00000034049.5
|
Slc25a4
|
solute carrier family 25 (mitochondrial carrier, adenine nucleotide translocator), member 4 |
| chr10_+_79722081 | 13.96 |
ENSMUST00000046091.7
|
Elane
|
elastase, neutrophil expressed |
| chr9_+_110867807 | 11.93 |
ENSMUST00000197575.2
|
Ltf
|
lactotransferrin |
| chr7_-_44181477 | 10.69 |
ENSMUST00000098483.9
ENSMUST00000035323.6 |
Spib
|
Spi-B transcription factor (Spi-1/PU.1 related) |
| chr7_+_13357892 | 10.33 |
ENSMUST00000108525.4
|
Sult2a5
|
sulfotransferase family 2A, dehydroepiandrosterone (DHEA)-preferring, member 5 |
| chr19_-_11618165 | 10.20 |
ENSMUST00000186023.7
|
Ms4a3
|
membrane-spanning 4-domains, subfamily A, member 3 |
| chr16_+_22710785 | 10.12 |
ENSMUST00000023583.7
ENSMUST00000232098.2 |
Ahsg
|
alpha-2-HS-glycoprotein |
| chrX_-_137985960 | 10.01 |
ENSMUST00000033626.15
ENSMUST00000060824.4 |
Serpina7
|
serine (or cysteine) peptidase inhibitor, clade A (alpha-1 antiproteinase, antitrypsin), member 7 |
| chr16_+_22877000 | 9.77 |
ENSMUST00000039492.14
ENSMUST00000023589.15 ENSMUST00000089902.8 |
Kng1
|
kininogen 1 |
| chr19_-_11618192 | 9.19 |
ENSMUST00000112984.4
|
Ms4a3
|
membrane-spanning 4-domains, subfamily A, member 3 |
| chrX_-_137985979 | 8.89 |
ENSMUST00000152457.2
|
Serpina7
|
serine (or cysteine) peptidase inhibitor, clade A (alpha-1 antiproteinase, antitrypsin), member 7 |
| chr7_-_13988795 | 8.53 |
ENSMUST00000184731.8
ENSMUST00000076576.7 |
Sult2a6
|
sulfotransferase family 2A, dehydroepiandrosterone (DHEA)-preferring, member 6 |
| chr2_+_24235300 | 8.48 |
ENSMUST00000114485.9
ENSMUST00000114482.3 |
Il1rn
|
interleukin 1 receptor antagonist |
| chr19_-_15902292 | 7.55 |
ENSMUST00000025542.10
|
Psat1
|
phosphoserine aminotransferase 1 |
| chr9_-_71070506 | 7.47 |
ENSMUST00000074465.9
|
Aqp9
|
aquaporin 9 |
| chr14_+_40827108 | 7.09 |
ENSMUST00000224514.2
|
Mat1a
|
methionine adenosyltransferase I, alpha |
| chr9_+_7558449 | 6.59 |
ENSMUST00000018765.4
|
Mmp8
|
matrix metallopeptidase 8 |
| chr1_+_134110142 | 6.45 |
ENSMUST00000082060.10
ENSMUST00000153856.8 ENSMUST00000133701.8 ENSMUST00000132873.8 |
Chil1
|
chitinase-like 1 |
| chr7_+_78563150 | 6.31 |
ENSMUST00000118867.8
|
Isg20
|
interferon-stimulated protein |
| chr7_+_78563964 | 6.22 |
ENSMUST00000120331.4
|
Isg20
|
interferon-stimulated protein |
| chr2_+_117942357 | 6.11 |
ENSMUST00000039559.9
|
Thbs1
|
thrombospondin 1 |
| chr4_-_133694543 | 6.00 |
ENSMUST00000123234.8
|
Hmgn2
|
high mobility group nucleosomal binding domain 2 |
| chr11_+_115353290 | 5.82 |
ENSMUST00000106532.4
ENSMUST00000092445.12 ENSMUST00000153466.2 |
Slc16a5
|
solute carrier family 16 (monocarboxylic acid transporters), member 5 |
| chr2_+_158148413 | 5.78 |
ENSMUST00000109491.8
ENSMUST00000016168.9 |
Lbp
|
lipopolysaccharide binding protein |
| chr8_-_120567236 | 5.51 |
ENSMUST00000211873.2
ENSMUST00000168698.2 ENSMUST00000034285.14 |
Cotl1
|
coactosin-like 1 (Dictyostelium) |
| chr12_-_81014755 | 5.37 |
ENSMUST00000218342.2
|
Slc10a1
|
solute carrier family 10 (sodium/bile acid cotransporter family), member 1 |
| chr7_+_78563184 | 5.34 |
ENSMUST00000121645.8
|
Isg20
|
interferon-stimulated protein |
| chr15_-_103161237 | 5.30 |
ENSMUST00000154510.8
|
Nfe2
|
nuclear factor, erythroid derived 2 |
| chr7_+_78563513 | 5.29 |
ENSMUST00000038142.15
|
Isg20
|
interferon-stimulated protein |
| chr8_+_75820240 | 5.22 |
ENSMUST00000005548.8
|
Hmox1
|
heme oxygenase 1 |
| chr7_-_13856967 | 5.04 |
ENSMUST00000098809.4
|
Sult2a3
|
sulfotransferase family 2A, dehydroepiandrosterone (DHEA)-preferring, member 3 |
| chr7_-_45264908 | 4.99 |
ENSMUST00000033099.6
|
Fgf21
|
fibroblast growth factor 21 |
| chr14_+_40826970 | 4.86 |
ENSMUST00000225720.2
|
Mat1a
|
methionine adenosyltransferase I, alpha |
| chr3_+_20011405 | 4.82 |
ENSMUST00000108325.9
|
Cp
|
ceruloplasmin |
| chr12_-_81014849 | 4.81 |
ENSMUST00000095572.5
|
Slc10a1
|
solute carrier family 10 (sodium/bile acid cotransporter family), member 1 |
| chr10_+_97318223 | 4.72 |
ENSMUST00000163448.4
|
Dcn
|
decorin |
| chr12_-_101784727 | 4.71 |
ENSMUST00000222587.2
|
Fbln5
|
fibulin 5 |
| chr11_+_53410552 | 4.58 |
ENSMUST00000108987.8
ENSMUST00000121334.8 ENSMUST00000117061.8 |
Septin8
|
septin 8 |
| chr3_+_20011251 | 4.54 |
ENSMUST00000108328.8
|
Cp
|
ceruloplasmin |
| chr14_+_40827317 | 4.50 |
ENSMUST00000047286.7
|
Mat1a
|
methionine adenosyltransferase I, alpha |
| chr17_+_57665691 | 4.45 |
ENSMUST00000086763.13
ENSMUST00000233376.2 ENSMUST00000233840.2 ENSMUST00000232808.2 ENSMUST00000004850.8 |
Adgre1
|
adhesion G protein-coupled receptor E1 |
| chr3_+_82933383 | 4.41 |
ENSMUST00000029630.15
ENSMUST00000166581.4 |
Fga
|
fibrinogen alpha chain |
| chr2_+_22664094 | 4.24 |
ENSMUST00000014290.15
|
Apbb1ip
|
amyloid beta (A4) precursor protein-binding, family B, member 1 interacting protein |
| chr3_+_20011201 | 4.15 |
ENSMUST00000091309.12
ENSMUST00000108329.8 ENSMUST00000003714.13 |
Cp
|
ceruloplasmin |
| chr4_-_43558386 | 4.11 |
ENSMUST00000130353.2
|
Tln1
|
talin 1 |
| chr15_+_57849269 | 4.01 |
ENSMUST00000050374.3
|
Fam83a
|
family with sequence similarity 83, member A |
| chr10_+_80765900 | 4.00 |
ENSMUST00000015456.10
ENSMUST00000220246.2 |
Gadd45b
|
growth arrest and DNA-damage-inducible 45 beta |
| chr2_-_164198427 | 3.92 |
ENSMUST00000109367.10
|
Slpi
|
secretory leukocyte peptidase inhibitor |
| chr1_+_164624200 | 3.80 |
ENSMUST00000027861.6
|
Dpt
|
dermatopontin |
| chr3_+_82915031 | 3.75 |
ENSMUST00000048486.13
ENSMUST00000194175.2 |
Fgg
|
fibrinogen gamma chain |
| chr14_+_22069877 | 3.54 |
ENSMUST00000161249.8
ENSMUST00000159777.8 ENSMUST00000162540.2 |
Lrmda
|
leucine rich melanocyte differentiation associated |
| chr3_-_89820451 | 3.54 |
ENSMUST00000029559.7
ENSMUST00000197679.5 |
Il6ra
|
interleukin 6 receptor, alpha |
| chr17_+_48653429 | 3.52 |
ENSMUST00000024791.15
|
Trem2
|
triggering receptor expressed on myeloid cells 2 |
| chr1_+_74414354 | 3.46 |
ENSMUST00000187516.7
ENSMUST00000027368.6 |
Slc11a1
|
solute carrier family 11 (proton-coupled divalent metal ion transporters), member 1 |
| chr12_-_101785307 | 3.34 |
ENSMUST00000021603.9
|
Fbln5
|
fibulin 5 |
| chr4_+_126915104 | 3.27 |
ENSMUST00000030623.8
|
Sfpq
|
splicing factor proline/glutamine rich (polypyrimidine tract binding protein associated) |
| chr15_-_37459570 | 3.27 |
ENSMUST00000119730.8
ENSMUST00000120746.8 |
Ncald
|
neurocalcin delta |
| chr10_-_88192852 | 3.15 |
ENSMUST00000020249.2
|
Dram1
|
DNA-damage regulated autophagy modulator 1 |
| chr17_+_47908025 | 3.15 |
ENSMUST00000183206.2
|
Ccnd3
|
cyclin D3 |
| chr18_-_36859732 | 3.12 |
ENSMUST00000061829.8
|
Cd14
|
CD14 antigen |
| chr13_+_25127127 | 3.09 |
ENSMUST00000021773.13
|
Gpld1
|
glycosylphosphatidylinositol specific phospholipase D1 |
| chr13_-_61084358 | 3.01 |
ENSMUST00000225859.2
ENSMUST00000225167.2 ENSMUST00000021880.10 |
Gm49391
Ctla2a
|
predicted gene, 49391 cytotoxic T lymphocyte-associated protein 2 alpha |
| chrX_-_56384089 | 2.95 |
ENSMUST00000033468.11
|
Arhgef6
|
Rac/Cdc42 guanine nucleotide exchange factor (GEF) 6 |
| chr14_+_51328534 | 2.89 |
ENSMUST00000022428.13
ENSMUST00000171688.9 |
Rnase4
Ang
|
ribonuclease, RNase A family 4 angiogenin, ribonuclease, RNase A family, 5 |
| chr19_-_3979723 | 2.82 |
ENSMUST00000051803.8
|
Aldh3b1
|
aldehyde dehydrogenase 3 family, member B1 |
| chr9_-_103107460 | 2.79 |
ENSMUST00000165296.8
ENSMUST00000112645.8 |
Trf
|
transferrin |
| chr4_-_148172423 | 2.74 |
ENSMUST00000030865.9
|
Agtrap
|
angiotensin II, type I receptor-associated protein |
| chr7_-_45480200 | 2.70 |
ENSMUST00000107723.9
ENSMUST00000131384.3 |
Grwd1
|
glutamate-rich WD repeat containing 1 |
| chr1_-_164281344 | 2.67 |
ENSMUST00000193367.2
|
Atp1b1
|
ATPase, Na+/K+ transporting, beta 1 polypeptide |
| chr8_-_123202774 | 2.60 |
ENSMUST00000014614.4
|
Rnf166
|
ring finger protein 166 |
| chr14_+_22069709 | 2.60 |
ENSMUST00000075639.11
|
Lrmda
|
leucine rich melanocyte differentiation associated |
| chr12_+_37291728 | 2.59 |
ENSMUST00000160768.8
|
Agmo
|
alkylglycerol monooxygenase |
| chr16_-_22848153 | 2.59 |
ENSMUST00000232459.2
|
Kng2
|
kininogen 2 |
| chr11_-_72441054 | 2.58 |
ENSMUST00000021154.7
|
Spns3
|
spinster homolog 3 |
| chr5_-_104125226 | 2.53 |
ENSMUST00000048118.15
|
Hsd17b13
|
hydroxysteroid (17-beta) dehydrogenase 13 |
| chr9_+_5298669 | 2.52 |
ENSMUST00000238505.2
|
Casp1
|
caspase 1 |
| chr19_+_34268053 | 2.51 |
ENSMUST00000025691.13
|
Fas
|
Fas (TNF receptor superfamily member 6) |
| chr7_+_30450896 | 2.49 |
ENSMUST00000182229.8
ENSMUST00000080518.14 ENSMUST00000182227.8 ENSMUST00000182721.8 |
Sbsn
|
suprabasin |
| chr6_-_56878854 | 2.48 |
ENSMUST00000101367.9
|
Nt5c3
|
5'-nucleotidase, cytosolic III |
| chr14_+_3576275 | 2.44 |
ENSMUST00000151926.8
|
Ube2e2
|
ubiquitin-conjugating enzyme E2E 2 |
| chr19_+_34268071 | 2.41 |
ENSMUST00000112472.4
ENSMUST00000235232.2 |
Fas
|
Fas (TNF receptor superfamily member 6) |
| chr4_-_136626073 | 2.40 |
ENSMUST00000046285.6
|
C1qa
|
complement component 1, q subcomponent, alpha polypeptide |
| chr9_-_123768720 | 2.38 |
ENSMUST00000026911.6
|
Ccr1
|
chemokine (C-C motif) receptor 1 |
| chr3_+_109030419 | 2.35 |
ENSMUST00000029477.11
|
Slc25a24
|
solute carrier family 25 (mitochondrial carrier, phosphate carrier), member 24 |
| chr11_+_49141410 | 2.34 |
ENSMUST00000129588.2
|
Mgat1
|
mannoside acetylglucosaminyltransferase 1 |
| chr4_-_151129020 | 2.34 |
ENSMUST00000103204.11
|
Per3
|
period circadian clock 3 |
| chr2_+_32766126 | 2.32 |
ENSMUST00000028135.15
|
Niban2
|
niban apoptosis regulator 2 |
| chr5_-_104125270 | 2.30 |
ENSMUST00000112803.3
|
Hsd17b13
|
hydroxysteroid (17-beta) dehydrogenase 13 |
| chr16_-_22847760 | 2.30 |
ENSMUST00000039338.13
|
Kng2
|
kininogen 2 |
| chr2_-_118378020 | 2.29 |
ENSMUST00000110859.3
|
Bmf
|
BCL2 modifying factor |
| chr11_-_115968745 | 2.24 |
ENSMUST00000156545.2
ENSMUST00000075036.9 ENSMUST00000106451.8 |
Unc13d
|
unc-13 homolog D |
| chr16_-_22847829 | 2.22 |
ENSMUST00000100046.9
|
Kng2
|
kininogen 2 |
| chr4_+_125918333 | 2.22 |
ENSMUST00000106162.8
|
Csf3r
|
colony stimulating factor 3 receptor (granulocyte) |
| chr7_+_45084257 | 2.22 |
ENSMUST00000003964.17
|
Gys1
|
glycogen synthase 1, muscle |
| chr17_+_48653493 | 2.19 |
ENSMUST00000113237.4
|
Trem2
|
triggering receptor expressed on myeloid cells 2 |
| chr17_+_29333116 | 2.17 |
ENSMUST00000233717.2
ENSMUST00000141239.2 |
Rab44
|
RAB44, member RAS oncogene family |
| chr2_+_155593030 | 2.16 |
ENSMUST00000029140.12
ENSMUST00000132608.2 |
Procr
|
protein C receptor, endothelial |
| chr9_-_103107495 | 2.13 |
ENSMUST00000035158.16
|
Trf
|
transferrin |
| chr5_-_104125192 | 2.12 |
ENSMUST00000120320.8
|
Hsd17b13
|
hydroxysteroid (17-beta) dehydrogenase 13 |
| chr12_+_76884182 | 2.12 |
ENSMUST00000041008.10
|
Fntb
|
farnesyltransferase, CAAX box, beta |
| chr19_+_55240357 | 2.10 |
ENSMUST00000225551.2
|
Acsl5
|
acyl-CoA synthetase long-chain family member 5 |
| chr7_+_126461117 | 2.08 |
ENSMUST00000037248.10
|
Hirip3
|
HIRA interacting protein 3 |
| chr18_-_38734389 | 2.06 |
ENSMUST00000025295.8
|
Spry4
|
sprouty RTK signaling antagonist 4 |
| chr16_-_22847808 | 2.03 |
ENSMUST00000115349.9
|
Kng2
|
kininogen 2 |
| chr3_+_84573499 | 2.00 |
ENSMUST00000107682.2
|
Tmem154
|
transmembrane protein 154 |
| chr8_-_34419826 | 1.98 |
ENSMUST00000033995.14
ENSMUST00000033994.15 ENSMUST00000191473.7 ENSMUST00000053251.12 |
Rbpms
|
RNA binding protein gene with multiple splicing |
| chr1_+_40123858 | 1.97 |
ENSMUST00000027243.13
|
Il1r2
|
interleukin 1 receptor, type II |
| chr3_+_123240562 | 1.95 |
ENSMUST00000029603.10
|
Prss12
|
protease, serine 12 neurotrypsin (motopsin) |
| chr11_+_49141339 | 1.90 |
ENSMUST00000101293.11
|
Mgat1
|
mannoside acetylglucosaminyltransferase 1 |
| chr5_+_8010445 | 1.87 |
ENSMUST00000115421.3
|
Steap4
|
STEAP family member 4 |
| chr16_-_93726399 | 1.84 |
ENSMUST00000177648.8
ENSMUST00000142083.2 |
Cldn14
|
claudin 14 |
| chr6_+_136509922 | 1.78 |
ENSMUST00000187429.4
|
Atf7ip
|
activating transcription factor 7 interacting protein |
| chr7_+_126461601 | 1.77 |
ENSMUST00000132808.2
|
Hirip3
|
HIRA interacting protein 3 |
| chr1_-_79838897 | 1.76 |
ENSMUST00000190724.2
|
Serpine2
|
serine (or cysteine) peptidase inhibitor, clade E, member 2 |
| chr14_-_55950545 | 1.74 |
ENSMUST00000002389.9
ENSMUST00000226907.2 |
Tgm1
|
transglutaminase 1, K polypeptide |
| chr15_-_103218876 | 1.72 |
ENSMUST00000079824.6
|
Gpr84
|
G protein-coupled receptor 84 |
| chr16_+_57173456 | 1.70 |
ENSMUST00000159816.8
|
Filip1l
|
filamin A interacting protein 1-like |
| chr6_+_115398996 | 1.70 |
ENSMUST00000000450.5
|
Pparg
|
peroxisome proliferator activated receptor gamma |
| chr10_-_111829393 | 1.69 |
ENSMUST00000161870.3
|
Glipr1
|
GLI pathogenesis-related 1 (glioma) |
| chr11_-_120534469 | 1.68 |
ENSMUST00000141254.8
ENSMUST00000170556.8 ENSMUST00000151876.8 ENSMUST00000026133.15 ENSMUST00000139706.2 |
Pycr1
|
pyrroline-5-carboxylate reductase 1 |
| chr12_-_113843161 | 1.62 |
ENSMUST00000103451.5
|
Ighv2-9
|
immunoglobulin heavy variable 2-9 |
| chr6_-_87786736 | 1.60 |
ENSMUST00000032134.9
|
Rab43
|
RAB43, member RAS oncogene family |
| chr9_-_42035560 | 1.59 |
ENSMUST00000060989.9
|
Sorl1
|
sortilin-related receptor, LDLR class A repeats-containing |
| chr5_-_123126550 | 1.56 |
ENSMUST00000086200.11
ENSMUST00000156474.8 |
Kdm2b
|
lysine (K)-specific demethylase 2B |
| chr13_+_95460110 | 1.54 |
ENSMUST00000221807.2
|
Zbed3
|
zinc finger, BED type containing 3 |
| chr14_-_55950939 | 1.54 |
ENSMUST00000168729.8
ENSMUST00000228123.2 ENSMUST00000178034.9 |
Tgm1
|
transglutaminase 1, K polypeptide |
| chr7_+_45084300 | 1.53 |
ENSMUST00000211150.2
|
Gys1
|
glycogen synthase 1, muscle |
| chr1_-_162726234 | 1.51 |
ENSMUST00000111510.8
ENSMUST00000045902.13 |
Fmo2
|
flavin containing monooxygenase 2 |
| chr17_-_57501170 | 1.50 |
ENSMUST00000005976.8
|
Tnfsf14
|
tumor necrosis factor (ligand) superfamily, member 14 |
| chr7_-_109201859 | 1.50 |
ENSMUST00000208583.2
|
Denn2b
|
DENN domain containing 2B |
| chr4_+_150572847 | 1.50 |
ENSMUST00000105680.9
|
Rere
|
arginine glutamic acid dipeptide (RE) repeats |
| chr10_-_80269436 | 1.44 |
ENSMUST00000105346.10
ENSMUST00000020377.13 ENSMUST00000105340.8 ENSMUST00000020379.13 ENSMUST00000105344.8 ENSMUST00000105342.8 ENSMUST00000105345.10 ENSMUST00000105343.8 |
Tcf3
|
transcription factor 3 |
| chr13_+_49835667 | 1.42 |
ENSMUST00000172254.3
|
Iars
|
isoleucine-tRNA synthetase |
| chr17_+_27276262 | 1.33 |
ENSMUST00000049308.9
|
Itpr3
|
inositol 1,4,5-triphosphate receptor 3 |
| chr2_-_129213050 | 1.33 |
ENSMUST00000028881.14
|
Il1b
|
interleukin 1 beta |
| chr12_+_37291632 | 1.32 |
ENSMUST00000049874.14
|
Agmo
|
alkylglycerol monooxygenase |
| chr16_+_57369595 | 1.32 |
ENSMUST00000159414.2
|
Filip1l
|
filamin A interacting protein 1-like |
| chr4_+_152123772 | 1.30 |
ENSMUST00000084116.13
ENSMUST00000103197.5 |
Nol9
|
nucleolar protein 9 |
| chr17_+_87270504 | 1.28 |
ENSMUST00000024956.15
|
Rhoq
|
ras homolog family member Q |
| chr5_+_75312939 | 1.25 |
ENSMUST00000202681.4
ENSMUST00000000476.15 |
Pdgfra
|
platelet derived growth factor receptor, alpha polypeptide |
| chr7_-_13723513 | 1.25 |
ENSMUST00000165167.8
ENSMUST00000108520.4 |
Sult2a4
|
sulfotransferase family 2A, dehydroepiandrosterone (DHEA)-preferring, member 4 |
| chr8_-_37419567 | 1.21 |
ENSMUST00000163663.3
|
Dlc1
|
deleted in liver cancer 1 |
| chr11_-_101442663 | 1.19 |
ENSMUST00000017290.11
|
Brca1
|
breast cancer 1, early onset |
| chr9_+_107957621 | 1.19 |
ENSMUST00000035211.14
|
Mst1
|
macrophage stimulating 1 (hepatocyte growth factor-like) |
| chr5_-_137531413 | 1.19 |
ENSMUST00000168746.8
|
Gnb2
|
guanine nucleotide binding protein (G protein), beta 2 |
| chr18_-_52662917 | 1.16 |
ENSMUST00000171470.8
|
Lox
|
lysyl oxidase |
| chr5_-_124003553 | 1.16 |
ENSMUST00000057145.7
|
Hcar2
|
hydroxycarboxylic acid receptor 2 |
| chr16_+_45044678 | 1.13 |
ENSMUST00000102802.10
ENSMUST00000063654.6 |
Btla
|
B and T lymphocyte associated |
| chr9_+_107957640 | 1.11 |
ENSMUST00000162886.2
|
Mst1
|
macrophage stimulating 1 (hepatocyte growth factor-like) |
| chr15_+_59520199 | 1.11 |
ENSMUST00000067543.8
|
Trib1
|
tribbles pseudokinase 1 |
| chr2_-_152185901 | 1.10 |
ENSMUST00000040312.7
|
Trib3
|
tribbles pseudokinase 3 |
| chr8_+_95055829 | 1.07 |
ENSMUST00000034218.5
ENSMUST00000212134.2 |
Slc12a3
|
solute carrier family 12, member 3 |
| chr7_-_45084012 | 0.94 |
ENSMUST00000107771.12
ENSMUST00000211666.2 |
Ruvbl2
|
RuvB-like protein 2 |
| chr12_+_37292029 | 0.91 |
ENSMUST00000160390.2
|
Agmo
|
alkylglycerol monooxygenase |
| chr6_+_34686543 | 0.91 |
ENSMUST00000031775.13
|
Cald1
|
caldesmon 1 |
| chr4_+_124635635 | 0.90 |
ENSMUST00000094782.10
ENSMUST00000153837.8 ENSMUST00000154229.2 |
Inpp5b
|
inositol polyphosphate-5-phosphatase B |
| chr17_-_32503689 | 0.89 |
ENSMUST00000127893.8
|
Brd4
|
bromodomain containing 4 |
| chr10_-_6930376 | 0.86 |
ENSMUST00000105617.8
|
Ipcef1
|
interaction protein for cytohesin exchange factors 1 |
| chr19_+_12438125 | 0.85 |
ENSMUST00000081035.9
|
Mpeg1
|
macrophage expressed gene 1 |
| chr13_-_117161921 | 0.85 |
ENSMUST00000223949.2
|
Parp8
|
poly (ADP-ribose) polymerase family, member 8 |
| chrX_-_166047275 | 0.85 |
ENSMUST00000112170.2
|
Tlr8
|
toll-like receptor 8 |
| chr3_+_31150982 | 0.82 |
ENSMUST00000118204.2
|
Skil
|
SKI-like |
| chr18_-_52662728 | 0.81 |
ENSMUST00000025409.9
|
Lox
|
lysyl oxidase |
| chr15_-_37458768 | 0.79 |
ENSMUST00000116445.9
|
Ncald
|
neurocalcin delta |
| chr13_+_91071077 | 0.79 |
ENSMUST00000051955.9
|
Rps23
|
ribosomal protein S23 |
| chr7_-_126461522 | 0.79 |
ENSMUST00000206968.2
|
Ino80e
|
INO80 complex subunit E |
| chr12_+_8027767 | 0.78 |
ENSMUST00000037520.14
|
Apob
|
apolipoprotein B |
| chr14_-_54647647 | 0.74 |
ENSMUST00000228488.2
ENSMUST00000195970.5 |
Slc7a7
|
solute carrier family 7 (cationic amino acid transporter, y+ system), member 7 |
| chr15_+_25940859 | 0.74 |
ENSMUST00000226750.2
|
Retreg1
|
reticulophagy regulator 1 |
| chr13_+_49835576 | 0.73 |
ENSMUST00000165316.8
ENSMUST00000047363.14 |
Iars
|
isoleucine-tRNA synthetase |
| chr11_+_69983531 | 0.72 |
ENSMUST00000124721.2
|
Asgr2
|
asialoglycoprotein receptor 2 |
| chr17_-_29226700 | 0.71 |
ENSMUST00000233441.2
|
Stk38
|
serine/threonine kinase 38 |
| chr7_-_45083688 | 0.70 |
ENSMUST00000210439.2
|
Ruvbl2
|
RuvB-like protein 2 |
| chr8_+_95113066 | 0.69 |
ENSMUST00000161576.8
ENSMUST00000034220.8 |
Herpud1
|
homocysteine-inducible, endoplasmic reticulum stress-inducible, ubiquitin-like domain member 1 |
| chr19_-_34724689 | 0.68 |
ENSMUST00000009522.4
|
Slc16a12
|
solute carrier family 16 (monocarboxylic acid transporters), member 12 |
| chr11_-_3321307 | 0.68 |
ENSMUST00000101640.10
ENSMUST00000101642.10 |
Limk2
|
LIM motif-containing protein kinase 2 |
| chr7_-_3551003 | 0.66 |
ENSMUST00000065703.9
ENSMUST00000203020.3 ENSMUST00000203821.3 |
Tarm1
|
T cell-interacting, activating receptor on myeloid cells 1 |
| chrX_+_7630182 | 0.62 |
ENSMUST00000144900.2
ENSMUST00000115677.8 ENSMUST00000101695.9 ENSMUST00000115678.3 |
Tfe3
|
transcription factor E3 |
| chr10_+_127126643 | 0.62 |
ENSMUST00000026475.15
ENSMUST00000139091.2 ENSMUST00000230446.2 |
Ddit3
Ddit3
|
DNA-damage inducible transcript 3 DNA-damage inducible transcript 3 |
| chr13_-_117162041 | 0.62 |
ENSMUST00000022239.8
|
Parp8
|
poly (ADP-ribose) polymerase family, member 8 |
| chr15_+_59520493 | 0.60 |
ENSMUST00000118228.2
|
Trib1
|
tribbles pseudokinase 1 |
| chr9_-_55190902 | 0.60 |
ENSMUST00000164721.8
|
Nrg4
|
neuregulin 4 |
| chr6_+_141194886 | 0.58 |
ENSMUST00000043259.10
|
Pde3a
|
phosphodiesterase 3A, cGMP inhibited |
| chr1_-_52839530 | 0.57 |
ENSMUST00000159725.2
|
Inpp1
|
inositol polyphosphate-1-phosphatase |
| chr4_+_124880223 | 0.55 |
ENSMUST00000030687.8
|
Rspo1
|
R-spondin 1 |
| chr1_-_87501548 | 0.54 |
ENSMUST00000068681.12
|
Ngef
|
neuronal guanine nucleotide exchange factor |
| chr1_-_171173168 | 0.54 |
ENSMUST00000156856.8
ENSMUST00000111296.8 |
Nit1
|
nitrilase 1 |
| chr11_+_69983479 | 0.52 |
ENSMUST00000143772.8
|
Asgr2
|
asialoglycoprotein receptor 2 |
| chr11_-_115968576 | 0.52 |
ENSMUST00000106450.8
|
Unc13d
|
unc-13 homolog D |
| chr18_+_4994600 | 0.51 |
ENSMUST00000140448.8
|
Svil
|
supervillin |
| chr11_+_106107752 | 0.50 |
ENSMUST00000021046.6
|
Ddx42
|
DEAD box helicase 42 |
| chr8_+_46924074 | 0.50 |
ENSMUST00000034046.13
ENSMUST00000211644.2 |
Acsl1
|
acyl-CoA synthetase long-chain family member 1 |
Gene Ontology Analysis
Gene overrepresentation in biological process category:
| Log-likelihood per target | Total log-likelihood | Term | Description |
|---|---|---|---|
| 10.5 | 31.6 | GO:0015891 | iron chelate transport(GO:0015688) siderophore transport(GO:0015891) |
| 6.3 | 18.9 | GO:0033189 | response to vitamin A(GO:0033189) |
| 5.8 | 23.0 | GO:1901491 | negative regulation of lymphangiogenesis(GO:1901491) |
| 5.5 | 16.4 | GO:0009087 | methionine catabolic process(GO:0009087) |
| 4.7 | 14.0 | GO:0002780 | antimicrobial peptide biosynthetic process(GO:0002777) antibacterial peptide biosynthetic process(GO:0002780) neutrophil mediated killing of fungus(GO:0070947) |
| 3.9 | 23.2 | GO:0000738 | DNA catabolic process, exonucleolytic(GO:0000738) |
| 3.6 | 14.5 | GO:1902109 | negative regulation of mitochondrial membrane permeability involved in apoptotic process(GO:1902109) |
| 3.0 | 11.9 | GO:1900190 | biofilm formation(GO:0042710) single-species biofilm formation(GO:0044010) single-species biofilm formation in or on host organism(GO:0044407) membrane disruption in other organism(GO:0051673) regulation of single-species biofilm formation(GO:1900190) negative regulation of single-species biofilm formation(GO:1900191) regulation of single-species biofilm formation in or on host organism(GO:1900228) negative regulation of single-species biofilm formation in or on host organism(GO:1900229) |
| 2.9 | 5.7 | GO:0032499 | detection of peptidoglycan(GO:0032499) |
| 2.6 | 28.4 | GO:0002227 | innate immune response in mucosa(GO:0002227) |
| 2.1 | 10.5 | GO:2000660 | negative regulation of interleukin-1-mediated signaling pathway(GO:2000660) |
| 2.0 | 6.1 | GO:0010752 | negative regulation of antigen processing and presentation of peptide or polysaccharide antigen via MHC class II(GO:0002581) regulation of cGMP-mediated signaling(GO:0010752) |
| 1.9 | 5.8 | GO:0015920 | lipopolysaccharide transport(GO:0015920) |
| 1.9 | 7.5 | GO:0015855 | nucleobase transport(GO:0015851) pyrimidine nucleobase transport(GO:0015855) |
| 1.7 | 5.2 | GO:0006788 | heme oxidation(GO:0006788) |
| 1.6 | 4.9 | GO:0031104 | dendrite regeneration(GO:0031104) |
| 1.2 | 3.5 | GO:0070839 | divalent metal ion export(GO:0070839) |
| 1.1 | 4.4 | GO:0043152 | induction of bacterial agglutination(GO:0043152) |
| 1.1 | 4.2 | GO:0006049 | UDP-N-acetylglucosamine catabolic process(GO:0006049) |
| 0.9 | 2.7 | GO:1903281 | positive regulation of calcium:sodium antiporter activity(GO:1903281) |
| 0.9 | 3.5 | GO:0010536 | positive regulation of activation of Janus kinase activity(GO:0010536) |
| 0.8 | 10.0 | GO:0048251 | elastic fiber assembly(GO:0048251) |
| 0.8 | 3.1 | GO:0071725 | response to triacyl bacterial lipopeptide(GO:0071725) cellular response to triacyl bacterial lipopeptide(GO:0071727) |
| 0.8 | 3.1 | GO:0006507 | GPI anchor release(GO:0006507) regulation of high-density lipoprotein particle clearance(GO:0010982) |
| 0.8 | 2.3 | GO:1904092 | regulation of autophagic cell death(GO:1904092) negative regulation of autophagic cell death(GO:1904093) |
| 0.7 | 2.1 | GO:0006428 | isoleucyl-tRNA aminoacylation(GO:0006428) |
| 0.6 | 2.5 | GO:0050717 | positive regulation of interleukin-1 alpha secretion(GO:0050717) |
| 0.6 | 5.0 | GO:0090080 | positive regulation of MAPKKK cascade by fibroblast growth factor receptor signaling pathway(GO:0090080) |
| 0.6 | 4.9 | GO:0070447 | positive regulation of oligodendrocyte progenitor proliferation(GO:0070447) |
| 0.6 | 17.8 | GO:0030502 | negative regulation of bone mineralization(GO:0030502) |
| 0.6 | 1.8 | GO:0044704 | mating plug formation(GO:0042628) single-organism reproductive behavior(GO:0044704) post-mating behavior(GO:0045297) seminal vesicle development(GO:0061107) |
| 0.6 | 1.7 | GO:0045645 | regulation of eosinophil differentiation(GO:0045643) positive regulation of eosinophil differentiation(GO:0045645) |
| 0.5 | 1.6 | GO:0035526 | retrograde transport, plasma membrane to Golgi(GO:0035526) |
| 0.5 | 1.5 | GO:0008588 | release of cytoplasmic sequestered NF-kappaB(GO:0008588) |
| 0.5 | 2.9 | GO:0006651 | diacylglycerol biosynthetic process(GO:0006651) positive regulation of phospholipase A2 activity(GO:0032430) |
| 0.5 | 4.2 | GO:0002291 | T cell activation via T cell receptor contact with antigen bound to MHC molecule on antigen presenting cell(GO:0002291) |
| 0.4 | 18.3 | GO:0006767 | water-soluble vitamin metabolic process(GO:0006767) |
| 0.4 | 1.3 | GO:0060557 | positive regulation of vitamin metabolic process(GO:0046136) positive regulation of vitamin D biosynthetic process(GO:0060557) positive regulation of calcidiol 1-monooxygenase activity(GO:0060559) |
| 0.4 | 1.3 | GO:0000448 | cleavage in ITS2 between 5.8S rRNA and LSU-rRNA of tricistronic rRNA transcript (SSU-rRNA, 5.8S rRNA, LSU-rRNA)(GO:0000448) |
| 0.4 | 15.1 | GO:0006825 | copper ion transport(GO:0006825) |
| 0.4 | 1.7 | GO:2000230 | negative regulation of pancreatic stellate cell proliferation(GO:2000230) |
| 0.4 | 2.1 | GO:0018343 | protein farnesylation(GO:0018343) |
| 0.4 | 2.1 | GO:0010747 | positive regulation of plasma membrane long-chain fatty acid transport(GO:0010747) |
| 0.4 | 1.6 | GO:0090579 | transcriptional activation by promoter-enhancer looping(GO:0071733) gene looping(GO:0090202) dsDNA loop formation(GO:0090579) |
| 0.4 | 1.6 | GO:2001137 | protein retention in Golgi apparatus(GO:0045053) positive regulation of endocytic recycling(GO:2001137) |
| 0.4 | 1.2 | GO:0051572 | negative regulation of histone H3-K4 methylation(GO:0051572) |
| 0.4 | 4.7 | GO:0019800 | peptide cross-linking via chondroitin 4-sulfate glycosaminoglycan(GO:0019800) |
| 0.4 | 25.8 | GO:0050819 | negative regulation of coagulation(GO:0050819) |
| 0.4 | 1.6 | GO:0021993 | initiation of neural tube closure(GO:0021993) |
| 0.4 | 2.3 | GO:0015867 | ATP transport(GO:0015867) |
| 0.4 | 1.5 | GO:0021691 | cerebellar Purkinje cell layer maturation(GO:0021691) |
| 0.4 | 4.8 | GO:0046485 | ether lipid metabolic process(GO:0046485) |
| 0.4 | 2.6 | GO:0003376 | sphingosine-1-phosphate signaling pathway(GO:0003376) |
| 0.3 | 10.2 | GO:0015721 | bile acid and bile salt transport(GO:0015721) |
| 0.3 | 6.5 | GO:0007250 | activation of NF-kappaB-inducing kinase activity(GO:0007250) |
| 0.3 | 4.0 | GO:0000185 | activation of MAPKKK activity(GO:0000185) |
| 0.3 | 2.4 | GO:0032020 | ISG15-protein conjugation(GO:0032020) |
| 0.3 | 2.4 | GO:0002432 | granuloma formation(GO:0002432) |
| 0.3 | 1.2 | GO:0033031 | positive regulation of neutrophil apoptotic process(GO:0033031) |
| 0.3 | 6.6 | GO:0030574 | collagen catabolic process(GO:0030574) |
| 0.3 | 3.3 | GO:0010838 | positive regulation of keratinocyte proliferation(GO:0010838) |
| 0.3 | 3.3 | GO:0045876 | positive regulation of sister chromatid cohesion(GO:0045876) |
| 0.3 | 1.3 | GO:0050916 | sensory perception of sweet taste(GO:0050916) sensory perception of umami taste(GO:0050917) |
| 0.3 | 1.6 | GO:0072592 | oxygen metabolic process(GO:0072592) |
| 0.3 | 2.3 | GO:0060763 | mammary duct terminal end bud growth(GO:0060763) |
| 0.2 | 0.7 | GO:0015881 | creatine transport(GO:0015881) |
| 0.2 | 10.7 | GO:0030225 | macrophage differentiation(GO:0030225) |
| 0.2 | 3.9 | GO:0019731 | antibacterial humoral response(GO:0019731) |
| 0.2 | 1.7 | GO:0006561 | proline biosynthetic process(GO:0006561) |
| 0.2 | 6.0 | GO:0040034 | regulation of development, heterochronic(GO:0040034) |
| 0.2 | 5.5 | GO:0050832 | defense response to fungus(GO:0050832) |
| 0.2 | 1.4 | GO:0002326 | B cell lineage commitment(GO:0002326) |
| 0.2 | 2.5 | GO:0007016 | cytoskeletal anchoring at plasma membrane(GO:0007016) |
| 0.2 | 0.6 | GO:2000016 | negative regulation of determination of dorsal identity(GO:2000016) |
| 0.1 | 1.0 | GO:0006207 | 'de novo' pyrimidine nucleobase biosynthetic process(GO:0006207) pyrimidine nucleobase biosynthetic process(GO:0019856) |
| 0.1 | 2.7 | GO:0038166 | angiotensin-activated signaling pathway(GO:0038166) |
| 0.1 | 3.2 | GO:0030213 | hyaluronan biosynthetic process(GO:0030213) |
| 0.1 | 2.7 | GO:0006337 | nucleosome disassembly(GO:0006337) |
| 0.1 | 2.8 | GO:0046185 | aldehyde catabolic process(GO:0046185) |
| 0.1 | 2.5 | GO:0046085 | adenosine metabolic process(GO:0046085) |
| 0.1 | 0.3 | GO:0048807 | female genitalia morphogenesis(GO:0048807) |
| 0.1 | 0.3 | GO:0060217 | hemangioblast cell differentiation(GO:0060217) |
| 0.1 | 1.3 | GO:0006642 | triglyceride mobilization(GO:0006642) |
| 0.1 | 0.7 | GO:1903071 | positive regulation of ER-associated ubiquitin-dependent protein catabolic process(GO:1903071) |
| 0.1 | 0.7 | GO:0045416 | positive regulation of interleukin-8 biosynthetic process(GO:0045416) |
| 0.1 | 5.9 | GO:0030318 | melanocyte differentiation(GO:0030318) |
| 0.1 | 0.6 | GO:0060282 | positive regulation of oocyte development(GO:0060282) |
| 0.1 | 2.0 | GO:0060391 | positive regulation of SMAD protein import into nucleus(GO:0060391) |
| 0.1 | 3.8 | GO:0030199 | collagen fibril organization(GO:0030199) |
| 0.1 | 0.3 | GO:1903936 | response to diamide(GO:0072737) cellular response to diamide(GO:0072738) cellular response to sodium arsenite(GO:1903936) |
| 0.1 | 0.3 | GO:1903598 | positive regulation of gap junction assembly(GO:1903598) |
| 0.1 | 1.2 | GO:1900119 | positive regulation of execution phase of apoptosis(GO:1900119) |
| 0.1 | 1.1 | GO:0046642 | negative regulation of alpha-beta T cell proliferation(GO:0046642) |
| 0.1 | 2.0 | GO:0045589 | regulation of regulatory T cell differentiation(GO:0045589) |
| 0.1 | 0.8 | GO:1902231 | positive regulation of intrinsic apoptotic signaling pathway in response to DNA damage(GO:1902231) |
| 0.1 | 0.3 | GO:0042539 | hypotonic salinity response(GO:0042539) cellular hypotonic salinity response(GO:0071477) |
| 0.1 | 1.8 | GO:0045898 | regulation of RNA polymerase II transcriptional preinitiation complex assembly(GO:0045898) |
| 0.1 | 0.5 | GO:0014835 | myoblast differentiation involved in skeletal muscle regeneration(GO:0014835) |
| 0.1 | 2.3 | GO:0045187 | regulation of circadian sleep/wake cycle, sleep(GO:0045187) |
| 0.1 | 1.1 | GO:0045717 | negative regulation of fatty acid biosynthetic process(GO:0045717) |
| 0.1 | 0.2 | GO:0030573 | bile acid catabolic process(GO:0030573) |
| 0.1 | 0.4 | GO:0010968 | regulation of microtubule nucleation(GO:0010968) |
| 0.0 | 0.5 | GO:0044539 | long-chain fatty acid import(GO:0044539) |
| 0.0 | 1.8 | GO:0030866 | cortical actin cytoskeleton organization(GO:0030866) |
| 0.0 | 3.0 | GO:0009250 | glycogen biosynthetic process(GO:0005978) glucan biosynthetic process(GO:0009250) |
| 0.0 | 3.8 | GO:0046889 | positive regulation of lipid biosynthetic process(GO:0046889) |
| 0.0 | 4.3 | GO:0003073 | regulation of systemic arterial blood pressure(GO:0003073) |
| 0.0 | 0.5 | GO:0002934 | desmosome organization(GO:0002934) |
| 0.0 | 0.5 | GO:0061002 | negative regulation of dendritic spine morphogenesis(GO:0061002) |
| 0.0 | 2.4 | GO:0043407 | negative regulation of MAP kinase activity(GO:0043407) |
| 0.0 | 0.2 | GO:0000821 | regulation of arginine metabolic process(GO:0000821) |
| 0.0 | 3.2 | GO:0030032 | lamellipodium assembly(GO:0030032) |
| 0.0 | 0.1 | GO:0071475 | cellular hyperosmotic salinity response(GO:0071475) |
| 0.0 | 0.9 | GO:0046856 | phosphatidylinositol dephosphorylation(GO:0046856) |
| 0.0 | 2.1 | GO:0090263 | positive regulation of canonical Wnt signaling pathway(GO:0090263) |
| 0.0 | 0.9 | GO:0006940 | regulation of smooth muscle contraction(GO:0006940) |
| 0.0 | 6.8 | GO:0008202 | steroid metabolic process(GO:0008202) |
| 0.0 | 0.3 | GO:0071498 | cellular response to fluid shear stress(GO:0071498) |
| 0.0 | 2.8 | GO:0007173 | epidermal growth factor receptor signaling pathway(GO:0007173) |
| 0.0 | 0.2 | GO:0006564 | L-serine biosynthetic process(GO:0006564) |
| 0.0 | 0.3 | GO:0006670 | sphingosine metabolic process(GO:0006670) |
| 0.0 | 1.7 | GO:0007200 | phospholipase C-activating G-protein coupled receptor signaling pathway(GO:0007200) |
| 0.0 | 0.6 | GO:0046854 | phosphatidylinositol phosphorylation(GO:0046854) |
| 0.0 | 2.4 | GO:0006958 | complement activation, classical pathway(GO:0006958) |
| 0.0 | 3.2 | GO:0010506 | regulation of autophagy(GO:0010506) |
| 0.0 | 0.1 | GO:0060356 | leucine import(GO:0060356) |
| 0.0 | 0.1 | GO:0045066 | CD4-positive, CD25-positive, alpha-beta regulatory T cell differentiation(GO:0002361) regulatory T cell differentiation(GO:0045066) |
| 0.0 | 0.7 | GO:0045670 | regulation of osteoclast differentiation(GO:0045670) |
| 0.0 | 0.2 | GO:0006622 | protein targeting to lysosome(GO:0006622) |
| 0.0 | 10.9 | GO:0051726 | regulation of cell cycle(GO:0051726) |
| 0.0 | 2.1 | GO:0000209 | protein polyubiquitination(GO:0000209) |
Gene overrepresentation in cellular component category:
| Log-likelihood per target | Total log-likelihood | Term | Description |
|---|---|---|---|
| 2.0 | 11.9 | GO:0044279 | other organism cell membrane(GO:0044218) other organism membrane(GO:0044279) |
| 1.8 | 14.3 | GO:0005577 | fibrinogen complex(GO:0005577) |
| 1.7 | 3.5 | GO:0070820 | tertiary granule(GO:0070820) |
| 1.6 | 8.1 | GO:0071953 | elastic fiber(GO:0071953) |
| 1.3 | 28.4 | GO:0042581 | specific granule(GO:0042581) |
| 1.0 | 2.9 | GO:0032311 | angiogenin-PRI complex(GO:0032311) |
| 0.9 | 3.5 | GO:0005896 | interleukin-6 receptor complex(GO:0005896) |
| 0.7 | 2.1 | GO:0005965 | protein farnesyltransferase complex(GO:0005965) |
| 0.6 | 2.5 | GO:0097169 | AIM2 inflammasome complex(GO:0097169) |
| 0.5 | 4.9 | GO:0031265 | CD95 death-inducing signaling complex(GO:0031265) |
| 0.5 | 6.7 | GO:0031232 | extrinsic component of external side of plasma membrane(GO:0031232) |
| 0.4 | 1.3 | GO:0034359 | mature chylomicron(GO:0034359) |
| 0.4 | 23.2 | GO:0015030 | Cajal body(GO:0015030) |
| 0.4 | 3.1 | GO:0046696 | lipopolysaccharide receptor complex(GO:0046696) |
| 0.3 | 3.3 | GO:0042382 | paraspeckles(GO:0042382) |
| 0.3 | 2.7 | GO:0005890 | sodium:potassium-exchanging ATPase complex(GO:0005890) |
| 0.2 | 2.4 | GO:0033093 | Weibel-Palade body(GO:0033093) |
| 0.2 | 4.7 | GO:0098644 | complex of collagen trimers(GO:0098644) |
| 0.2 | 0.6 | GO:0036488 | CHOP-C/EBP complex(GO:0036488) |
| 0.2 | 1.6 | GO:0097255 | R2TP complex(GO:0097255) |
| 0.2 | 0.7 | GO:1990037 | Lewy body core(GO:1990037) |
| 0.1 | 10.2 | GO:0046658 | anchored component of plasma membrane(GO:0046658) |
| 0.1 | 4.2 | GO:0042101 | T cell receptor complex(GO:0042101) |
| 0.1 | 2.1 | GO:0017101 | aminoacyl-tRNA synthetase multienzyme complex(GO:0017101) |
| 0.1 | 1.4 | GO:0000788 | nuclear nucleosome(GO:0000788) |
| 0.1 | 0.3 | GO:0033193 | Lsd1/2 complex(GO:0033193) |
| 0.1 | 15.8 | GO:0016363 | nuclear matrix(GO:0016363) |
| 0.1 | 17.4 | GO:0031225 | anchored component of membrane(GO:0031225) |
| 0.1 | 1.2 | GO:0070531 | BRCA1-A complex(GO:0070531) |
| 0.1 | 1.9 | GO:0043083 | synaptic cleft(GO:0043083) |
| 0.1 | 1.6 | GO:0005641 | nuclear envelope lumen(GO:0005641) |
| 0.1 | 0.9 | GO:0030478 | actin cap(GO:0030478) |
| 0.1 | 10.8 | GO:0017053 | transcriptional repressor complex(GO:0017053) |
| 0.1 | 29.2 | GO:0016323 | basolateral plasma membrane(GO:0016323) |
| 0.1 | 9.0 | GO:0005882 | intermediate filament(GO:0005882) |
| 0.1 | 2.0 | GO:0005685 | U1 snRNP(GO:0005685) |
| 0.1 | 1.3 | GO:0005640 | nuclear outer membrane(GO:0005640) |
| 0.1 | 14.4 | GO:0005741 | mitochondrial outer membrane(GO:0005741) organelle outer membrane(GO:0031968) |
| 0.1 | 6.4 | GO:0005901 | caveola(GO:0005901) |
| 0.1 | 13.3 | GO:0072562 | blood microparticle(GO:0072562) |
| 0.1 | 4.4 | GO:0005581 | collagen trimer(GO:0005581) |
| 0.0 | 0.8 | GO:0031011 | Ino80 complex(GO:0031011) |
| 0.0 | 3.1 | GO:0000307 | cyclin-dependent protein kinase holoenzyme complex(GO:0000307) |
| 0.0 | 3.3 | GO:0016234 | inclusion body(GO:0016234) |
| 0.0 | 2.9 | GO:0005811 | lipid particle(GO:0005811) |
| 0.0 | 4.9 | GO:0032993 | protein-DNA complex(GO:0032993) |
| 0.0 | 0.3 | GO:0000778 | condensed nuclear chromosome kinetochore(GO:0000778) |
| 0.0 | 1.5 | GO:0000118 | histone deacetylase complex(GO:0000118) |
| 0.0 | 6.5 | GO:0098852 | lysosomal membrane(GO:0005765) lytic vacuole membrane(GO:0098852) |
| 0.0 | 1.6 | GO:0045335 | phagocytic vesicle(GO:0045335) |
| 0.0 | 1.3 | GO:0045111 | intermediate filament cytoskeleton(GO:0045111) |
| 0.0 | 11.1 | GO:0005667 | transcription factor complex(GO:0005667) |
| 0.0 | 3.1 | GO:0030027 | lamellipodium(GO:0030027) |
| 0.0 | 2.5 | GO:0001669 | acrosomal vesicle(GO:0001669) |
| 0.0 | 5.3 | GO:0009897 | external side of plasma membrane(GO:0009897) |
| 0.0 | 4.1 | GO:0001726 | ruffle(GO:0001726) |
| 0.0 | 0.5 | GO:0043034 | costamere(GO:0043034) |
| 0.0 | 1.8 | GO:0005884 | actin filament(GO:0005884) |
| 0.0 | 4.7 | GO:0005578 | proteinaceous extracellular matrix(GO:0005578) |
| 0.0 | 17.6 | GO:0031410 | cytoplasmic vesicle(GO:0031410) |
| 0.0 | 0.8 | GO:0022627 | cytosolic small ribosomal subunit(GO:0022627) |
| 0.0 | 0.7 | GO:0005801 | cis-Golgi network(GO:0005801) |
| 0.0 | 1.1 | GO:0005913 | cell-cell adherens junction(GO:0005913) |
| 0.0 | 0.3 | GO:0001741 | XY body(GO:0001741) |
| 0.0 | 4.7 | GO:0009986 | cell surface(GO:0009986) |
Gene overrepresentation in molecular function category:
| Log-likelihood per target | Total log-likelihood | Term | Description |
|---|---|---|---|
| 4.6 | 23.2 | GO:0008859 | exoribonuclease II activity(GO:0008859) |
| 4.1 | 16.4 | GO:0004478 | methionine adenosyltransferase activity(GO:0004478) |
| 3.6 | 25.1 | GO:0050656 | alcohol sulfotransferase activity(GO:0004027) 3'-phosphoadenosine 5'-phosphosulfate binding(GO:0050656) |
| 2.8 | 8.5 | GO:0005152 | interleukin-1 receptor antagonist activity(GO:0005152) |
| 2.5 | 19.7 | GO:0005499 | vitamin D binding(GO:0005499) |
| 1.7 | 5.2 | GO:0004392 | heme oxygenase (decyclizing) activity(GO:0004392) |
| 1.7 | 10.1 | GO:0030294 | receptor signaling protein tyrosine kinase inhibitor activity(GO:0030294) |
| 1.6 | 14.6 | GO:0070891 | lipoteichoic acid binding(GO:0070891) |
| 1.6 | 4.8 | GO:0050479 | glyceryl-ether monooxygenase activity(GO:0050479) |
| 1.5 | 16.9 | GO:0015217 | ATP transmembrane transporter activity(GO:0005347) ADP transmembrane transporter activity(GO:0015217) |
| 1.5 | 6.1 | GO:0070052 | collagen V binding(GO:0070052) |
| 1.5 | 7.5 | GO:0015254 | purine nucleobase transmembrane transporter activity(GO:0005345) pyrimidine nucleobase transmembrane transporter activity(GO:0005350) nucleobase transmembrane transporter activity(GO:0015205) glycerol channel activity(GO:0015254) |
| 1.3 | 10.2 | GO:0008508 | bile acid:sodium symporter activity(GO:0008508) |
| 1.2 | 3.7 | GO:0004373 | glycogen (starch) synthase activity(GO:0004373) |
| 1.2 | 4.9 | GO:0043120 | tumor necrosis factor binding(GO:0043120) |
| 1.2 | 13.2 | GO:0016724 | ferroxidase activity(GO:0004322) oxidoreductase activity, oxidizing metal ions, oxygen as acceptor(GO:0016724) |
| 1.2 | 3.5 | GO:0019981 | interleukin-6 receptor activity(GO:0004915) interleukin-6 binding(GO:0019981) |
| 1.1 | 4.2 | GO:0003827 | alpha-1,3-mannosylglycoprotein 2-beta-N-acetylglucosaminyltransferase activity(GO:0003827) |
| 0.7 | 2.2 | GO:0051916 | granulocyte colony-stimulating factor binding(GO:0051916) |
| 0.7 | 2.1 | GO:0004822 | isoleucine-tRNA ligase activity(GO:0004822) |
| 0.7 | 2.1 | GO:0004660 | protein farnesyltransferase activity(GO:0004660) |
| 0.7 | 4.9 | GO:0072510 | ferric iron transmembrane transporter activity(GO:0015091) trivalent inorganic cation transmembrane transporter activity(GO:0072510) |
| 0.5 | 2.7 | GO:0004945 | angiotensin type II receptor activity(GO:0004945) |
| 0.5 | 11.9 | GO:0001530 | lipopolysaccharide binding(GO:0001530) |
| 0.5 | 6.5 | GO:0008061 | chitin binding(GO:0008061) |
| 0.4 | 2.6 | GO:0046624 | sphingolipid transporter activity(GO:0046624) |
| 0.4 | 1.3 | GO:0005017 | platelet-derived growth factor-activated receptor activity(GO:0005017) |
| 0.4 | 2.4 | GO:0042296 | ISG15 transferase activity(GO:0042296) |
| 0.4 | 2.0 | GO:0035614 | snRNA stem-loop binding(GO:0035614) |
| 0.4 | 40.9 | GO:0004869 | cysteine-type endopeptidase inhibitor activity(GO:0004869) |
| 0.4 | 3.1 | GO:0004630 | phospholipase D activity(GO:0004630) |
| 0.4 | 22.5 | GO:0008146 | sulfotransferase activity(GO:0008146) |
| 0.3 | 1.0 | GO:0004087 | carbamoyl-phosphate synthase (ammonia) activity(GO:0004087) carbamoyl-phosphate synthase (glutamine-hydrolyzing) activity(GO:0004088) |
| 0.3 | 1.7 | GO:0004735 | pyrroline-5-carboxylate reductase activity(GO:0004735) |
| 0.3 | 1.3 | GO:0000822 | inositol hexakisphosphate binding(GO:0000822) |
| 0.3 | 2.0 | GO:0004720 | protein-lysine 6-oxidase activity(GO:0004720) |
| 0.3 | 3.3 | GO:0003810 | protein-glutamine gamma-glutamyltransferase activity(GO:0003810) |
| 0.3 | 2.8 | GO:0004030 | aldehyde dehydrogenase [NAD(P)+] activity(GO:0004030) |
| 0.3 | 0.9 | GO:0052658 | inositol-1,4,5-trisphosphate 5-phosphatase activity(GO:0052658) |
| 0.3 | 1.7 | GO:0004966 | galanin receptor activity(GO:0004966) |
| 0.3 | 4.1 | GO:0030274 | LIM domain binding(GO:0030274) |
| 0.2 | 2.0 | GO:0019966 | interleukin-1 binding(GO:0019966) |
| 0.2 | 11.6 | GO:0001106 | RNA polymerase II transcription corepressor activity(GO:0001106) |
| 0.2 | 1.4 | GO:0070644 | vitamin D response element binding(GO:0070644) |
| 0.2 | 1.9 | GO:0052851 | cupric reductase activity(GO:0008823) ferric-chelate reductase (NADPH) activity(GO:0052851) |
| 0.2 | 2.5 | GO:0050700 | CARD domain binding(GO:0050700) |
| 0.2 | 0.7 | GO:0005308 | creatine transmembrane transporter activity(GO:0005308) |
| 0.2 | 2.7 | GO:0005391 | sodium:potassium-exchanging ATPase activity(GO:0005391) |
| 0.2 | 3.5 | GO:0015299 | solute:proton antiporter activity(GO:0015299) |
| 0.2 | 4.0 | GO:0036312 | phosphatidylinositol 3-kinase regulatory subunit binding(GO:0036312) |
| 0.2 | 1.6 | GO:0043141 | ATP-dependent 5'-3' DNA helicase activity(GO:0043141) |
| 0.2 | 1.3 | GO:0051731 | polynucleotide 5'-hydroxyl-kinase activity(GO:0051731) |
| 0.2 | 1.7 | GO:0050692 | DBD domain binding(GO:0050692) |
| 0.2 | 18.6 | GO:0016811 | hydrolase activity, acting on carbon-nitrogen (but not peptide) bonds, in linear amides(GO:0016811) |
| 0.2 | 18.8 | GO:0042562 | hormone binding(GO:0042562) |
| 0.2 | 1.6 | GO:0030306 | ADP-ribosylation factor binding(GO:0030306) |
| 0.1 | 2.7 | GO:0003688 | DNA replication origin binding(GO:0003688) |
| 0.1 | 1.6 | GO:0004499 | N,N-dimethylaniline monooxygenase activity(GO:0004499) |
| 0.1 | 0.6 | GO:0004441 | inositol-1,4-bisphosphate 1-phosphatase activity(GO:0004441) |
| 0.1 | 2.8 | GO:0055106 | ubiquitin-protein transferase regulator activity(GO:0055106) |
| 0.1 | 9.8 | GO:0001205 | transcriptional activator activity, RNA polymerase II distal enhancer sequence-specific binding(GO:0001205) |
| 0.1 | 2.6 | GO:0102391 | decanoate--CoA ligase activity(GO:0102391) |
| 0.1 | 21.8 | GO:0002020 | protease binding(GO:0002020) |
| 0.1 | 0.3 | GO:0034632 | retinol transporter activity(GO:0034632) |
| 0.1 | 5.0 | GO:0005104 | fibroblast growth factor receptor binding(GO:0005104) |
| 0.1 | 1.5 | GO:0015377 | cation:chloride symporter activity(GO:0015377) |
| 0.1 | 5.3 | GO:0050699 | WW domain binding(GO:0050699) |
| 0.1 | 2.5 | GO:0008253 | 5'-nucleotidase activity(GO:0008253) |
| 0.1 | 1.8 | GO:0005522 | profilin binding(GO:0005522) |
| 0.1 | 5.8 | GO:0008028 | monocarboxylic acid transmembrane transporter activity(GO:0008028) |
| 0.1 | 1.3 | GO:0035473 | lipase binding(GO:0035473) |
| 0.1 | 2.4 | GO:0004435 | phosphatidylinositol phospholipase C activity(GO:0004435) |
| 0.1 | 4.1 | GO:0043014 | alpha-tubulin binding(GO:0043014) |
| 0.1 | 1.6 | GO:0051864 | histone demethylase activity (H3-K36 specific)(GO:0051864) |
| 0.1 | 0.3 | GO:0042392 | sphingosine-1-phosphate phosphatase activity(GO:0042392) |
| 0.1 | 1.3 | GO:0005149 | interleukin-1 receptor binding(GO:0005149) |
| 0.1 | 0.6 | GO:0008140 | cAMP response element binding protein binding(GO:0008140) |
| 0.1 | 1.2 | GO:0017166 | vinculin binding(GO:0017166) |
| 0.1 | 3.2 | GO:0004693 | cyclin-dependent protein serine/threonine kinase activity(GO:0004693) |
| 0.1 | 7.6 | GO:0005178 | integrin binding(GO:0005178) |
| 0.1 | 4.7 | GO:0005518 | collagen binding(GO:0005518) |
| 0.1 | 1.5 | GO:0003950 | NAD+ ADP-ribosyltransferase activity(GO:0003950) |
| 0.0 | 2.9 | GO:0005507 | copper ion binding(GO:0005507) |
| 0.0 | 0.5 | GO:0051525 | NFAT protein binding(GO:0051525) |
| 0.0 | 0.3 | GO:0008241 | peptidyl-dipeptidase activity(GO:0008241) |
| 0.0 | 3.6 | GO:0000980 | RNA polymerase II distal enhancer sequence-specific DNA binding(GO:0000980) |
| 0.0 | 2.2 | GO:0031624 | ubiquitin conjugating enzyme binding(GO:0031624) |
| 0.0 | 4.2 | GO:0004222 | metalloendopeptidase activity(GO:0004222) |
| 0.0 | 0.2 | GO:0033765 | steroid dehydrogenase activity, acting on the CH-CH group of donors(GO:0033765) |
| 0.0 | 1.3 | GO:0008483 | transaminase activity(GO:0008483) |
| 0.0 | 2.3 | GO:0030971 | receptor tyrosine kinase binding(GO:0030971) |
| 0.0 | 5.2 | GO:0030674 | protein binding, bridging(GO:0030674) |
| 0.0 | 0.2 | GO:0004594 | pantothenate kinase activity(GO:0004594) |
| 0.0 | 3.9 | GO:0005089 | Rho guanyl-nucleotide exchange factor activity(GO:0005089) |
| 0.0 | 0.8 | GO:0031435 | mitogen-activated protein kinase kinase kinase binding(GO:0031435) |
| 0.0 | 0.1 | GO:0004920 | interleukin-10 receptor activity(GO:0004920) |
| 0.0 | 0.9 | GO:0005044 | scavenger receptor activity(GO:0005044) |
| 0.0 | 0.3 | GO:0032183 | SUMO binding(GO:0032183) |
| 0.0 | 5.4 | GO:0003924 | GTPase activity(GO:0003924) |
| 0.0 | 10.1 | GO:0005198 | structural molecule activity(GO:0005198) |
| 0.0 | 0.6 | GO:0004115 | 3',5'-cyclic-AMP phosphodiesterase activity(GO:0004115) |
| 0.0 | 1.6 | GO:0034987 | immunoglobulin receptor binding(GO:0034987) |
| 0.0 | 0.2 | GO:0019870 | potassium channel inhibitor activity(GO:0019870) |
| 0.0 | 0.1 | GO:0046920 | alpha-(1->3)-fucosyltransferase activity(GO:0046920) |
| 0.0 | 0.2 | GO:0015174 | basic amino acid transmembrane transporter activity(GO:0015174) |
Gene overrepresentation in curated gene sets: canonical pathways category:
| Log-likelihood per target | Total log-likelihood | Term | Description |
|---|---|---|---|
| 3.2 | 28.4 | ST PAC1 RECEPTOR PATHWAY | PAC1 Receptor Pathway |
| 0.5 | 17.9 | PID INTEGRIN2 PATHWAY | Beta2 integrin cell surface interactions |
| 0.3 | 17.1 | PID UPA UPAR PATHWAY | Urokinase-type plasminogen activator (uPA) and uPAR-mediated signaling |
| 0.3 | 4.9 | SA FAS SIGNALING | The TNF-type receptor Fas induces apoptosis on ligand binding. |
| 0.3 | 12.8 | PID INTEGRIN A4B1 PATHWAY | Alpha4 beta1 integrin signaling events |
| 0.3 | 14.3 | PID IL1 PATHWAY | IL1-mediated signaling events |
| 0.2 | 9.9 | PID FRA PATHWAY | Validated transcriptional targets of AP1 family members Fra1 and Fra2 |
| 0.2 | 5.5 | PID INSULIN GLUCOSE PATHWAY | Insulin-mediated glucose transport |
| 0.1 | 4.5 | PID P38 MKK3 6PATHWAY | p38 MAPK signaling pathway |
| 0.1 | 12.7 | PID HIF1 TFPATHWAY | HIF-1-alpha transcription factor network |
| 0.1 | 6.8 | PID BMP PATHWAY | BMP receptor signaling |
| 0.1 | 29.1 | NABA ECM REGULATORS | Genes encoding enzymes and their regulators involved in the remodeling of the extracellular matrix |
| 0.1 | 3.6 | PID AMB2 NEUTROPHILS PATHWAY | amb2 Integrin signaling |
| 0.1 | 2.1 | ST INTERLEUKIN 4 PATHWAY | Interleukin 4 (IL-4) Pathway |
| 0.1 | 5.8 | PID IL6 7 PATHWAY | IL6-mediated signaling events |
| 0.1 | 3.2 | PID IL2 STAT5 PATHWAY | IL2 signaling events mediated by STAT5 |
| 0.1 | 4.2 | PID ATF2 PATHWAY | ATF-2 transcription factor network |
| 0.1 | 0.9 | SA PTEN PATHWAY | PTEN is a tumor suppressor that dephosphorylates the lipid messenger phosphatidylinositol triphosphate. |
| 0.1 | 1.4 | PID P38 MK2 PATHWAY | p38 signaling mediated by MAPKAP kinases |
| 0.1 | 1.3 | ST WNT CA2 CYCLIC GMP PATHWAY | Wnt/Ca2+/cyclic GMP signaling. |
| 0.1 | 17.9 | NABA SECRETED FACTORS | Genes encoding secreted soluble factors |
| 0.1 | 3.6 | PID CDC42 REG PATHWAY | Regulation of CDC42 activity |
| 0.0 | 1.7 | PID WNT NONCANONICAL PATHWAY | Noncanonical Wnt signaling pathway |
| 0.0 | 7.6 | NABA ECM GLYCOPROTEINS | Genes encoding structural ECM glycoproteins |
| 0.0 | 0.7 | PID RHOA PATHWAY | RhoA signaling pathway |
| 0.0 | 1.4 | PID TGFBR PATHWAY | TGF-beta receptor signaling |
| 0.0 | 1.2 | PID RHOA REG PATHWAY | Regulation of RhoA activity |
Gene overrepresentation in curated gene sets: REACTOME pathways category:
| Log-likelihood per target | Total log-likelihood | Term | Description |
|---|---|---|---|
| 0.9 | 10.2 | REACTOME RECYCLING OF BILE ACIDS AND SALTS | Genes involved in Recycling of bile acids and salts |
| 0.9 | 43.2 | REACTOME LATENT INFECTION OF HOMO SAPIENS WITH MYCOBACTERIUM TUBERCULOSIS | Genes involved in Latent infection of Homo sapiens with Mycobacterium tuberculosis |
| 0.8 | 16.5 | REACTOME P130CAS LINKAGE TO MAPK SIGNALING FOR INTEGRINS | Genes involved in p130Cas linkage to MAPK signaling for integrins |
| 0.7 | 18.7 | REACTOME IRON UPTAKE AND TRANSPORT | Genes involved in Iron uptake and transport |
| 0.7 | 20.5 | REACTOME DEGRADATION OF THE EXTRACELLULAR MATRIX | Genes involved in Degradation of the extracellular matrix |
| 0.5 | 7.5 | REACTOME PASSIVE TRANSPORT BY AQUAPORINS | Genes involved in Passive Transport by Aquaporins |
| 0.5 | 16.4 | REACTOME SULFUR AMINO ACID METABOLISM | Genes involved in Sulfur amino acid metabolism |
| 0.3 | 4.7 | REACTOME CS DS DEGRADATION | Genes involved in CS/DS degradation |
| 0.3 | 14.5 | REACTOME INTERACTIONS OF VPR WITH HOST CELLULAR PROTEINS | Genes involved in Interactions of Vpr with host cellular proteins |
| 0.3 | 23.2 | REACTOME INTERFERON ALPHA BETA SIGNALING | Genes involved in Interferon alpha/beta signaling |
| 0.3 | 2.4 | REACTOME CREATION OF C4 AND C2 ACTIVATORS | Genes involved in Creation of C4 and C2 activators |
| 0.3 | 4.9 | REACTOME EXTRINSIC PATHWAY FOR APOPTOSIS | Genes involved in Extrinsic Pathway for Apoptosis |
| 0.2 | 11.8 | REACTOME IL1 SIGNALING | Genes involved in Interleukin-1 signaling |
| 0.2 | 2.8 | REACTOME IKK COMPLEX RECRUITMENT MEDIATED BY RIP1 | Genes involved in IKK complex recruitment mediated by RIP1 |
| 0.2 | 4.5 | REACTOME INTRINSIC PATHWAY | Genes involved in Intrinsic Pathway |
| 0.2 | 5.7 | REACTOME OTHER SEMAPHORIN INTERACTIONS | Genes involved in Other semaphorin interactions |
| 0.2 | 3.6 | REACTOME IONOTROPIC ACTIVITY OF KAINATE RECEPTORS | Genes involved in Ionotropic activity of Kainate Receptors |
| 0.2 | 0.7 | REACTOME TRAF6 MEDIATED IRF7 ACTIVATION IN TLR7 8 OR 9 SIGNALING | Genes involved in TRAF6 mediated IRF7 activation in TLR7/8 or 9 signaling |
| 0.2 | 2.5 | REACTOME THE NLRP3 INFLAMMASOME | Genes involved in The NLRP3 inflammasome |
| 0.1 | 1.3 | REACTOME ELEVATION OF CYTOSOLIC CA2 LEVELS | Genes involved in Elevation of cytosolic Ca2+ levels |
| 0.1 | 2.5 | REACTOME PYRIMIDINE CATABOLISM | Genes involved in Pyrimidine catabolism |
| 0.1 | 2.9 | REACTOME CELL EXTRACELLULAR MATRIX INTERACTIONS | Genes involved in Cell-extracellular matrix interactions |
| 0.1 | 1.1 | REACTOME NEGATIVE REGULATION OF THE PI3K AKT NETWORK | Genes involved in Negative regulation of the PI3K/AKT network |
| 0.1 | 2.3 | REACTOME ACTIVATION OF BH3 ONLY PROTEINS | Genes involved in Activation of BH3-only proteins |
| 0.1 | 2.6 | REACTOME SYNTHESIS OF VERY LONG CHAIN FATTY ACYL COAS | Genes involved in Synthesis of very long-chain fatty acyl-CoAs |
| 0.1 | 4.2 | REACTOME TRANSPORT TO THE GOLGI AND SUBSEQUENT MODIFICATION | Genes involved in Transport to the Golgi and subsequent modification |
| 0.1 | 1.7 | REACTOME PLATELET SENSITIZATION BY LDL | Genes involved in Platelet sensitization by LDL |
| 0.1 | 6.1 | REACTOME INTEGRIN CELL SURFACE INTERACTIONS | Genes involved in Integrin cell surface interactions |
| 0.1 | 1.2 | REACTOME HOMOLOGOUS RECOMBINATION REPAIR OF REPLICATION INDEPENDENT DOUBLE STRAND BREAKS | Genes involved in Homologous recombination repair of replication-independent double-strand breaks |
| 0.1 | 0.6 | REACTOME ACTIVATION OF CHAPERONE GENES BY ATF6 ALPHA | Genes involved in Activation of Chaperone Genes by ATF6-alpha |
| 0.1 | 3.2 | REACTOME G1 PHASE | Genes involved in G1 Phase |
| 0.1 | 3.1 | REACTOME TOLL RECEPTOR CASCADES | Genes involved in Toll Receptor Cascades |
| 0.1 | 1.5 | REACTOME AMINO ACID SYNTHESIS AND INTERCONVERSION TRANSAMINATION | Genes involved in Amino acid synthesis and interconversion (transamination) |
| 0.0 | 1.6 | REACTOME EXTENSION OF TELOMERES | Genes involved in Extension of Telomeres |
| 0.0 | 1.8 | REACTOME TIGHT JUNCTION INTERACTIONS | Genes involved in Tight junction interactions |
| 0.0 | 1.6 | REACTOME BASIGIN INTERACTIONS | Genes involved in Basigin interactions |
| 0.0 | 0.7 | REACTOME PYRIMIDINE METABOLISM | Genes involved in Pyrimidine metabolism |
| 0.0 | 3.0 | REACTOME GLUCOSE METABOLISM | Genes involved in Glucose metabolism |
| 0.0 | 1.2 | REACTOME ACTIVATION OF KAINATE RECEPTORS UPON GLUTAMATE BINDING | Genes involved in Activation of Kainate Receptors upon glutamate binding |
| 0.0 | 0.7 | REACTOME SEMA4D INDUCED CELL MIGRATION AND GROWTH CONE COLLAPSE | Genes involved in Sema4D induced cell migration and growth-cone collapse |
| 0.0 | 1.1 | REACTOME COSTIMULATION BY THE CD28 FAMILY | Genes involved in Costimulation by the CD28 family |
| 0.0 | 0.9 | REACTOME SMOOTH MUSCLE CONTRACTION | Genes involved in Smooth Muscle Contraction |
| 0.0 | 0.8 | REACTOME DOWNREGULATION OF SMAD2 3 SMAD4 TRANSCRIPTIONAL ACTIVITY | Genes involved in Downregulation of SMAD2/3:SMAD4 transcriptional activity |
| 0.0 | 1.2 | REACTOME MYOGENESIS | Genes involved in Myogenesis |
| 0.0 | 2.8 | REACTOME PPARA ACTIVATES GENE EXPRESSION | Genes involved in PPARA Activates Gene Expression |
| 0.0 | 3.5 | REACTOME SIGNALING BY RHO GTPASES | Genes involved in Signaling by Rho GTPases |
| 0.0 | 0.3 | REACTOME DEPOSITION OF NEW CENPA CONTAINING NUCLEOSOMES AT THE CENTROMERE | Genes involved in Deposition of New CENPA-containing Nucleosomes at the Centromere |
| 0.0 | 0.1 | REACTOME REGULATION OF IFNG SIGNALING | Genes involved in Regulation of IFNG signaling |
| 0.0 | 0.2 | REACTOME SYNTHESIS OF BILE ACIDS AND BILE SALTS VIA 24 HYDROXYCHOLESTEROL | Genes involved in Synthesis of bile acids and bile salts via 24-hydroxycholesterol |
| 0.0 | 1.3 | REACTOME DOWNSTREAM SIGNAL TRANSDUCTION | Genes involved in Downstream signal transduction |
| 0.0 | 0.8 | REACTOME FORMATION OF THE TERNARY COMPLEX AND SUBSEQUENTLY THE 43S COMPLEX | Genes involved in Formation of the ternary complex, and subsequently, the 43S complex |
| 0.0 | 0.7 | REACTOME PHASE1 FUNCTIONALIZATION OF COMPOUNDS | Genes involved in Phase 1 - Functionalization of compounds |
| 0.0 | 0.2 | REACTOME ACTIVATION OF GENES BY ATF4 | Genes involved in Activation of Genes by ATF4 |