Project
avrg: GSE58827: Dynamics of the Mouse Liver
Navigation
Downloads
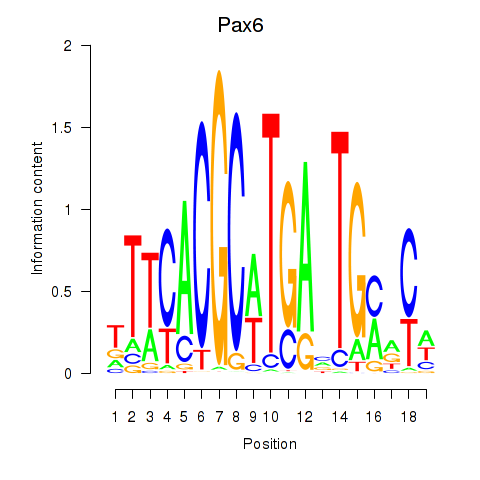
Results for Pax6
Z-value: 0.48
Motif logo
Transcription factors associated with Pax6
| Gene Symbol | Gene ID | Gene Info |
|---|---|---|
|
Pax6
|
ENSMUSG00000027168.15 | paired box 6 |
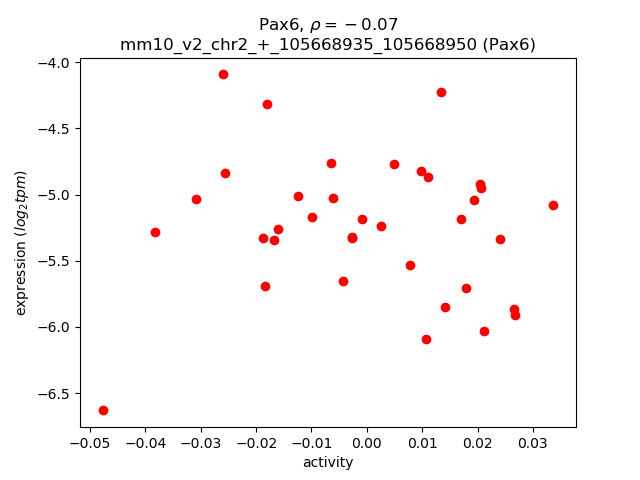
Activity-expression correlation:
| Gene | Promoter | Pearson corr. coef. | P-value | Plot |
|---|---|---|---|---|
| Pax6 | mm10_v2_chr2_+_105668935_105668950 | -0.07 | 7.0e-01 | Click! |
Activity profile of Pax6 motif
Sorted Z-values of Pax6 motif
| Promoter | Log-likelihood | Transcript | Gene | Gene Info |
|---|---|---|---|---|
| chr7_+_26061495 | 4.89 |
ENSMUST00000005669.7
|
Cyp2b13
|
cytochrome P450, family 2, subfamily b, polypeptide 13 |
| chr14_-_43819639 | 1.00 |
ENSMUST00000100691.3
|
Ear1
|
eosinophil-associated, ribonuclease A family, member 1 |
| chr1_+_131638306 | 0.66 |
ENSMUST00000073350.6
|
Ctse
|
cathepsin E |
| chr17_+_25366550 | 0.62 |
ENSMUST00000069616.7
|
Tpsb2
|
tryptase beta 2 |
| chr13_-_23914998 | 0.62 |
ENSMUST00000021769.8
ENSMUST00000110407.2 |
Slc17a4
|
solute carrier family 17 (sodium phosphate), member 4 |
| chr7_-_101869012 | 0.60 |
ENSMUST00000123321.1
|
Folr1
|
folate receptor 1 (adult) |
| chr6_-_60829826 | 0.42 |
ENSMUST00000163779.1
|
Snca
|
synuclein, alpha |
| chr7_-_101868667 | 0.42 |
ENSMUST00000150184.1
|
Folr1
|
folate receptor 1 (adult) |
| chr11_-_67965631 | 0.41 |
ENSMUST00000021287.5
ENSMUST00000126766.1 |
Wdr16
|
WD repeat domain 16 |
| chr17_-_6827990 | 0.41 |
ENSMUST00000181895.1
|
Gm2885
|
predicted gene 2885 |
| chr11_+_104550663 | 0.36 |
ENSMUST00000018800.2
|
Myl4
|
myosin, light polypeptide 4 |
| chr7_+_5051515 | 0.36 |
ENSMUST00000069324.5
|
Zfp580
|
zinc finger protein 580 |
| chr10_+_26229707 | 0.35 |
ENSMUST00000060716.5
ENSMUST00000164660.1 |
Samd3
|
sterile alpha motif domain containing 3 |
| chr7_-_103843154 | 0.35 |
ENSMUST00000063957.4
|
Hbb-bh1
|
hemoglobin Z, beta-like embryonic chain |
| chr17_+_43568096 | 0.33 |
ENSMUST00000167214.1
|
Pla2g7
|
phospholipase A2, group VII (platelet-activating factor acetylhydrolase, plasma) |
| chr4_-_34050077 | 0.33 |
ENSMUST00000029927.5
|
Spaca1
|
sperm acrosome associated 1 |
| chr17_+_43016536 | 0.32 |
ENSMUST00000024708.4
|
Tnfrsf21
|
tumor necrosis factor receptor superfamily, member 21 |
| chr3_-_89245159 | 0.30 |
ENSMUST00000090924.6
|
Trim46
|
tripartite motif-containing 46 |
| chr3_-_98753465 | 0.30 |
ENSMUST00000094050.4
ENSMUST00000090743.6 |
Hsd3b3
|
hydroxy-delta-5-steroid dehydrogenase, 3 beta- and steroid delta-isomerase 3 |
| chr5_+_112255813 | 0.29 |
ENSMUST00000031286.6
ENSMUST00000131673.1 ENSMUST00000112375.1 |
Crybb1
|
crystallin, beta B1 |
| chr15_-_78495059 | 0.28 |
ENSMUST00000089398.1
|
Il2rb
|
interleukin 2 receptor, beta chain |
| chr5_+_90903864 | 0.28 |
ENSMUST00000075433.6
|
Cxcl2
|
chemokine (C-X-C motif) ligand 2 |
| chr2_+_163602331 | 0.28 |
ENSMUST00000152135.1
|
Ttpal
|
tocopherol (alpha) transfer protein-like |
| chr15_+_6299781 | 0.28 |
ENSMUST00000078019.6
|
Dab2
|
disabled 2, mitogen-responsive phosphoprotein |
| chr8_-_24948771 | 0.26 |
ENSMUST00000119720.1
ENSMUST00000121438.2 |
Adam32
|
a disintegrin and metallopeptidase domain 32 |
| chr5_-_142906702 | 0.26 |
ENSMUST00000167721.1
ENSMUST00000163829.1 ENSMUST00000100497.4 |
Actb
|
actin, beta |
| chr8_+_105860634 | 0.26 |
ENSMUST00000008594.7
|
Nutf2
|
nuclear transport factor 2 |
| chr7_+_30422389 | 0.25 |
ENSMUST00000108175.1
|
Nfkbid
|
nuclear factor of kappa light polypeptide gene enhancer in B cells inhibitor, delta |
| chr15_+_6299797 | 0.24 |
ENSMUST00000159046.1
ENSMUST00000161040.1 |
Dab2
|
disabled 2, mitogen-responsive phosphoprotein |
| chr11_+_73090554 | 0.23 |
ENSMUST00000102537.3
ENSMUST00000006101.3 |
Itgae
|
integrin alpha E, epithelial-associated |
| chr11_+_34047115 | 0.23 |
ENSMUST00000109329.1
ENSMUST00000169878.2 |
Lcp2
|
lymphocyte cytosolic protein 2 |
| chr9_+_15239045 | 0.23 |
ENSMUST00000034413.6
|
Vstm5
|
V-set and transmembrane domain containing 5 |
| chr11_-_95587691 | 0.22 |
ENSMUST00000000122.6
|
Ngfr
|
nerve growth factor receptor (TNFR superfamily, member 16) |
| chr6_-_118780324 | 0.22 |
ENSMUST00000112793.3
ENSMUST00000075591.6 ENSMUST00000078320.7 ENSMUST00000112790.2 |
Cacna1c
|
calcium channel, voltage-dependent, L type, alpha 1C subunit |
| chr3_-_89245005 | 0.22 |
ENSMUST00000107464.1
|
Trim46
|
tripartite motif-containing 46 |
| chr4_-_70410422 | 0.21 |
ENSMUST00000144099.1
|
Cdk5rap2
|
CDK5 regulatory subunit associated protein 2 |
| chr6_-_145048809 | 0.21 |
ENSMUST00000032402.5
|
Bcat1
|
branched chain aminotransferase 1, cytosolic |
| chrX_+_74740927 | 0.21 |
ENSMUST00000114117.1
|
Gm6890
|
predicted gene 6890 |
| chr7_+_64153835 | 0.21 |
ENSMUST00000085222.5
ENSMUST00000107525.1 |
Trpm1
|
transient receptor potential cation channel, subfamily M, member 1 |
| chr3_+_31902507 | 0.20 |
ENSMUST00000119310.1
|
Kcnmb2
|
potassium large conductance calcium-activated channel, subfamily M, beta member 2 |
| chr6_+_123229843 | 0.20 |
ENSMUST00000112554.2
ENSMUST00000024118.4 ENSMUST00000117130.1 |
Clec4n
|
C-type lectin domain family 4, member n |
| chr13_-_113618549 | 0.19 |
ENSMUST00000109241.3
|
Snx18
|
sorting nexin 18 |
| chr19_+_34290653 | 0.18 |
ENSMUST00000025691.5
ENSMUST00000112472.2 |
Fas
|
Fas (TNF receptor superfamily member 6) |
| chr7_-_44548733 | 0.18 |
ENSMUST00000145956.1
ENSMUST00000049343.8 |
Pold1
|
polymerase (DNA directed), delta 1, catalytic subunit |
| chr9_+_92250039 | 0.17 |
ENSMUST00000093801.3
|
Plscr1
|
phospholipid scramblase 1 |
| chr15_+_84669565 | 0.15 |
ENSMUST00000171460.1
|
Prr5
|
proline rich 5 (renal) |
| chr8_-_57962564 | 0.15 |
ENSMUST00000098757.3
|
Galntl6
|
UDP-N-acetyl-alpha-D-galactosamine:polypeptide N-acetylgalactosaminyltransferase-like 6 |
| chr7_+_12897800 | 0.14 |
ENSMUST00000055528.4
ENSMUST00000117189.1 ENSMUST00000120809.1 ENSMUST00000119989.1 |
Zscan22
|
zinc finger and SCAN domain containing 22 |
| chr10_-_127030813 | 0.14 |
ENSMUST00000040560.4
|
Tsfm
|
Ts translation elongation factor, mitochondrial |
| chr6_-_122856151 | 0.14 |
ENSMUST00000042081.8
|
C3ar1
|
complement component 3a receptor 1 |
| chr14_+_34170640 | 0.14 |
ENSMUST00000104925.3
|
Rpl23a-ps3
|
ribosomal protein L23A, pseudogene 3 |
| chr2_-_162661075 | 0.14 |
ENSMUST00000109442.1
ENSMUST00000109445.2 ENSMUST00000109443.1 ENSMUST00000109441.1 |
Ptprt
|
protein tyrosine phosphatase, receptor type, T |
| chr13_-_97760588 | 0.12 |
ENSMUST00000074072.3
|
Gm10260
|
predicted gene 10260 |
| chr7_+_51511005 | 0.11 |
ENSMUST00000043944.5
|
Ano5
|
anoctamin 5 |
| chr5_+_123907175 | 0.11 |
ENSMUST00000023869.8
|
Denr
|
density-regulated protein |
| chr2_-_75981967 | 0.10 |
ENSMUST00000099994.3
|
Ttc30a1
|
tetratricopeptide repeat domain 30A1 |
| chr7_+_64153916 | 0.10 |
ENSMUST00000107527.2
|
Trpm1
|
transient receptor potential cation channel, subfamily M, member 1 |
| chr10_-_127189981 | 0.10 |
ENSMUST00000019611.7
|
Arhgef25
|
Rho guanine nucleotide exchange factor (GEF) 25 |
| chr9_+_21337828 | 0.10 |
ENSMUST00000034697.7
|
Slc44a2
|
solute carrier family 44, member 2 |
| chr8_+_95825353 | 0.10 |
ENSMUST00000074053.4
|
Gm10094
|
predicted gene 10094 |
| chrX_-_112406779 | 0.10 |
ENSMUST00000026601.2
|
Satl1
|
spermidine/spermine N1-acetyl transferase-like 1 |
| chr5_+_149265035 | 0.09 |
ENSMUST00000130144.1
ENSMUST00000071130.3 |
Alox5ap
|
arachidonate 5-lipoxygenase activating protein |
| chr4_+_155491353 | 0.09 |
ENSMUST00000165335.1
ENSMUST00000105616.3 ENSMUST00000030940.7 |
Gnb1
|
guanine nucleotide binding protein (G protein), beta 1 |
| chr7_-_80901220 | 0.09 |
ENSMUST00000146402.1
ENSMUST00000026816.8 |
Wdr73
|
WD repeat domain 73 |
| chr12_-_45074457 | 0.08 |
ENSMUST00000053768.6
|
Stxbp6
|
syntaxin binding protein 6 (amisyn) |
| chr17_-_51832666 | 0.08 |
ENSMUST00000144331.1
|
Satb1
|
special AT-rich sequence binding protein 1 |
| chr13_+_64432479 | 0.08 |
ENSMUST00000021939.6
|
Cdk20
|
cyclin-dependent kinase 20 |
| chr5_-_38480131 | 0.07 |
ENSMUST00000143758.1
ENSMUST00000067886.5 |
Slc2a9
|
solute carrier family 2 (facilitated glucose transporter), member 9 |
| chr19_+_34583528 | 0.07 |
ENSMUST00000102825.3
|
Ifit3
|
interferon-induced protein with tetratricopeptide repeats 3 |
| chrX_+_103422010 | 0.07 |
ENSMUST00000182089.1
|
Gm26992
|
predicted gene, 26992 |
| chr11_+_102268732 | 0.07 |
ENSMUST00000036467.4
|
Asb16
|
ankyrin repeat and SOCS box-containing 16 |
| chr10_-_127030789 | 0.07 |
ENSMUST00000120547.1
ENSMUST00000152054.1 |
Tsfm
|
Ts translation elongation factor, mitochondrial |
| chr11_+_67966442 | 0.07 |
ENSMUST00000021286.4
ENSMUST00000108675.1 |
Stx8
|
syntaxin 8 |
| chr6_-_88045190 | 0.07 |
ENSMUST00000113596.1
ENSMUST00000113600.3 |
Rab7
|
RAB7, member RAS oncogene family |
| chr13_-_53377355 | 0.07 |
ENSMUST00000021920.6
|
Sptlc1
|
serine palmitoyltransferase, long chain base subunit 1 |
| chr15_-_101850778 | 0.06 |
ENSMUST00000023790.3
|
Krt1
|
keratin 1 |
| chr18_+_37447641 | 0.06 |
ENSMUST00000052387.3
|
Pcdhb14
|
protocadherin beta 14 |
| chr12_+_112976471 | 0.06 |
ENSMUST00000165079.1
ENSMUST00000002880.6 |
Btbd6
|
BTB (POZ) domain containing 6 |
| chr11_+_78328415 | 0.05 |
ENSMUST00000048073.8
|
Pigs
|
phosphatidylinositol glycan anchor biosynthesis, class S |
| chr11_+_69125896 | 0.05 |
ENSMUST00000021268.2
|
Aloxe3
|
arachidonate lipoxygenase 3 |
| chr11_+_60699718 | 0.05 |
ENSMUST00000052346.3
|
Llgl1
|
lethal giant larvae homolog 1 (Drosophila) |
| chr9_-_62811592 | 0.05 |
ENSMUST00000034775.8
|
Fem1b
|
feminization 1 homolog b (C. elegans) |
| chr19_+_6400611 | 0.04 |
ENSMUST00000113467.1
|
Rasgrp2
|
RAS, guanyl releasing protein 2 |
| chr6_-_124741374 | 0.04 |
ENSMUST00000004389.5
|
Grcc10
|
gene rich cluster, C10 gene |
| chr7_-_107625161 | 0.04 |
ENSMUST00000060348.2
|
5330417H12Rik
|
RIKEN cDNA 5330417H12 gene |
| chr18_-_34373313 | 0.04 |
ENSMUST00000006027.5
|
Reep5
|
receptor accessory protein 5 |
| chr8_+_31150307 | 0.04 |
ENSMUST00000098842.2
|
Tti2
|
TELO2 interacting protein 2 |
| chr5_-_134639311 | 0.04 |
ENSMUST00000036125.8
|
Eif4h
|
eukaryotic translation initiation factor 4H |
| chr11_+_60699758 | 0.04 |
ENSMUST00000108719.3
|
Llgl1
|
lethal giant larvae homolog 1 (Drosophila) |
| chr4_+_85205417 | 0.04 |
ENSMUST00000030212.8
ENSMUST00000107189.1 ENSMUST00000107184.1 |
Sh3gl2
|
SH3-domain GRB2-like 2 |
| chr4_+_129820702 | 0.03 |
ENSMUST00000165853.1
|
Ptp4a2
|
protein tyrosine phosphatase 4a2 |
| chr8_+_54600774 | 0.03 |
ENSMUST00000033917.6
|
Spata4
|
spermatogenesis associated 4 |
| chr17_+_34604262 | 0.03 |
ENSMUST00000174041.1
|
Agpat1
|
1-acylglycerol-3-phosphate O-acyltransferase 1 (lysophosphatidic acid acyltransferase, alpha) |
| chr1_-_195131536 | 0.03 |
ENSMUST00000075451.6
|
Cr1l
|
complement component (3b/4b) receptor 1-like |
| chr7_+_141228766 | 0.03 |
ENSMUST00000106027.2
|
Phrf1
|
PHD and ring finger domains 1 |
| chr13_-_66905322 | 0.03 |
ENSMUST00000021993.4
|
Uqcrb
|
ubiquinol-cytochrome c reductase binding protein |
| chr8_-_80880479 | 0.02 |
ENSMUST00000034150.8
|
Gab1
|
growth factor receptor bound protein 2-associated protein 1 |
| chr5_-_18360384 | 0.02 |
ENSMUST00000074694.5
|
Gnai1
|
guanine nucleotide binding protein (G protein), alpha inhibiting 1 |
| chr18_-_32139570 | 0.02 |
ENSMUST00000171765.1
|
Proc
|
protein C |
| chr16_+_34784917 | 0.02 |
ENSMUST00000023538.8
|
Mylk
|
myosin, light polypeptide kinase |
| chr6_-_113377376 | 0.02 |
ENSMUST00000043333.2
|
Tada3
|
transcriptional adaptor 3 |
| chr5_-_86745787 | 0.02 |
ENSMUST00000161306.1
|
Tmprss11e
|
transmembrane protease, serine 11e |
| chr1_+_106938953 | 0.02 |
ENSMUST00000112724.2
|
Serpinb12
|
serine (or cysteine) peptidase inhibitor, clade B (ovalbumin), member 12 |
| chr9_-_63602464 | 0.02 |
ENSMUST00000080527.5
ENSMUST00000042322.4 |
Iqch
|
IQ motif containing H |
| chrX_+_36795642 | 0.01 |
ENSMUST00000016463.3
|
Slc25a5
|
solute carrier family 25 (mitochondrial carrier, adenine nucleotide translocator), member 5 |
| chr7_+_97453204 | 0.01 |
ENSMUST00000050732.7
ENSMUST00000121987.1 |
Kctd14
|
potassium channel tetramerisation domain containing 14 |
| chr1_-_38836090 | 0.01 |
ENSMUST00000147695.1
|
Lonrf2
|
LON peptidase N-terminal domain and ring finger 2 |
| chr9_+_64179289 | 0.01 |
ENSMUST00000034965.6
|
Snapc5
|
small nuclear RNA activating complex, polypeptide 5 |
| chr8_-_72475212 | 0.01 |
ENSMUST00000079510.4
|
Cherp
|
calcium homeostasis endoplasmic reticulum protein |
| chr1_+_43092588 | 0.01 |
ENSMUST00000039080.3
|
8430432A02Rik
|
RIKEN cDNA 8430432A02 gene |
| chr11_-_115612491 | 0.00 |
ENSMUST00000106507.2
|
Mif4gd
|
MIF4G domain containing |
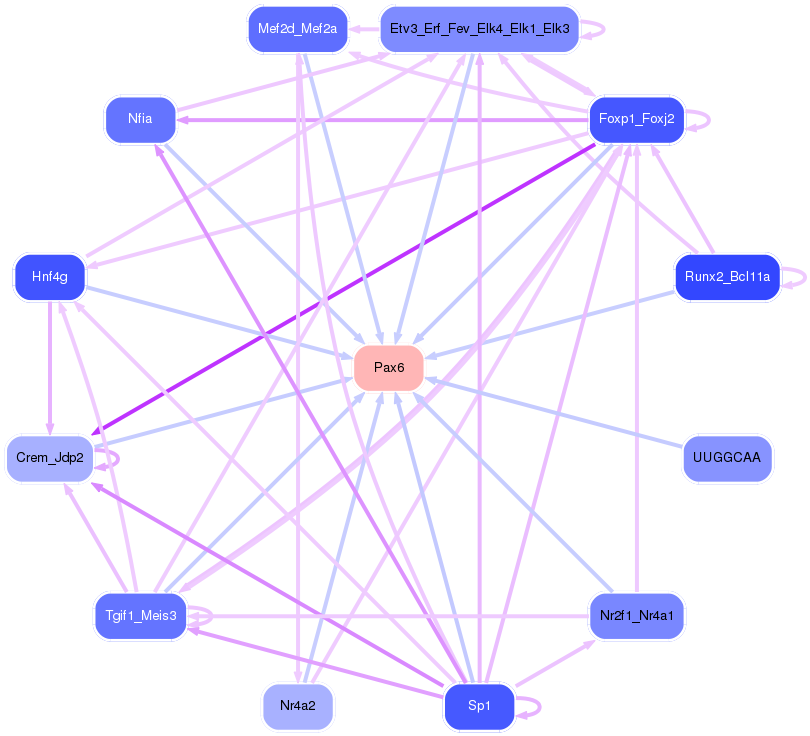
Network of associatons between targets according to the STRING database.

First level regulatory network of Pax6
Gene Ontology Analysis
Gene overrepresentation in biological process category:
| Log-likelihood per target | Total log-likelihood | Term | Description |
|---|---|---|---|
| 0.1 | 4.8 | GO:0019373 | epoxygenase P450 pathway(GO:0019373) |
| 0.1 | 0.4 | GO:2000295 | regulation of hydrogen peroxide catabolic process(GO:2000295) |
| 0.1 | 1.0 | GO:0003147 | neural crest cell migration involved in heart formation(GO:0003147) anterior neural tube closure(GO:0061713) cellular response to folic acid(GO:0071231) |
| 0.1 | 0.5 | GO:0035026 | positive regulation of aldosterone metabolic process(GO:0032346) positive regulation of aldosterone biosynthetic process(GO:0032349) leading edge cell differentiation(GO:0035026) |
| 0.1 | 0.3 | GO:0098974 | postsynaptic actin cytoskeleton organization(GO:0098974) |
| 0.1 | 0.3 | GO:1904046 | protein localization to nuclear pore(GO:0090204) negative regulation of vascular endothelial growth factor production(GO:1904046) |
| 0.1 | 0.3 | GO:0032696 | negative regulation of interleukin-13 production(GO:0032696) |
| 0.1 | 0.2 | GO:1903588 | negative regulation of blood vessel endothelial cell proliferation involved in sprouting angiogenesis(GO:1903588) |
| 0.1 | 0.2 | GO:0045004 | DNA replication proofreading(GO:0045004) |
| 0.1 | 0.2 | GO:2000373 | phosphatidylserine exposure on apoptotic cell surface(GO:0070782) regulation of DNA topoisomerase (ATP-hydrolyzing) activity(GO:2000371) positive regulation of DNA topoisomerase (ATP-hydrolyzing) activity(GO:2000373) |
| 0.1 | 0.3 | GO:0034441 | plasma lipoprotein particle oxidation(GO:0034441) |
| 0.1 | 0.2 | GO:0070125 | mitochondrial translational elongation(GO:0070125) |
| 0.0 | 0.2 | GO:0098912 | membrane depolarization during atrial cardiac muscle cell action potential(GO:0098912) |
| 0.0 | 0.3 | GO:0015671 | oxygen transport(GO:0015671) |
| 0.0 | 0.7 | GO:0019886 | antigen processing and presentation of exogenous peptide antigen via MHC class II(GO:0019886) |
| 0.0 | 0.2 | GO:0046600 | negative regulation of centriole replication(GO:0046600) |
| 0.0 | 0.2 | GO:0009082 | branched-chain amino acid biosynthetic process(GO:0009082) leucine biosynthetic process(GO:0009098) valine biosynthetic process(GO:0009099) |
| 0.0 | 0.2 | GO:0097527 | necroptotic signaling pathway(GO:0097527) |
| 0.0 | 0.2 | GO:0036089 | cleavage furrow formation(GO:0036089) |
| 0.0 | 0.1 | GO:0002188 | translation reinitiation(GO:0002188) |
| 0.0 | 0.5 | GO:0099612 | protein localization to axon(GO:0099612) |
| 0.0 | 0.1 | GO:0002540 | leukotriene production involved in inflammatory response(GO:0002540) |
| 0.0 | 0.3 | GO:0016998 | cell wall macromolecule catabolic process(GO:0016998) |
| 0.0 | 0.1 | GO:0002461 | complement receptor mediated signaling pathway(GO:0002430) tolerance induction dependent upon immune response(GO:0002461) |
| 0.0 | 0.3 | GO:0070245 | positive regulation of thymocyte apoptotic process(GO:0070245) |
| 0.0 | 0.1 | GO:0006667 | sphinganine metabolic process(GO:0006667) |
| 0.0 | 0.1 | GO:0035720 | intraciliary anterograde transport(GO:0035720) |
| 0.0 | 0.1 | GO:0032918 | polyamine acetylation(GO:0032917) spermidine acetylation(GO:0032918) |
| 0.0 | 0.2 | GO:0005513 | detection of calcium ion(GO:0005513) |
| 0.0 | 0.3 | GO:0046548 | retinal rod cell development(GO:0046548) |
| 0.0 | 0.2 | GO:0038203 | TORC2 signaling(GO:0038203) |
| 0.0 | 0.1 | GO:0061724 | lipophagy(GO:0061724) negative regulation of exosomal secretion(GO:1903542) |
| 0.0 | 0.0 | GO:0060743 | epithelial cell maturation involved in prostate gland development(GO:0060743) |
| 0.0 | 0.3 | GO:0090023 | positive regulation of neutrophil chemotaxis(GO:0090023) |
| 0.0 | 0.0 | GO:0036343 | psychomotor behavior(GO:0036343) |
| 0.0 | 0.1 | GO:0051122 | hepoxilin metabolic process(GO:0051121) hepoxilin biosynthetic process(GO:0051122) |
Gene overrepresentation in cellular component category:
| Log-likelihood per target | Total log-likelihood | Term | Description |
|---|---|---|---|
| 0.1 | 0.5 | GO:0070022 | transforming growth factor beta receptor homodimeric complex(GO:0070022) |
| 0.1 | 0.4 | GO:0031092 | platelet alpha granule membrane(GO:0031092) |
| 0.1 | 0.5 | GO:1990769 | proximal neuron projection(GO:1990769) |
| 0.1 | 0.3 | GO:0035841 | new growing cell tip(GO:0035841) |
| 0.1 | 0.2 | GO:0043625 | delta DNA polymerase complex(GO:0043625) |
| 0.0 | 1.0 | GO:0031362 | anchored component of external side of plasma membrane(GO:0031362) |
| 0.0 | 0.3 | GO:0005833 | hemoglobin complex(GO:0005833) |
| 0.0 | 0.2 | GO:0031265 | CD95 death-inducing signaling complex(GO:0031265) |
| 0.0 | 0.3 | GO:0044613 | nuclear pore central transport channel(GO:0044613) |
| 0.0 | 0.2 | GO:1990454 | L-type voltage-gated calcium channel complex(GO:1990454) |
| 0.0 | 0.1 | GO:0035339 | SPOTS complex(GO:0035339) |
| 0.0 | 0.3 | GO:0034362 | low-density lipoprotein particle(GO:0034362) |
| 0.0 | 0.2 | GO:0097431 | mitotic spindle pole(GO:0097431) |
Gene overrepresentation in molecular function category:
| Log-likelihood per target | Total log-likelihood | Term | Description |
|---|---|---|---|
| 0.1 | 4.8 | GO:0008392 | arachidonic acid epoxygenase activity(GO:0008392) |
| 0.1 | 0.3 | GO:0004911 | interleukin-2 receptor activity(GO:0004911) |
| 0.1 | 1.0 | GO:0051870 | methotrexate binding(GO:0051870) |
| 0.1 | 0.3 | GO:0031721 | hemoglobin alpha binding(GO:0031721) |
| 0.1 | 0.3 | GO:0098918 | structural constituent of synapse(GO:0098918) structural constituent of postsynaptic actin cytoskeleton(GO:0098973) |
| 0.1 | 0.2 | GO:0043120 | tumor necrosis factor binding(GO:0043120) |
| 0.0 | 0.6 | GO:0005436 | sodium:phosphate symporter activity(GO:0005436) |
| 0.0 | 0.2 | GO:0086056 | voltage-gated calcium channel activity involved in AV node cell action potential(GO:0086056) |
| 0.0 | 0.4 | GO:1903136 | cuprous ion binding(GO:1903136) |
| 0.0 | 0.5 | GO:0035615 | clathrin adaptor activity(GO:0035615) endocytic adaptor activity(GO:0098748) |
| 0.0 | 0.3 | GO:0004769 | steroid delta-isomerase activity(GO:0004769) |
| 0.0 | 0.2 | GO:0004084 | branched-chain-amino-acid transaminase activity(GO:0004084) L-leucine transaminase activity(GO:0052654) L-valine transaminase activity(GO:0052655) L-isoleucine transaminase activity(GO:0052656) |
| 0.0 | 0.3 | GO:0003847 | 1-alkyl-2-acetylglycerophosphocholine esterase activity(GO:0003847) calcium-independent phospholipase A2 activity(GO:0047499) |
| 0.0 | 0.1 | GO:0004051 | arachidonate 5-lipoxygenase activity(GO:0004051) |
| 0.0 | 0.1 | GO:0019912 | cyclin-dependent protein kinase activating kinase activity(GO:0019912) |
| 0.0 | 0.1 | GO:0019809 | spermidine binding(GO:0019809) |
| 0.0 | 0.3 | GO:0003796 | lysozyme activity(GO:0003796) |
| 0.0 | 0.7 | GO:0004190 | aspartic-type endopeptidase activity(GO:0004190) |
| 0.0 | 0.3 | GO:0045236 | CXCR chemokine receptor binding(GO:0045236) |
| 0.0 | 0.2 | GO:0005168 | neurotrophin TRKA receptor binding(GO:0005168) |
| 0.0 | 0.1 | GO:0004875 | complement receptor activity(GO:0004875) |
| 0.0 | 0.2 | GO:0042609 | CD4 receptor binding(GO:0042609) |
| 0.0 | 0.1 | GO:0004758 | serine C-palmitoyltransferase activity(GO:0004758) C-palmitoyltransferase activity(GO:0016454) |
| 0.0 | 0.3 | GO:0005212 | structural constituent of eye lens(GO:0005212) |
| 0.0 | 0.1 | GO:0030280 | structural constituent of epidermis(GO:0030280) |
| 0.0 | 0.2 | GO:0008296 | 3'-5'-exodeoxyribonuclease activity(GO:0008296) |
| 0.0 | 0.1 | GO:0070097 | delta-catenin binding(GO:0070097) |
| 0.0 | 0.3 | GO:0005035 | tumor necrosis factor-activated receptor activity(GO:0005031) death receptor activity(GO:0005035) |
Gene overrepresentation in curated gene sets: canonical pathways category:
| Log-likelihood per target | Total log-likelihood | Term | Description |
|---|---|---|---|
| 0.0 | 0.2 | SA FAS SIGNALING | The TNF-type receptor Fas induces apoptosis on ligand binding. |
| 0.0 | 0.2 | PID TCR JNK PATHWAY | JNK signaling in the CD4+ TCR pathway |
Gene overrepresentation in curated gene sets: REACTOME pathways category:
| Log-likelihood per target | Total log-likelihood | Term | Description |
|---|---|---|---|
| 0.0 | 0.5 | REACTOME GAP JUNCTION DEGRADATION | Genes involved in Gap junction degradation |
| 0.0 | 0.1 | REACTOME OLFACTORY SIGNALING PATHWAY | Genes involved in Olfactory Signaling Pathway |
| 0.0 | 0.3 | REACTOME SYNTHESIS SECRETION AND DEACYLATION OF GHRELIN | Genes involved in Synthesis, Secretion, and Deacylation of Ghrelin |
| 0.0 | 0.2 | REACTOME REMOVAL OF THE FLAP INTERMEDIATE FROM THE C STRAND | Genes involved in Removal of the Flap Intermediate from the C-strand |
| 0.0 | 0.2 | REACTOME REGULATED PROTEOLYSIS OF P75NTR | Genes involved in Regulated proteolysis of p75NTR |
| 0.0 | 0.2 | REACTOME EXTRINSIC PATHWAY FOR APOPTOSIS | Genes involved in Extrinsic Pathway for Apoptosis |