Project
avrg: GSE58827: Dynamics of the Mouse Liver
Navigation
Downloads
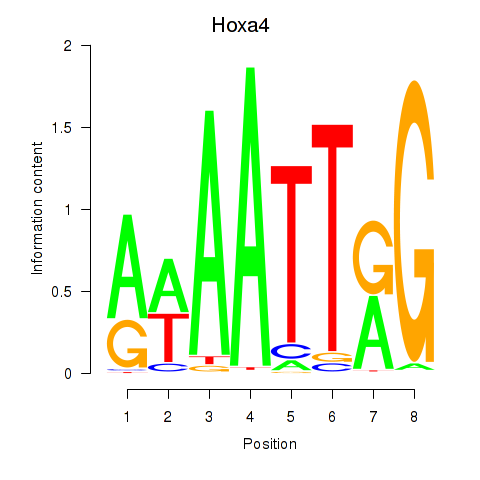
Results for Hoxa4
Z-value: 1.92
Motif logo
Transcription factors associated with Hoxa4
| Gene Symbol | Gene ID | Gene Info |
|---|---|---|
|
Hoxa4
|
ENSMUSG00000000942.10 | homeobox A4 |
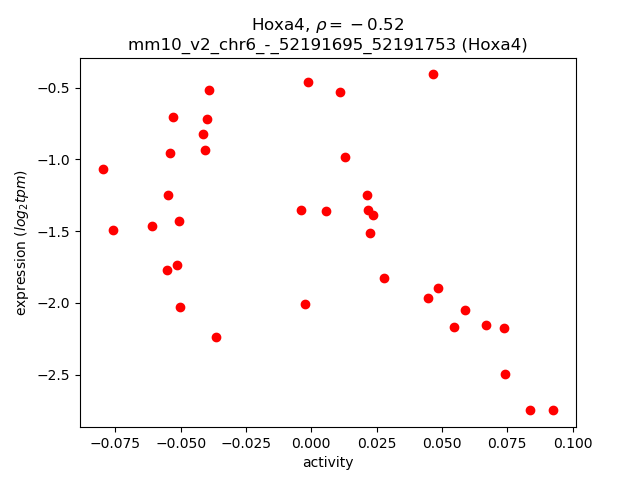
Activity-expression correlation:
| Gene | Promoter | Pearson corr. coef. | P-value | Plot |
|---|---|---|---|---|
| Hoxa4 | mm10_v2_chr6_-_52191695_52191753 | -0.52 | 1.3e-03 | Click! |
Activity profile of Hoxa4 motif
Sorted Z-values of Hoxa4 motif
| Promoter | Log-likelihood | Transcript | Gene | Gene Info |
|---|---|---|---|---|
| chr4_-_61674094 | 10.89 |
ENSMUST00000098040.3
|
Mup18
|
major urinary protein 18 |
| chr4_-_60222580 | 10.05 |
ENSMUST00000095058.4
ENSMUST00000163931.1 |
Mup8
|
major urinary protein 8 |
| chr4_-_61835185 | 9.75 |
ENSMUST00000082287.2
|
Mup5
|
major urinary protein 5 |
| chr7_-_19699008 | 7.74 |
ENSMUST00000174355.1
ENSMUST00000172983.1 ENSMUST00000174710.1 ENSMUST00000167646.2 ENSMUST00000003066.9 ENSMUST00000174064.1 |
Apoe
|
apolipoprotein E |
| chr9_-_50555170 | 6.51 |
ENSMUST00000119103.1
|
Bco2
|
beta-carotene oxygenase 2 |
| chr10_+_84756055 | 5.48 |
ENSMUST00000060397.6
|
Rfx4
|
regulatory factor X, 4 (influences HLA class II expression) |
| chr15_+_10249560 | 5.34 |
ENSMUST00000134410.1
|
Prlr
|
prolactin receptor |
| chr2_+_70474923 | 5.16 |
ENSMUST00000100043.2
|
Sp5
|
trans-acting transcription factor 5 |
| chr10_+_87859481 | 4.94 |
ENSMUST00000121952.1
|
Igf1
|
insulin-like growth factor 1 |
| chr1_-_180193475 | 4.94 |
ENSMUST00000160482.1
ENSMUST00000170472.1 |
Adck3
|
aarF domain containing kinase 3 |
| chr4_+_144893077 | 4.75 |
ENSMUST00000154208.1
|
Dhrs3
|
dehydrogenase/reductase (SDR family) member 3 |
| chr1_-_180193653 | 4.69 |
ENSMUST00000159914.1
|
Adck3
|
aarF domain containing kinase 3 |
| chr7_+_51878967 | 4.54 |
ENSMUST00000051912.6
|
Gas2
|
growth arrest specific 2 |
| chr5_-_87092546 | 4.41 |
ENSMUST00000132667.1
ENSMUST00000145617.1 ENSMUST00000094649.4 |
Ugt2b36
|
UDP glucuronosyltransferase 2 family, polypeptide B36 |
| chr10_+_87859255 | 4.35 |
ENSMUST00000105300.2
|
Igf1
|
insulin-like growth factor 1 |
| chr4_+_144892813 | 4.33 |
ENSMUST00000105744.1
ENSMUST00000171001.1 |
Dhrs3
|
dehydrogenase/reductase (SDR family) member 3 |
| chr4_+_144893127 | 4.29 |
ENSMUST00000142808.1
|
Dhrs3
|
dehydrogenase/reductase (SDR family) member 3 |
| chr7_+_51879041 | 4.17 |
ENSMUST00000107591.2
|
Gas2
|
growth arrest specific 2 |
| chr5_+_42067960 | 4.17 |
ENSMUST00000087332.4
|
Gm16223
|
predicted gene 16223 |
| chr11_-_43836243 | 4.15 |
ENSMUST00000167574.1
|
Adra1b
|
adrenergic receptor, alpha 1b |
| chr10_+_87859062 | 4.14 |
ENSMUST00000095360.4
|
Igf1
|
insulin-like growth factor 1 |
| chr3_+_115080965 | 3.90 |
ENSMUST00000051309.8
|
Olfm3
|
olfactomedin 3 |
| chr12_-_57546121 | 3.38 |
ENSMUST00000044380.6
|
Foxa1
|
forkhead box A1 |
| chr18_+_37435602 | 3.23 |
ENSMUST00000055495.5
|
Pcdhb12
|
protocadherin beta 12 |
| chr4_-_134372529 | 3.19 |
ENSMUST00000030643.2
|
Extl1
|
exostoses (multiple)-like 1 |
| chr16_+_37580137 | 3.10 |
ENSMUST00000160847.1
|
Hgd
|
homogentisate 1, 2-dioxygenase |
| chr6_+_124916863 | 2.92 |
ENSMUST00000069553.2
|
A230083G16Rik
|
RIKEN cDNA A230083G16 gene |
| chr13_+_58807884 | 2.81 |
ENSMUST00000079828.5
|
Ntrk2
|
neurotrophic tyrosine kinase, receptor, type 2 |
| chr2_+_20737306 | 2.80 |
ENSMUST00000114606.1
ENSMUST00000114608.1 |
Etl4
|
enhancer trap locus 4 |
| chr16_+_22857845 | 2.64 |
ENSMUST00000004574.7
ENSMUST00000178320.1 ENSMUST00000166487.2 |
Dnajb11
|
DnaJ (Hsp40) homolog, subfamily B, member 11 |
| chr6_+_124304646 | 2.59 |
ENSMUST00000112541.2
ENSMUST00000032234.2 |
Cd163
|
CD163 antigen |
| chr2_-_5676046 | 2.56 |
ENSMUST00000114987.3
|
Camk1d
|
calcium/calmodulin-dependent protein kinase ID |
| chr1_+_74284930 | 2.55 |
ENSMUST00000113805.1
ENSMUST00000027370.6 ENSMUST00000087226.4 |
Pnkd
|
paroxysmal nonkinesiogenic dyskinesia |
| chrM_+_5319 | 2.46 |
ENSMUST00000082402.1
|
mt-Co1
|
mitochondrially encoded cytochrome c oxidase I |
| chr2_+_109917639 | 2.45 |
ENSMUST00000046548.7
ENSMUST00000111037.2 |
Lgr4
|
leucine-rich repeat-containing G protein-coupled receptor 4 |
| chr11_-_116189542 | 2.41 |
ENSMUST00000148601.1
|
Acox1
|
acyl-Coenzyme A oxidase 1, palmitoyl |
| chr9_-_65885024 | 2.38 |
ENSMUST00000122410.1
ENSMUST00000117083.1 |
Trip4
|
thyroid hormone receptor interactor 4 |
| chr11_+_94327984 | 2.33 |
ENSMUST00000107818.2
ENSMUST00000051221.6 |
Ankrd40
|
ankyrin repeat domain 40 |
| chr12_+_59129757 | 2.30 |
ENSMUST00000069430.8
ENSMUST00000177370.1 |
Ctage5
|
CTAGE family, member 5 |
| chr2_-_77519565 | 2.21 |
ENSMUST00000111830.2
|
Zfp385b
|
zinc finger protein 385B |
| chr10_+_53337686 | 2.19 |
ENSMUST00000046221.6
ENSMUST00000163319.1 |
Pln
|
phospholamban |
| chr6_+_43265582 | 2.17 |
ENSMUST00000031750.7
|
Arhgef5
|
Rho guanine nucleotide exchange factor (GEF) 5 |
| chr10_-_24101951 | 2.17 |
ENSMUST00000170267.1
|
Taar8c
|
trace amine-associated receptor 8C |
| chr17_-_34862122 | 2.14 |
ENSMUST00000154526.1
|
Cfb
|
complement factor B |
| chr13_+_89540636 | 2.14 |
ENSMUST00000022108.7
|
Hapln1
|
hyaluronan and proteoglycan link protein 1 |
| chr6_+_63255971 | 2.13 |
ENSMUST00000159561.1
ENSMUST00000095852.3 |
Grid2
|
glutamate receptor, ionotropic, delta 2 |
| chr11_+_94328242 | 2.11 |
ENSMUST00000021227.5
|
Ankrd40
|
ankyrin repeat domain 40 |
| chr7_-_34654342 | 2.08 |
ENSMUST00000108069.1
|
Kctd15
|
potassium channel tetramerisation domain containing 15 |
| chr17_+_45734506 | 2.06 |
ENSMUST00000180558.1
|
F630040K05Rik
|
RIKEN cDNA F630040K05 gene |
| chr12_+_59129720 | 2.00 |
ENSMUST00000175912.1
ENSMUST00000176892.1 |
Ctage5
|
CTAGE family, member 5 |
| chr18_+_58659443 | 1.99 |
ENSMUST00000025503.8
|
Isoc1
|
isochorismatase domain containing 1 |
| chr19_+_31868754 | 1.90 |
ENSMUST00000075838.5
|
A1cf
|
APOBEC1 complementation factor |
| chr6_+_21986887 | 1.88 |
ENSMUST00000151315.1
|
Cped1
|
cadherin-like and PC-esterase domain containing 1 |
| chr11_-_49114874 | 1.86 |
ENSMUST00000109201.1
|
Olfr1396
|
olfactory receptor 1396 |
| chr3_+_89459118 | 1.84 |
ENSMUST00000029564.5
|
Pmvk
|
phosphomevalonate kinase |
| chr10_+_4611971 | 1.84 |
ENSMUST00000105590.1
ENSMUST00000067086.7 |
Esr1
|
estrogen receptor 1 (alpha) |
| chr5_+_139543889 | 1.83 |
ENSMUST00000174792.1
ENSMUST00000031523.8 |
Uncx
|
UNC homeobox |
| chr1_+_165788681 | 1.76 |
ENSMUST00000161971.1
ENSMUST00000178336.1 ENSMUST00000005907.5 ENSMUST00000027849.4 |
Cd247
|
CD247 antigen |
| chr1_+_132298606 | 1.72 |
ENSMUST00000046071.4
|
Klhdc8a
|
kelch domain containing 8A |
| chr17_+_24850515 | 1.72 |
ENSMUST00000154363.1
ENSMUST00000169200.1 |
Hagh
|
hydroxyacyl glutathione hydrolase |
| chr13_-_55362782 | 1.71 |
ENSMUST00000021940.7
|
Lman2
|
lectin, mannose-binding 2 |
| chr17_+_24850654 | 1.69 |
ENSMUST00000130989.1
ENSMUST00000024974.9 |
Hagh
|
hydroxyacyl glutathione hydrolase |
| chr12_-_56535047 | 1.67 |
ENSMUST00000178477.2
|
Nkx2-1
|
NK2 homeobox 1 |
| chr5_+_30814722 | 1.66 |
ENSMUST00000114724.1
|
Mapre3
|
microtubule-associated protein, RP/EB family, member 3 |
| chr7_+_76411062 | 1.65 |
ENSMUST00000026854.3
ENSMUST00000107442.2 |
Agbl1
|
ATP/GTP binding protein-like 1 |
| chr10_-_127121125 | 1.61 |
ENSMUST00000164259.1
ENSMUST00000080975.4 |
Os9
|
amplified in osteosarcoma |
| chr11_-_21572193 | 1.59 |
ENSMUST00000102874.4
|
Mdh1
|
malate dehydrogenase 1, NAD (soluble) |
| chr5_-_84417359 | 1.59 |
ENSMUST00000113401.1
|
Epha5
|
Eph receptor A5 |
| chr19_-_28967794 | 1.58 |
ENSMUST00000162110.1
|
4430402I18Rik
|
RIKEN cDNA 4430402I18 gene |
| chr18_+_37447641 | 1.58 |
ENSMUST00000052387.3
|
Pcdhb14
|
protocadherin beta 14 |
| chr8_-_67974567 | 1.58 |
ENSMUST00000098696.3
ENSMUST00000038959.9 ENSMUST00000093469.4 |
Psd3
|
pleckstrin and Sec7 domain containing 3 |
| chr16_-_36990449 | 1.57 |
ENSMUST00000075869.6
|
Fbxo40
|
F-box protein 40 |
| chr12_+_55598917 | 1.56 |
ENSMUST00000051857.3
|
Insm2
|
insulinoma-associated 2 |
| chr15_+_32920723 | 1.55 |
ENSMUST00000022871.5
|
Sdc2
|
syndecan 2 |
| chr6_+_54040078 | 1.54 |
ENSMUST00000127323.2
|
Chn2
|
chimerin (chimaerin) 2 |
| chr2_+_170731807 | 1.53 |
ENSMUST00000029075.4
|
Dok5
|
docking protein 5 |
| chr2_-_119547194 | 1.51 |
ENSMUST00000133668.1
|
Exd1
|
exonuclease 3'-5' domain containing 1 |
| chr7_+_131966446 | 1.50 |
ENSMUST00000045840.4
|
Gpr26
|
G protein-coupled receptor 26 |
| chr1_+_165788746 | 1.49 |
ENSMUST00000161559.2
|
Cd247
|
CD247 antigen |
| chr1_-_138848576 | 1.44 |
ENSMUST00000112030.2
|
Lhx9
|
LIM homeobox protein 9 |
| chr3_-_32491969 | 1.43 |
ENSMUST00000164954.1
|
Kcnmb3
|
potassium large conductance calcium-activated channel, subfamily M, beta member 3 |
| chr8_+_22624019 | 1.42 |
ENSMUST00000033936.6
|
Dkk4
|
dickkopf homolog 4 (Xenopus laevis) |
| chr10_+_127420334 | 1.42 |
ENSMUST00000171434.1
|
R3hdm2
|
R3H domain containing 2 |
| chr2_+_70563435 | 1.39 |
ENSMUST00000123330.1
|
Gad1
|
glutamate decarboxylase 1 |
| chr14_-_30353468 | 1.36 |
ENSMUST00000112249.1
|
Cacna1d
|
calcium channel, voltage-dependent, L type, alpha 1D subunit |
| chr6_-_138426735 | 1.35 |
ENSMUST00000162932.1
|
Lmo3
|
LIM domain only 3 |
| chr3_+_86070915 | 1.35 |
ENSMUST00000182666.1
|
Sh3d19
|
SH3 domain protein D19 |
| chr8_+_47713266 | 1.33 |
ENSMUST00000180928.1
|
E030037K01Rik
|
RIKEN cDNA E030037K01 gene |
| chr1_-_67038824 | 1.33 |
ENSMUST00000119559.1
ENSMUST00000149996.1 ENSMUST00000027149.5 ENSMUST00000113979.3 |
Lancl1
|
LanC (bacterial lantibiotic synthetase component C)-like 1 |
| chrM_+_10167 | 1.33 |
ENSMUST00000082414.1
|
mt-Nd4
|
mitochondrially encoded NADH dehydrogenase 4 |
| chr2_+_147187424 | 1.33 |
ENSMUST00000144411.1
|
6430503K07Rik
|
RIKEN cDNA 6430503K07 gene |
| chr5_-_146220901 | 1.32 |
ENSMUST00000169407.2
ENSMUST00000161331.1 ENSMUST00000159074.2 ENSMUST00000067837.3 |
Rnf6
|
ring finger protein (C3H2C3 type) 6 |
| chr9_-_29412204 | 1.31 |
ENSMUST00000115237.1
|
Ntm
|
neurotrimin |
| chr19_+_8840519 | 1.30 |
ENSMUST00000086058.6
|
Bscl2
|
Bernardinelli-Seip congenital lipodystrophy 2 homolog (human) |
| chrX_+_7579666 | 1.27 |
ENSMUST00000115740.1
ENSMUST00000115739.1 |
Foxp3
|
forkhead box P3 |
| chr6_+_8949670 | 1.26 |
ENSMUST00000060369.3
|
Nxph1
|
neurexophilin 1 |
| chr11_-_99337930 | 1.24 |
ENSMUST00000100482.2
|
Krt26
|
keratin 26 |
| chrX_+_48623737 | 1.24 |
ENSMUST00000114936.1
|
Slc25a14
|
solute carrier family 25 (mitochondrial carrier, brain), member 14 |
| chr1_-_5070281 | 1.22 |
ENSMUST00000147158.1
ENSMUST00000118000.1 |
Rgs20
|
regulator of G-protein signaling 20 |
| chr14_-_50897456 | 1.19 |
ENSMUST00000170855.1
|
A930018M24Rik
|
RIKEN cDNA A930018M24 gene |
| chr5_+_105824511 | 1.14 |
ENSMUST00000055994.3
|
D830014E11Rik
|
RIKEN cDNA D830014E11 gene |
| chr3_-_88177671 | 1.12 |
ENSMUST00000181837.1
|
1700113A16Rik
|
RIKEN cDNA 1700113A16 gene |
| chr10_+_39612934 | 1.12 |
ENSMUST00000019987.6
|
Traf3ip2
|
TRAF3 interacting protein 2 |
| chr5_+_115235836 | 1.11 |
ENSMUST00000081497.6
|
Pop5
|
processing of precursor 5, ribonuclease P/MRP family (S. cerevisiae) |
| chr12_+_10390756 | 1.11 |
ENSMUST00000020947.5
|
Rdh14
|
retinol dehydrogenase 14 (all-trans and 9-cis) |
| chr19_+_24875679 | 1.09 |
ENSMUST00000073080.5
|
Gm10053
|
predicted gene 10053 |
| chr3_+_5218546 | 1.08 |
ENSMUST00000026284.6
|
Zfhx4
|
zinc finger homeodomain 4 |
| chr17_+_39846958 | 1.08 |
ENSMUST00000182010.1
|
Gm26924
|
predicted gene, 26924 |
| chr18_-_61014199 | 1.05 |
ENSMUST00000025520.8
|
Slc6a7
|
solute carrier family 6 (neurotransmitter transporter, L-proline), member 7 |
| chr1_-_190170671 | 1.02 |
ENSMUST00000175916.1
|
Prox1
|
prospero-related homeobox 1 |
| chr13_+_63015167 | 1.02 |
ENSMUST00000021911.8
|
2010111I01Rik
|
RIKEN cDNA 2010111I01 gene |
| chrX_-_106603677 | 1.02 |
ENSMUST00000113480.1
|
Cysltr1
|
cysteinyl leukotriene receptor 1 |
| chr9_+_77636494 | 1.00 |
ENSMUST00000057781.7
|
Klhl31
|
kelch-like 31 |
| chr5_-_32133045 | 1.00 |
ENSMUST00000031308.6
|
Gm10463
|
predicted gene 10463 |
| chr4_+_99295900 | 0.99 |
ENSMUST00000094955.1
|
Gm12689
|
predicted gene 12689 |
| chr15_-_37458523 | 0.99 |
ENSMUST00000116445.2
|
Ncald
|
neurocalcin delta |
| chr4_-_116053825 | 0.98 |
ENSMUST00000030475.1
|
Nsun4
|
NOL1/NOP2/Sun domain family, member 4 |
| chr19_-_20954202 | 0.97 |
ENSMUST00000039500.3
|
Tmc1
|
transmembrane channel-like gene family 1 |
| chr8_+_46986913 | 0.97 |
ENSMUST00000039840.7
ENSMUST00000119686.1 |
Enpp6
|
ectonucleotide pyrophosphatase/phosphodiesterase 6 |
| chr1_-_93478785 | 0.97 |
ENSMUST00000170883.1
|
Hdlbp
|
high density lipoprotein (HDL) binding protein |
| chr8_-_45294854 | 0.97 |
ENSMUST00000116473.2
|
Klkb1
|
kallikrein B, plasma 1 |
| chr8_-_84937347 | 0.96 |
ENSMUST00000109741.2
ENSMUST00000119820.1 |
Mast1
|
microtubule associated serine/threonine kinase 1 |
| chr19_+_11965817 | 0.95 |
ENSMUST00000025590.9
|
Osbp
|
oxysterol binding protein |
| chr2_+_83956398 | 0.95 |
ENSMUST00000178325.1
|
Gm13698
|
predicted gene 13698 |
| chr15_+_55307743 | 0.92 |
ENSMUST00000023053.5
ENSMUST00000110221.2 ENSMUST00000110217.3 |
Col14a1
|
collagen, type XIV, alpha 1 |
| chr7_-_122101735 | 0.91 |
ENSMUST00000139456.1
ENSMUST00000106471.2 ENSMUST00000123296.1 ENSMUST00000033157.3 |
Ndufab1
|
NADH dehydrogenase (ubiquinone) 1, alpha/beta subcomplex, 1 |
| chr16_-_64786321 | 0.90 |
ENSMUST00000052588.4
|
Zfp654
|
zinc finger protein 654 |
| chr11_+_67200137 | 0.90 |
ENSMUST00000129018.1
|
Myh1
|
myosin, heavy polypeptide 1, skeletal muscle, adult |
| chr9_-_77399308 | 0.89 |
ENSMUST00000183878.1
|
RP23-264N13.2
|
RP23-264N13.2 |
| chr11_-_99374895 | 0.89 |
ENSMUST00000006963.2
|
Krt28
|
keratin 28 |
| chr16_-_22857514 | 0.88 |
ENSMUST00000004576.6
|
Tbccd1
|
TBCC domain containing 1 |
| chr6_+_97210689 | 0.87 |
ENSMUST00000044681.6
|
Arl6ip5
|
ADP-ribosylation factor-like 6 interacting protein 5 |
| chr13_+_63014934 | 0.86 |
ENSMUST00000091560.4
|
2010111I01Rik
|
RIKEN cDNA 2010111I01 gene |
| chr13_+_38204928 | 0.85 |
ENSMUST00000091641.5
ENSMUST00000178564.1 |
Snrnp48
|
small nuclear ribonucleoprotein 48 (U11/U12) |
| chr17_+_24470393 | 0.85 |
ENSMUST00000053024.6
|
Pgp
|
phosphoglycolate phosphatase |
| chr10_+_127421124 | 0.85 |
ENSMUST00000170336.1
|
R3hdm2
|
R3H domain containing 2 |
| chr5_-_87699414 | 0.85 |
ENSMUST00000082370.5
|
Csn2
|
casein beta |
| chr15_-_99820072 | 0.83 |
ENSMUST00000109024.2
|
Lima1
|
LIM domain and actin binding 1 |
| chr6_+_21986438 | 0.82 |
ENSMUST00000115382.1
|
Cped1
|
cadherin-like and PC-esterase domain containing 1 |
| chr6_-_77979515 | 0.82 |
ENSMUST00000159626.1
ENSMUST00000075340.5 ENSMUST00000162273.1 |
Ctnna2
|
catenin (cadherin associated protein), alpha 2 |
| chr4_+_11579647 | 0.81 |
ENSMUST00000180239.1
|
Fsbp
|
fibrinogen silencer binding protein |
| chr3_+_93442330 | 0.81 |
ENSMUST00000064257.5
|
Tchh
|
trichohyalin |
| chr18_-_31949571 | 0.81 |
ENSMUST00000064016.5
|
Gpr17
|
G protein-coupled receptor 17 |
| chr4_+_150237694 | 0.81 |
ENSMUST00000141931.1
|
Eno1
|
enolase 1, alpha non-neuron |
| chrX_-_112698642 | 0.81 |
ENSMUST00000039887.3
|
Pof1b
|
premature ovarian failure 1B |
| chr8_-_67515606 | 0.80 |
ENSMUST00000032981.5
|
Gm9755
|
predicted pseudogene 9755 |
| chr16_-_50432340 | 0.79 |
ENSMUST00000066037.6
ENSMUST00000089399.4 ENSMUST00000089404.3 ENSMUST00000114477.1 ENSMUST00000138166.1 |
Bbx
|
bobby sox homolog (Drosophila) |
| chr3_+_5218516 | 0.79 |
ENSMUST00000175866.1
|
Zfhx4
|
zinc finger homeodomain 4 |
| chr19_-_57197377 | 0.78 |
ENSMUST00000111546.1
|
Ablim1
|
actin-binding LIM protein 1 |
| chr14_+_46832127 | 0.77 |
ENSMUST00000068532.8
|
Cgrrf1
|
cell growth regulator with ring finger domain 1 |
| chr5_-_137531204 | 0.76 |
ENSMUST00000150063.2
|
Gnb2
|
guanine nucleotide binding protein (G protein), beta 2 |
| chr3_+_41564880 | 0.73 |
ENSMUST00000168086.1
|
Phf17
|
PHD finger protein 17 |
| chr15_+_28203726 | 0.71 |
ENSMUST00000067048.6
|
Dnah5
|
dynein, axonemal, heavy chain 5 |
| chr3_-_80802789 | 0.70 |
ENSMUST00000107745.1
ENSMUST00000075316.4 |
Gria2
|
glutamate receptor, ionotropic, AMPA2 (alpha 2) |
| chr18_-_20114767 | 0.69 |
ENSMUST00000038710.5
|
Dsc1
|
desmocollin 1 |
| chr6_-_73138947 | 0.69 |
ENSMUST00000114038.1
|
Dnah6
|
dynein, axonemal, heavy chain 6 |
| chr19_-_57197435 | 0.68 |
ENSMUST00000111550.1
|
Ablim1
|
actin-binding LIM protein 1 |
| chr10_+_24076500 | 0.68 |
ENSMUST00000051133.5
|
Taar8a
|
trace amine-associated receptor 8A |
| chr10_+_127420867 | 0.66 |
ENSMUST00000064793.6
|
R3hdm2
|
R3H domain containing 2 |
| chr3_+_94837702 | 0.64 |
ENSMUST00000107266.1
ENSMUST00000042402.5 ENSMUST00000107269.1 |
Pogz
|
pogo transposable element with ZNF domain |
| chr18_+_37489465 | 0.64 |
ENSMUST00000055949.2
|
Pcdhb18
|
protocadherin beta 18 |
| chr7_-_120145286 | 0.64 |
ENSMUST00000033207.4
|
Zp2
|
zona pellucida glycoprotein 2 |
| chr10_+_18469958 | 0.64 |
ENSMUST00000162891.1
ENSMUST00000100054.3 |
Nhsl1
|
NHS-like 1 |
| chr11_-_100041547 | 0.63 |
ENSMUST00000056362.2
|
Krt34
|
keratin 34 |
| chr6_+_29468068 | 0.63 |
ENSMUST00000143101.1
|
Atp6v1f
|
ATPase, H+ transporting, lysosomal V1 subunit F |
| chr5_-_137314175 | 0.62 |
ENSMUST00000024119.9
|
Trip6
|
thyroid hormone receptor interactor 6 |
| chrX_+_150589907 | 0.62 |
ENSMUST00000080884.4
|
Pfkfb1
|
6-phosphofructo-2-kinase/fructose-2,6-biphosphatase 1 |
| chr1_-_130729249 | 0.62 |
ENSMUST00000171479.1
|
Pfkfb2
|
6-phosphofructo-2-kinase/fructose-2,6-biphosphatase 2 |
| chr9_+_75775355 | 0.61 |
ENSMUST00000012281.7
|
Bmp5
|
bone morphogenetic protein 5 |
| chr2_+_174327747 | 0.59 |
ENSMUST00000087871.4
|
Gnas
|
GNAS (guanine nucleotide binding protein, alpha stimulating) complex locus |
| chr2_-_116065798 | 0.58 |
ENSMUST00000110907.1
ENSMUST00000110908.2 |
Meis2
|
Meis homeobox 2 |
| chrX_+_136822671 | 0.58 |
ENSMUST00000033800.6
|
Plp1
|
proteolipid protein (myelin) 1 |
| chr7_-_35056467 | 0.57 |
ENSMUST00000130491.1
|
Cebpg
|
CCAAT/enhancer binding protein (C/EBP), gamma |
| chr16_-_76373827 | 0.56 |
ENSMUST00000121927.1
|
Nrip1
|
nuclear receptor interacting protein 1 |
| chr3_+_94837533 | 0.56 |
ENSMUST00000107270.2
|
Pogz
|
pogo transposable element with ZNF domain |
| chr12_+_55384222 | 0.55 |
ENSMUST00000163070.1
|
Psma6
|
proteasome (prosome, macropain) subunit, alpha type 6 |
| chr19_-_38224096 | 0.55 |
ENSMUST00000067167.5
|
Fra10ac1
|
FRA10AC1 homolog (human) |
| chr1_-_92518515 | 0.55 |
ENSMUST00000062353.4
|
Olfr1414
|
olfactory receptor 1414 |
| chr16_+_17331371 | 0.54 |
ENSMUST00000023450.6
ENSMUST00000161034.1 |
Serpind1
|
serine (or cysteine) peptidase inhibitor, clade D, member 1 |
| chr1_+_180111339 | 0.53 |
ENSMUST00000145181.1
|
Cdc42bpa
|
CDC42 binding protein kinase alpha |
| chr9_-_37669170 | 0.52 |
ENSMUST00000011262.2
|
Panx3
|
pannexin 3 |
| chr18_-_79109391 | 0.52 |
ENSMUST00000025430.8
ENSMUST00000161465.2 |
Setbp1
|
SET binding protein 1 |
| chr18_+_37355271 | 0.52 |
ENSMUST00000051163.1
|
Pcdhb8
|
protocadherin beta 8 |
| chr17_-_43667015 | 0.52 |
ENSMUST00000024705.4
|
Slc25a27
|
solute carrier family 25, member 27 |
| chr15_-_37459327 | 0.51 |
ENSMUST00000119730.1
ENSMUST00000120746.1 |
Ncald
|
neurocalcin delta |
| chr1_-_110977366 | 0.51 |
ENSMUST00000094626.3
|
Cdh19
|
cadherin 19, type 2 |
| chr10_+_127421208 | 0.50 |
ENSMUST00000168780.1
|
R3hdm2
|
R3H domain containing 2 |
| chr1_-_163313661 | 0.50 |
ENSMUST00000174397.1
ENSMUST00000075805.6 ENSMUST00000027878.7 |
Prrx1
|
paired related homeobox 1 |
| chr2_-_93849679 | 0.50 |
ENSMUST00000068513.4
ENSMUST00000041593.8 ENSMUST00000130077.1 |
Accs
|
1-aminocyclopropane-1-carboxylate synthase (non-functional) |
| chr11_-_33203588 | 0.50 |
ENSMUST00000037746.6
|
Tlx3
|
T cell leukemia, homeobox 3 |
| chr3_-_146781351 | 0.49 |
ENSMUST00000005164.7
|
Prkacb
|
protein kinase, cAMP dependent, catalytic, beta |
| chr5_-_122614445 | 0.49 |
ENSMUST00000127220.1
ENSMUST00000031426.7 |
Ift81
|
intraflagellar transport 81 |
| chrX_-_48513518 | 0.49 |
ENSMUST00000114945.2
ENSMUST00000037349.7 |
Aifm1
|
apoptosis-inducing factor, mitochondrion-associated 1 |
| chr15_-_82912134 | 0.49 |
ENSMUST00000048966.5
ENSMUST00000109510.2 |
Tcf20
|
transcription factor 20 |
| chr6_+_106118924 | 0.49 |
ENSMUST00000079416.5
|
Cntn4
|
contactin 4 |
| chr6_+_29467718 | 0.47 |
ENSMUST00000004396.6
|
Atp6v1f
|
ATPase, H+ transporting, lysosomal V1 subunit F |
| chr12_-_31713873 | 0.47 |
ENSMUST00000057783.4
ENSMUST00000174480.2 ENSMUST00000176710.1 |
Gpr22
|
G protein-coupled receptor 22 |
| chr3_+_5218589 | 0.47 |
ENSMUST00000177488.1
|
Zfhx4
|
zinc finger homeodomain 4 |
| chr5_-_137530990 | 0.45 |
ENSMUST00000132525.1
|
Gnb2
|
guanine nucleotide binding protein (G protein), beta 2 |
| chr8_+_106059562 | 0.45 |
ENSMUST00000109308.1
|
Nfatc3
|
nuclear factor of activated T cells, cytoplasmic, calcineurin dependent 3 |
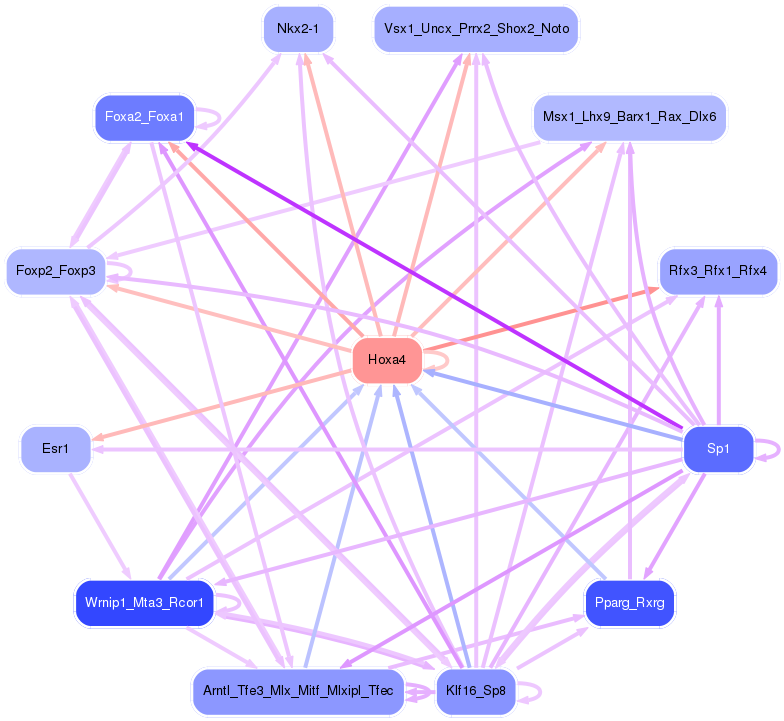
Network of associatons between targets according to the STRING database.

First level regulatory network of Hoxa4
Gene Ontology Analysis
Gene overrepresentation in biological process category:
| Log-likelihood per target | Total log-likelihood | Term | Description |
|---|---|---|---|
| 2.6 | 7.7 | GO:1903002 | regulation of lipid transport across blood brain barrier(GO:1903000) positive regulation of lipid transport across blood brain barrier(GO:1903002) |
| 2.2 | 13.4 | GO:1904075 | regulation of trophectodermal cell proliferation(GO:1904073) positive regulation of trophectodermal cell proliferation(GO:1904075) |
| 1.7 | 3.4 | GO:0060741 | prostate gland stromal morphogenesis(GO:0060741) |
| 1.4 | 4.1 | GO:0001982 | baroreceptor response to decreased systemic arterial blood pressure(GO:0001982) |
| 1.1 | 5.5 | GO:0021914 | negative regulation of smoothened signaling pathway involved in ventral spinal cord patterning(GO:0021914) |
| 0.9 | 5.3 | GO:0038161 | prolactin signaling pathway(GO:0038161) |
| 0.8 | 13.4 | GO:0048387 | negative regulation of retinoic acid receptor signaling pathway(GO:0048387) |
| 0.8 | 2.4 | GO:0061289 | cell-cell signaling involved in kidney development(GO:0060995) Wnt signaling pathway involved in kidney development(GO:0061289) canonical Wnt signaling pathway involved in metanephric kidney development(GO:0061290) cell-cell signaling involved in metanephros development(GO:0072204) |
| 0.7 | 6.5 | GO:0008300 | isoprenoid catabolic process(GO:0008300) |
| 0.6 | 3.1 | GO:0006572 | tyrosine catabolic process(GO:0006572) |
| 0.6 | 6.0 | GO:0051596 | methylglyoxal catabolic process to D-lactate via S-lactoyl-glutathione(GO:0019243) methylglyoxal catabolic process(GO:0051596) methylglyoxal catabolic process to lactate(GO:0061727) |
| 0.6 | 1.7 | GO:0021759 | globus pallidus development(GO:0021759) |
| 0.5 | 2.2 | GO:0002408 | myeloid dendritic cell chemotaxis(GO:0002408) |
| 0.5 | 1.8 | GO:0019287 | isopentenyl diphosphate biosynthetic process, mevalonate pathway(GO:0019287) |
| 0.4 | 1.3 | GO:0002465 | CD4-positive, CD25-positive, alpha-beta regulatory T cell lineage commitment(GO:0002362) peripheral T cell tolerance induction(GO:0002458) peripheral tolerance induction(GO:0002465) negative regulation of histone deacetylation(GO:0031064) negative regulation of interferon-gamma biosynthetic process(GO:0045077) |
| 0.4 | 1.7 | GO:1903033 | regulation of microtubule plus-end binding(GO:1903031) positive regulation of microtubule plus-end binding(GO:1903033) |
| 0.4 | 2.4 | GO:0033540 | fatty acid beta-oxidation using acyl-CoA oxidase(GO:0033540) |
| 0.4 | 2.8 | GO:0099550 | trans-synaptic signalling, modulating synaptic transmission(GO:0099550) |
| 0.3 | 1.0 | GO:0002194 | hepatocyte cell migration(GO:0002194) branching involved in pancreas morphogenesis(GO:0061114) acinar cell differentiation(GO:0090425) positive regulation of forebrain neuron differentiation(GO:2000979) |
| 0.3 | 1.4 | GO:0086046 | membrane depolarization during SA node cell action potential(GO:0086046) |
| 0.3 | 1.8 | GO:0060011 | Sertoli cell proliferation(GO:0060011) prostate epithelial cord elongation(GO:0060523) |
| 0.3 | 1.4 | GO:0035262 | gonad morphogenesis(GO:0035262) |
| 0.3 | 2.6 | GO:0060267 | positive regulation of respiratory burst(GO:0060267) |
| 0.3 | 1.6 | GO:0035609 | C-terminal protein deglutamylation(GO:0035609) |
| 0.3 | 1.1 | GO:0035524 | proline transmembrane transport(GO:0035524) |
| 0.3 | 2.0 | GO:0009249 | protein lipoylation(GO:0009249) |
| 0.2 | 1.0 | GO:0060005 | vestibular reflex(GO:0060005) |
| 0.2 | 1.6 | GO:0006621 | protein retention in ER lumen(GO:0006621) |
| 0.2 | 1.6 | GO:0006108 | malate metabolic process(GO:0006108) |
| 0.2 | 1.3 | GO:0044314 | protein K27-linked ubiquitination(GO:0044314) |
| 0.2 | 2.2 | GO:0086023 | adrenergic receptor signaling pathway involved in heart process(GO:0086023) |
| 0.2 | 0.9 | GO:0006114 | glycerol biosynthetic process(GO:0006114) |
| 0.2 | 0.6 | GO:0008588 | release of cytoplasmic sequestered NF-kappaB(GO:0008588) |
| 0.2 | 1.8 | GO:0035726 | common myeloid progenitor cell proliferation(GO:0035726) |
| 0.2 | 1.4 | GO:0051799 | negative regulation of hair follicle development(GO:0051799) |
| 0.2 | 1.4 | GO:0009449 | gamma-aminobutyric acid biosynthetic process(GO:0009449) |
| 0.2 | 1.0 | GO:0051919 | positive regulation of fibrinolysis(GO:0051919) |
| 0.2 | 1.9 | GO:0016554 | cytidine to uridine editing(GO:0016554) |
| 0.2 | 0.9 | GO:0051684 | maintenance of centrosome location(GO:0051661) maintenance of Golgi location(GO:0051684) |
| 0.2 | 2.5 | GO:0006123 | mitochondrial electron transport, cytochrome c to oxygen(GO:0006123) |
| 0.2 | 1.0 | GO:0042256 | mature ribosome assembly(GO:0042256) |
| 0.2 | 0.6 | GO:0021502 | neural fold elevation formation(GO:0021502) |
| 0.1 | 2.9 | GO:0060134 | prepulse inhibition(GO:0060134) |
| 0.1 | 0.6 | GO:0001543 | ovarian follicle rupture(GO:0001543) |
| 0.1 | 0.8 | GO:0002036 | regulation of L-glutamate transport(GO:0002036) |
| 0.1 | 2.1 | GO:0006957 | complement activation, alternative pathway(GO:0006957) |
| 0.1 | 2.6 | GO:0016556 | mRNA modification(GO:0016556) |
| 0.1 | 1.4 | GO:0005513 | detection of calcium ion(GO:0005513) |
| 0.1 | 0.5 | GO:0051562 | negative regulation of mitochondrial calcium ion concentration(GO:0051562) |
| 0.1 | 1.0 | GO:0019695 | choline metabolic process(GO:0019695) |
| 0.1 | 0.4 | GO:1902527 | positive regulation of protein monoubiquitination(GO:1902527) |
| 0.1 | 0.6 | GO:0040032 | post-embryonic body morphogenesis(GO:0040032) |
| 0.1 | 0.3 | GO:0046166 | alditol catabolic process(GO:0019405) glyceraldehyde-3-phosphate biosynthetic process(GO:0046166) |
| 0.1 | 0.3 | GO:0007208 | phospholipase C-activating serotonin receptor signaling pathway(GO:0007208) |
| 0.1 | 1.2 | GO:1903301 | positive regulation of glucokinase activity(GO:0033133) positive regulation of hexokinase activity(GO:1903301) |
| 0.1 | 1.6 | GO:0032793 | positive regulation of CREB transcription factor activity(GO:0032793) |
| 0.1 | 0.4 | GO:0006244 | pyrimidine nucleotide catabolic process(GO:0006244) pyrimidine deoxyribonucleotide catabolic process(GO:0009223) |
| 0.1 | 0.6 | GO:0060468 | prevention of polyspermy(GO:0060468) |
| 0.1 | 0.6 | GO:0097475 | motor neuron migration(GO:0097475) |
| 0.1 | 1.5 | GO:0051386 | regulation of neurotrophin TRK receptor signaling pathway(GO:0051386) |
| 0.1 | 0.3 | GO:0051866 | general adaptation syndrome(GO:0051866) |
| 0.1 | 0.3 | GO:0002587 | negative regulation of antigen processing and presentation of peptide antigen via MHC class II(GO:0002587) |
| 0.1 | 0.2 | GO:0030573 | bile acid catabolic process(GO:0030573) |
| 0.1 | 0.4 | GO:0045919 | positive regulation of cytolysis(GO:0045919) |
| 0.1 | 1.2 | GO:0051382 | kinetochore assembly(GO:0051382) |
| 0.1 | 0.1 | GO:0060197 | cloaca development(GO:0035844) cloacal septation(GO:0060197) |
| 0.1 | 3.9 | GO:0042462 | eye photoreceptor cell development(GO:0042462) |
| 0.1 | 1.5 | GO:0034587 | piRNA metabolic process(GO:0034587) |
| 0.1 | 0.4 | GO:0071698 | olfactory placode formation(GO:0030910) olfactory placode development(GO:0071698) olfactory placode morphogenesis(GO:0071699) |
| 0.1 | 0.5 | GO:0035735 | intraciliary transport involved in cilium morphogenesis(GO:0035735) |
| 0.1 | 1.3 | GO:0006120 | mitochondrial electron transport, NADH to ubiquinone(GO:0006120) |
| 0.1 | 0.4 | GO:0072093 | ureteric bud invasion(GO:0072092) metanephric renal vesicle formation(GO:0072093) |
| 0.1 | 1.9 | GO:0036342 | post-anal tail morphogenesis(GO:0036342) |
| 0.1 | 3.2 | GO:0070207 | protein homotrimerization(GO:0070207) |
| 0.1 | 1.3 | GO:0051044 | positive regulation of membrane protein ectodomain proteolysis(GO:0051044) |
| 0.1 | 0.6 | GO:0043353 | enucleate erythrocyte differentiation(GO:0043353) |
| 0.1 | 0.4 | GO:0035166 | hexose phosphate transport(GO:0015712) glucose-6-phosphate transport(GO:0015760) post-embryonic hemopoiesis(GO:0035166) |
| 0.1 | 1.1 | GO:0042572 | retinol metabolic process(GO:0042572) |
| 0.1 | 0.8 | GO:0002862 | negative regulation of inflammatory response to antigenic stimulus(GO:0002862) |
| 0.1 | 0.3 | GO:0007182 | common-partner SMAD protein phosphorylation(GO:0007182) |
| 0.1 | 0.2 | GO:0014732 | skeletal muscle atrophy(GO:0014732) |
| 0.1 | 0.5 | GO:1902510 | regulation of apoptotic DNA fragmentation(GO:1902510) |
| 0.1 | 1.6 | GO:0032012 | ARF protein signal transduction(GO:0032011) regulation of ARF protein signal transduction(GO:0032012) |
| 0.1 | 1.3 | GO:0050995 | negative regulation of lipid catabolic process(GO:0050995) |
| 0.1 | 2.4 | GO:0030520 | intracellular estrogen receptor signaling pathway(GO:0030520) |
| 0.1 | 2.6 | GO:0006953 | acute-phase response(GO:0006953) |
| 0.1 | 0.2 | GO:0002674 | negative regulation of acute inflammatory response(GO:0002674) |
| 0.1 | 1.0 | GO:0044126 | regulation of growth of symbiont in host(GO:0044126) |
| 0.0 | 0.8 | GO:0022010 | central nervous system myelination(GO:0022010) axon ensheathment in central nervous system(GO:0032291) |
| 0.0 | 0.7 | GO:1902004 | positive regulation of beta-amyloid formation(GO:1902004) |
| 0.0 | 0.7 | GO:0036158 | outer dynein arm assembly(GO:0036158) |
| 0.0 | 2.1 | GO:0043171 | peptide catabolic process(GO:0043171) |
| 0.0 | 1.1 | GO:0002230 | positive regulation of defense response to virus by host(GO:0002230) |
| 0.0 | 0.5 | GO:0071285 | cellular response to lithium ion(GO:0071285) |
| 0.0 | 0.5 | GO:0048664 | neuron fate determination(GO:0048664) |
| 0.0 | 1.7 | GO:0006890 | retrograde vesicle-mediated transport, Golgi to ER(GO:0006890) |
| 0.0 | 6.0 | GO:0007050 | cell cycle arrest(GO:0007050) |
| 0.0 | 0.1 | GO:0010841 | positive regulation of circadian sleep/wake cycle, wakefulness(GO:0010841) |
| 0.0 | 1.0 | GO:0040023 | nuclear migration(GO:0007097) establishment of nucleus localization(GO:0040023) |
| 0.0 | 1.1 | GO:0015991 | ATP hydrolysis coupled proton transport(GO:0015991) |
| 0.0 | 0.5 | GO:0002087 | regulation of respiratory gaseous exchange by neurological system process(GO:0002087) |
| 0.0 | 0.4 | GO:0071380 | cellular response to prostaglandin E stimulus(GO:0071380) |
| 0.0 | 1.0 | GO:0002437 | inflammatory response to antigenic stimulus(GO:0002437) |
| 0.0 | 0.2 | GO:0086073 | bundle of His cell-Purkinje myocyte adhesion involved in cell communication(GO:0086073) |
| 0.0 | 0.9 | GO:0061050 | regulation of cell growth involved in cardiac muscle cell development(GO:0061050) |
| 0.0 | 3.1 | GO:0007156 | homophilic cell adhesion via plasma membrane adhesion molecules(GO:0007156) |
| 0.0 | 0.1 | GO:0001830 | trophectodermal cell fate commitment(GO:0001830) |
| 0.0 | 0.4 | GO:0048739 | cardiac muscle fiber development(GO:0048739) |
| 0.0 | 1.1 | GO:0007189 | adenylate cyclase-activating G-protein coupled receptor signaling pathway(GO:0007189) |
| 0.0 | 0.3 | GO:0090110 | cargo loading into COPII-coated vesicle(GO:0090110) |
| 0.0 | 0.4 | GO:0045109 | intermediate filament organization(GO:0045109) |
| 0.0 | 2.7 | GO:0048706 | embryonic skeletal system development(GO:0048706) |
| 0.0 | 1.5 | GO:0003073 | regulation of systemic arterial blood pressure(GO:0003073) |
| 0.0 | 0.9 | GO:2000242 | negative regulation of reproductive process(GO:2000242) |
| 0.0 | 0.8 | GO:0070830 | bicellular tight junction assembly(GO:0070830) |
| 0.0 | 0.3 | GO:0045722 | positive regulation of gluconeogenesis(GO:0045722) |
| 0.0 | 1.4 | GO:0072332 | intrinsic apoptotic signaling pathway by p53 class mediator(GO:0072332) |
| 0.0 | 0.4 | GO:0007274 | neuromuscular synaptic transmission(GO:0007274) |
| 0.0 | 0.7 | GO:0051966 | regulation of synaptic transmission, glutamatergic(GO:0051966) |
| 0.0 | 0.7 | GO:0003341 | cilium movement(GO:0003341) |
| 0.0 | 3.2 | GO:0043413 | protein glycosylation(GO:0006486) macromolecule glycosylation(GO:0043413) |
| 0.0 | 0.7 | GO:0008542 | visual learning(GO:0008542) |
| 0.0 | 0.3 | GO:0002053 | positive regulation of mesenchymal cell proliferation(GO:0002053) |
Gene overrepresentation in cellular component category:
| Log-likelihood per target | Total log-likelihood | Term | Description |
|---|---|---|---|
| 1.5 | 7.7 | GO:0034365 | discoidal high-density lipoprotein particle(GO:0034365) |
| 1.5 | 13.4 | GO:0042567 | alphav-beta3 integrin-IGF-1-IGF1R complex(GO:0035867) insulin-like growth factor ternary complex(GO:0042567) |
| 0.4 | 3.2 | GO:0042105 | alpha-beta T cell receptor complex(GO:0042105) |
| 0.3 | 1.9 | GO:0045293 | mRNA editing complex(GO:0045293) |
| 0.3 | 1.5 | GO:1990923 | PET complex(GO:1990923) |
| 0.3 | 1.8 | GO:0097550 | transcriptional preinitiation complex(GO:0097550) |
| 0.2 | 0.6 | GO:0043540 | 6-phosphofructo-2-kinase/fructose-2,6-biphosphatase complex(GO:0043540) |
| 0.2 | 1.6 | GO:0000835 | ER ubiquitin ligase complex(GO:0000835) Hrd1p ubiquitin ligase complex(GO:0000836) |
| 0.2 | 2.6 | GO:0034663 | endoplasmic reticulum chaperone complex(GO:0034663) |
| 0.2 | 1.1 | GO:0000172 | ribonuclease MRP complex(GO:0000172) |
| 0.1 | 1.4 | GO:1990454 | L-type voltage-gated calcium channel complex(GO:1990454) |
| 0.1 | 2.5 | GO:0005751 | mitochondrial respiratory chain complex IV(GO:0005751) |
| 0.1 | 1.1 | GO:0033180 | proton-transporting V-type ATPase, V1 domain(GO:0033180) |
| 0.1 | 4.4 | GO:0032281 | AMPA glutamate receptor complex(GO:0032281) |
| 0.1 | 0.8 | GO:0000015 | phosphopyruvate hydratase complex(GO:0000015) |
| 0.1 | 2.2 | GO:0033017 | sarcoplasmic reticulum membrane(GO:0033017) |
| 0.1 | 4.2 | GO:0048786 | presynaptic active zone(GO:0048786) |
| 0.1 | 0.4 | GO:1990130 | Iml1 complex(GO:1990130) Gtr1-Gtr2 GTPase complex(GO:1990131) |
| 0.1 | 1.0 | GO:0071006 | U2-type catalytic step 1 spliceosome(GO:0071006) |
| 0.1 | 0.7 | GO:0036156 | inner dynein arm(GO:0036156) |
| 0.1 | 2.1 | GO:0098878 | ionotropic glutamate receptor complex(GO:0008328) neurotransmitter receptor complex(GO:0098878) |
| 0.1 | 0.3 | GO:0032437 | cuticular plate(GO:0032437) |
| 0.1 | 0.6 | GO:0019773 | proteasome core complex, alpha-subunit complex(GO:0019773) |
| 0.0 | 1.5 | GO:0030057 | desmosome(GO:0030057) |
| 0.0 | 0.7 | GO:0036157 | outer dynein arm(GO:0036157) |
| 0.0 | 0.9 | GO:0005614 | interstitial matrix(GO:0005614) |
| 0.0 | 0.9 | GO:0031616 | spindle pole centrosome(GO:0031616) |
| 0.0 | 1.6 | GO:0035371 | microtubule plus-end(GO:0035371) |
| 0.0 | 0.6 | GO:0030127 | COPII vesicle coat(GO:0030127) |
| 0.0 | 1.0 | GO:0032426 | stereocilium tip(GO:0032426) |
| 0.0 | 0.4 | GO:0031595 | nuclear proteasome complex(GO:0031595) |
| 0.0 | 3.6 | GO:0030315 | T-tubule(GO:0030315) |
| 0.0 | 0.5 | GO:0005952 | cAMP-dependent protein kinase complex(GO:0005952) |
| 0.0 | 0.4 | GO:0016461 | unconventional myosin complex(GO:0016461) |
| 0.0 | 2.7 | GO:0031463 | Cul3-RING ubiquitin ligase complex(GO:0031463) |
| 0.0 | 2.4 | GO:0031594 | neuromuscular junction(GO:0031594) |
| 0.0 | 1.0 | GO:0034364 | high-density lipoprotein particle(GO:0034364) |
| 0.0 | 2.2 | GO:0070469 | respiratory chain(GO:0070469) |
| 0.0 | 1.8 | GO:0005834 | heterotrimeric G-protein complex(GO:0005834) |
| 0.0 | 0.9 | GO:0005689 | U12-type spliceosomal complex(GO:0005689) |
| 0.0 | 2.4 | GO:0005778 | peroxisomal membrane(GO:0005778) microbody membrane(GO:0031903) |
| 0.0 | 0.3 | GO:0042613 | MHC class II protein complex(GO:0042613) |
| 0.0 | 3.8 | GO:0005777 | peroxisome(GO:0005777) microbody(GO:0042579) |
| 0.0 | 3.8 | GO:0042641 | actomyosin(GO:0042641) |
| 0.0 | 1.7 | GO:0005793 | endoplasmic reticulum-Golgi intermediate compartment(GO:0005793) |
| 0.0 | 0.5 | GO:0097225 | sperm midpiece(GO:0097225) |
| 0.0 | 0.2 | GO:0005916 | fascia adherens(GO:0005916) |
| 0.0 | 3.8 | GO:0001650 | fibrillar center(GO:0001650) |
| 0.0 | 0.5 | GO:0005859 | muscle myosin complex(GO:0005859) |
| 0.0 | 2.0 | GO:0005882 | intermediate filament(GO:0005882) |
| 0.0 | 1.0 | GO:0000315 | organellar large ribosomal subunit(GO:0000315) mitochondrial large ribosomal subunit(GO:0005762) |
| 0.0 | 2.1 | GO:0072562 | blood microparticle(GO:0072562) |
| 0.0 | 0.2 | GO:0032045 | guanyl-nucleotide exchange factor complex(GO:0032045) |
| 0.0 | 0.5 | GO:0005921 | gap junction(GO:0005921) |
| 0.0 | 1.0 | GO:0008076 | voltage-gated potassium channel complex(GO:0008076) |
Gene overrepresentation in molecular function category:
| Log-likelihood per target | Total log-likelihood | Term | Description |
|---|---|---|---|
| 2.6 | 7.7 | GO:0046911 | metal chelating activity(GO:0046911) |
| 1.9 | 13.4 | GO:0052650 | NADP-retinol dehydrogenase activity(GO:0052650) |
| 1.1 | 5.3 | GO:0004925 | prolactin receptor activity(GO:0004925) |
| 1.1 | 3.2 | GO:0050508 | glucuronosyl-N-acetylglucosaminyl-proteoglycan 4-alpha-N-acetylglucosaminyltransferase activity(GO:0050508) |
| 1.0 | 4.1 | GO:0004937 | alpha1-adrenergic receptor activity(GO:0004937) |
| 0.7 | 6.0 | GO:0004416 | hydroxyacylglutathione hydrolase activity(GO:0004416) |
| 0.6 | 1.8 | GO:0038052 | type 1 metabotropic glutamate receptor binding(GO:0031798) RNA polymerase II transcription factor activity, estrogen-activated sequence-specific DNA binding(GO:0038052) |
| 0.5 | 1.6 | GO:0030060 | L-malate dehydrogenase activity(GO:0030060) |
| 0.5 | 2.8 | GO:0005030 | neurotrophin receptor activity(GO:0005030) |
| 0.4 | 2.4 | GO:0016401 | palmitoyl-CoA oxidase activity(GO:0016401) |
| 0.4 | 1.1 | GO:0000171 | ribonuclease MRP activity(GO:0000171) |
| 0.4 | 2.2 | GO:0042030 | ATPase inhibitor activity(GO:0042030) |
| 0.4 | 9.6 | GO:0016702 | oxidoreductase activity, acting on single donors with incorporation of molecular oxygen, incorporation of two atoms of oxygen(GO:0016702) |
| 0.3 | 9.3 | GO:0005550 | pheromone binding(GO:0005550) |
| 0.3 | 1.0 | GO:0009383 | rRNA (cytosine-C5-)-methyltransferase activity(GO:0009383) |
| 0.3 | 2.7 | GO:0001594 | trace-amine receptor activity(GO:0001594) |
| 0.3 | 1.0 | GO:0004974 | leukotriene receptor activity(GO:0004974) |
| 0.2 | 0.9 | GO:0008967 | phosphoglycolate phosphatase activity(GO:0008967) |
| 0.2 | 0.6 | GO:0032190 | acrosin binding(GO:0032190) |
| 0.2 | 1.4 | GO:0004351 | glutamate decarboxylase activity(GO:0004351) |
| 0.2 | 1.4 | GO:0086007 | voltage-gated calcium channel activity involved in cardiac muscle cell action potential(GO:0086007) |
| 0.2 | 5.8 | GO:0005159 | insulin-like growth factor receptor binding(GO:0005159) |
| 0.1 | 1.2 | GO:0004331 | 6-phosphofructo-2-kinase activity(GO:0003873) fructose-2,6-bisphosphate 2-phosphatase activity(GO:0004331) |
| 0.1 | 2.2 | GO:0016500 | protein-hormone receptor activity(GO:0016500) |
| 0.1 | 4.4 | GO:0015020 | glucuronosyltransferase activity(GO:0015020) |
| 0.1 | 1.7 | GO:0001161 | intronic transcription regulatory region sequence-specific DNA binding(GO:0001161) |
| 0.1 | 0.4 | GO:0022850 | serotonin-gated cation channel activity(GO:0022850) |
| 0.1 | 0.7 | GO:0015277 | kainate selective glutamate receptor activity(GO:0015277) |
| 0.1 | 0.7 | GO:0005004 | GPI-linked ephrin receptor activity(GO:0005004) |
| 0.1 | 1.1 | GO:0008106 | alcohol dehydrogenase (NADP+) activity(GO:0008106) |
| 0.1 | 1.0 | GO:0008889 | glycerophosphodiester phosphodiesterase activity(GO:0008889) |
| 0.1 | 1.3 | GO:0051525 | NFAT protein binding(GO:0051525) |
| 0.1 | 0.5 | GO:0004174 | electron-transferring-flavoprotein dehydrogenase activity(GO:0004174) oxidoreductase activity, acting on the CH-NH group of donors, quinone or similar compound as acceptor(GO:0016649) |
| 0.1 | 2.0 | GO:0005234 | extracellular-glutamate-gated ion channel activity(GO:0005234) |
| 0.1 | 1.0 | GO:0008381 | mechanically-gated ion channel activity(GO:0008381) mechanically gated channel activity(GO:0022833) |
| 0.1 | 1.1 | GO:0015193 | L-proline transmembrane transporter activity(GO:0015193) |
| 0.1 | 0.4 | GO:0061513 | hexose phosphate transmembrane transporter activity(GO:0015119) organophosphate:inorganic phosphate antiporter activity(GO:0015315) hexose-phosphate:inorganic phosphate antiporter activity(GO:0015526) glucose 6-phosphate:inorganic phosphate antiporter activity(GO:0061513) |
| 0.1 | 0.8 | GO:0004634 | phosphopyruvate hydratase activity(GO:0004634) |
| 0.1 | 2.1 | GO:0005540 | hyaluronic acid binding(GO:0005540) |
| 0.1 | 2.5 | GO:0015002 | cytochrome-c oxidase activity(GO:0004129) heme-copper terminal oxidase activity(GO:0015002) oxidoreductase activity, acting on a heme group of donors, oxygen as acceptor(GO:0016676) |
| 0.1 | 3.4 | GO:0016922 | ligand-dependent nuclear receptor binding(GO:0016922) |
| 0.1 | 1.9 | GO:0070006 | metalloaminopeptidase activity(GO:0070006) |
| 0.1 | 1.7 | GO:0005537 | mannose binding(GO:0005537) |
| 0.1 | 0.8 | GO:0019911 | structural constituent of myelin sheath(GO:0019911) |
| 0.1 | 0.8 | GO:0070700 | BMP receptor binding(GO:0070700) |
| 0.1 | 0.4 | GO:0036402 | proteasome-activating ATPase activity(GO:0036402) |
| 0.1 | 0.4 | GO:0004957 | prostaglandin E receptor activity(GO:0004957) |
| 0.1 | 1.4 | GO:0015269 | calcium-activated potassium channel activity(GO:0015269) |
| 0.1 | 0.4 | GO:0047429 | nucleoside-triphosphate diphosphatase activity(GO:0047429) |
| 0.1 | 2.6 | GO:0005044 | scavenger receptor activity(GO:0005044) |
| 0.1 | 1.6 | GO:0004181 | metallocarboxypeptidase activity(GO:0004181) |
| 0.0 | 0.5 | GO:0004691 | cAMP-dependent protein kinase activity(GO:0004691) |
| 0.0 | 1.5 | GO:0043014 | alpha-tubulin binding(GO:0043014) |
| 0.0 | 1.4 | GO:0008569 | ATP-dependent microtubule motor activity, minus-end-directed(GO:0008569) |
| 0.0 | 1.6 | GO:0005086 | ARF guanyl-nucleotide exchange factor activity(GO:0005086) |
| 0.0 | 1.3 | GO:1900750 | glutathione binding(GO:0043295) oligopeptide binding(GO:1900750) |
| 0.0 | 1.3 | GO:0050136 | NADH dehydrogenase (ubiquinone) activity(GO:0008137) NADH dehydrogenase (quinone) activity(GO:0050136) |
| 0.0 | 1.5 | GO:0005158 | insulin receptor binding(GO:0005158) |
| 0.0 | 3.2 | GO:1990782 | protein tyrosine kinase binding(GO:1990782) |
| 0.0 | 1.1 | GO:0046961 | proton-transporting ATPase activity, rotational mechanism(GO:0046961) |
| 0.0 | 0.6 | GO:0008301 | DNA binding, bending(GO:0008301) |
| 0.0 | 0.3 | GO:0008454 | alpha-1,3-mannosylglycoprotein 4-beta-N-acetylglucosaminyltransferase activity(GO:0008454) |
| 0.0 | 0.2 | GO:0046975 | histone methyltransferase activity (H3-K36 specific)(GO:0046975) |
| 0.0 | 0.2 | GO:0003839 | gamma-glutamylcyclotransferase activity(GO:0003839) |
| 0.0 | 0.8 | GO:0035259 | glucocorticoid receptor binding(GO:0035259) |
| 0.0 | 1.0 | GO:0015248 | sterol transporter activity(GO:0015248) |
| 0.0 | 1.8 | GO:0016776 | phosphotransferase activity, phosphate group as acceptor(GO:0016776) |
| 0.0 | 0.6 | GO:0005149 | interleukin-1 receptor binding(GO:0005149) |
| 0.0 | 0.3 | GO:0016861 | intramolecular oxidoreductase activity, interconverting aldoses and ketoses(GO:0016861) |
| 0.0 | 1.3 | GO:0050681 | androgen receptor binding(GO:0050681) |
| 0.0 | 0.1 | GO:0005105 | type 1 fibroblast growth factor receptor binding(GO:0005105) |
| 0.0 | 0.3 | GO:0051378 | serotonin binding(GO:0051378) |
| 0.0 | 2.6 | GO:0051082 | unfolded protein binding(GO:0051082) |
| 0.0 | 1.2 | GO:0005246 | calcium channel regulator activity(GO:0005246) |
| 0.0 | 7.7 | GO:0008017 | microtubule binding(GO:0008017) |
| 0.0 | 2.2 | GO:0002039 | p53 binding(GO:0002039) |
| 0.0 | 0.6 | GO:0004298 | threonine-type endopeptidase activity(GO:0004298) threonine-type peptidase activity(GO:0070003) |
| 0.0 | 0.3 | GO:0023026 | MHC class II protein complex binding(GO:0023026) |
| 0.0 | 0.5 | GO:0022829 | wide pore channel activity(GO:0022829) |
| 0.0 | 0.6 | GO:0070064 | proline-rich region binding(GO:0070064) |
| 0.0 | 0.8 | GO:0005549 | odorant binding(GO:0005549) |
| 0.0 | 0.3 | GO:0005528 | macrolide binding(GO:0005527) FK506 binding(GO:0005528) |
| 0.0 | 0.8 | GO:0003785 | actin monomer binding(GO:0003785) |
| 0.0 | 0.2 | GO:0086080 | protein binding involved in heterotypic cell-cell adhesion(GO:0086080) |
| 0.0 | 0.4 | GO:0004198 | calcium-dependent cysteine-type endopeptidase activity(GO:0004198) |
| 0.0 | 0.1 | GO:0005166 | neurotrophin p75 receptor binding(GO:0005166) |
| 0.0 | 0.5 | GO:0071837 | HMG box domain binding(GO:0071837) |
| 0.0 | 0.1 | GO:0098639 | collagen binding involved in cell-matrix adhesion(GO:0098639) |
Gene overrepresentation in curated gene sets: canonical pathways category:
| Log-likelihood per target | Total log-likelihood | Term | Description |
|---|---|---|---|
| 0.2 | 15.3 | PID ER NONGENOMIC PATHWAY | Plasma membrane estrogen receptor signaling |
| 0.2 | 12.6 | PID TAP63 PATHWAY | Validated transcriptional targets of TAp63 isoforms |
| 0.1 | 8.7 | PID CASPASE PATHWAY | Caspase cascade in apoptosis |
| 0.1 | 5.3 | PID ERBB4 PATHWAY | ErbB4 signaling events |
| 0.1 | 4.3 | ST MYOCYTE AD PATHWAY | Myocyte Adrenergic Pathway is a specific case of the generalized Adrenergic Pathway. |
| 0.1 | 4.4 | PID HNF3A PATHWAY | FOXA1 transcription factor network |
| 0.1 | 4.8 | PID LYSOPHOSPHOLIPID PATHWAY | LPA receptor mediated events |
| 0.1 | 3.2 | PID IL12 STAT4 PATHWAY | IL12 signaling mediated by STAT4 |
| 0.1 | 4.4 | PID SHP2 PATHWAY | SHP2 signaling |
| 0.1 | 1.2 | ST G ALPHA I PATHWAY | G alpha i Pathway |
| 0.1 | 1.6 | PID HIF1A PATHWAY | Hypoxic and oxygen homeostasis regulation of HIF-1-alpha |
| 0.1 | 6.3 | PID BETA CATENIN NUC PATHWAY | Regulation of nuclear beta catenin signaling and target gene transcription |
| 0.1 | 1.5 | PID RET PATHWAY | Signaling events regulated by Ret tyrosine kinase |
| 0.1 | 3.9 | PID P73PATHWAY | p73 transcription factor network |
| 0.1 | 2.1 | NABA PROTEOGLYCANS | Genes encoding proteoglycans |
| 0.0 | 1.0 | PID ENDOTHELIN PATHWAY | Endothelins |
| 0.0 | 0.7 | PID IL2 STAT5 PATHWAY | IL2 signaling events mediated by STAT5 |
| 0.0 | 1.5 | PID RAC1 REG PATHWAY | Regulation of RAC1 activity |
| 0.0 | 2.5 | PID RHOA REG PATHWAY | Regulation of RhoA activity |
| 0.0 | 0.7 | PID EPHA FWDPATHWAY | EPHA forward signaling |
| 0.0 | 0.8 | PID PTP1B PATHWAY | Signaling events mediated by PTP1B |
| 0.0 | 1.5 | PID HNF3B PATHWAY | FOXA2 and FOXA3 transcription factor networks |
| 0.0 | 0.7 | PID NCADHERIN PATHWAY | N-cadherin signaling events |
| 0.0 | 0.8 | PID ECADHERIN STABILIZATION PATHWAY | Stabilization and expansion of the E-cadherin adherens junction |
| 0.0 | 0.5 | PID FOXM1 PATHWAY | FOXM1 transcription factor network |
| 0.0 | 0.5 | PID CERAMIDE PATHWAY | Ceramide signaling pathway |
| 0.0 | 0.8 | PID HIF1 TFPATHWAY | HIF-1-alpha transcription factor network |
Gene overrepresentation in curated gene sets: REACTOME pathways category:
| Log-likelihood per target | Total log-likelihood | Term | Description |
|---|---|---|---|
| 0.4 | 7.7 | REACTOME HDL MEDIATED LIPID TRANSPORT | Genes involved in HDL-mediated lipid transport |
| 0.3 | 3.2 | REACTOME TRANSLOCATION OF ZAP 70 TO IMMUNOLOGICAL SYNAPSE | Genes involved in Translocation of ZAP-70 to Immunological synapse |
| 0.3 | 8.7 | REACTOME CASPASE MEDIATED CLEAVAGE OF CYTOSKELETAL PROTEINS | Genes involved in Caspase-mediated cleavage of cytoskeletal proteins |
| 0.3 | 5.3 | REACTOME PROLACTIN RECEPTOR SIGNALING | Genes involved in Prolactin receptor signaling |
| 0.2 | 2.1 | REACTOME REGULATION OF COMPLEMENT CASCADE | Genes involved in Regulation of Complement cascade |
| 0.2 | 2.3 | REACTOME EICOSANOID LIGAND BINDING RECEPTORS | Genes involved in Eicosanoid ligand-binding receptors |
| 0.1 | 4.5 | REACTOME AMINE LIGAND BINDING RECEPTORS | Genes involved in Amine ligand-binding receptors |
| 0.1 | 2.4 | REACTOME ALPHA LINOLENIC ACID ALA METABOLISM | Genes involved in alpha-linolenic acid (ALA) metabolism |
| 0.1 | 3.9 | REACTOME GLUCONEOGENESIS | Genes involved in Gluconeogenesis |
| 0.1 | 1.5 | REACTOME IONOTROPIC ACTIVITY OF KAINATE RECEPTORS | Genes involved in Ionotropic activity of Kainate Receptors |
| 0.1 | 2.7 | REACTOME NUCLEAR SIGNALING BY ERBB4 | Genes involved in Nuclear signaling by ERBB4 |
| 0.1 | 2.1 | REACTOME DCC MEDIATED ATTRACTIVE SIGNALING | Genes involved in DCC mediated attractive signaling |
| 0.1 | 1.8 | REACTOME CHOLESTEROL BIOSYNTHESIS | Genes involved in Cholesterol biosynthesis |
| 0.1 | 1.1 | REACTOME NA CL DEPENDENT NEUROTRANSMITTER TRANSPORTERS | Genes involved in Na+/Cl- dependent neurotransmitter transporters |
| 0.1 | 2.9 | REACTOME ACTIVATION OF CHAPERONE GENES BY XBP1S | Genes involved in Activation of Chaperone Genes by XBP1(S) |
| 0.1 | 1.4 | REACTOME GABA SYNTHESIS RELEASE REUPTAKE AND DEGRADATION | Genes involved in GABA synthesis, release, reuptake and degradation |
| 0.1 | 0.6 | REACTOME GLYCOLYSIS | Genes involved in Glycolysis |
| 0.0 | 1.8 | REACTOME PROSTACYCLIN SIGNALLING THROUGH PROSTACYCLIN RECEPTOR | Genes involved in Prostacyclin signalling through prostacyclin receptor |
| 0.0 | 1.0 | REACTOME INTRINSIC PATHWAY | Genes involved in Intrinsic Pathway |
| 0.0 | 1.1 | REACTOME INSULIN RECEPTOR RECYCLING | Genes involved in Insulin receptor recycling |
| 0.0 | 1.4 | REACTOME CGMP EFFECTS | Genes involved in cGMP effects |
| 0.0 | 1.2 | REACTOME G ALPHA Z SIGNALLING EVENTS | Genes involved in G alpha (z) signalling events |
| 0.0 | 0.5 | REACTOME TRAFFICKING OF GLUR2 CONTAINING AMPA RECEPTORS | Genes involved in Trafficking of GluR2-containing AMPA receptors |
| 0.0 | 1.0 | REACTOME SPHINGOLIPID DE NOVO BIOSYNTHESIS | Genes involved in Sphingolipid de novo biosynthesis |
| 0.0 | 0.2 | REACTOME ENDOGENOUS STEROLS | Genes involved in Endogenous sterols |
| 0.0 | 1.0 | REACTOME CROSS PRESENTATION OF SOLUBLE EXOGENOUS ANTIGENS ENDOSOMES | Genes involved in Cross-presentation of soluble exogenous antigens (endosomes) |
| 0.0 | 0.4 | REACTOME GLUCOSE TRANSPORT | Genes involved in Glucose transport |
| 0.0 | 3.1 | REACTOME METABOLISM OF AMINO ACIDS AND DERIVATIVES | Genes involved in Metabolism of amino acids and derivatives |
| 0.0 | 0.3 | REACTOME NEPHRIN INTERACTIONS | Genes involved in Nephrin interactions |
| 0.0 | 0.4 | REACTOME RNA POL III TRANSCRIPTION INITIATION FROM TYPE 3 PROMOTER | Genes involved in RNA Polymerase III Transcription Initiation From Type 3 Promoter |
| 0.0 | 0.9 | REACTOME RESPIRATORY ELECTRON TRANSPORT | Genes involved in Respiratory electron transport |
| 0.0 | 2.1 | REACTOME NGF SIGNALLING VIA TRKA FROM THE PLASMA MEMBRANE | Genes involved in NGF signalling via TRKA from the plasma membrane |
| 0.0 | 0.4 | REACTOME LIGAND GATED ION CHANNEL TRANSPORT | Genes involved in Ligand-gated ion channel transport |
| 0.0 | 0.3 | REACTOME N GLYCAN ANTENNAE ELONGATION | Genes involved in N-Glycan antennae elongation |