Project
avrg: GSE58827: Dynamics of the Mouse Liver
Navigation
Downloads
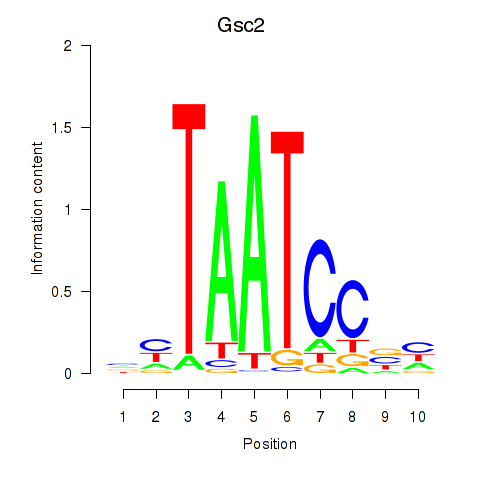
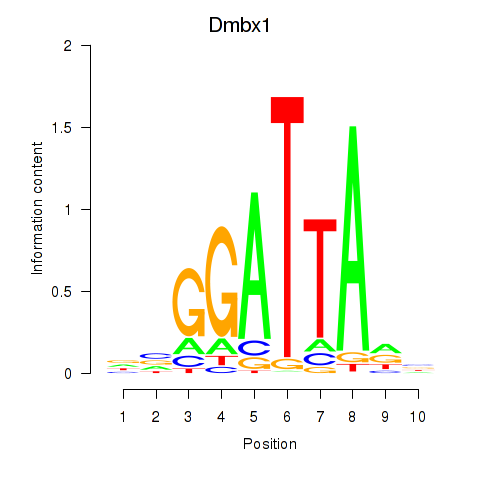
Results for Gsc2_Dmbx1
Z-value: 1.06
Motif logo
Transcription factors associated with Gsc2_Dmbx1
| Gene Symbol | Gene ID | Gene Info |
|---|---|---|
|
Gsc2
|
ENSMUSG00000022738.6 | goosecoid homebox 2 |
|
Dmbx1
|
ENSMUSG00000028707.9 | diencephalon/mesencephalon homeobox 1 |
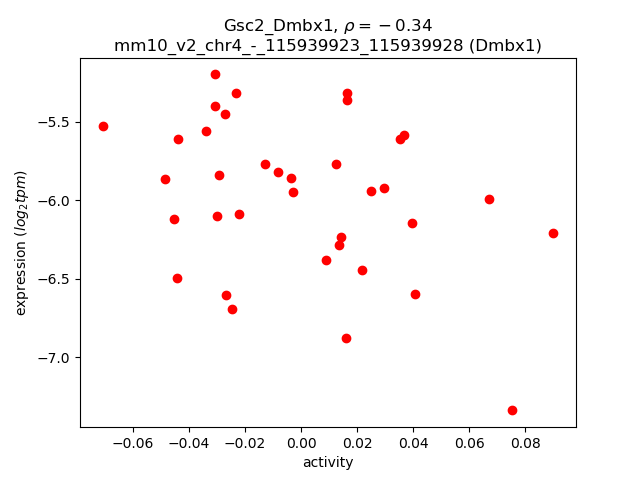
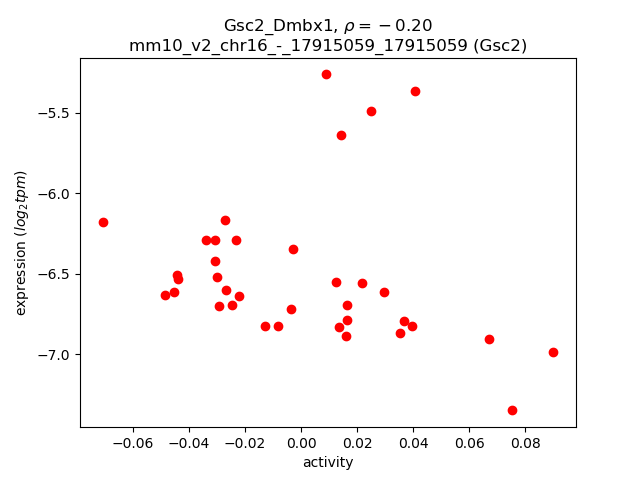
Activity-expression correlation:
| Gene | Promoter | Pearson corr. coef. | P-value | Plot |
|---|---|---|---|---|
| Dmbx1 | mm10_v2_chr4_-_115939923_115939928 | -0.34 | 4.4e-02 | Click! |
| Gsc2 | mm10_v2_chr16_-_17915059_17915059 | -0.20 | 2.5e-01 | Click! |
Activity profile of Gsc2_Dmbx1 motif
Sorted Z-values of Gsc2_Dmbx1 motif
| Promoter | Log-likelihood | Transcript | Gene | Gene Info |
|---|---|---|---|---|
| chr14_+_37054818 | 5.65 |
ENSMUST00000120052.1
|
Lrit1
|
leucine-rich repeat, immunoglobulin-like and transmembrane domains 1 |
| chr14_+_37068042 | 5.35 |
ENSMUST00000057176.3
|
Lrit2
|
leucine-rich repeat, immunoglobulin-like and transmembrane domains 2 |
| chr2_-_24049389 | 4.44 |
ENSMUST00000051416.5
|
Hnmt
|
histamine N-methyltransferase |
| chr2_+_102658640 | 3.96 |
ENSMUST00000080210.3
|
Slc1a2
|
solute carrier family 1 (glial high affinity glutamate transporter), member 2 |
| chr2_+_102659213 | 3.88 |
ENSMUST00000111213.1
|
Slc1a2
|
solute carrier family 1 (glial high affinity glutamate transporter), member 2 |
| chr16_-_46010212 | 2.85 |
ENSMUST00000130481.1
|
Plcxd2
|
phosphatidylinositol-specific phospholipase C, X domain containing 2 |
| chr6_+_3993776 | 2.80 |
ENSMUST00000031673.5
|
Gngt1
|
guanine nucleotide binding protein (G protein), gamma transducing activity polypeptide 1 |
| chr7_-_15879844 | 2.51 |
ENSMUST00000172758.1
ENSMUST00000044434.6 |
Crx
|
cone-rod homeobox containing gene |
| chr14_-_118052235 | 2.43 |
ENSMUST00000022725.2
|
Dct
|
dopachrome tautomerase |
| chr7_+_43712505 | 2.33 |
ENSMUST00000066834.6
|
Klk13
|
kallikrein related-peptidase 13 |
| chr14_+_29018205 | 2.03 |
ENSMUST00000055662.2
|
Lrtm1
|
leucine-rich repeats and transmembrane domains 1 |
| chr7_+_13398115 | 1.81 |
ENSMUST00000005791.7
|
Cabp5
|
calcium binding protein 5 |
| chr6_-_29380426 | 1.78 |
ENSMUST00000147483.2
|
Opn1sw
|
opsin 1 (cone pigments), short-wave-sensitive (color blindness, tritan) |
| chr15_-_101892916 | 1.72 |
ENSMUST00000100179.1
|
Krt76
|
keratin 76 |
| chr4_-_59960659 | 1.68 |
ENSMUST00000075973.2
|
Mup4
|
major urinary protein 4 |
| chr14_-_31640878 | 1.65 |
ENSMUST00000167066.1
ENSMUST00000127204.2 ENSMUST00000022437.8 |
Hacl1
|
2-hydroxyacyl-CoA lyase 1 |
| chr6_-_29380513 | 1.63 |
ENSMUST00000080428.6
|
Opn1sw
|
opsin 1 (cone pigments), short-wave-sensitive (color blindness, tritan) |
| chr16_-_17915059 | 1.59 |
ENSMUST00000012279.4
|
Gsc2
|
goosecoid homebox 2 |
| chr5_-_87140318 | 1.51 |
ENSMUST00000067790.6
ENSMUST00000113327.1 |
Ugt2b5
|
UDP glucuronosyltransferase 2 family, polypeptide B5 |
| chr9_+_50617516 | 1.42 |
ENSMUST00000141366.1
|
Pih1d2
|
PIH1 domain containing 2 |
| chr8_+_13405080 | 1.34 |
ENSMUST00000033827.7
|
Grk1
|
G protein-coupled receptor kinase 1 |
| chr7_-_80403315 | 1.29 |
ENSMUST00000147150.1
|
Furin
|
furin (paired basic amino acid cleaving enzyme) |
| chr6_+_136954521 | 1.15 |
ENSMUST00000137768.1
|
Pde6h
|
phosphodiesterase 6H, cGMP-specific, cone, gamma |
| chr11_-_43901187 | 1.13 |
ENSMUST00000067258.2
ENSMUST00000139906.1 |
Adra1b
|
adrenergic receptor, alpha 1b |
| chr11_+_4031770 | 1.10 |
ENSMUST00000019512.7
|
Sec14l4
|
SEC14-like 4 (S. cerevisiae) |
| chrM_+_8600 | 1.05 |
ENSMUST00000082409.1
|
mt-Co3
|
mitochondrially encoded cytochrome c oxidase III |
| chr11_-_68973840 | 0.99 |
ENSMUST00000038644.4
|
Rangrf
|
RAN guanine nucleotide release factor |
| chr8_-_95306585 | 0.92 |
ENSMUST00000119870.2
ENSMUST00000093268.4 |
Cngb1
|
cyclic nucleotide gated channel beta 1 |
| chr7_-_25398697 | 0.90 |
ENSMUST00000105177.2
ENSMUST00000149349.1 |
Lipe
|
lipase, hormone sensitive |
| chr2_+_91259822 | 0.85 |
ENSMUST00000138470.1
|
Pacsin3
|
protein kinase C and casein kinase substrate in neurons 3 |
| chrX_+_74424632 | 0.84 |
ENSMUST00000114129.2
ENSMUST00000132749.1 |
Ikbkg
|
inhibitor of kappaB kinase gamma |
| chr11_-_99285260 | 0.84 |
ENSMUST00000017255.3
|
Krt24
|
keratin 24 |
| chr11_+_70459940 | 0.83 |
ENSMUST00000147289.1
ENSMUST00000126105.1 |
Zmynd15
|
zinc finger, MYND-type containing 15 |
| chr19_-_12765447 | 0.82 |
ENSMUST00000112933.1
|
Cntf
|
ciliary neurotrophic factor |
| chr10_-_22149270 | 0.80 |
ENSMUST00000179054.1
ENSMUST00000069372.6 |
E030030I06Rik
|
RIKEN cDNA E030030I06 gene |
| chrX_+_160768013 | 0.78 |
ENSMUST00000033650.7
|
Rs1
|
retinoschisis (X-linked, juvenile) 1 (human) |
| chrX_+_160768179 | 0.75 |
ENSMUST00000112368.2
|
Rs1
|
retinoschisis (X-linked, juvenile) 1 (human) |
| chr7_-_19280032 | 0.74 |
ENSMUST00000032560.4
|
Ppm1n
|
protein phosphatase, Mg2+/Mn2+ dependent, 1N (putative) |
| chr2_+_121456963 | 0.74 |
ENSMUST00000126764.1
|
Hypk
|
huntingtin interacting protein K |
| chr9_-_50746501 | 0.71 |
ENSMUST00000034564.1
|
2310030G06Rik
|
RIKEN cDNA 2310030G06 gene |
| chr1_-_44218952 | 0.70 |
ENSMUST00000054801.3
|
Mettl21e
|
methyltransferase like 21E |
| chr8_+_78509319 | 0.65 |
ENSMUST00000034111.8
|
Slc10a7
|
solute carrier family 10 (sodium/bile acid cotransporter family), member 7 |
| chr2_+_105092018 | 0.65 |
ENSMUST00000111107.1
|
Gm11060
|
predicted gene 11060 |
| chr11_+_5099406 | 0.63 |
ENSMUST00000134267.1
ENSMUST00000036320.5 ENSMUST00000150632.1 |
Rhbdd3
|
rhomboid domain containing 3 |
| chr2_+_86297817 | 0.63 |
ENSMUST00000054746.2
|
Olfr1052
|
olfactory receptor 1052 |
| chrM_+_7759 | 0.63 |
ENSMUST00000082407.1
ENSMUST00000082408.1 |
mt-Atp8
mt-Atp6
|
mitochondrially encoded ATP synthase 8 mitochondrially encoded ATP synthase 6 |
| chrX_+_38600626 | 0.62 |
ENSMUST00000000365.2
|
Mcts1
|
malignant T cell amplified sequence 1 |
| chr14_+_64588112 | 0.62 |
ENSMUST00000181808.1
|
A930011O12Rik
|
RIKEN cDNA A930011O12 gene |
| chr18_-_3299452 | 0.60 |
ENSMUST00000126578.1
|
Crem
|
cAMP responsive element modulator |
| chr9_+_99470440 | 0.60 |
ENSMUST00000056103.4
|
1600029I14Rik
|
RIKEN cDNA 1600029I14 gene |
| chr11_+_5099608 | 0.59 |
ENSMUST00000139742.1
|
Rhbdd3
|
rhomboid domain containing 3 |
| chr18_-_20059478 | 0.56 |
ENSMUST00000075214.2
ENSMUST00000039247.4 |
Dsc2
|
desmocollin 2 |
| chr15_+_4375462 | 0.54 |
ENSMUST00000061925.4
|
Plcxd3
|
phosphatidylinositol-specific phospholipase C, X domain containing 3 |
| chr6_-_124840192 | 0.54 |
ENSMUST00000024206.5
|
Gnb3
|
guanine nucleotide binding protein (G protein), beta 3 |
| chr19_+_26605106 | 0.52 |
ENSMUST00000025862.7
ENSMUST00000176030.1 |
Smarca2
|
SWI/SNF related, matrix associated, actin dependent regulator of chromatin, subfamily a, member 2 |
| chr2_+_164562579 | 0.52 |
ENSMUST00000017867.3
ENSMUST00000109344.2 ENSMUST00000109345.2 |
Wfdc2
|
WAP four-disulfide core domain 2 |
| chrX_+_7728439 | 0.51 |
ENSMUST00000033489.7
|
Praf2
|
PRA1 domain family 2 |
| chr11_-_70459957 | 0.50 |
ENSMUST00000019064.2
|
Cxcl16
|
chemokine (C-X-C motif) ligand 16 |
| chr7_-_127725616 | 0.49 |
ENSMUST00000076091.2
|
Ctf2
|
cardiotrophin 2 |
| chr19_+_4139799 | 0.48 |
ENSMUST00000096338.3
|
Gpr152
|
G protein-coupled receptor 152 |
| chr11_+_19924354 | 0.47 |
ENSMUST00000093299.6
|
Spred2
|
sprouty-related, EVH1 domain containing 2 |
| chr1_-_168431695 | 0.47 |
ENSMUST00000176790.1
|
Pbx1
|
pre B cell leukemia homeobox 1 |
| chr6_+_90269106 | 0.47 |
ENSMUST00000058039.2
|
Vmn1r54
|
vomeronasal 1 receptor 54 |
| chr8_-_106136890 | 0.46 |
ENSMUST00000115979.2
|
Esrp2
|
epithelial splicing regulatory protein 2 |
| chr11_+_109649376 | 0.45 |
ENSMUST00000106677.1
|
Prkar1a
|
protein kinase, cAMP dependent regulatory, type I, alpha |
| chr2_+_23068168 | 0.45 |
ENSMUST00000028121.7
ENSMUST00000114523.2 ENSMUST00000144088.1 |
Acbd5
|
acyl-Coenzyme A binding domain containing 5 |
| chrX_-_43167817 | 0.42 |
ENSMUST00000115058.1
ENSMUST00000115059.1 |
Tenm1
|
teneurin transmembrane protein 1 |
| chr4_+_136622612 | 0.42 |
ENSMUST00000178843.1
|
Lactbl1
|
lactamase, beta-like 1 |
| chr3_-_88461182 | 0.42 |
ENSMUST00000166237.1
|
Sema4a
|
sema domain, immunoglobulin domain (Ig), transmembrane domain (TM) and short cytoplasmic domain, (semaphorin) 4A |
| chr6_-_59426279 | 0.40 |
ENSMUST00000051065.4
|
Gprin3
|
GPRIN family member 3 |
| chr3_-_144849301 | 0.40 |
ENSMUST00000159989.1
|
Clca4
|
chloride channel calcium activated 4 |
| chr5_-_96161990 | 0.39 |
ENSMUST00000155901.1
|
Cnot6l
|
CCR4-NOT transcription complex, subunit 6-like |
| chr11_-_70619194 | 0.39 |
ENSMUST00000102556.3
ENSMUST00000014753.8 |
Chrne
|
cholinergic receptor, nicotinic, epsilon polypeptide |
| chr2_-_51973219 | 0.38 |
ENSMUST00000028314.2
|
Nmi
|
N-myc (and STAT) interactor |
| chrX_+_48623737 | 0.38 |
ENSMUST00000114936.1
|
Slc25a14
|
solute carrier family 25 (mitochondrial carrier, brain), member 14 |
| chr11_+_78322965 | 0.38 |
ENSMUST00000017534.8
|
Aldoc
|
aldolase C, fructose-bisphosphate |
| chr14_-_54617993 | 0.38 |
ENSMUST00000022803.4
|
Psmb5
|
proteasome (prosome, macropain) subunit, beta type 5 |
| chr8_-_106136792 | 0.38 |
ENSMUST00000146940.1
|
Esrp2
|
epithelial splicing regulatory protein 2 |
| chr7_+_126976338 | 0.35 |
ENSMUST00000032920.3
|
Cdipt
|
CDP-diacylglycerol--inositol 3-phosphatidyltransferase (phosphatidylinositol synthase) |
| chr5_-_134456702 | 0.34 |
ENSMUST00000073161.5
ENSMUST00000171794.2 ENSMUST00000111245.2 ENSMUST00000100654.3 ENSMUST00000167084.2 ENSMUST00000100652.3 ENSMUST00000100650.3 ENSMUST00000074114.5 |
Gtf2ird1
|
general transcription factor II I repeat domain-containing 1 |
| chr13_-_64497792 | 0.34 |
ENSMUST00000180282.1
|
1190003K10Rik
|
RIKEN cDNA 1190003K10 gene |
| chr2_-_30093642 | 0.34 |
ENSMUST00000102865.4
|
Zdhhc12
|
zinc finger, DHHC domain containing 12 |
| chr7_-_107625161 | 0.34 |
ENSMUST00000060348.2
|
5330417H12Rik
|
RIKEN cDNA 5330417H12 gene |
| chr4_+_80834123 | 0.33 |
ENSMUST00000133655.1
ENSMUST00000006151.6 |
Tyrp1
|
tyrosinase-related protein 1 |
| chrX_+_74424534 | 0.32 |
ENSMUST00000135165.1
ENSMUST00000114128.1 ENSMUST00000114133.2 ENSMUST00000004330.3 |
Ikbkg
|
inhibitor of kappaB kinase gamma |
| chr1_+_177444653 | 0.32 |
ENSMUST00000094276.3
|
Zbtb18
|
zinc finger and BTB domain containing 18 |
| chr7_-_4514609 | 0.31 |
ENSMUST00000166959.1
|
Tnnt1
|
troponin T1, skeletal, slow |
| chr2_-_51972990 | 0.31 |
ENSMUST00000145481.1
ENSMUST00000112705.2 |
Nmi
|
N-myc (and STAT) interactor |
| chr5_+_3344194 | 0.31 |
ENSMUST00000042410.4
|
Cdk6
|
cyclin-dependent kinase 6 |
| chr7_-_4514558 | 0.31 |
ENSMUST00000163538.1
|
Tnnt1
|
troponin T1, skeletal, slow |
| chr11_-_59187738 | 0.30 |
ENSMUST00000170895.2
|
Guk1
|
guanylate kinase 1 |
| chr10_+_59403644 | 0.30 |
ENSMUST00000009790.7
|
Pla2g12b
|
phospholipase A2, group XIIB |
| chr3_-_8964037 | 0.29 |
ENSMUST00000091354.5
ENSMUST00000094381.4 |
Tpd52
|
tumor protein D52 |
| chr11_+_113659283 | 0.28 |
ENSMUST00000137878.1
|
Cog1
|
component of oligomeric golgi complex 1 |
| chr2_+_85769803 | 0.27 |
ENSMUST00000065626.2
|
Olfr1013
|
olfactory receptor 1013 |
| chr6_+_119236507 | 0.26 |
ENSMUST00000037434.6
|
Cacna2d4
|
calcium channel, voltage-dependent, alpha 2/delta subunit 4 |
| chr2_-_104257400 | 0.25 |
ENSMUST00000141159.1
|
D430041D05Rik
|
RIKEN cDNA D430041D05 gene |
| chr3_+_103809520 | 0.24 |
ENSMUST00000076599.1
ENSMUST00000106824.1 ENSMUST00000106823.1 ENSMUST00000047285.2 |
Ap4b1
|
adaptor-related protein complex AP-4, beta 1 |
| chr10_+_90576872 | 0.24 |
ENSMUST00000182550.1
ENSMUST00000099364.5 |
Anks1b
|
ankyrin repeat and sterile alpha motif domain containing 1B |
| chr7_+_13398150 | 0.24 |
ENSMUST00000117400.1
|
Cabp5
|
calcium binding protein 5 |
| chr2_-_30093607 | 0.23 |
ENSMUST00000081838.6
|
Zdhhc12
|
zinc finger, DHHC domain containing 12 |
| chr16_-_35490873 | 0.22 |
ENSMUST00000023550.7
|
Pdia5
|
protein disulfide isomerase associated 5 |
| chr14_-_55524938 | 0.22 |
ENSMUST00000178694.1
|
Nrl
|
neural retina leucine zipper gene |
| chrX_+_133908418 | 0.21 |
ENSMUST00000033606.8
ENSMUST00000113303.1 ENSMUST00000165805.1 |
Srpx2
|
sushi-repeat-containing protein, X-linked 2 |
| chr7_-_105752193 | 0.21 |
ENSMUST00000033184.4
|
Tpp1
|
tripeptidyl peptidase I |
| chr14_-_55524975 | 0.21 |
ENSMUST00000062232.7
|
Nrl
|
neural retina leucine zipper gene |
| chr11_+_4186789 | 0.19 |
ENSMUST00000041042.6
ENSMUST00000180088.1 |
Tbc1d10a
|
TBC1 domain family, member 10a |
| chr2_+_67445994 | 0.19 |
ENSMUST00000112347.1
ENSMUST00000028410.3 |
Xirp2
|
xin actin-binding repeat containing 2 |
| chr4_+_80834298 | 0.19 |
ENSMUST00000102831.1
|
Tyrp1
|
tyrosinase-related protein 1 |
| chr5_+_3343893 | 0.19 |
ENSMUST00000165117.1
|
Cdk6
|
cyclin-dependent kinase 6 |
| chr2_+_101624696 | 0.19 |
ENSMUST00000044031.3
|
Rag2
|
recombination activating gene 2 |
| chr17_-_71752867 | 0.18 |
ENSMUST00000057405.7
|
BC027072
|
cDNA sequence BC027072 |
| chr13_-_21783391 | 0.17 |
ENSMUST00000099704.3
|
Hist1h3i
|
histone cluster 1, H3i |
| chr4_-_139833524 | 0.17 |
ENSMUST00000030508.7
|
Pax7
|
paired box gene 7 |
| chr11_-_90687572 | 0.17 |
ENSMUST00000107869.2
ENSMUST00000154599.1 ENSMUST00000107868.1 ENSMUST00000020849.2 |
Tom1l1
|
target of myb1-like 1 (chicken) |
| chr4_+_102589687 | 0.17 |
ENSMUST00000097949.4
ENSMUST00000106901.1 |
Pde4b
|
phosphodiesterase 4B, cAMP specific |
| chrX_+_57089312 | 0.17 |
ENSMUST00000114745.2
ENSMUST00000114746.1 |
Vgll1
|
vestigial like 1 homolog (Drosophila) |
| chr1_-_92473801 | 0.16 |
ENSMUST00000027478.6
|
Ndufa10
|
NADH dehydrogenase (ubiquinone) 1 alpha subcomplex 10 |
| chr17_+_46910452 | 0.15 |
ENSMUST00000024773.5
|
Prph2
|
peripherin 2 |
| chr11_-_69237022 | 0.15 |
ENSMUST00000021259.2
ENSMUST00000108665.1 ENSMUST00000108664.1 |
Gucy2e
|
guanylate cyclase 2e |
| chr5_+_77265454 | 0.15 |
ENSMUST00000080359.5
|
Rest
|
RE1-silencing transcription factor |
| chr13_-_116309639 | 0.13 |
ENSMUST00000036060.6
|
Isl1
|
ISL1 transcription factor, LIM/homeodomain |
| chr1_-_110977366 | 0.13 |
ENSMUST00000094626.3
|
Cdh19
|
cadherin 19, type 2 |
| chr16_-_76403673 | 0.11 |
ENSMUST00000052867.7
|
Gm9843
|
predicted gene 9843 |
| chr13_+_23752267 | 0.11 |
ENSMUST00000091703.2
|
Hist1h3b
|
histone cluster 1, H3b |
| chr6_-_142322941 | 0.10 |
ENSMUST00000128446.1
|
Slco1a5
|
solute carrier organic anion transporter family, member 1a5 |
| chr10_+_21993890 | 0.10 |
ENSMUST00000092673.4
|
Sgk1
|
serum/glucocorticoid regulated kinase 1 |
| chr11_+_67695314 | 0.10 |
ENSMUST00000021290.1
|
Rcvrn
|
recoverin |
| chr18_-_75697639 | 0.10 |
ENSMUST00000165559.1
|
Ctif
|
CBP80/20-dependent translation initiation factor |
| chr19_+_36083696 | 0.10 |
ENSMUST00000025714.7
|
Rpp30
|
ribonuclease P/MRP 30 subunit |
| chr10_+_18407658 | 0.09 |
ENSMUST00000037341.7
|
Nhsl1
|
NHS-like 1 |
| chr10_+_80292453 | 0.08 |
ENSMUST00000068408.7
ENSMUST00000062674.6 |
Rps15
|
ribosomal protein S15 |
| chr3_-_145099024 | 0.07 |
ENSMUST00000040465.6
|
Clca5
|
chloride channel calcium activated 5 |
| chr7_-_109493627 | 0.07 |
ENSMUST00000106739.1
|
Trim66
|
tripartite motif-containing 66 |
| chr19_+_43752996 | 0.06 |
ENSMUST00000026199.7
ENSMUST00000112047.3 ENSMUST00000153295.1 |
Cutc
|
cutC copper transporter homolog (E.coli) |
| chr19_+_12883855 | 0.05 |
ENSMUST00000049624.2
|
Olfr1445
|
olfactory receptor 1445 |
| chr11_+_23256566 | 0.03 |
ENSMUST00000136235.1
|
Xpo1
|
exportin 1, CRM1 homolog (yeast) |
| chr7_-_98656530 | 0.03 |
ENSMUST00000038359.4
|
2210018M11Rik
|
RIKEN cDNA 2210018M11 gene |
| chr7_+_101969796 | 0.03 |
ENSMUST00000084852.5
|
Numa1
|
nuclear mitotic apparatus protein 1 |
| chr7_+_64153916 | 0.02 |
ENSMUST00000107527.2
|
Trpm1
|
transient receptor potential cation channel, subfamily M, member 1 |
| chr4_+_19280850 | 0.02 |
ENSMUST00000102999.1
|
Cngb3
|
cyclic nucleotide gated channel beta 3 |
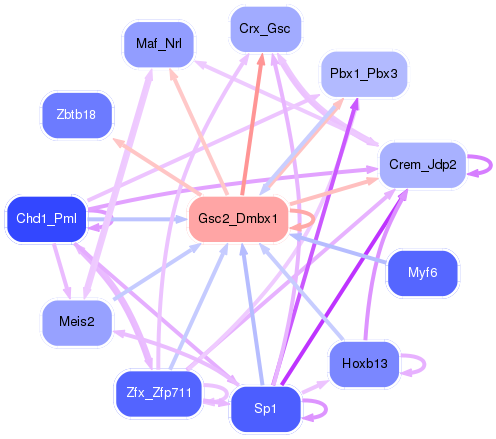
Network of associatons between targets according to the STRING database.

First level regulatory network of Gsc2_Dmbx1
Gene Ontology Analysis
Gene overrepresentation in biological process category:
| Log-likelihood per target | Total log-likelihood | Term | Description |
|---|---|---|---|
| 1.1 | 7.8 | GO:0070779 | D-aspartate transport(GO:0070777) D-aspartate import(GO:0070779) |
| 1.0 | 3.0 | GO:0006583 | melanin biosynthetic process from tyrosine(GO:0006583) |
| 0.9 | 4.4 | GO:0001692 | histamine metabolic process(GO:0001692) |
| 0.4 | 1.3 | GO:0060060 | post-embryonic retina morphogenesis in camera-type eye(GO:0060060) |
| 0.4 | 1.5 | GO:0016062 | adaptation of rhodopsin mediated signaling(GO:0016062) light adaption(GO:0036367) |
| 0.4 | 1.1 | GO:0001982 | baroreceptor response to decreased systemic arterial blood pressure(GO:0001982) |
| 0.3 | 1.3 | GO:0090472 | dibasic protein processing(GO:0090472) |
| 0.3 | 3.4 | GO:0018298 | protein-chromophore linkage(GO:0018298) |
| 0.3 | 1.6 | GO:0001561 | fatty acid alpha-oxidation(GO:0001561) |
| 0.2 | 0.7 | GO:1902524 | positive regulation of protein K48-linked ubiquitination(GO:1902524) |
| 0.2 | 0.9 | GO:0046340 | diacylglycerol catabolic process(GO:0046340) |
| 0.2 | 0.8 | GO:0048691 | positive regulation of sprouting of injured axon(GO:0048687) positive regulation of axon extension involved in regeneration(GO:0048691) |
| 0.2 | 0.3 | GO:0046341 | CDP-diacylglycerol metabolic process(GO:0046341) |
| 0.2 | 0.6 | GO:0002188 | translation reinitiation(GO:0002188) |
| 0.1 | 3.7 | GO:0007602 | phototransduction(GO:0007602) |
| 0.1 | 1.0 | GO:0098909 | bundle of His cell to Purkinje myocyte signaling(GO:0086028) bundle of His cell action potential(GO:0086043) regulation of cardiac muscle cell action potential involved in regulation of contraction(GO:0098909) |
| 0.1 | 1.7 | GO:0048733 | sebaceous gland development(GO:0048733) |
| 0.1 | 0.4 | GO:0045872 | regulation of rhodopsin gene expression(GO:0007468) positive regulation of rhodopsin gene expression(GO:0045872) |
| 0.1 | 1.2 | GO:0032815 | negative regulation of natural killer cell activation(GO:0032815) |
| 0.1 | 0.3 | GO:0046710 | purine deoxyribonucleotide biosynthetic process(GO:0009153) GDP metabolic process(GO:0046710) |
| 0.1 | 0.5 | GO:0031444 | slow-twitch skeletal muscle fiber contraction(GO:0031444) |
| 0.1 | 0.5 | GO:0044838 | cell quiescence(GO:0044838) |
| 0.1 | 0.3 | GO:0014886 | transition between slow and fast fiber(GO:0014886) |
| 0.1 | 0.1 | GO:0071655 | macrophage colony-stimulating factor production(GO:0036301) granulocyte colony-stimulating factor production(GO:0071611) regulation of granulocyte colony-stimulating factor production(GO:0071655) regulation of macrophage colony-stimulating factor production(GO:1901256) |
| 0.1 | 0.5 | GO:0030242 | pexophagy(GO:0030242) |
| 0.1 | 0.5 | GO:0035887 | aortic smooth muscle cell differentiation(GO:0035887) |
| 0.1 | 1.2 | GO:0007250 | activation of NF-kappaB-inducing kinase activity(GO:0007250) |
| 0.1 | 0.6 | GO:0086073 | bundle of His cell-Purkinje myocyte adhesion involved in cell communication(GO:0086073) |
| 0.0 | 0.4 | GO:0010606 | positive regulation of cytoplasmic mRNA processing body assembly(GO:0010606) |
| 0.0 | 0.1 | GO:2000705 | regulation of dense core granule biogenesis(GO:2000705) |
| 0.0 | 0.8 | GO:0051044 | positive regulation of membrane protein ectodomain proteolysis(GO:0051044) |
| 0.0 | 1.1 | GO:0045742 | positive regulation of epidermal growth factor receptor signaling pathway(GO:0045742) positive regulation of ERBB signaling pathway(GO:1901186) |
| 0.0 | 0.5 | GO:0046007 | negative regulation of activated T cell proliferation(GO:0046007) |
| 0.0 | 0.4 | GO:0030388 | fructose 1,6-bisphosphate metabolic process(GO:0030388) |
| 0.0 | 0.5 | GO:0010818 | T cell chemotaxis(GO:0010818) |
| 0.0 | 2.0 | GO:1904893 | negative regulation of JAK-STAT cascade(GO:0046426) negative regulation of STAT cascade(GO:1904893) |
| 0.0 | 0.3 | GO:0000188 | inactivation of MAPK activity(GO:0000188) |
| 0.0 | 0.2 | GO:0014816 | skeletal muscle satellite cell differentiation(GO:0014816) |
| 0.0 | 0.6 | GO:0018345 | protein palmitoylation(GO:0018345) |
| 0.0 | 0.2 | GO:1900383 | regulation of synaptic plasticity by receptor localization to synapse(GO:1900383) |
| 0.0 | 0.8 | GO:0060445 | branching involved in salivary gland morphogenesis(GO:0060445) |
| 0.0 | 0.1 | GO:0097475 | motor neuron migration(GO:0097475) |
| 0.0 | 0.4 | GO:0045063 | T-helper 1 cell differentiation(GO:0045063) |
| 0.0 | 0.2 | GO:0090050 | positive regulation of cell migration involved in sprouting angiogenesis(GO:0090050) |
| 0.0 | 0.5 | GO:0019236 | response to pheromone(GO:0019236) |
| 0.0 | 1.1 | GO:0009060 | aerobic respiration(GO:0009060) |
| 0.0 | 0.2 | GO:1901898 | negative regulation of relaxation of cardiac muscle(GO:1901898) |
| 0.0 | 3.1 | GO:0007623 | circadian rhythm(GO:0007623) |
| 0.0 | 0.4 | GO:0007274 | synaptic transmission, cholinergic(GO:0007271) neuromuscular synaptic transmission(GO:0007274) |
| 0.0 | 3.7 | GO:0016042 | lipid catabolic process(GO:0016042) |
Gene overrepresentation in cellular component category:
| Log-likelihood per target | Total log-likelihood | Term | Description |
|---|---|---|---|
| 0.2 | 0.8 | GO:0097058 | CRLF-CLCF1 complex(GO:0097058) |
| 0.2 | 7.8 | GO:0030673 | axolemma(GO:0030673) |
| 0.1 | 3.0 | GO:0042470 | melanosome(GO:0042470) pigment granule(GO:0048770) |
| 0.1 | 1.2 | GO:0008385 | IkappaB kinase complex(GO:0008385) |
| 0.1 | 7.1 | GO:0001750 | photoreceptor outer segment(GO:0001750) |
| 0.1 | 1.3 | GO:0012510 | trans-Golgi network transport vesicle membrane(GO:0012510) |
| 0.1 | 1.7 | GO:0045095 | keratin filament(GO:0045095) |
| 0.0 | 0.6 | GO:0000276 | mitochondrial proton-transporting ATP synthase complex, coupling factor F(o)(GO:0000276) |
| 0.0 | 5.6 | GO:0030176 | integral component of endoplasmic reticulum membrane(GO:0030176) |
| 0.0 | 0.5 | GO:0005952 | cAMP-dependent protein kinase complex(GO:0005952) |
| 0.0 | 0.5 | GO:0071564 | npBAF complex(GO:0071564) |
| 0.0 | 0.5 | GO:0005861 | troponin complex(GO:0005861) |
| 0.0 | 2.7 | GO:0014704 | intercalated disc(GO:0014704) |
| 0.0 | 0.3 | GO:0017119 | Golgi transport complex(GO:0017119) |
| 0.0 | 0.4 | GO:0030014 | CCR4-NOT complex(GO:0030014) |
| 0.0 | 0.1 | GO:0000172 | ribonuclease MRP complex(GO:0000172) |
| 0.0 | 0.4 | GO:0005839 | proteasome core complex(GO:0005839) |
| 0.0 | 0.7 | GO:0022627 | cytosolic small ribosomal subunit(GO:0022627) |
| 0.0 | 0.8 | GO:0005882 | intermediate filament(GO:0005882) |
| 0.0 | 0.2 | GO:0005892 | acetylcholine-gated channel complex(GO:0005892) |
Gene overrepresentation in molecular function category:
| Log-likelihood per target | Total log-likelihood | Term | Description |
|---|---|---|---|
| 1.3 | 7.8 | GO:0015501 | glutamate:sodium symporter activity(GO:0015501) |
| 0.4 | 3.4 | GO:0008020 | G-protein coupled photoreceptor activity(GO:0008020) |
| 0.4 | 1.2 | GO:1990450 | linear polyubiquitin binding(GO:1990450) |
| 0.3 | 1.3 | GO:0004703 | G-protein coupled receptor kinase activity(GO:0004703) |
| 0.3 | 1.1 | GO:0004937 | alpha1-adrenergic receptor activity(GO:0004937) |
| 0.2 | 2.9 | GO:0043522 | leucine zipper domain binding(GO:0043522) |
| 0.2 | 1.6 | GO:0030976 | thiamine pyrophosphate binding(GO:0030976) |
| 0.2 | 0.9 | GO:0042134 | rRNA primary transcript binding(GO:0042134) |
| 0.2 | 0.5 | GO:0098770 | FBXO family protein binding(GO:0098770) |
| 0.2 | 1.3 | GO:0005127 | ciliary neurotrophic factor receptor binding(GO:0005127) |
| 0.1 | 1.5 | GO:0008429 | phosphatidylethanolamine binding(GO:0008429) |
| 0.1 | 2.4 | GO:0016863 | intramolecular oxidoreductase activity, transposing C=C bonds(GO:0016863) |
| 0.1 | 0.5 | GO:0019828 | aspartic-type endopeptidase inhibitor activity(GO:0019828) |
| 0.1 | 0.5 | GO:0016716 | oxidoreductase activity, acting on paired donors, with incorporation or reduction of molecular oxygen, another compound as one donor, and incorporation of one atom of oxygen(GO:0016716) |
| 0.1 | 1.3 | GO:0048406 | nerve growth factor binding(GO:0048406) |
| 0.1 | 0.5 | GO:0016503 | pheromone receptor activity(GO:0016503) |
| 0.1 | 0.5 | GO:0031014 | troponin T binding(GO:0031014) |
| 0.1 | 0.8 | GO:0019855 | calcium channel inhibitor activity(GO:0019855) |
| 0.1 | 1.7 | GO:0005550 | pheromone binding(GO:0005550) |
| 0.1 | 1.1 | GO:0030553 | cGMP binding(GO:0030553) |
| 0.1 | 1.4 | GO:0017160 | Ral GTPase binding(GO:0017160) |
| 0.1 | 0.3 | GO:0005173 | stem cell factor receptor binding(GO:0005173) |
| 0.1 | 0.2 | GO:0008240 | tripeptidyl-peptidase activity(GO:0008240) |
| 0.0 | 0.9 | GO:0043855 | cyclic nucleotide-gated ion channel activity(GO:0043855) |
| 0.0 | 4.4 | GO:0008170 | N-methyltransferase activity(GO:0008170) |
| 0.0 | 0.4 | GO:0004332 | fructose-bisphosphate aldolase activity(GO:0004332) |
| 0.0 | 0.3 | GO:0017169 | CDP-alcohol phosphatidyltransferase activity(GO:0017169) |
| 0.0 | 1.5 | GO:0015020 | glucuronosyltransferase activity(GO:0015020) |
| 0.0 | 0.5 | GO:0008603 | cAMP-dependent protein kinase regulator activity(GO:0008603) |
| 0.0 | 0.5 | GO:0005041 | low-density lipoprotein receptor activity(GO:0005041) |
| 0.0 | 0.9 | GO:0015002 | cytochrome-c oxidase activity(GO:0004129) heme-copper terminal oxidase activity(GO:0015002) oxidoreductase activity, acting on a heme group of donors, oxygen as acceptor(GO:0016676) |
| 0.0 | 3.5 | GO:0008081 | phosphoric diester hydrolase activity(GO:0008081) |
| 0.0 | 0.4 | GO:0042166 | acetylcholine binding(GO:0042166) |
| 0.0 | 1.0 | GO:0008536 | Ran GTPase binding(GO:0008536) |
| 0.0 | 0.4 | GO:0004535 | poly(A)-specific ribonuclease activity(GO:0004535) |
| 0.0 | 0.6 | GO:0019707 | protein-cysteine S-palmitoyltransferase activity(GO:0019706) protein-cysteine S-acyltransferase activity(GO:0019707) |
| 0.0 | 0.4 | GO:0004298 | threonine-type endopeptidase activity(GO:0004298) threonine-type peptidase activity(GO:0070003) |
| 0.0 | 0.2 | GO:0015037 | peptide disulfide oxidoreductase activity(GO:0015037) |
| 0.0 | 0.6 | GO:0005549 | odorant binding(GO:0005549) |
| 0.0 | 2.7 | GO:0004252 | serine-type endopeptidase activity(GO:0004252) |
| 0.0 | 0.6 | GO:0030332 | cyclin binding(GO:0030332) |
| 0.0 | 0.5 | GO:0000062 | fatty-acyl-CoA binding(GO:0000062) |
| 0.0 | 1.5 | GO:0004860 | protein kinase inhibitor activity(GO:0004860) |
| 0.0 | 0.1 | GO:0015349 | thyroid hormone transmembrane transporter activity(GO:0015349) |
| 0.0 | 0.1 | GO:0043423 | 3-phosphoinositide-dependent protein kinase binding(GO:0043423) |
| 0.0 | 0.7 | GO:0030145 | manganese ion binding(GO:0030145) |
Gene overrepresentation in curated gene sets: canonical pathways category:
| Log-likelihood per target | Total log-likelihood | Term | Description |
|---|---|---|---|
| 0.2 | 5.0 | PID RHODOPSIN PATHWAY | Visual signal transduction: Rods |
| 0.1 | 1.7 | PID CONE PATHWAY | Visual signal transduction: Cones |
| 0.0 | 1.2 | PID TOLL ENDOGENOUS PATHWAY | Endogenous TLR signaling |
| 0.0 | 1.3 | PID P75 NTR PATHWAY | p75(NTR)-mediated signaling |
| 0.0 | 0.6 | PID TCR CALCIUM PATHWAY | Calcium signaling in the CD4+ TCR pathway |
| 0.0 | 0.5 | PID INTEGRIN A4B1 PATHWAY | Alpha4 beta1 integrin signaling events |
| 0.0 | 0.5 | PID IL2 STAT5 PATHWAY | IL2 signaling events mediated by STAT5 |
Gene overrepresentation in curated gene sets: REACTOME pathways category:
| Log-likelihood per target | Total log-likelihood | Term | Description |
|---|---|---|---|
| 0.6 | 2.8 | REACTOME OLFACTORY SIGNALING PATHWAY | Genes involved in Olfactory Signaling Pathway |
| 0.4 | 3.4 | REACTOME OPSINS | Genes involved in Opsins |
| 0.1 | 7.8 | REACTOME AMINO ACID AND OLIGOPEPTIDE SLC TRANSPORTERS | Genes involved in Amino acid and oligopeptide SLC transporters |
| 0.1 | 1.3 | REACTOME GAMMA CARBOXYLATION TRANSPORT AND AMINO TERMINAL CLEAVAGE OF PROTEINS | Genes involved in Gamma-carboxylation, transport, and amino-terminal cleavage of proteins |
| 0.1 | 1.2 | REACTOME IKK COMPLEX RECRUITMENT MEDIATED BY RIP1 | Genes involved in IKK complex recruitment mediated by RIP1 |
| 0.0 | 1.6 | REACTOME PEROXISOMAL LIPID METABOLISM | Genes involved in Peroxisomal lipid metabolism |
| 0.0 | 0.9 | REACTOME HORMONE SENSITIVE LIPASE HSL MEDIATED TRIACYLGLYCEROL HYDROLYSIS | Genes involved in Hormone-sensitive lipase (HSL)-mediated triacylglycerol hydrolysis |
| 0.0 | 1.1 | REACTOME AMINE LIGAND BINDING RECEPTORS | Genes involved in Amine ligand-binding receptors |
| 0.0 | 0.4 | REACTOME PRESYNAPTIC NICOTINIC ACETYLCHOLINE RECEPTORS | Genes involved in Presynaptic nicotinic acetylcholine receptors |
| 0.0 | 0.7 | REACTOME INCRETIN SYNTHESIS SECRETION AND INACTIVATION | Genes involved in Incretin Synthesis, Secretion, and Inactivation |
| 0.0 | 0.3 | REACTOME ABACAVIR TRANSPORT AND METABOLISM | Genes involved in Abacavir transport and metabolism |
| 0.0 | 0.5 | REACTOME PKA MEDIATED PHOSPHORYLATION OF CREB | Genes involved in PKA-mediated phosphorylation of CREB |
| 0.0 | 0.4 | REACTOME OTHER SEMAPHORIN INTERACTIONS | Genes involved in Other semaphorin interactions |
| 0.0 | 0.5 | REACTOME CHEMOKINE RECEPTORS BIND CHEMOKINES | Genes involved in Chemokine receptors bind chemokines |
| 0.0 | 0.5 | REACTOME G1 PHASE | Genes involved in G1 Phase |