Project
avrg: GSE58827: Dynamics of the Mouse Liver
Navigation
Downloads
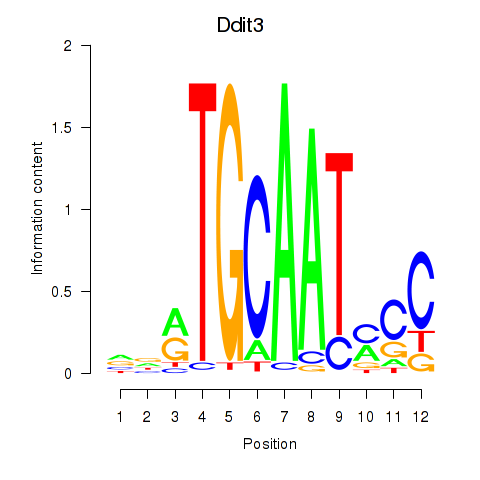
Results for Ddit3
Z-value: 0.91
Motif logo
Transcription factors associated with Ddit3
| Gene Symbol | Gene ID | Gene Info |
|---|---|---|
|
Ddit3
|
ENSMUSG00000025408.9 | DNA-damage inducible transcript 3 |
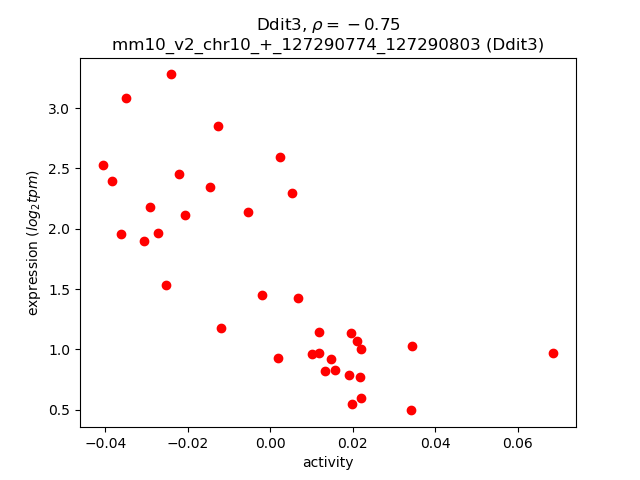
Activity-expression correlation:
| Gene | Promoter | Pearson corr. coef. | P-value | Plot |
|---|---|---|---|---|
| Ddit3 | mm10_v2_chr10_+_127290774_127290803 | -0.75 | 1.2e-07 | Click! |
Activity profile of Ddit3 motif
Sorted Z-values of Ddit3 motif
| Promoter | Log-likelihood | Transcript | Gene | Gene Info |
|---|---|---|---|---|
| chr8_+_105131800 | 4.91 |
ENSMUST00000161289.1
|
Ces4a
|
carboxylesterase 4A |
| chr9_-_48605147 | 4.77 |
ENSMUST00000034808.5
ENSMUST00000119426.1 |
Nnmt
|
nicotinamide N-methyltransferase |
| chr2_+_119351222 | 2.95 |
ENSMUST00000028780.3
|
Chac1
|
ChaC, cation transport regulator 1 |
| chr14_+_65971164 | 1.86 |
ENSMUST00000144619.1
|
Clu
|
clusterin |
| chr9_-_70141484 | 1.85 |
ENSMUST00000034749.8
|
Fam81a
|
family with sequence similarity 81, member A |
| chr19_-_59076069 | 1.63 |
ENSMUST00000047511.7
ENSMUST00000163821.1 |
4930506M07Rik
|
RIKEN cDNA 4930506M07 gene |
| chr14_-_66868572 | 1.58 |
ENSMUST00000022629.8
|
Dpysl2
|
dihydropyrimidinase-like 2 |
| chr14_+_65970804 | 1.58 |
ENSMUST00000138191.1
|
Clu
|
clusterin |
| chr8_+_45627709 | 1.53 |
ENSMUST00000134321.1
ENSMUST00000135336.1 |
Sorbs2
|
sorbin and SH3 domain containing 2 |
| chr8_+_45627946 | 1.49 |
ENSMUST00000145458.1
|
Sorbs2
|
sorbin and SH3 domain containing 2 |
| chr14_+_65971049 | 1.49 |
ENSMUST00000128539.1
|
Clu
|
clusterin |
| chr18_-_35627223 | 1.37 |
ENSMUST00000025212.5
|
Slc23a1
|
solute carrier family 23 (nucleobase transporters), member 1 |
| chr5_+_33721724 | 1.35 |
ENSMUST00000067150.7
ENSMUST00000169212.2 ENSMUST00000114411.2 ENSMUST00000164207.3 |
Fgfr3
|
fibroblast growth factor receptor 3 |
| chr18_+_38993126 | 1.34 |
ENSMUST00000097593.2
|
Arhgap26
|
Rho GTPase activating protein 26 |
| chr3_-_92083132 | 1.29 |
ENSMUST00000058150.6
|
Lor
|
loricrin |
| chr5_-_113081579 | 1.26 |
ENSMUST00000131708.1
ENSMUST00000117143.1 ENSMUST00000119627.1 |
Crybb3
|
crystallin, beta B3 |
| chr11_+_60728398 | 1.24 |
ENSMUST00000018743.4
|
Mief2
|
mitochondrial elongation factor 2 |
| chr11_+_70214105 | 1.14 |
ENSMUST00000094055.3
ENSMUST00000136328.1 ENSMUST00000126296.1 ENSMUST00000153993.2 |
Slc16a11
|
solute carrier family 16 (monocarboxylic acid transporters), member 11 |
| chr15_-_39857459 | 1.10 |
ENSMUST00000022915.3
ENSMUST00000110306.1 |
Dpys
|
dihydropyrimidinase |
| chr11_+_70213910 | 1.08 |
ENSMUST00000171032.1
|
Slc16a11
|
solute carrier family 16 (monocarboxylic acid transporters), member 11 |
| chr9_-_44799179 | 1.07 |
ENSMUST00000114705.1
ENSMUST00000002100.7 |
Tmem25
|
transmembrane protein 25 |
| chr7_+_121083414 | 1.07 |
ENSMUST00000168311.1
ENSMUST00000171880.1 |
Otoa
|
otoancorin |
| chr11_-_96075581 | 1.01 |
ENSMUST00000107686.1
ENSMUST00000107684.1 |
Atp5g1
|
ATP synthase, H+ transporting, mitochondrial F0 complex, subunit c1 (subunit 9) |
| chr13_+_91741507 | 1.00 |
ENSMUST00000022120.4
|
Acot12
|
acyl-CoA thioesterase 12 |
| chr4_-_117133953 | 1.00 |
ENSMUST00000076859.5
|
Plk3
|
polo-like kinase 3 |
| chr2_+_23069210 | 0.98 |
ENSMUST00000155602.1
|
Acbd5
|
acyl-Coenzyme A binding domain containing 5 |
| chr19_-_4042165 | 0.97 |
ENSMUST00000042700.9
|
Gstp2
|
glutathione S-transferase, pi 2 |
| chr6_+_38534823 | 0.96 |
ENSMUST00000019833.4
|
1110001J03Rik
|
RIKEN cDNA 1110001J03 gene |
| chr2_-_91194767 | 0.94 |
ENSMUST00000111355.1
|
Nr1h3
|
nuclear receptor subfamily 1, group H, member 3 |
| chr14_-_75787031 | 0.94 |
ENSMUST00000022580.6
|
Slc25a30
|
solute carrier family 25, member 30 |
| chr14_+_53676141 | 0.91 |
ENSMUST00000103662.4
|
Trav9-4
|
T cell receptor alpha variable 9-4 |
| chr11_-_116199040 | 0.91 |
ENSMUST00000066587.5
|
Acox1
|
acyl-Coenzyme A oxidase 1, palmitoyl |
| chr2_-_91195035 | 0.88 |
ENSMUST00000111356.1
|
Nr1h3
|
nuclear receptor subfamily 1, group H, member 3 |
| chr2_-_91195097 | 0.85 |
ENSMUST00000002177.2
ENSMUST00000111354.1 |
Nr1h3
|
nuclear receptor subfamily 1, group H, member 3 |
| chr11_-_96075655 | 0.83 |
ENSMUST00000090541.5
|
Atp5g1
|
ATP synthase, H+ transporting, mitochondrial F0 complex, subunit c1 (subunit 9) |
| chr11_+_97030130 | 0.82 |
ENSMUST00000153482.1
|
Scrn2
|
secernin 2 |
| chr15_-_59082026 | 0.81 |
ENSMUST00000080371.6
|
Mtss1
|
metastasis suppressor 1 |
| chr13_-_95891905 | 0.79 |
ENSMUST00000068603.6
|
Iqgap2
|
IQ motif containing GTPase activating protein 2 |
| chr17_-_46890405 | 0.77 |
ENSMUST00000086675.3
|
A330017A19Rik
|
RIKEN cDNA A330017A19 gene |
| chr8_-_22476809 | 0.77 |
ENSMUST00000163774.1
ENSMUST00000033935.8 |
Smim19
|
small integral membrane protein 19 |
| chr11_+_97029925 | 0.74 |
ENSMUST00000021249.4
|
Scrn2
|
secernin 2 |
| chr6_+_89643982 | 0.72 |
ENSMUST00000000828.6
ENSMUST00000101171.1 |
Txnrd3
|
thioredoxin reductase 3 |
| chr1_-_5019342 | 0.71 |
ENSMUST00000002533.8
|
Rgs20
|
regulator of G-protein signaling 20 |
| chr1_-_39577340 | 0.69 |
ENSMUST00000062525.5
|
Rnf149
|
ring finger protein 149 |
| chr7_+_107370728 | 0.68 |
ENSMUST00000137663.1
ENSMUST00000073459.5 |
Syt9
|
synaptotagmin IX |
| chr1_-_153851189 | 0.67 |
ENSMUST00000059607.6
|
5830403L16Rik
|
RIKEN cDNA 5830403L16 gene |
| chr6_-_114969986 | 0.66 |
ENSMUST00000139640.1
|
Vgll4
|
vestigial like 4 (Drosophila) |
| chr11_+_51763682 | 0.66 |
ENSMUST00000020653.5
|
Sar1b
|
SAR1 gene homolog B (S. cerevisiae) |
| chr11_+_110997487 | 0.65 |
ENSMUST00000106635.1
|
Kcnj16
|
potassium inwardly-rectifying channel, subfamily J, member 16 |
| chr6_+_88724828 | 0.64 |
ENSMUST00000089449.2
|
Mgll
|
monoglyceride lipase |
| chr6_+_88724667 | 0.64 |
ENSMUST00000163271.1
|
Mgll
|
monoglyceride lipase |
| chr11_-_115062177 | 0.62 |
ENSMUST00000062787.7
|
Cd300e
|
CD300e antigen |
| chr6_-_125165707 | 0.62 |
ENSMUST00000118875.1
|
Gapdh
|
glyceraldehyde-3-phosphate dehydrogenase |
| chr7_-_46715676 | 0.62 |
ENSMUST00000006956.7
|
Saa3
|
serum amyloid A 3 |
| chr9_+_108080436 | 0.62 |
ENSMUST00000035211.7
ENSMUST00000162886.1 |
Mst1
|
macrophage stimulating 1 (hepatocyte growth factor-like) |
| chr19_+_47865543 | 0.61 |
ENSMUST00000120645.1
|
Gsto2
|
glutathione S-transferase omega 2 |
| chr3_-_30509462 | 0.60 |
ENSMUST00000173899.1
|
Mecom
|
MDS1 and EVI1 complex locus |
| chr11_-_79296906 | 0.59 |
ENSMUST00000068448.2
|
Gm9964
|
predicted gene 9964 |
| chr14_-_21052120 | 0.59 |
ENSMUST00000130370.1
ENSMUST00000022371.3 |
Ap3m1
|
adaptor-related protein complex 3, mu 1 subunit |
| chr12_+_10390756 | 0.58 |
ENSMUST00000020947.5
|
Rdh14
|
retinol dehydrogenase 14 (all-trans and 9-cis) |
| chr18_+_37421418 | 0.58 |
ENSMUST00000053073.4
|
Pcdhb11
|
protocadherin beta 11 |
| chr6_+_115675983 | 0.57 |
ENSMUST00000068960.9
|
D830050J10Rik
|
RIKEN cDNA D830050J10 gene |
| chr12_-_87644467 | 0.56 |
ENSMUST00000180181.1
|
Gm16381
|
predicted gene 16381 |
| chr8_-_47533439 | 0.56 |
ENSMUST00000039061.8
|
Trappc11
|
trafficking protein particle complex 11 |
| chr8_+_85080939 | 0.54 |
ENSMUST00000140621.1
|
BC056474
|
cDNA sequence BC056474 |
| chr12_-_87102350 | 0.53 |
ENSMUST00000110176.1
|
Ngb
|
neuroglobin |
| chr6_+_71322775 | 0.53 |
ENSMUST00000065248.7
|
Cd8b1
|
CD8 antigen, beta chain 1 |
| chr3_-_97297778 | 0.53 |
ENSMUST00000181368.1
|
Gm17608
|
predicted gene, 17608 |
| chr16_-_87432597 | 0.53 |
ENSMUST00000039449.7
|
Ltn1
|
listerin E3 ubiquitin protein ligase 1 |
| chr6_+_21215472 | 0.52 |
ENSMUST00000081542.5
|
Kcnd2
|
potassium voltage-gated channel, Shal-related family, member 2 |
| chrX_+_155624775 | 0.52 |
ENSMUST00000112542.1
|
Gm15155
|
predicted gene 15155 |
| chr8_+_92961027 | 0.50 |
ENSMUST00000072939.6
|
Slc6a2
|
solute carrier family 6 (neurotransmitter transporter, noradrenalin), member 2 |
| chr14_+_53390570 | 0.49 |
ENSMUST00000103636.2
|
Trav7-2
|
T cell receptor alpha variable 7-2 |
| chr8_+_123442969 | 0.48 |
ENSMUST00000093049.3
ENSMUST00000065534.3 ENSMUST00000001522.3 ENSMUST00000124741.1 ENSMUST00000108832.1 ENSMUST00000132063.1 ENSMUST00000128424.1 |
Def8
|
differentially expressed in FDCP 8 |
| chr8_-_67818218 | 0.48 |
ENSMUST00000059374.4
|
Psd3
|
pleckstrin and Sec7 domain containing 3 |
| chr17_-_15564322 | 0.48 |
ENSMUST00000147532.1
|
Prdm9
|
PR domain containing 9 |
| chrX_-_162565514 | 0.47 |
ENSMUST00000154424.1
|
Reps2
|
RALBP1 associated Eps domain containing protein 2 |
| chr5_-_43235352 | 0.46 |
ENSMUST00000140650.2
|
Gm7854
|
predicted gene 7854 |
| chr5_+_137553517 | 0.46 |
ENSMUST00000136088.1
ENSMUST00000139395.1 ENSMUST00000136565.1 ENSMUST00000149292.1 ENSMUST00000125489.1 |
Actl6b
|
actin-like 6B |
| chr8_+_94386438 | 0.46 |
ENSMUST00000161576.1
|
Herpud1
|
homocysteine-inducible, endoplasmic reticulum stress-inducible, ubiquitin-like domain member 1 |
| chr11_+_101070012 | 0.45 |
ENSMUST00000001802.9
|
Naglu
|
alpha-N-acetylglucosaminidase (Sanfilippo disease IIIB) |
| chrX_+_52791179 | 0.45 |
ENSMUST00000101588.1
|
Ccdc160
|
coiled-coil domain containing 160 |
| chr8_+_94386486 | 0.45 |
ENSMUST00000034220.7
|
Herpud1
|
homocysteine-inducible, endoplasmic reticulum stress-inducible, ubiquitin-like domain member 1 |
| chr6_-_115592571 | 0.44 |
ENSMUST00000112957.1
|
2510049J12Rik
|
RIKEN cDNA 2510049J12 gene |
| chr3_+_96525163 | 0.44 |
ENSMUST00000049208.9
|
Hfe2
|
hemochromatosis type 2 (juvenile) (human homolog) |
| chr1_-_39651165 | 0.43 |
ENSMUST00000053355.4
|
Creg2
|
cellular repressor of E1A-stimulated genes 2 |
| chr8_-_85080679 | 0.43 |
ENSMUST00000093357.5
|
Wdr83
|
WD repeat domain containing 83 |
| chr14_+_66868850 | 0.43 |
ENSMUST00000100453.1
|
Gm5464
|
predicted gene 5464 |
| chr14_-_47568427 | 0.43 |
ENSMUST00000042988.6
|
Atg14
|
autophagy related 14 |
| chr2_-_90904827 | 0.42 |
ENSMUST00000005647.3
|
Ndufs3
|
NADH dehydrogenase (ubiquinone) Fe-S protein 3 |
| chr6_-_71322200 | 0.41 |
ENSMUST00000173297.1
ENSMUST00000114188.2 |
Smyd1
|
SET and MYND domain containing 1 |
| chr3_+_108186332 | 0.40 |
ENSMUST00000050909.6
ENSMUST00000106659.2 ENSMUST00000106656.1 ENSMUST00000106661.2 |
Amigo1
|
adhesion molecule with Ig like domain 1 |
| chr5_+_76951307 | 0.40 |
ENSMUST00000031160.9
ENSMUST00000120912.1 ENSMUST00000117536.1 |
Paics
|
phosphoribosylaminoimidazole carboxylase, phosphoribosylaminoribosylaminoimidazole, succinocarboxamide synthetase |
| chr18_-_60591783 | 0.40 |
ENSMUST00000056533.7
|
Myoz3
|
myozenin 3 |
| chr8_-_67818284 | 0.40 |
ENSMUST00000120071.1
|
Psd3
|
pleckstrin and Sec7 domain containing 3 |
| chr12_+_78691516 | 0.39 |
ENSMUST00000077968.4
|
Fam71d
|
family with sequence similarity 71, member D |
| chr2_+_181837854 | 0.39 |
ENSMUST00000029116.7
ENSMUST00000108754.1 |
Pcmtd2
|
protein-L-isoaspartate (D-aspartate) O-methyltransferase domain containing 2 |
| chr1_+_165461037 | 0.39 |
ENSMUST00000027853.5
|
Mpc2
|
mitochondrial pyruvate carrier 2 |
| chr14_+_53461099 | 0.38 |
ENSMUST00000181728.1
|
Trav7-4
|
T cell receptor alpha variable 7-4 |
| chr14_+_20348159 | 0.38 |
ENSMUST00000090503.4
ENSMUST00000090499.5 ENSMUST00000037698.5 ENSMUST00000051915.6 |
Fam149b
|
family with sequence similarity 149, member B |
| chr5_-_74531619 | 0.38 |
ENSMUST00000113542.2
ENSMUST00000072857.6 ENSMUST00000121330.1 ENSMUST00000151474.1 |
Scfd2
|
Sec1 family domain containing 2 |
| chr18_+_40258361 | 0.38 |
ENSMUST00000091927.4
|
Kctd16
|
potassium channel tetramerisation domain containing 16 |
| chr6_-_115675871 | 0.38 |
ENSMUST00000112949.1
|
Raf1
|
v-raf-leukemia viral oncogene 1 |
| chr10_+_112271123 | 0.37 |
ENSMUST00000092175.2
|
Kcnc2
|
potassium voltage gated channel, Shaw-related subfamily, member 2 |
| chr8_+_47533639 | 0.37 |
ENSMUST00000033973.7
ENSMUST00000176379.1 |
Rwdd4a
|
RWD domain containing 4A |
| chr2_+_137663424 | 0.36 |
ENSMUST00000134833.1
|
Gm14064
|
predicted gene 14064 |
| chr5_+_138820080 | 0.36 |
ENSMUST00000179205.1
|
Gm5294
|
predicted gene 5294 |
| chr8_+_123443288 | 0.36 |
ENSMUST00000108830.1
|
Def8
|
differentially expressed in FDCP 8 |
| chr16_+_78301458 | 0.36 |
ENSMUST00000023572.7
|
Cxadr
|
coxsackie virus and adenovirus receptor |
| chr3_-_151835967 | 0.36 |
ENSMUST00000106126.1
|
Ptgfr
|
prostaglandin F receptor |
| chr2_-_6935081 | 0.35 |
ENSMUST00000100426.2
|
Gm10855
|
predicted gene 10855 |
| chr7_+_135268579 | 0.35 |
ENSMUST00000097983.3
|
Nps
|
neuropeptide S |
| chr11_+_110399115 | 0.35 |
ENSMUST00000020949.5
ENSMUST00000100260.1 |
Map2k6
|
mitogen-activated protein kinase kinase 6 |
| chr7_+_120677579 | 0.35 |
ENSMUST00000060175.6
|
BC030336
|
cDNA sequence BC030336 |
| chr7_+_102640248 | 0.34 |
ENSMUST00000098221.1
|
Olfr554
|
olfactory receptor 554 |
| chr2_-_32961592 | 0.34 |
ENSMUST00000133832.1
ENSMUST00000124492.1 ENSMUST00000145578.1 ENSMUST00000127321.1 ENSMUST00000113200.1 |
Lrsam1
|
leucine rich repeat and sterile alpha motif containing 1 |
| chr18_-_39489157 | 0.33 |
ENSMUST00000131885.1
|
Nr3c1
|
nuclear receptor subfamily 3, group C, member 1 |
| chr13_+_34734837 | 0.33 |
ENSMUST00000039605.6
|
Fam50b
|
family with sequence similarity 50, member B |
| chr6_-_125165576 | 0.32 |
ENSMUST00000183272.1
ENSMUST00000182052.1 ENSMUST00000182277.1 |
Gapdh
|
glyceraldehyde-3-phosphate dehydrogenase |
| chrM_+_2743 | 0.32 |
ENSMUST00000082392.1
|
mt-Nd1
|
mitochondrially encoded NADH dehydrogenase 1 |
| chr6_-_86793522 | 0.32 |
ENSMUST00000001187.8
|
Anxa4
|
annexin A4 |
| chrY_+_79320997 | 0.32 |
ENSMUST00000178063.1
|
Gm20916
|
predicted gene, 20916 |
| chr1_-_195131536 | 0.31 |
ENSMUST00000075451.6
|
Cr1l
|
complement component (3b/4b) receptor 1-like |
| chr7_-_126377401 | 0.30 |
ENSMUST00000119846.1
ENSMUST00000119754.1 ENSMUST00000032994.8 |
Spns1
|
spinster homolog 1 |
| chr16_-_60605226 | 0.30 |
ENSMUST00000068860.6
|
Epha6
|
Eph receptor A6 |
| chr7_+_64287665 | 0.30 |
ENSMUST00000032736.4
|
Mtmr10
|
myotubularin related protein 10 |
| chr1_+_173673651 | 0.30 |
ENSMUST00000085876.4
|
Pydc3
|
pyrin domain containing 3 |
| chr9_-_45906369 | 0.30 |
ENSMUST00000161187.1
|
Rnf214
|
ring finger protein 214 |
| chr6_-_52260780 | 0.29 |
ENSMUST00000114416.1
ENSMUST00000147595.3 |
Hoxa13
|
homeobox A13 |
| chr1_+_5588941 | 0.28 |
ENSMUST00000160339.1
|
Oprk1
|
opioid receptor, kappa 1 |
| chr3_+_90537242 | 0.28 |
ENSMUST00000098911.3
|
S100a16
|
S100 calcium binding protein A16 |
| chr7_-_116308241 | 0.28 |
ENSMUST00000183057.1
ENSMUST00000182487.1 ENSMUST00000181998.1 |
Plekha7
|
pleckstrin homology domain containing, family A member 7 |
| chr7_-_42727017 | 0.28 |
ENSMUST00000166837.1
|
Gm17067
|
predicted gene 17067 |
| chr5_-_114273702 | 0.27 |
ENSMUST00000144050.1
ENSMUST00000044790.5 |
Foxn4
|
forkhead box N4 |
| chr5_-_129887442 | 0.26 |
ENSMUST00000094280.3
|
Chchd2
|
coiled-coil-helix-coiled-coil-helix domain containing 2 |
| chr8_+_106603351 | 0.26 |
ENSMUST00000000312.5
ENSMUST00000167688.1 |
Cdh1
|
cadherin 1 |
| chr11_-_59571813 | 0.26 |
ENSMUST00000071943.2
|
Olfr222
|
olfactory receptor 222 |
| chr7_+_120982521 | 0.25 |
ENSMUST00000149535.1
ENSMUST00000138177.1 |
4933427G17Rik
|
RIKEN cDNA 4933427G17 gene |
| chr2_-_153871076 | 0.25 |
ENSMUST00000028982.4
|
Sun5
|
Sad1 and UNC84 domain containing 5 |
| chr9_-_105521147 | 0.25 |
ENSMUST00000176770.1
ENSMUST00000085133.6 |
Atp2c1
|
ATPase, Ca++-sequestering |
| chr10_+_84917616 | 0.25 |
ENSMUST00000038523.7
ENSMUST00000095385.3 |
Ric8b
|
resistance to inhibitors of cholinesterase 8 homolog B (C. elegans) |
| chrX_-_60147643 | 0.24 |
ENSMUST00000033478.4
ENSMUST00000101531.3 |
Mcf2
|
mcf.2 transforming sequence |
| chr3_+_138143483 | 0.24 |
ENSMUST00000162864.1
|
Trmt10a
|
tRNA methyltransferase 10A |
| chr4_-_56224520 | 0.24 |
ENSMUST00000128591.1
|
2310081O03Rik
|
RIKEN cDNA 2310081O03 gene |
| chr6_-_125166463 | 0.23 |
ENSMUST00000117757.2
ENSMUST00000073605.8 |
Gapdh
|
glyceraldehyde-3-phosphate dehydrogenase |
| chr2_+_152604324 | 0.23 |
ENSMUST00000058086.5
|
Defb36
|
defensin beta 36 |
| chr7_-_130547358 | 0.23 |
ENSMUST00000160289.1
|
Nsmce4a
|
non-SMC element 4 homolog A (S. cerevisiae) |
| chr5_+_31526989 | 0.23 |
ENSMUST00000114533.2
ENSMUST00000117262.1 ENSMUST00000117319.1 |
Slc4a1ap
|
solute carrier family 4 (anion exchanger), member 1, adaptor protein |
| chr9_-_58102225 | 0.23 |
ENSMUST00000119665.1
|
Ccdc33
|
coiled-coil domain containing 33 |
| chr16_+_35983307 | 0.22 |
ENSMUST00000004054.6
|
Kpna1
|
karyopherin (importin) alpha 1 |
| chr6_+_71831325 | 0.22 |
ENSMUST00000064062.6
ENSMUST00000166975.1 ENSMUST00000165331.1 ENSMUST00000114151.3 ENSMUST00000101301.3 ENSMUST00000166938.1 |
Immt
|
inner membrane protein, mitochondrial |
| chr11_-_103218421 | 0.21 |
ENSMUST00000103076.1
|
Spata32
|
spermatogenesis associated 32 |
| chr14_+_59201209 | 0.21 |
ENSMUST00000173547.1
ENSMUST00000043227.6 ENSMUST00000022551.7 |
Rcbtb1
|
regulator of chromosome condensation (RCC1) and BTB (POZ) domain containing protein 1 |
| chr2_-_172454742 | 0.21 |
ENSMUST00000161334.1
|
Gcnt7
|
glucosaminyl (N-acetyl) transferase family member 7 |
| chr13_-_104816908 | 0.21 |
ENSMUST00000022228.6
|
Cwc27
|
CWC27 spliceosome-associated protein homolog (S. cerevisiae) |
| chr11_-_35798884 | 0.21 |
ENSMUST00000160726.2
|
Fbll1
|
fibrillarin-like 1 |
| chr12_+_105604091 | 0.20 |
ENSMUST00000041229.4
|
Bdkrb1
|
bradykinin receptor, beta 1 |
| chr8_-_99416397 | 0.20 |
ENSMUST00000155527.1
ENSMUST00000142129.1 ENSMUST00000093249.4 ENSMUST00000142475.2 ENSMUST00000128860.1 |
Cdh8
|
cadherin 8 |
| chrY_-_35130404 | 0.20 |
ENSMUST00000180170.1
|
Gm20855
|
predicted gene, 20855 |
| chr4_+_129947547 | 0.19 |
ENSMUST00000128007.1
|
Spocd1
|
SPOC domain containing 1 |
| chrX_+_103422010 | 0.19 |
ENSMUST00000182089.1
|
Gm26992
|
predicted gene, 26992 |
| chr17_+_34417347 | 0.19 |
ENSMUST00000142317.1
|
BC051142
|
cDNA sequence BC051142 |
| chr3_+_90537306 | 0.19 |
ENSMUST00000107335.1
|
S100a16
|
S100 calcium binding protein A16 |
| chr14_+_63606491 | 0.19 |
ENSMUST00000119973.2
|
Xkr6
|
X Kell blood group precursor related family member 6 homolog |
| chr16_+_24721842 | 0.19 |
ENSMUST00000115314.2
|
Lpp
|
LIM domain containing preferred translocation partner in lipoma |
| chr16_-_45724600 | 0.18 |
ENSMUST00000096057.4
|
Tagln3
|
transgelin 3 |
| chr7_-_104195960 | 0.18 |
ENSMUST00000106859.1
|
Olfr649
|
olfactory receptor 649 |
| chr11_+_71750980 | 0.18 |
ENSMUST00000108511.1
|
Wscd1
|
WSC domain containing 1 |
| chr1_+_157526127 | 0.18 |
ENSMUST00000111700.1
|
Sec16b
|
SEC16 homolog B (S. cerevisiae) |
| chr13_+_45965211 | 0.16 |
ENSMUST00000038032.3
|
5033430I15Rik
|
RIKEN cDNA 5033430I15 gene |
| chr2_-_102186322 | 0.16 |
ENSMUST00000111222.1
ENSMUST00000058790.5 |
Ldlrad3
|
low density lipoprotein receptor class A domain containing 3 |
| chr4_-_128962420 | 0.15 |
ENSMUST00000119354.1
ENSMUST00000106068.1 ENSMUST00000030581.3 |
Adc
|
arginine decarboxylase |
| chr3_-_83049797 | 0.15 |
ENSMUST00000048246.3
|
Fgb
|
fibrinogen beta chain |
| chr7_+_120982496 | 0.15 |
ENSMUST00000033166.3
|
4933427G17Rik
|
RIKEN cDNA 4933427G17 gene |
| chr10_+_5639210 | 0.14 |
ENSMUST00000019906.4
|
Vip
|
vasoactive intestinal polypeptide |
| chr1_-_58586191 | 0.14 |
ENSMUST00000038372.7
ENSMUST00000097724.3 ENSMUST00000161000.1 ENSMUST00000161600.1 |
Fam126b
|
family with sequence similarity 126, member B |
| chr5_-_31526693 | 0.13 |
ENSMUST00000118874.1
ENSMUST00000117642.1 ENSMUST00000065388.4 |
Supt7l
|
suppressor of Ty 7-like |
| chr19_-_4334001 | 0.12 |
ENSMUST00000176653.1
|
Kdm2a
|
lysine (K)-specific demethylase 2A |
| chr6_+_125494419 | 0.12 |
ENSMUST00000181266.1
|
Gm26728
|
predicted gene, 26728 |
| chr3_-_58525867 | 0.12 |
ENSMUST00000029385.7
|
Serp1
|
stress-associated endoplasmic reticulum protein 1 |
| chr5_-_87699414 | 0.12 |
ENSMUST00000082370.5
|
Csn2
|
casein beta |
| chr15_+_103013815 | 0.10 |
ENSMUST00000001709.2
|
Hoxc5
|
homeobox C5 |
| chr18_+_37307445 | 0.10 |
ENSMUST00000056712.2
|
Pcdhb4
|
protocadherin beta 4 |
| chr1_-_64737735 | 0.10 |
ENSMUST00000063982.5
ENSMUST00000116133.2 |
Fzd5
|
frizzled homolog 5 (Drosophila) |
| chrX_-_75163753 | 0.10 |
ENSMUST00000101433.2
|
Smim9
|
small integral membrane protein 9 |
| chr9_+_20644792 | 0.09 |
ENSMUST00000162303.1
ENSMUST00000161486.1 |
Ubl5
|
ubiquitin-like 5 |
| chr13_-_66355385 | 0.09 |
ENSMUST00000099416.3
|
Vmn2r-ps104
|
vomeronasal 2, receptor, pseudogene 104 |
| chr7_-_79793788 | 0.09 |
ENSMUST00000032760.5
|
Mesp1
|
mesoderm posterior 1 |
| chr14_-_103843685 | 0.09 |
ENSMUST00000172237.1
|
Ednrb
|
endothelin receptor type B |
| chr1_+_87327008 | 0.09 |
ENSMUST00000172794.1
ENSMUST00000164992.2 |
Gigyf2
|
GRB10 interacting GYF protein 2 |
| chr13_+_42680565 | 0.09 |
ENSMUST00000128646.1
|
Phactr1
|
phosphatase and actin regulator 1 |
| chr2_+_90904740 | 0.08 |
ENSMUST00000111464.1
ENSMUST00000090682.3 |
Kbtbd4
|
kelch repeat and BTB (POZ) domain containing 4 |
| chr7_-_75309262 | 0.07 |
ENSMUST00000165175.1
|
Sv2b
|
synaptic vesicle glycoprotein 2 b |
| chr4_+_129947721 | 0.07 |
ENSMUST00000084263.4
|
Spocd1
|
SPOC domain containing 1 |
| chr9_+_20644851 | 0.07 |
ENSMUST00000161882.1
|
Ubl5
|
ubiquitin-like 5 |
| chr10_-_121626316 | 0.06 |
ENSMUST00000039810.7
|
Xpot
|
exportin, tRNA (nuclear export receptor for tRNAs) |
| chr14_-_52020698 | 0.06 |
ENSMUST00000067549.7
|
Zfp219
|
zinc finger protein 219 |
| chr16_-_15594507 | 0.05 |
ENSMUST00000115776.1
ENSMUST00000115777.3 |
Ube2v2
|
ubiquitin-conjugating enzyme E2 variant 2 |
| chrX_-_167855061 | 0.05 |
ENSMUST00000112146.1
|
Frmpd4
|
FERM and PDZ domain containing 4 |
| chr2_+_147361925 | 0.05 |
ENSMUST00000126068.1
|
Pax1
|
paired box gene 1 |
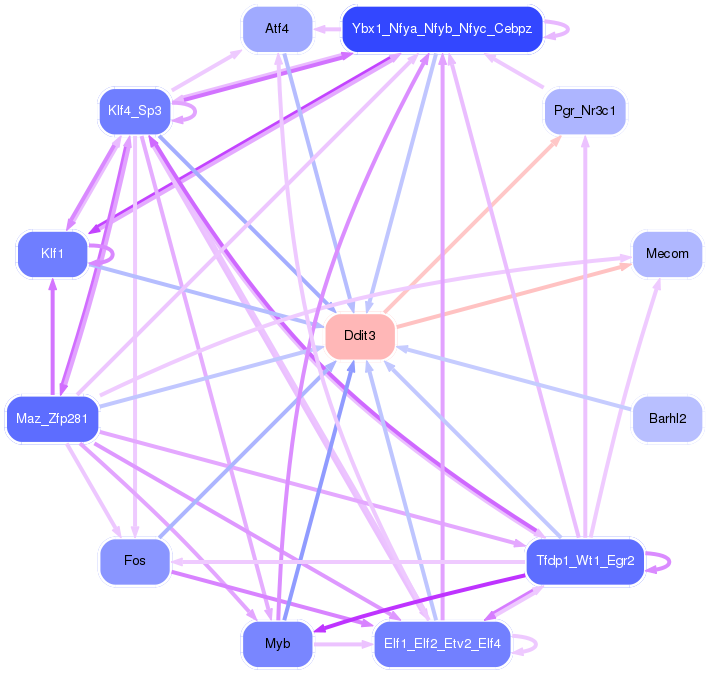
Network of associatons between targets according to the STRING database.

First level regulatory network of Ddit3
Gene Ontology Analysis
Gene overrepresentation in biological process category:
| Log-likelihood per target | Total log-likelihood | Term | Description |
|---|---|---|---|
| 0.9 | 2.7 | GO:0090341 | negative regulation of secretion of lysosomal enzymes(GO:0090341) |
| 0.8 | 4.9 | GO:1902998 | regulation of neuronal signal transduction(GO:1902847) positive regulation of neurofibrillary tangle assembly(GO:1902998) |
| 0.5 | 1.4 | GO:0015882 | L-ascorbic acid transport(GO:0015882) transepithelial L-ascorbic acid transport(GO:0070904) |
| 0.5 | 1.4 | GO:0061144 | alveolar secondary septum development(GO:0061144) |
| 0.4 | 1.1 | GO:0019859 | pyrimidine nucleobase catabolic process(GO:0006208) thymine catabolic process(GO:0006210) thymine metabolic process(GO:0019859) |
| 0.3 | 1.2 | GO:0035606 | peptidyl-cysteine S-trans-nitrosylation(GO:0035606) |
| 0.3 | 0.8 | GO:0034334 | adherens junction maintenance(GO:0034334) |
| 0.2 | 2.9 | GO:0006751 | glutathione catabolic process(GO:0006751) |
| 0.2 | 1.3 | GO:2000124 | regulation of endocannabinoid signaling pathway(GO:2000124) |
| 0.2 | 0.5 | GO:0010845 | positive regulation of reciprocal meiotic recombination(GO:0010845) |
| 0.2 | 0.9 | GO:0033540 | fatty acid beta-oxidation using acyl-CoA oxidase(GO:0033540) |
| 0.2 | 0.9 | GO:1903071 | positive regulation of ER-associated ubiquitin-dependent protein catabolic process(GO:1903071) |
| 0.1 | 1.0 | GO:0030242 | pexophagy(GO:0030242) |
| 0.1 | 0.4 | GO:0071550 | death-inducing signaling complex assembly(GO:0071550) |
| 0.1 | 1.2 | GO:0032464 | positive regulation of protein homooligomerization(GO:0032464) |
| 0.1 | 1.0 | GO:0090166 | Golgi disassembly(GO:0090166) regulation of chaperone-mediated autophagy(GO:1904714) |
| 0.1 | 0.4 | GO:0016240 | autophagosome docking(GO:0016240) |
| 0.1 | 0.6 | GO:0009407 | toxin catabolic process(GO:0009407) secondary metabolite catabolic process(GO:0090487) |
| 0.1 | 0.4 | GO:1901475 | pyruvate transmembrane transport(GO:1901475) |
| 0.1 | 0.4 | GO:0071799 | response to prostaglandin D(GO:0071798) cellular response to prostaglandin D stimulus(GO:0071799) |
| 0.1 | 0.4 | GO:0010841 | positive regulation of circadian sleep/wake cycle, wakefulness(GO:0010841) |
| 0.1 | 0.3 | GO:0070086 | ubiquitin-dependent endocytosis(GO:0070086) |
| 0.1 | 0.4 | GO:0006189 | 'de novo' IMP biosynthetic process(GO:0006189) |
| 0.1 | 1.7 | GO:0014049 | positive regulation of glutamate secretion(GO:0014049) |
| 0.1 | 0.3 | GO:2001055 | positive regulation of mesenchymal cell apoptotic process(GO:2001055) |
| 0.1 | 0.3 | GO:0031635 | adenylate cyclase-inhibiting opioid receptor signaling pathway(GO:0031635) |
| 0.1 | 0.1 | GO:0010578 | regulation of adenylate cyclase activity involved in G-protein coupled receptor signaling pathway(GO:0010578) positive regulation of adenylate cyclase activity involved in G-protein coupled receptor signaling pathway(GO:0010579) |
| 0.1 | 0.5 | GO:0015671 | oxygen transport(GO:0015671) |
| 0.1 | 0.3 | GO:0060066 | oviduct development(GO:0060066) |
| 0.1 | 0.2 | GO:0032468 | cellular manganese ion homeostasis(GO:0030026) Golgi calcium ion homeostasis(GO:0032468) manganese ion homeostasis(GO:0055071) |
| 0.1 | 0.6 | GO:0060763 | mammary duct terminal end bud growth(GO:0060763) |
| 0.1 | 0.4 | GO:0060054 | positive regulation of epithelial cell proliferation involved in wound healing(GO:0060054) |
| 0.1 | 1.8 | GO:0015986 | energy coupled proton transport, down electrochemical gradient(GO:0015985) ATP synthesis coupled proton transport(GO:0015986) |
| 0.1 | 0.8 | GO:0070493 | thrombin receptor signaling pathway(GO:0070493) |
| 0.1 | 0.6 | GO:0061635 | regulation of protein complex stability(GO:0061635) |
| 0.0 | 2.7 | GO:0003298 | physiological muscle hypertrophy(GO:0003298) physiological cardiac muscle hypertrophy(GO:0003301) cell growth involved in cardiac muscle cell development(GO:0061049) |
| 0.0 | 0.3 | GO:0045218 | zonula adherens maintenance(GO:0045218) |
| 0.0 | 0.2 | GO:0018364 | peptidyl-glutamine methylation(GO:0018364) |
| 0.0 | 0.6 | GO:0090336 | positive regulation of brown fat cell differentiation(GO:0090336) |
| 0.0 | 0.3 | GO:2000483 | negative regulation of interleukin-8 secretion(GO:2000483) |
| 0.0 | 1.0 | GO:0045475 | locomotor rhythm(GO:0045475) |
| 0.0 | 0.3 | GO:2000258 | negative regulation of complement activation(GO:0045916) negative regulation of protein activation cascade(GO:2000258) |
| 0.0 | 0.2 | GO:0043152 | induction of bacterial agglutination(GO:0043152) |
| 0.0 | 1.3 | GO:0031424 | keratinization(GO:0031424) |
| 0.0 | 0.3 | GO:0032308 | positive regulation of prostaglandin secretion(GO:0032308) |
| 0.0 | 0.1 | GO:0060061 | Spemann organizer formation(GO:0060061) |
| 0.0 | 0.9 | GO:0032012 | ARF protein signal transduction(GO:0032011) regulation of ARF protein signal transduction(GO:0032012) |
| 0.0 | 0.1 | GO:0035481 | Notch signaling pathway involved in heart induction(GO:0003137) regulation of Notch signaling pathway involved in heart induction(GO:0035480) positive regulation of Notch signaling pathway involved in heart induction(GO:0035481) regulation of heart induction by regulation of canonical Wnt signaling pathway(GO:0090081) |
| 0.0 | 0.5 | GO:0015874 | norepinephrine transport(GO:0015874) |
| 0.0 | 1.0 | GO:0006084 | acetyl-CoA metabolic process(GO:0006084) |
| 0.0 | 0.4 | GO:0071732 | cellular response to nitric oxide(GO:0071732) |
| 0.0 | 0.6 | GO:0099517 | anterograde synaptic vesicle transport(GO:0048490) synaptic vesicle cytoskeletal transport(GO:0099514) synaptic vesicle transport along microtubule(GO:0099517) |
| 0.0 | 0.6 | GO:0042572 | retinol metabolic process(GO:0042572) |
| 0.0 | 1.7 | GO:0006749 | glutathione metabolic process(GO:0006749) |
| 0.0 | 0.6 | GO:0007252 | I-kappaB phosphorylation(GO:0007252) |
| 0.0 | 0.4 | GO:0016540 | protein autoprocessing(GO:0016540) |
| 0.0 | 0.7 | GO:0045956 | positive regulation of calcium ion-dependent exocytosis(GO:0045956) |
| 0.0 | 0.1 | GO:0099527 | postsynapse to nucleus signaling pathway(GO:0099527) |
| 0.0 | 0.1 | GO:0042275 | error-free postreplication DNA repair(GO:0042275) |
| 0.0 | 0.3 | GO:0090286 | cytoskeletal anchoring at nuclear membrane(GO:0090286) |
| 0.0 | 0.1 | GO:0060406 | positive regulation of penile erection(GO:0060406) |
| 0.0 | 0.2 | GO:0048207 | vesicle targeting, rough ER to cis-Golgi(GO:0048207) COPII vesicle coating(GO:0048208) |
| 0.0 | 0.6 | GO:0010107 | potassium ion import(GO:0010107) |
| 0.0 | 0.3 | GO:0035881 | amacrine cell differentiation(GO:0035881) |
| 0.0 | 0.1 | GO:0071431 | tRNA export from nucleus(GO:0006409) tRNA-containing ribonucleoprotein complex export from nucleus(GO:0071431) |
| 0.0 | 0.1 | GO:0033184 | positive regulation of histone ubiquitination(GO:0033184) |
| 0.0 | 0.3 | GO:0033194 | response to hydroperoxide(GO:0033194) |
| 0.0 | 0.3 | GO:1900037 | regulation of cellular response to hypoxia(GO:1900037) |
| 0.0 | 0.2 | GO:0042407 | cristae formation(GO:0042407) |
| 0.0 | 0.1 | GO:0060124 | positive regulation of growth hormone secretion(GO:0060124) |
| 0.0 | 2.1 | GO:0015718 | monocarboxylic acid transport(GO:0015718) |
| 0.0 | 0.4 | GO:0045663 | positive regulation of myoblast differentiation(GO:0045663) |
| 0.0 | 0.4 | GO:0006904 | vesicle docking involved in exocytosis(GO:0006904) |
| 0.0 | 0.1 | GO:0051835 | positive regulation of synapse structural plasticity(GO:0051835) |
Gene overrepresentation in cellular component category:
| Log-likelihood per target | Total log-likelihood | Term | Description |
|---|---|---|---|
| 0.4 | 4.9 | GO:0097418 | neurofibrillary tangle(GO:0097418) |
| 0.3 | 1.0 | GO:0097057 | TRAF2-GSTP1 complex(GO:0097057) |
| 0.2 | 0.9 | GO:1990037 | Lewy body core(GO:1990037) |
| 0.2 | 1.2 | GO:0097452 | GAIT complex(GO:0097452) |
| 0.1 | 0.4 | GO:0097629 | extrinsic component of omegasome membrane(GO:0097629) |
| 0.1 | 1.8 | GO:0000276 | mitochondrial proton-transporting ATP synthase complex, coupling factor F(o)(GO:0000276) |
| 0.1 | 1.3 | GO:0043196 | varicosity(GO:0043196) |
| 0.0 | 0.4 | GO:1990712 | HFE-transferrin receptor complex(GO:1990712) |
| 0.0 | 1.3 | GO:0001533 | cornified envelope(GO:0001533) |
| 0.0 | 0.6 | GO:1904115 | axon cytoplasm(GO:1904115) |
| 0.0 | 0.6 | GO:0030008 | TRAPP complex(GO:0030008) |
| 0.0 | 0.2 | GO:0031428 | box C/D snoRNP complex(GO:0031428) |
| 0.0 | 1.3 | GO:0032809 | neuronal cell body membrane(GO:0032809) |
| 0.0 | 0.3 | GO:0005915 | zonula adherens(GO:0005915) |
| 0.0 | 0.1 | GO:0030914 | STAGA complex(GO:0030914) |
| 0.0 | 0.2 | GO:0061617 | MICOS complex(GO:0061617) |
| 0.0 | 0.5 | GO:0016514 | SWI/SNF complex(GO:0016514) |
| 0.0 | 0.3 | GO:0016600 | flotillin complex(GO:0016600) |
| 0.0 | 0.4 | GO:0031143 | pseudopodium(GO:0031143) |
| 0.0 | 0.6 | GO:0034364 | high-density lipoprotein particle(GO:0034364) |
| 0.0 | 0.1 | GO:0031372 | UBC13-MMS2 complex(GO:0031372) |
| 0.0 | 0.2 | GO:0005577 | fibrinogen complex(GO:0005577) |
| 0.0 | 1.4 | GO:0009925 | basal plasma membrane(GO:0009925) |
| 0.0 | 0.4 | GO:0031305 | integral component of mitochondrial inner membrane(GO:0031305) |
| 0.0 | 0.7 | GO:0030964 | mitochondrial respiratory chain complex I(GO:0005747) NADH dehydrogenase complex(GO:0030964) respiratory chain complex I(GO:0045271) |
| 0.0 | 3.9 | GO:0005802 | trans-Golgi network(GO:0005802) |
| 0.0 | 0.9 | GO:0097610 | cleavage furrow(GO:0032154) cell surface furrow(GO:0097610) |
| 0.0 | 0.4 | GO:0016327 | apicolateral plasma membrane(GO:0016327) |
| 0.0 | 0.8 | GO:0031941 | filamentous actin(GO:0031941) |
| 0.0 | 1.0 | GO:0098791 | Golgi subcompartment(GO:0098791) |
| 0.0 | 0.9 | GO:0005778 | peroxisomal membrane(GO:0005778) microbody membrane(GO:0031903) |
| 0.0 | 2.1 | GO:0090575 | RNA polymerase II transcription factor complex(GO:0090575) |
Gene overrepresentation in molecular function category:
| Log-likelihood per target | Total log-likelihood | Term | Description |
|---|---|---|---|
| 0.6 | 2.9 | GO:0003839 | gamma-glutamylcyclotransferase activity(GO:0003839) |
| 0.5 | 2.7 | GO:0032810 | sterol response element binding(GO:0032810) |
| 0.5 | 1.4 | GO:0070890 | L-ascorbate:sodium symporter activity(GO:0008520) L-ascorbic acid transporter activity(GO:0015229) sodium-dependent L-ascorbate transmembrane transporter activity(GO:0070890) |
| 0.4 | 1.2 | GO:0035605 | peptidyl-cysteine S-nitrosylase activity(GO:0035605) |
| 0.3 | 1.3 | GO:0030280 | structural constituent of epidermis(GO:0030280) |
| 0.2 | 4.9 | GO:0051787 | misfolded protein binding(GO:0051787) |
| 0.2 | 0.6 | GO:0030614 | oxidoreductase activity, acting on a sulfur group of donors, quinone or similar compound as acceptor(GO:0016672) oxidoreductase activity, acting on phosphorus or arsenic in donors(GO:0030613) oxidoreductase activity, acting on phosphorus or arsenic in donors, disulfide as acceptor(GO:0030614) glutathione dehydrogenase (ascorbate) activity(GO:0045174) methylarsonate reductase activity(GO:0050610) |
| 0.2 | 1.0 | GO:0003986 | acetyl-CoA hydrolase activity(GO:0003986) |
| 0.2 | 0.5 | GO:0005333 | norepinephrine transmembrane transporter activity(GO:0005333) |
| 0.2 | 1.1 | GO:0016812 | nucleobase binding(GO:0002054) hydrolase activity, acting on carbon-nitrogen (but not peptide) bonds, in cyclic amides(GO:0016812) |
| 0.2 | 0.9 | GO:0016401 | palmitoyl-CoA oxidase activity(GO:0016401) |
| 0.2 | 1.4 | GO:0005007 | fibroblast growth factor-activated receptor activity(GO:0005007) |
| 0.1 | 1.8 | GO:0046933 | proton-transporting ATP synthase activity, rotational mechanism(GO:0046933) |
| 0.1 | 0.5 | GO:0005250 | A-type (transient outward) potassium channel activity(GO:0005250) |
| 0.1 | 0.4 | GO:0050833 | pyruvate transmembrane transporter activity(GO:0050833) |
| 0.1 | 1.3 | GO:0047372 | acylglycerol lipase activity(GO:0047372) |
| 0.1 | 1.6 | GO:0016805 | dipeptidase activity(GO:0016805) |
| 0.1 | 0.4 | GO:0051373 | FATZ binding(GO:0051373) |
| 0.1 | 0.6 | GO:0035662 | Toll-like receptor 4 binding(GO:0035662) |
| 0.1 | 0.4 | GO:0004719 | protein-L-isoaspartate (D-aspartate) O-methyltransferase activity(GO:0004719) |
| 0.1 | 0.2 | GO:0004947 | bradykinin receptor activity(GO:0004947) |
| 0.1 | 0.3 | GO:0038049 | glucocorticoid receptor activity(GO:0004883) transcription factor activity, ligand-activated RNA polymerase II transcription factor binding(GO:0038049) glucocorticoid-activated RNA polymerase II transcription factor binding transcription factor activity(GO:0038051) |
| 0.1 | 0.5 | GO:0005344 | oxygen transporter activity(GO:0005344) |
| 0.1 | 0.7 | GO:0004791 | thioredoxin-disulfide reductase activity(GO:0004791) |
| 0.1 | 0.2 | GO:0015410 | manganese-transporting ATPase activity(GO:0015410) |
| 0.1 | 5.7 | GO:0008170 | N-methyltransferase activity(GO:0008170) |
| 0.1 | 1.3 | GO:0005212 | structural constituent of eye lens(GO:0005212) |
| 0.0 | 0.7 | GO:0031386 | protein tag(GO:0031386) |
| 0.0 | 0.3 | GO:0004985 | opioid receptor activity(GO:0004985) |
| 0.0 | 0.4 | GO:0036122 | BMP binding(GO:0036122) |
| 0.0 | 0.4 | GO:0086080 | protein binding involved in heterotypic cell-cell adhesion(GO:0086080) |
| 0.0 | 2.2 | GO:0008028 | monocarboxylic acid transmembrane transporter activity(GO:0008028) |
| 0.0 | 0.6 | GO:0008106 | alcohol dehydrogenase (NADP+) activity(GO:0008106) |
| 0.0 | 1.0 | GO:0043295 | glutathione peroxidase activity(GO:0004602) glutathione binding(GO:0043295) oligopeptide binding(GO:1900750) |
| 0.0 | 0.2 | GO:0009019 | tRNA (guanine-N1-)-methyltransferase activity(GO:0009019) |
| 0.0 | 0.1 | GO:0004962 | endothelin receptor activity(GO:0004962) |
| 0.0 | 0.4 | GO:0004955 | prostaglandin receptor activity(GO:0004955) |
| 0.0 | 1.0 | GO:0000062 | fatty-acyl-CoA binding(GO:0000062) |
| 0.0 | 0.5 | GO:0015929 | hexosaminidase activity(GO:0015929) |
| 0.0 | 0.9 | GO:0005086 | ARF guanyl-nucleotide exchange factor activity(GO:0005086) |
| 0.0 | 0.7 | GO:0008137 | NADH dehydrogenase (ubiquinone) activity(GO:0008137) NADH dehydrogenase (quinone) activity(GO:0050136) |
| 0.0 | 0.1 | GO:0045322 | unmethylated CpG binding(GO:0045322) |
| 0.0 | 0.3 | GO:0070097 | delta-catenin binding(GO:0070097) |
| 0.0 | 0.6 | GO:0005242 | inward rectifier potassium channel activity(GO:0005242) |
| 0.0 | 0.3 | GO:0045294 | alpha-catenin binding(GO:0045294) |
| 0.0 | 0.8 | GO:0003785 | actin monomer binding(GO:0003785) |
| 0.0 | 0.4 | GO:0005251 | delayed rectifier potassium channel activity(GO:0005251) |
| 0.0 | 0.3 | GO:0004708 | MAP kinase kinase activity(GO:0004708) |
| 0.0 | 0.3 | GO:0043495 | protein anchor(GO:0043495) |
| 0.0 | 1.0 | GO:0005544 | calcium-dependent phospholipid binding(GO:0005544) |
| 0.0 | 0.4 | GO:0031434 | mitogen-activated protein kinase kinase binding(GO:0031434) |
| 0.0 | 0.3 | GO:0005003 | ephrin receptor activity(GO:0005003) |
| 0.0 | 0.8 | GO:0005547 | phosphatidylinositol-3,4,5-trisphosphate binding(GO:0005547) |
| 0.0 | 2.0 | GO:0052689 | carboxylic ester hydrolase activity(GO:0052689) |
| 0.0 | 0.3 | GO:0016881 | acid-amino acid ligase activity(GO:0016881) |
| 0.0 | 1.0 | GO:0002039 | p53 binding(GO:0002039) |
Gene overrepresentation in curated gene sets: canonical pathways category:
| Log-likelihood per target | Total log-likelihood | Term | Description |
|---|---|---|---|
| 0.1 | 3.9 | PID MYC REPRESS PATHWAY | Validated targets of C-MYC transcriptional repression |
| 0.1 | 2.7 | PID RXR VDR PATHWAY | RXR and RAR heterodimerization with other nuclear receptor |
| 0.0 | 4.9 | PID E2F PATHWAY | E2F transcription factor network |
| 0.0 | 1.7 | PID FAK PATHWAY | Signaling events mediated by focal adhesion kinase |
| 0.0 | 0.3 | PID ANTHRAX PATHWAY | Cellular roles of Anthrax toxin |
| 0.0 | 1.6 | PID FGF PATHWAY | FGF signaling pathway |
| 0.0 | 0.6 | PID A6B1 A6B4 INTEGRIN PATHWAY | a6b1 and a6b4 Integrin signaling |
| 0.0 | 0.7 | ST G ALPHA I PATHWAY | G alpha i Pathway |
| 0.0 | 1.3 | PID MYC ACTIV PATHWAY | Validated targets of C-MYC transcriptional activation |
| 0.0 | 0.8 | PID HEDGEHOG GLI PATHWAY | Hedgehog signaling events mediated by Gli proteins |
| 0.0 | 0.3 | PID EPHA FWDPATHWAY | EPHA forward signaling |
Gene overrepresentation in curated gene sets: REACTOME pathways category:
| Log-likelihood per target | Total log-likelihood | Term | Description |
|---|---|---|---|
| 0.1 | 1.8 | REACTOME FORMATION OF ATP BY CHEMIOSMOTIC COUPLING | Genes involved in Formation of ATP by chemiosmotic coupling |
| 0.1 | 1.4 | REACTOME SIGNALING BY FGFR3 MUTANTS | Genes involved in Signaling by FGFR3 mutants |
| 0.1 | 1.6 | REACTOME CRMPS IN SEMA3A SIGNALING | Genes involved in CRMPs in Sema3A signaling |
| 0.1 | 1.1 | REACTOME PYRIMIDINE CATABOLISM | Genes involved in Pyrimidine catabolism |
| 0.1 | 5.4 | REACTOME PHASE II CONJUGATION | Genes involved in Phase II conjugation |
| 0.0 | 1.1 | REACTOME HORMONE SENSITIVE LIPASE HSL MEDIATED TRIACYLGLYCEROL HYDROLYSIS | Genes involved in Hormone-sensitive lipase (HSL)-mediated triacylglycerol hydrolysis |
| 0.0 | 5.1 | REACTOME RESPONSE TO ELEVATED PLATELET CYTOSOLIC CA2 | Genes involved in Response to elevated platelet cytosolic Ca2+ |
| 0.0 | 0.9 | REACTOME ALPHA LINOLENIC ACID ALA METABOLISM | Genes involved in alpha-linolenic acid (ALA) metabolism |
| 0.0 | 0.9 | REACTOME ACTIVATION OF GENES BY ATF4 | Genes involved in Activation of Genes by ATF4 |
| 0.0 | 0.7 | REACTOME ANTIGEN PRESENTATION FOLDING ASSEMBLY AND PEPTIDE LOADING OF CLASS I MHC | Genes involved in Antigen Presentation: Folding, assembly and peptide loading of class I MHC |
| 0.0 | 0.4 | REACTOME PROSTANOID LIGAND RECEPTORS | Genes involved in Prostanoid ligand receptors |
| 0.0 | 3.0 | REACTOME NUCLEAR RECEPTOR TRANSCRIPTION PATHWAY | Genes involved in Nuclear Receptor transcription pathway |
| 0.0 | 1.2 | REACTOME GLUCONEOGENESIS | Genes involved in Gluconeogenesis |
| 0.0 | 0.4 | REACTOME PURINE RIBONUCLEOSIDE MONOPHOSPHATE BIOSYNTHESIS | Genes involved in Purine ribonucleoside monophosphate biosynthesis |
| 0.0 | 0.4 | REACTOME RAF MAP KINASE CASCADE | Genes involved in RAF/MAP kinase cascade |
| 0.0 | 0.5 | REACTOME NA CL DEPENDENT NEUROTRANSMITTER TRANSPORTERS | Genes involved in Na+/Cl- dependent neurotransmitter transporters |
| 0.0 | 1.4 | REACTOME METABOLISM OF VITAMINS AND COFACTORS | Genes involved in Metabolism of vitamins and cofactors |
| 0.0 | 0.9 | REACTOME VOLTAGE GATED POTASSIUM CHANNELS | Genes involved in Voltage gated Potassium channels |
| 0.0 | 0.7 | REACTOME G ALPHA Z SIGNALLING EVENTS | Genes involved in G alpha (z) signalling events |
| 0.0 | 0.3 | REACTOME ACTIVATED TAK1 MEDIATES P38 MAPK ACTIVATION | Genes involved in activated TAK1 mediates p38 MAPK activation |
| 0.0 | 0.3 | REACTOME APOPTOTIC CLEAVAGE OF CELL ADHESION PROTEINS | Genes involved in Apoptotic cleavage of cell adhesion proteins |
| 0.0 | 0.6 | REACTOME ASSOCIATION OF TRIC CCT WITH TARGET PROTEINS DURING BIOSYNTHESIS | Genes involved in Association of TriC/CCT with target proteins during biosynthesis |
| 0.0 | 0.6 | REACTOME INHIBITION OF VOLTAGE GATED CA2 CHANNELS VIA GBETA GAMMA SUBUNITS | Genes involved in Inhibition of voltage gated Ca2+ channels via Gbeta/gamma subunits |