Project
GSE58827: Dynamics of the Mouse Liver
Navigation
Downloads
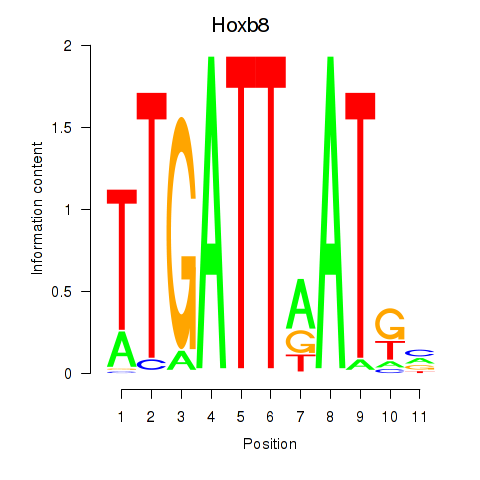
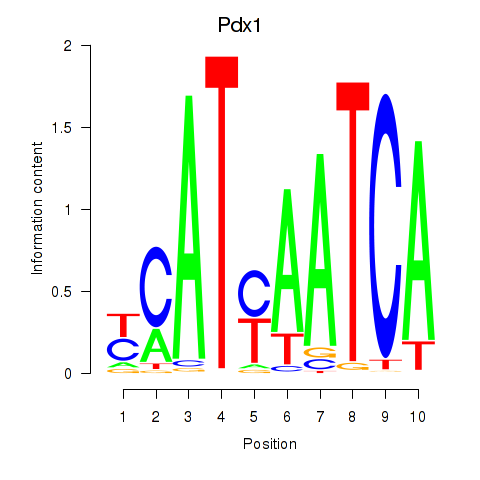
Results for Hoxb8_Pdx1
Z-value: 1.26
Motif logo
Transcription factors associated with Hoxb8_Pdx1
| Gene Symbol | Gene ID | Gene Info |
|---|---|---|
|
Hoxb8
|
ENSMUSG00000056648.4 | homeobox B8 |
|
Pdx1
|
ENSMUSG00000029644.6 | pancreatic and duodenal homeobox 1 |
Activity-expression correlation:
| Gene | Promoter | Pearson corr. coef. | P-value | Plot |
|---|---|---|---|---|
| Hoxb8 | mm10_v2_chr11_+_96282529_96282556 | -0.41 | 1.3e-02 | Click! |
| Pdx1 | mm10_v2_chr5_+_147269959_147270102 | -0.24 | 1.6e-01 | Click! |
Activity profile of Hoxb8_Pdx1 motif
Sorted Z-values of Hoxb8_Pdx1 motif
| Promoter | Log-likelihood | Transcript | Gene | Gene Info |
|---|---|---|---|---|
| chr1_+_130826762 | 17.70 |
ENSMUST00000133792.1
|
Pigr
|
polymeric immunoglobulin receptor |
| chr11_-_58613481 | 10.98 |
ENSMUST00000048801.7
|
2210407C18Rik
|
RIKEN cDNA 2210407C18 gene |
| chr13_-_23914998 | 9.97 |
ENSMUST00000021769.8
ENSMUST00000110407.2 |
Slc17a4
|
solute carrier family 17 (sodium phosphate), member 4 |
| chr19_+_4711153 | 9.80 |
ENSMUST00000008991.6
|
Sptbn2
|
spectrin beta, non-erythrocytic 2 |
| chr8_-_110039330 | 7.60 |
ENSMUST00000109222.2
|
Chst4
|
carbohydrate (chondroitin 6/keratan) sulfotransferase 4 |
| chr6_-_89216237 | 7.44 |
ENSMUST00000079186.2
|
Gm839
|
predicted gene 839 |
| chr6_+_124304646 | 6.95 |
ENSMUST00000112541.2
ENSMUST00000032234.2 |
Cd163
|
CD163 antigen |
| chr8_-_5105232 | 6.83 |
ENSMUST00000023835.1
|
Slc10a2
|
solute carrier family 10, member 2 |
| chr7_-_46742979 | 6.79 |
ENSMUST00000128088.1
|
Saa1
|
serum amyloid A 1 |
| chr7_+_46751832 | 5.79 |
ENSMUST00000075982.2
|
Saa2
|
serum amyloid A 2 |
| chr7_+_131032061 | 5.61 |
ENSMUST00000084509.3
|
Dmbt1
|
deleted in malignant brain tumors 1 |
| chr11_-_84167466 | 5.58 |
ENSMUST00000050771.7
|
Gm11437
|
predicted gene 11437 |
| chr5_-_86926521 | 5.54 |
ENSMUST00000031183.2
|
Ugt2b1
|
UDP glucuronosyltransferase 2 family, polypeptide B1 |
| chr11_-_49113757 | 5.51 |
ENSMUST00000060398.1
|
Olfr1396
|
olfactory receptor 1396 |
| chrX_-_143933089 | 5.39 |
ENSMUST00000087313.3
|
Dcx
|
doublecortin |
| chr7_+_44384098 | 5.37 |
ENSMUST00000118962.1
ENSMUST00000118831.1 |
Syt3
|
synaptotagmin III |
| chr10_-_41709297 | 5.20 |
ENSMUST00000019955.9
ENSMUST00000099932.3 |
Ccdc162
|
coiled-coil domain containing 162 |
| chr6_+_128662379 | 4.07 |
ENSMUST00000032518.4
|
Clec2h
|
C-type lectin domain family 2, member h |
| chr19_+_30232921 | 3.89 |
ENSMUST00000025797.5
|
Mbl2
|
mannose-binding lectin (protein C) 2 |
| chr15_+_31224371 | 3.88 |
ENSMUST00000044524.9
|
Dap
|
death-associated protein |
| chr14_+_55560904 | 3.71 |
ENSMUST00000072530.4
ENSMUST00000128490.1 |
Dcaf11
|
DDB1 and CUL4 associated factor 11 |
| chr1_+_88134786 | 3.60 |
ENSMUST00000113134.1
ENSMUST00000140092.1 |
Ugt1a6a
|
UDP glucuronosyltransferase 1 family, polypeptide A6A |
| chr10_+_21377290 | 3.52 |
ENSMUST00000042699.7
ENSMUST00000159163.1 |
Aldh8a1
|
aldehyde dehydrogenase 8 family, member A1 |
| chr12_+_108334341 | 3.45 |
ENSMUST00000021684.4
|
Cyp46a1
|
cytochrome P450, family 46, subfamily a, polypeptide 1 |
| chr8_-_94696223 | 3.32 |
ENSMUST00000034227.4
|
Pllp
|
plasma membrane proteolipid |
| chr3_-_20275659 | 3.30 |
ENSMUST00000011607.5
|
Cpb1
|
carboxypeptidase B1 (tissue) |
| chr1_+_88103229 | 3.18 |
ENSMUST00000113135.3
ENSMUST00000113138.1 |
Ugt1a6a
Ugt1a6b
|
UDP glucuronosyltransferase 1 family, polypeptide A6A UDP glucuronosyltransferase 1 family, polypeptide A6B |
| chr3_+_130617645 | 3.13 |
ENSMUST00000163620.1
|
Etnppl
|
ethanolamine phosphate phospholyase |
| chr5_-_87140318 | 3.11 |
ENSMUST00000067790.6
ENSMUST00000113327.1 |
Ugt2b5
|
UDP glucuronosyltransferase 2 family, polypeptide B5 |
| chr14_+_55560480 | 3.10 |
ENSMUST00000121622.1
ENSMUST00000143431.1 ENSMUST00000150481.1 |
Dcaf11
|
DDB1 and CUL4 associated factor 11 |
| chr13_+_4059565 | 3.10 |
ENSMUST00000041768.6
|
Akr1c14
|
aldo-keto reductase family 1, member C14 |
| chr5_-_87424201 | 2.99 |
ENSMUST00000072818.5
|
Ugt2b38
|
UDP glucuronosyltransferase 2 family, polypeptide B38 |
| chr1_-_82586781 | 2.97 |
ENSMUST00000087050.5
|
Col4a4
|
collagen, type IV, alpha 4 |
| chr2_-_84775420 | 2.94 |
ENSMUST00000111641.1
|
Serping1
|
serine (or cysteine) peptidase inhibitor, clade G, member 1 |
| chr3_+_130617448 | 2.91 |
ENSMUST00000166187.1
ENSMUST00000072271.6 |
Etnppl
|
ethanolamine phosphate phospholyase |
| chr18_-_31820413 | 2.88 |
ENSMUST00000165131.2
|
Gm6665
|
predicted gene 6665 |
| chr2_-_177925604 | 2.87 |
ENSMUST00000108934.2
ENSMUST00000081529.4 |
C330013J21Rik
|
RIKEN cDNA C330013J21 gene |
| chr2_-_148045891 | 2.84 |
ENSMUST00000109964.1
|
Foxa2
|
forkhead box A2 |
| chr9_-_70141484 | 2.84 |
ENSMUST00000034749.8
|
Fam81a
|
family with sequence similarity 81, member A |
| chr1_-_162866502 | 2.83 |
ENSMUST00000046049.7
|
Fmo1
|
flavin containing monooxygenase 1 |
| chr1_-_162898484 | 2.78 |
ENSMUST00000143123.1
|
Fmo2
|
flavin containing monooxygenase 2 |
| chr17_-_34804546 | 2.75 |
ENSMUST00000025223.8
|
Cyp21a1
|
cytochrome P450, family 21, subfamily a, polypeptide 1 |
| chr2_-_84775388 | 2.74 |
ENSMUST00000023994.3
|
Serping1
|
serine (or cysteine) peptidase inhibitor, clade G, member 1 |
| chr3_+_62419668 | 2.69 |
ENSMUST00000161057.1
|
Arhgef26
|
Rho guanine nucleotide exchange factor (GEF) 26 |
| chr16_+_96361654 | 2.65 |
ENSMUST00000113794.1
|
Igsf5
|
immunoglobulin superfamily, member 5 |
| chr2_+_126034967 | 2.57 |
ENSMUST00000110442.1
|
Fgf7
|
fibroblast growth factor 7 |
| chr3_+_135281221 | 2.51 |
ENSMUST00000120397.1
ENSMUST00000171974.1 ENSMUST00000029817.7 |
Bdh2
|
3-hydroxybutyrate dehydrogenase, type 2 |
| chr10_+_57784859 | 2.46 |
ENSMUST00000020024.5
|
Fabp7
|
fatty acid binding protein 7, brain |
| chr17_+_37193889 | 2.46 |
ENSMUST00000038844.6
|
Ubd
|
ubiquitin D |
| chr19_-_4498574 | 2.45 |
ENSMUST00000048482.6
|
2010003K11Rik
|
RIKEN cDNA 2010003K11 gene |
| chr3_-_107943705 | 2.44 |
ENSMUST00000106680.1
ENSMUST00000106684.1 ENSMUST00000106685.2 |
Gstm6
|
glutathione S-transferase, mu 6 |
| chr16_+_56204313 | 2.41 |
ENSMUST00000160116.1
ENSMUST00000069936.7 |
Impg2
|
interphotoreceptor matrix proteoglycan 2 |
| chr3_-_107943390 | 2.39 |
ENSMUST00000106681.1
|
Gstm6
|
glutathione S-transferase, mu 6 |
| chr11_-_106580594 | 2.37 |
ENSMUST00000153870.1
|
Tex2
|
testis expressed gene 2 |
| chr16_+_22951072 | 2.36 |
ENSMUST00000023590.8
|
Hrg
|
histidine-rich glycoprotein |
| chr5_-_130024280 | 2.32 |
ENSMUST00000161640.1
ENSMUST00000161884.1 ENSMUST00000161094.1 |
Asl
|
argininosuccinate lyase |
| chr13_+_23807027 | 2.30 |
ENSMUST00000006786.4
ENSMUST00000099697.2 |
Slc17a2
|
solute carrier family 17 (sodium phosphate), member 2 |
| chr10_+_57784914 | 2.30 |
ENSMUST00000165013.1
|
Fabp7
|
fatty acid binding protein 7, brain |
| chr16_-_46155077 | 2.28 |
ENSMUST00000059524.5
|
Gm4737
|
predicted gene 4737 |
| chr3_-_107943362 | 2.25 |
ENSMUST00000106683.1
|
Gstm6
|
glutathione S-transferase, mu 6 |
| chr4_-_109202217 | 2.23 |
ENSMUST00000160774.1
ENSMUST00000030288.7 ENSMUST00000162787.2 |
Osbpl9
|
oxysterol binding protein-like 9 |
| chr14_+_55559993 | 2.22 |
ENSMUST00000117236.1
|
Dcaf11
|
DDB1 and CUL4 associated factor 11 |
| chr11_+_103103051 | 2.22 |
ENSMUST00000152971.1
|
Acbd4
|
acyl-Coenzyme A binding domain containing 4 |
| chr18_-_10706688 | 2.19 |
ENSMUST00000002549.7
ENSMUST00000117726.1 ENSMUST00000117828.1 |
Abhd3
|
abhydrolase domain containing 3 |
| chr5_-_89457763 | 2.16 |
ENSMUST00000049209.8
|
Gc
|
group specific component |
| chr15_+_87625214 | 2.12 |
ENSMUST00000068088.6
|
Fam19a5
|
family with sequence similarity 19, member A5 |
| chr4_+_102589687 | 2.10 |
ENSMUST00000097949.4
ENSMUST00000106901.1 |
Pde4b
|
phosphodiesterase 4B, cAMP specific |
| chr4_-_35157404 | 2.10 |
ENSMUST00000102975.3
|
Mob3b
|
MOB kinase activator 3B |
| chr1_+_88166004 | 2.07 |
ENSMUST00000097659.4
|
Ugt1a5
|
UDP glucuronosyltransferase 1 family, polypeptide A5 |
| chr12_-_103904887 | 2.06 |
ENSMUST00000074051.5
|
Serpina1c
|
serine (or cysteine) peptidase inhibitor, clade A, member 1C |
| chr3_-_65392579 | 2.06 |
ENSMUST00000029414.5
|
Ssr3
|
signal sequence receptor, gamma |
| chrX_-_143933204 | 2.06 |
ENSMUST00000112851.1
ENSMUST00000112856.2 ENSMUST00000033642.3 |
Dcx
|
doublecortin |
| chr12_-_103863551 | 2.05 |
ENSMUST00000085056.6
ENSMUST00000072876.5 ENSMUST00000124717.1 |
Serpina1a
|
serine (or cysteine) peptidase inhibitor, clade A, member 1A |
| chr14_+_55560010 | 2.03 |
ENSMUST00000147981.1
ENSMUST00000133256.1 |
Dcaf11
|
DDB1 and CUL4 associated factor 11 |
| chr13_+_24802020 | 2.00 |
ENSMUST00000155575.1
|
BC005537
|
cDNA sequence BC005537 |
| chr6_-_136875794 | 1.95 |
ENSMUST00000032342.1
|
Mgp
|
matrix Gla protein |
| chr2_-_160872552 | 1.94 |
ENSMUST00000103111.2
|
Zhx3
|
zinc fingers and homeoboxes 3 |
| chr18_-_35498856 | 1.91 |
ENSMUST00000025215.8
|
Sil1
|
endoplasmic reticulum chaperone SIL1 homolog (S. cerevisiae) |
| chr6_-_119388671 | 1.86 |
ENSMUST00000169744.1
|
Adipor2
|
adiponectin receptor 2 |
| chr13_+_4233730 | 1.86 |
ENSMUST00000081326.6
|
Akr1c19
|
aldo-keto reductase family 1, member C19 |
| chrX_-_36874111 | 1.84 |
ENSMUST00000047486.5
|
C330007P06Rik
|
RIKEN cDNA C330007P06 gene |
| chr19_+_45076105 | 1.84 |
ENSMUST00000026234.4
|
Kazald1
|
Kazal-type serine peptidase inhibitor domain 1 |
| chr7_+_24257644 | 1.82 |
ENSMUST00000072713.6
|
Zfp108
|
zinc finger protein 108 |
| chr5_+_43233928 | 1.81 |
ENSMUST00000114066.1
ENSMUST00000114065.1 |
Cpeb2
|
cytoplasmic polyadenylation element binding protein 2 |
| chr2_-_86347764 | 1.79 |
ENSMUST00000099894.2
|
Olfr1055
|
olfactory receptor 1055 |
| chr6_-_124542281 | 1.79 |
ENSMUST00000159463.1
ENSMUST00000162844.1 ENSMUST00000160505.1 ENSMUST00000162443.1 |
C1s
|
complement component 1, s subcomponent |
| chr1_-_9967932 | 1.70 |
ENSMUST00000185184.1
|
Tcf24
|
transcription factor 24 |
| chr2_+_116067213 | 1.70 |
ENSMUST00000152412.1
|
G630016G05Rik
|
RIKEN cDNA G630016G05 gene |
| chr11_-_31671727 | 1.68 |
ENSMUST00000109415.1
|
Bod1
|
biorientation of chromosomes in cell division 1 |
| chr6_-_21851914 | 1.67 |
ENSMUST00000134635.1
ENSMUST00000123116.1 ENSMUST00000120965.1 |
Tspan12
|
tetraspanin 12 |
| chr13_-_85127514 | 1.67 |
ENSMUST00000179230.1
|
Gm4076
|
predicted gene 4076 |
| chr6_-_83677807 | 1.64 |
ENSMUST00000037882.6
|
Cd207
|
CD207 antigen |
| chr3_+_66985647 | 1.63 |
ENSMUST00000162362.1
ENSMUST00000065074.7 |
Rsrc1
|
arginine/serine-rich coiled-coil 1 |
| chr2_+_126034647 | 1.62 |
ENSMUST00000064794.7
|
Fgf7
|
fibroblast growth factor 7 |
| chr4_+_102421518 | 1.61 |
ENSMUST00000106904.2
|
Pde4b
|
phosphodiesterase 4B, cAMP specific |
| chr2_-_52676571 | 1.60 |
ENSMUST00000178799.1
|
Cacnb4
|
calcium channel, voltage-dependent, beta 4 subunit |
| chr11_+_104231390 | 1.60 |
ENSMUST00000106992.3
|
Mapt
|
microtubule-associated protein tau |
| chr16_-_37384915 | 1.59 |
ENSMUST00000114787.1
ENSMUST00000114782.1 ENSMUST00000023526.2 ENSMUST00000114775.1 |
Stxbp5l
|
syntaxin binding protein 5-like |
| chr5_+_92683625 | 1.59 |
ENSMUST00000168878.1
|
Shroom3
|
shroom family member 3 |
| chr14_-_55560340 | 1.59 |
ENSMUST00000066106.3
|
A730061H03Rik
|
RIKEN cDNA A730061H03 gene |
| chr16_+_90738324 | 1.58 |
ENSMUST00000038197.2
|
Mrap
|
melanocortin 2 receptor accessory protein |
| chr10_+_4611971 | 1.57 |
ENSMUST00000105590.1
ENSMUST00000067086.7 |
Esr1
|
estrogen receptor 1 (alpha) |
| chr17_-_34862122 | 1.56 |
ENSMUST00000154526.1
|
Cfb
|
complement factor B |
| chr2_-_160872829 | 1.54 |
ENSMUST00000176141.1
|
Zhx3
|
zinc fingers and homeoboxes 3 |
| chr5_+_43233463 | 1.53 |
ENSMUST00000169035.1
ENSMUST00000166713.1 |
Cpeb2
|
cytoplasmic polyadenylation element binding protein 2 |
| chr3_+_66985700 | 1.53 |
ENSMUST00000046542.6
ENSMUST00000162693.1 |
Rsrc1
|
arginine/serine-rich coiled-coil 1 |
| chr14_+_51007911 | 1.49 |
ENSMUST00000022424.6
|
Rnase10
|
ribonuclease, RNase A family, 10 (non-active) |
| chr17_-_34862473 | 1.47 |
ENSMUST00000025229.4
ENSMUST00000176203.2 ENSMUST00000128767.1 |
Cfb
|
complement factor B |
| chr3_-_65392546 | 1.46 |
ENSMUST00000119896.1
|
Ssr3
|
signal sequence receptor, gamma |
| chr9_+_40269202 | 1.46 |
ENSMUST00000114956.3
ENSMUST00000049941.5 |
Scn3b
|
sodium channel, voltage-gated, type III, beta |
| chr12_+_14494561 | 1.44 |
ENSMUST00000052528.3
|
Gm9847
|
predicted pseudogene 9847 |
| chr8_+_118283719 | 1.44 |
ENSMUST00000117160.1
|
Cdh13
|
cadherin 13 |
| chr2_+_125859134 | 1.42 |
ENSMUST00000028636.6
ENSMUST00000125084.1 |
Galk2
|
galactokinase 2 |
| chr7_+_43995833 | 1.41 |
ENSMUST00000007156.4
|
Klk1b11
|
kallikrein 1-related peptidase b11 |
| chr11_+_104231573 | 1.39 |
ENSMUST00000132977.1
ENSMUST00000132245.1 ENSMUST00000100347.4 |
Mapt
|
microtubule-associated protein tau |
| chr4_+_147492417 | 1.37 |
ENSMUST00000105721.2
|
Gm13152
|
predicted gene 13152 |
| chr19_+_24875679 | 1.36 |
ENSMUST00000073080.5
|
Gm10053
|
predicted gene 10053 |
| chr16_-_37384940 | 1.33 |
ENSMUST00000114781.1
ENSMUST00000114780.1 |
Stxbp5l
|
syntaxin binding protein 5-like |
| chr4_+_116596672 | 1.32 |
ENSMUST00000051869.7
|
Ccdc17
|
coiled-coil domain containing 17 |
| chr1_+_10993452 | 1.30 |
ENSMUST00000027056.5
|
Prex2
|
phosphatidylinositol-3,4,5-trisphosphate-dependent Rac exchange factor 2 |
| chr2_-_160872985 | 1.28 |
ENSMUST00000109460.1
ENSMUST00000127201.1 |
Zhx3
|
zinc fingers and homeoboxes 3 |
| chr15_+_39006272 | 1.26 |
ENSMUST00000179165.1
ENSMUST00000022906.7 |
Fzd6
|
frizzled homolog 6 (Drosophila) |
| chr9_+_110880321 | 1.26 |
ENSMUST00000155014.1
|
Als2cl
|
ALS2 C-terminal like |
| chr10_-_89533550 | 1.25 |
ENSMUST00000105297.1
|
Nr1h4
|
nuclear receptor subfamily 1, group H, member 4 |
| chr9_-_71163224 | 1.24 |
ENSMUST00000074465.2
|
Aqp9
|
aquaporin 9 |
| chr1_+_93512079 | 1.24 |
ENSMUST00000120301.1
ENSMUST00000041983.4 ENSMUST00000122402.1 |
Farp2
|
FERM, RhoGEF and pleckstrin domain protein 2 |
| chr1_-_164935522 | 1.23 |
ENSMUST00000027860.7
|
Xcl1
|
chemokine (C motif) ligand 1 |
| chr3_+_65109343 | 1.20 |
ENSMUST00000159525.1
ENSMUST00000049230.8 |
Kcnab1
|
potassium voltage-gated channel, shaker-related subfamily, beta member 1 |
| chr10_+_4710119 | 1.20 |
ENSMUST00000105588.1
ENSMUST00000105589.1 |
Esr1
|
estrogen receptor 1 (alpha) |
| chr6_-_71262232 | 1.17 |
ENSMUST00000129630.2
ENSMUST00000114186.2 ENSMUST00000074301.3 |
Smyd1
|
SET and MYND domain containing 1 |
| chrX_+_38600626 | 1.16 |
ENSMUST00000000365.2
|
Mcts1
|
malignant T cell amplified sequence 1 |
| chr6_-_122282810 | 1.15 |
ENSMUST00000032207.8
|
Klrg1
|
killer cell lectin-like receptor subfamily G, member 1 |
| chr7_+_6995443 | 1.14 |
ENSMUST00000086248.5
|
Aurkc
|
aurora kinase C |
| chr1_+_58713241 | 1.11 |
ENSMUST00000114309.1
ENSMUST00000069333.7 |
Cflar
|
CASP8 and FADD-like apoptosis regulator |
| chr14_+_74735641 | 1.10 |
ENSMUST00000177283.1
|
Esd
|
esterase D/formylglutathione hydrolase |
| chr13_-_48513394 | 1.10 |
ENSMUST00000177530.1
ENSMUST00000176996.1 ENSMUST00000176949.1 ENSMUST00000176176.1 |
Zfp169
|
zinc finger protein 169 |
| chr11_+_72607221 | 1.09 |
ENSMUST00000021148.6
ENSMUST00000138247.1 |
Ube2g1
|
ubiquitin-conjugating enzyme E2G 1 |
| chr9_+_40269273 | 1.09 |
ENSMUST00000176185.1
|
Scn3b
|
sodium channel, voltage-gated, type III, beta |
| chr3_+_94398517 | 1.09 |
ENSMUST00000050975.3
|
Lingo4
|
leucine rich repeat and Ig domain containing 4 |
| chr6_+_37870786 | 1.09 |
ENSMUST00000120428.1
ENSMUST00000031859.7 |
Trim24
|
tripartite motif-containing 24 |
| chr8_+_25808474 | 1.07 |
ENSMUST00000033979.4
|
Star
|
steroidogenic acute regulatory protein |
| chr3_-_116968969 | 1.07 |
ENSMUST00000143611.1
ENSMUST00000040097.7 |
Palmd
|
palmdelphin |
| chr9_-_70934808 | 1.06 |
ENSMUST00000034731.8
|
Lipc
|
lipase, hepatic |
| chr11_-_100822525 | 1.06 |
ENSMUST00000107358.2
|
Stat5b
|
signal transducer and activator of transcription 5B |
| chr11_-_69695802 | 1.05 |
ENSMUST00000108649.1
ENSMUST00000174159.1 ENSMUST00000181810.1 |
BC096441
Tnfsf12
|
cDNA sequence BC096441 tumor necrosis factor (ligand) superfamily, member 12 |
| chr11_+_104231515 | 1.05 |
ENSMUST00000106993.3
|
Mapt
|
microtubule-associated protein tau |
| chr14_-_59365410 | 1.04 |
ENSMUST00000161031.1
ENSMUST00000160425.1 |
Phf11d
|
PHD finger protein 11D |
| chr6_-_28126125 | 1.04 |
ENSMUST00000115324.2
ENSMUST00000090512.3 |
Grm8
|
glutamate receptor, metabotropic 8 |
| chr4_+_102254993 | 1.02 |
ENSMUST00000106908.2
|
Pde4b
|
phosphodiesterase 4B, cAMP specific |
| chr7_-_101581161 | 1.02 |
ENSMUST00000063920.2
|
Art2b
|
ADP-ribosyltransferase 2b |
| chr5_+_31526989 | 1.02 |
ENSMUST00000114533.2
ENSMUST00000117262.1 ENSMUST00000117319.1 |
Slc4a1ap
|
solute carrier family 4 (anion exchanger), member 1, adaptor protein |
| chr4_-_42168603 | 1.01 |
ENSMUST00000098121.3
|
Gm13305
|
predicted gene 13305 |
| chr4_+_145670685 | 1.01 |
ENSMUST00000105738.2
|
Gm13242
|
predicted gene 13242 |
| chr17_+_64600702 | 1.00 |
ENSMUST00000086723.3
|
Man2a1
|
mannosidase 2, alpha 1 |
| chr3_+_19957088 | 1.00 |
ENSMUST00000108328.1
|
Cp
|
ceruloplasmin |
| chr11_-_69695521 | 1.00 |
ENSMUST00000181261.1
|
Tnfsf12
|
tumor necrosis factor (ligand) superfamily, member 12 |
| chrX_-_106011874 | 0.99 |
ENSMUST00000033583.7
ENSMUST00000151689.1 |
Magt1
|
magnesium transporter 1 |
| chr17_-_40914350 | 0.99 |
ENSMUST00000166343.1
|
Glyatl3
|
glycine-N-acyltransferase-like 3 |
| chr3_+_19957037 | 0.99 |
ENSMUST00000091309.5
ENSMUST00000108329.1 ENSMUST00000003714.6 |
Cp
|
ceruloplasmin |
| chr18_+_56562443 | 0.98 |
ENSMUST00000130163.1
ENSMUST00000132628.1 |
Phax
|
phosphorylated adaptor for RNA export |
| chr8_-_67818284 | 0.98 |
ENSMUST00000120071.1
|
Psd3
|
pleckstrin and Sec7 domain containing 3 |
| chr9_-_50739365 | 0.97 |
ENSMUST00000117093.1
ENSMUST00000121634.1 |
Dixdc1
|
DIX domain containing 1 |
| chr2_-_164221605 | 0.97 |
ENSMUST00000018355.4
ENSMUST00000109376.2 |
Wfdc15b
|
WAP four-disulfide core domain 15B |
| chr3_-_57294880 | 0.95 |
ENSMUST00000171384.1
|
Tm4sf1
|
transmembrane 4 superfamily member 1 |
| chr3_-_79145875 | 0.94 |
ENSMUST00000118340.1
|
Rapgef2
|
Rap guanine nucleotide exchange factor (GEF) 2 |
| chr6_+_48554776 | 0.94 |
ENSMUST00000114545.1
ENSMUST00000153222.1 ENSMUST00000101436.2 |
Lrrc61
|
leucine rich repeat containing 61 |
| chr11_-_69695753 | 0.94 |
ENSMUST00000180946.1
|
Tnfsf12
|
tumor necrosis factor (ligand) superfamily, member 12 |
| chr13_-_4609122 | 0.94 |
ENSMUST00000110691.3
ENSMUST00000091848.5 |
Akr1e1
|
aldo-keto reductase family 1, member E1 |
| chr13_-_48273865 | 0.94 |
ENSMUST00000180777.1
|
A330048O09Rik
|
RIKEN cDNA A330048O09 gene |
| chr19_+_20405280 | 0.94 |
ENSMUST00000179640.1
|
1500015L24Rik
|
RIKEN cDNA 1500015L24 gene |
| chr9_+_121710389 | 0.93 |
ENSMUST00000035113.9
|
Deb1
|
differentially expressed in B16F10 1 |
| chrM_-_14060 | 0.93 |
ENSMUST00000082419.1
|
mt-Nd6
|
mitochondrially encoded NADH dehydrogenase 6 |
| chr5_+_106609098 | 0.91 |
ENSMUST00000167618.1
|
Gm17304
|
predicted gene, 17304 |
| chr12_+_112588753 | 0.91 |
ENSMUST00000101029.2
|
Inf2
|
inverted formin, FH2 and WH2 domain containing |
| chr3_+_151437887 | 0.91 |
ENSMUST00000046977.7
|
Eltd1
|
EGF, latrophilin seven transmembrane domain containing 1 |
| chrM_+_9452 | 0.90 |
ENSMUST00000082411.1
|
mt-Nd3
|
mitochondrially encoded NADH dehydrogenase 3 |
| chr8_+_13435459 | 0.90 |
ENSMUST00000167071.1
ENSMUST00000167505.1 |
Tmem255b
|
transmembrane protein 255B |
| chr11_-_54249640 | 0.89 |
ENSMUST00000019060.5
|
Csf2
|
colony stimulating factor 2 (granulocyte-macrophage) |
| chr10_+_121365078 | 0.89 |
ENSMUST00000040344.6
|
Gns
|
glucosamine (N-acetyl)-6-sulfatase |
| chr2_-_125859139 | 0.89 |
ENSMUST00000110463.1
ENSMUST00000028635.5 |
Cops2
|
COP9 (constitutive photomorphogenic) homolog, subunit 2 (Arabidopsis thaliana) |
| chr3_-_116712644 | 0.89 |
ENSMUST00000029569.2
|
Slc35a3
|
solute carrier family 35 (UDP-N-acetylglucosamine (UDP-GlcNAc) transporter), member 3 |
| chrX_-_73097017 | 0.89 |
ENSMUST00000114524.2
ENSMUST00000074619.5 |
Xlr3a
|
X-linked lymphocyte-regulated 3A |
| chr4_-_150003130 | 0.88 |
ENSMUST00000084117.6
|
H6pd
|
hexose-6-phosphate dehydrogenase (glucose 1-dehydrogenase) |
| chr11_+_94327984 | 0.88 |
ENSMUST00000107818.2
ENSMUST00000051221.6 |
Ankrd40
|
ankyrin repeat domain 40 |
| chr8_-_67818218 | 0.86 |
ENSMUST00000059374.4
|
Psd3
|
pleckstrin and Sec7 domain containing 3 |
| chr5_-_66054499 | 0.86 |
ENSMUST00000145625.1
|
Rbm47
|
RNA binding motif protein 47 |
| chr5_+_138363719 | 0.86 |
ENSMUST00000100526.2
|
Gm10874
|
predicted gene 10874 |
| chr11_-_69696058 | 0.85 |
ENSMUST00000180587.1
ENSMUST00000094070.4 |
Tnfsf12
BC096441
|
tumor necrosis factor (ligand) superfamily, member 12 cDNA sequence BC096441 |
| chr1_-_39577340 | 0.83 |
ENSMUST00000062525.5
|
Rnf149
|
ring finger protein 149 |
| chr3_-_116968827 | 0.81 |
ENSMUST00000119557.1
|
Palmd
|
palmdelphin |
| chr17_+_55892184 | 0.81 |
ENSMUST00000054780.8
|
Zfp959
|
zinc finger protein 959 |
| chr15_-_36496722 | 0.80 |
ENSMUST00000057486.7
|
Ankrd46
|
ankyrin repeat domain 46 |
| chr9_+_54538984 | 0.80 |
ENSMUST00000060242.5
ENSMUST00000118413.1 |
Sh2d7
|
SH2 domain containing 7 |
| chr7_-_49636847 | 0.80 |
ENSMUST00000032717.6
|
Dbx1
|
developing brain homeobox 1 |
| chr10_-_18227473 | 0.79 |
ENSMUST00000174592.1
|
Ccdc28a
|
coiled-coil domain containing 28A |
| chrX_+_82948861 | 0.77 |
ENSMUST00000114000.1
|
Dmd
|
dystrophin, muscular dystrophy |
| chr5_-_38491948 | 0.77 |
ENSMUST00000129099.1
|
Slc2a9
|
solute carrier family 2 (facilitated glucose transporter), member 9 |
| chr17_+_24426676 | 0.76 |
ENSMUST00000024946.5
|
Eci1
|
enoyl-Coenzyme A delta isomerase 1 |
| chr14_-_59365465 | 0.76 |
ENSMUST00000095157.4
|
Phf11d
|
PHD finger protein 11D |
| chr8_-_83332416 | 0.75 |
ENSMUST00000177594.1
ENSMUST00000053902.3 |
Elmod2
|
ELMO/CED-12 domain containing 2 |
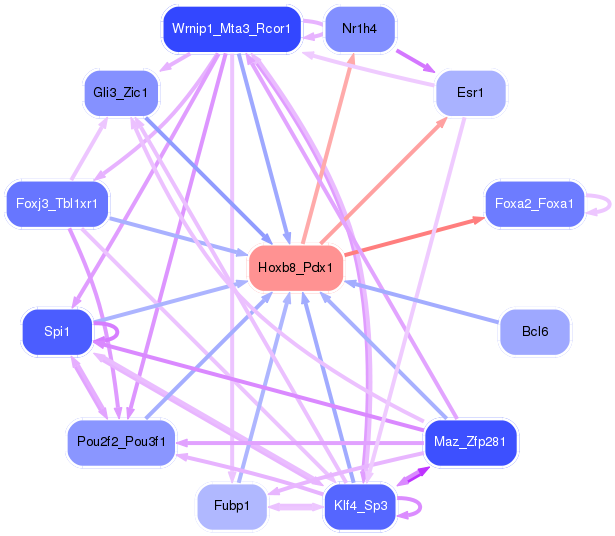
Network of associatons between targets according to the STRING database.

First level regulatory network of Hoxb8_Pdx1
Gene Ontology Analysis
Gene overrepresentation in biological process category:
| Log-likelihood per target | Total log-likelihood | Term | Description |
|---|---|---|---|
| 4.4 | 17.7 | GO:0002415 | immunoglobulin transcytosis in epithelial cells mediated by polymeric immunoglobulin receptor(GO:0002415) |
| 2.5 | 7.6 | GO:0042339 | keratan sulfate metabolic process(GO:0042339) |
| 1.9 | 5.7 | GO:0001868 | regulation of complement activation, lectin pathway(GO:0001868) negative regulation of complement activation, lectin pathway(GO:0001869) |
| 1.8 | 5.5 | GO:0018879 | biphenyl metabolic process(GO:0018879) |
| 1.4 | 4.2 | GO:0061033 | secretion by lung epithelial cell involved in lung growth(GO:0061033) |
| 0.9 | 2.8 | GO:0045013 | carbon catabolite repression of transcription(GO:0045013) negative regulation of transcription by glucose(GO:0045014) |
| 0.8 | 8.8 | GO:0052696 | flavonoid glucuronidation(GO:0052696) xenobiotic glucuronidation(GO:0052697) |
| 0.8 | 2.4 | GO:0034395 | regulation of transcription from RNA polymerase II promoter in response to iron(GO:0034395) |
| 0.8 | 2.3 | GO:0042450 | arginine biosynthetic process via ornithine(GO:0042450) |
| 0.6 | 4.2 | GO:0042905 | 9-cis-retinoic acid biosynthetic process(GO:0042904) 9-cis-retinoic acid metabolic process(GO:0042905) |
| 0.6 | 3.9 | GO:0001867 | complement activation, lectin pathway(GO:0001867) |
| 0.5 | 2.8 | GO:0072592 | oxygen metabolic process(GO:0072592) |
| 0.5 | 2.8 | GO:0060011 | Sertoli cell proliferation(GO:0060011) prostate epithelial cord elongation(GO:0060523) |
| 0.4 | 4.0 | GO:1900034 | regulation of cellular response to heat(GO:1900034) |
| 0.4 | 1.3 | GO:0035880 | embryonic nail plate morphogenesis(GO:0035880) |
| 0.4 | 3.3 | GO:0045900 | negative regulation of translational elongation(GO:0045900) |
| 0.4 | 1.2 | GO:0006808 | regulation of nitrogen utilization(GO:0006808) nitrogen utilization(GO:0019740) histone H3-R17 methylation(GO:0034971) |
| 0.4 | 3.3 | GO:0001766 | membrane raft polarization(GO:0001766) membrane raft distribution(GO:0031580) |
| 0.4 | 7.4 | GO:0048672 | positive regulation of collateral sprouting(GO:0048672) |
| 0.4 | 1.2 | GO:0071663 | immunoglobulin production in mucosal tissue(GO:0002426) granzyme B production(GO:0071613) regulation of granzyme B production(GO:0071661) positive regulation of granzyme B production(GO:0071663) positive regulation of thymocyte migration(GO:2000412) regulation of B cell chemotaxis(GO:2000537) positive regulation of B cell chemotaxis(GO:2000538) regulation of T-helper 1 cell cytokine production(GO:2000554) positive regulation of T-helper 1 cell cytokine production(GO:2000556) positive regulation of CD4-positive, alpha-beta T cell proliferation(GO:2000563) |
| 0.4 | 4.9 | GO:1901898 | negative regulation of relaxation of cardiac muscle(GO:1901898) |
| 0.4 | 1.5 | GO:1902093 | positive regulation of sperm motility(GO:1902093) |
| 0.4 | 20.1 | GO:0006953 | acute-phase response(GO:0006953) |
| 0.4 | 10.0 | GO:0021692 | cerebellar Purkinje cell layer morphogenesis(GO:0021692) |
| 0.3 | 1.0 | GO:0051030 | snRNA transport(GO:0051030) |
| 0.3 | 0.9 | GO:2000670 | positive regulation of dendritic cell apoptotic process(GO:2000670) |
| 0.3 | 1.2 | GO:0015855 | nucleobase transport(GO:0015851) pyrimidine nucleobase transport(GO:0015855) |
| 0.3 | 3.9 | GO:0016127 | cholesterol catabolic process(GO:0006707) sterol catabolic process(GO:0016127) |
| 0.3 | 5.6 | GO:0001833 | inner cell mass cell proliferation(GO:0001833) |
| 0.3 | 1.2 | GO:0002188 | translation reinitiation(GO:0002188) |
| 0.3 | 1.4 | GO:0055096 | lipoprotein particle mediated signaling(GO:0055095) low-density lipoprotein particle mediated signaling(GO:0055096) |
| 0.3 | 1.1 | GO:1901740 | skeletal muscle atrophy(GO:0014732) negative regulation of myoblast fusion(GO:1901740) regulation of hepatocyte apoptotic process(GO:1903943) negative regulation of hepatocyte apoptotic process(GO:1903944) |
| 0.3 | 1.1 | GO:0046294 | formaldehyde catabolic process(GO:0046294) |
| 0.3 | 6.8 | GO:0015721 | bile acid and bile salt transport(GO:0015721) |
| 0.3 | 1.1 | GO:0070859 | positive regulation of bile acid biosynthetic process(GO:0070859) positive regulation of bile acid metabolic process(GO:1904253) |
| 0.3 | 2.8 | GO:0070995 | NADPH oxidation(GO:0070995) |
| 0.3 | 0.8 | GO:0014809 | regulation of skeletal muscle contraction by regulation of release of sequestered calcium ion(GO:0014809) |
| 0.3 | 2.5 | GO:0060373 | regulation of atrial cardiac muscle cell membrane depolarization(GO:0060371) regulation of ventricular cardiac muscle cell membrane depolarization(GO:0060373) |
| 0.3 | 3.5 | GO:0006614 | SRP-dependent cotranslational protein targeting to membrane(GO:0006614) |
| 0.2 | 4.8 | GO:0060134 | prepulse inhibition(GO:0060134) |
| 0.2 | 3.0 | GO:0032836 | glomerular basement membrane development(GO:0032836) |
| 0.2 | 0.2 | GO:0098923 | retrograde trans-synaptic signaling by soluble gas(GO:0098923) |
| 0.2 | 0.6 | GO:1990927 | calcium ion regulated lysosome exocytosis(GO:1990927) |
| 0.2 | 1.0 | GO:0019364 | pyridine nucleotide catabolic process(GO:0019364) |
| 0.2 | 5.4 | GO:1903861 | positive regulation of dendrite extension(GO:1903861) |
| 0.2 | 2.5 | GO:0070842 | aggresome assembly(GO:0070842) |
| 0.2 | 3.0 | GO:0006957 | complement activation, alternative pathway(GO:0006957) |
| 0.2 | 2.8 | GO:0042448 | progesterone metabolic process(GO:0042448) |
| 0.2 | 0.9 | GO:0032747 | positive regulation of interleukin-23 production(GO:0032747) |
| 0.2 | 1.6 | GO:0098870 | neuronal action potential propagation(GO:0019227) action potential propagation(GO:0098870) |
| 0.2 | 0.9 | GO:0015788 | UDP-N-acetylglucosamine transport(GO:0015788) |
| 0.2 | 0.5 | GO:0002946 | tRNA C5-cytosine methylation(GO:0002946) |
| 0.2 | 0.4 | GO:0099566 | regulation of postsynaptic cytosolic calcium ion concentration(GO:0099566) |
| 0.2 | 0.5 | GO:0036269 | swimming behavior(GO:0036269) |
| 0.2 | 0.5 | GO:0060618 | nipple development(GO:0060618) |
| 0.2 | 1.1 | GO:0070562 | regulation of vitamin D receptor signaling pathway(GO:0070562) |
| 0.2 | 1.1 | GO:0071830 | very-low-density lipoprotein particle remodeling(GO:0034372) chylomicron remnant clearance(GO:0034382) triglyceride-rich lipoprotein particle clearance(GO:0071830) |
| 0.1 | 2.2 | GO:0042359 | vitamin D metabolic process(GO:0042359) |
| 0.1 | 0.4 | GO:0050955 | thermoception(GO:0050955) |
| 0.1 | 1.0 | GO:0021869 | forebrain ventricular zone progenitor cell division(GO:0021869) |
| 0.1 | 1.2 | GO:1902260 | negative regulation of delayed rectifier potassium channel activity(GO:1902260) |
| 0.1 | 1.7 | GO:0016322 | neuron remodeling(GO:0016322) |
| 0.1 | 1.8 | GO:0021902 | commitment of neuronal cell to specific neuron type in forebrain(GO:0021902) |
| 0.1 | 1.4 | GO:0006012 | galactose metabolic process(GO:0006012) |
| 0.1 | 1.9 | GO:0006968 | cellular defense response(GO:0006968) |
| 0.1 | 1.9 | GO:0033211 | adiponectin-activated signaling pathway(GO:0033211) |
| 0.1 | 12.8 | GO:0035725 | sodium ion transmembrane transport(GO:0035725) |
| 0.1 | 1.0 | GO:0006013 | mannose metabolic process(GO:0006013) |
| 0.1 | 0.4 | GO:0044778 | meiotic DNA integrity checkpoint(GO:0044778) |
| 0.1 | 0.7 | GO:0006499 | N-terminal protein myristoylation(GO:0006499) |
| 0.1 | 0.3 | GO:0007181 | transforming growth factor beta receptor complex assembly(GO:0007181) |
| 0.1 | 0.3 | GO:0019230 | proprioception(GO:0019230) |
| 0.1 | 0.8 | GO:0018026 | peptidyl-lysine monomethylation(GO:0018026) |
| 0.1 | 1.1 | GO:0051255 | spindle midzone assembly(GO:0051255) |
| 0.1 | 0.4 | GO:0001920 | negative regulation of receptor recycling(GO:0001920) |
| 0.1 | 1.0 | GO:0007196 | adenylate cyclase-inhibiting G-protein coupled glutamate receptor signaling pathway(GO:0007196) |
| 0.1 | 0.4 | GO:0006244 | pyrimidine nucleotide catabolic process(GO:0006244) pyrimidine deoxyribonucleotide catabolic process(GO:0009223) |
| 0.1 | 2.1 | GO:0001886 | endothelial cell morphogenesis(GO:0001886) |
| 0.1 | 0.5 | GO:0045590 | negative regulation of regulatory T cell differentiation(GO:0045590) |
| 0.1 | 2.5 | GO:0019184 | nonribosomal peptide biosynthetic process(GO:0019184) |
| 0.1 | 0.9 | GO:0016554 | cytidine to uridine editing(GO:0016554) |
| 0.1 | 0.3 | GO:0046368 | GDP-L-fucose metabolic process(GO:0046368) |
| 0.1 | 3.9 | GO:0034198 | cellular response to amino acid starvation(GO:0034198) |
| 0.1 | 0.2 | GO:0070315 | G1 to G0 transition involved in cell differentiation(GO:0070315) |
| 0.1 | 2.0 | GO:0046688 | response to copper ion(GO:0046688) |
| 0.1 | 0.7 | GO:0048852 | diencephalon morphogenesis(GO:0048852) |
| 0.1 | 0.5 | GO:0006685 | sphingomyelin catabolic process(GO:0006685) |
| 0.1 | 1.8 | GO:0032011 | ARF protein signal transduction(GO:0032011) regulation of ARF protein signal transduction(GO:0032012) |
| 0.1 | 2.2 | GO:0046470 | phosphatidylcholine metabolic process(GO:0046470) |
| 0.1 | 0.5 | GO:0035269 | protein O-linked mannosylation(GO:0035269) |
| 0.1 | 0.8 | GO:0046415 | urate metabolic process(GO:0046415) |
| 0.1 | 0.2 | GO:0010841 | positive regulation of circadian sleep/wake cycle, wakefulness(GO:0010841) positive regulation of circadian sleep/wake cycle, REM sleep(GO:0046005) |
| 0.1 | 0.2 | GO:0002587 | negative regulation of antigen processing and presentation of peptide antigen via MHC class II(GO:0002587) |
| 0.1 | 0.9 | GO:0000338 | protein deneddylation(GO:0000338) |
| 0.0 | 1.0 | GO:0015693 | magnesium ion transport(GO:0015693) |
| 0.0 | 0.9 | GO:0006098 | pentose-phosphate shunt(GO:0006098) |
| 0.0 | 3.8 | GO:0000380 | alternative mRNA splicing, via spliceosome(GO:0000380) |
| 0.0 | 0.3 | GO:0006362 | transcription elongation from RNA polymerase I promoter(GO:0006362) |
| 0.0 | 0.5 | GO:2001256 | regulation of store-operated calcium entry(GO:2001256) |
| 0.0 | 0.1 | GO:2000583 | regulation of platelet-derived growth factor receptor-alpha signaling pathway(GO:2000583) negative regulation of platelet-derived growth factor receptor-alpha signaling pathway(GO:2000584) |
| 0.0 | 0.5 | GO:0002862 | negative regulation of inflammatory response to antigenic stimulus(GO:0002862) |
| 0.0 | 0.2 | GO:0009227 | UDP-N-acetylglucosamine catabolic process(GO:0006049) nucleotide-sugar catabolic process(GO:0009227) |
| 0.0 | 0.9 | GO:0090140 | regulation of mitochondrial fission(GO:0090140) |
| 0.0 | 0.4 | GO:0072378 | blood coagulation, fibrin clot formation(GO:0072378) |
| 0.0 | 3.5 | GO:0045669 | positive regulation of osteoblast differentiation(GO:0045669) |
| 0.0 | 0.4 | GO:0046549 | retinal cone cell development(GO:0046549) |
| 0.0 | 1.9 | GO:0030500 | regulation of bone mineralization(GO:0030500) |
| 0.0 | 1.2 | GO:0010842 | retina layer formation(GO:0010842) |
| 0.0 | 1.8 | GO:0046676 | negative regulation of insulin secretion(GO:0046676) |
| 0.0 | 0.1 | GO:2000864 | estradiol secretion(GO:0035938) regulation of estradiol secretion(GO:2000864) |
| 0.0 | 1.6 | GO:0032007 | negative regulation of TOR signaling(GO:0032007) |
| 0.0 | 0.3 | GO:0006122 | mitochondrial electron transport, ubiquinol to cytochrome c(GO:0006122) |
| 0.0 | 1.6 | GO:0050873 | brown fat cell differentiation(GO:0050873) |
| 0.0 | 0.2 | GO:0060459 | left lung development(GO:0060459) left lung morphogenesis(GO:0060460) |
| 0.0 | 0.3 | GO:0006654 | phosphatidic acid biosynthetic process(GO:0006654) |
| 0.0 | 0.6 | GO:0033169 | histone H3-K9 demethylation(GO:0033169) |
| 0.0 | 0.2 | GO:2000601 | positive regulation of Arp2/3 complex-mediated actin nucleation(GO:2000601) |
| 0.0 | 0.7 | GO:0033273 | response to vitamin(GO:0033273) |
| 0.0 | 0.2 | GO:0060501 | positive regulation of epithelial cell proliferation involved in lung morphogenesis(GO:0060501) |
| 0.0 | 0.4 | GO:0038166 | angiotensin-activated signaling pathway(GO:0038166) |
| 0.0 | 0.4 | GO:0045899 | positive regulation of RNA polymerase II transcriptional preinitiation complex assembly(GO:0045899) |
| 0.0 | 0.6 | GO:0031069 | hair follicle morphogenesis(GO:0031069) |
| 0.0 | 0.1 | GO:2001032 | regulation of double-strand break repair via nonhomologous end joining(GO:2001032) |
| 0.0 | 1.1 | GO:0070534 | protein K63-linked ubiquitination(GO:0070534) |
| 0.0 | 0.1 | GO:0043654 | recognition of apoptotic cell(GO:0043654) |
| 0.0 | 0.2 | GO:0060662 | tube lumen cavitation(GO:0060605) salivary gland cavitation(GO:0060662) |
| 0.0 | 0.6 | GO:0071625 | vocalization behavior(GO:0071625) |
| 0.0 | 0.1 | GO:0097118 | neuroligin clustering involved in postsynaptic membrane assembly(GO:0097118) |
| 0.0 | 0.5 | GO:0014046 | dopamine secretion(GO:0014046) regulation of dopamine secretion(GO:0014059) |
| 0.0 | 0.3 | GO:2000269 | regulation of fibroblast apoptotic process(GO:2000269) |
| 0.0 | 0.4 | GO:0045838 | positive regulation of membrane potential(GO:0045838) |
| 0.0 | 1.4 | GO:0006635 | fatty acid beta-oxidation(GO:0006635) |
| 0.0 | 2.5 | GO:0007601 | visual perception(GO:0007601) |
| 0.0 | 0.1 | GO:0010908 | regulation of heparan sulfate proteoglycan biosynthetic process(GO:0010908) positive regulation of heparan sulfate proteoglycan biosynthetic process(GO:0010909) canonical Wnt signaling pathway involved in positive regulation of epithelial to mesenchymal transition(GO:0044334) |
| 0.0 | 0.0 | GO:0006542 | glutamine biosynthetic process(GO:0006542) |
| 0.0 | 0.0 | GO:0016132 | brassinosteroid metabolic process(GO:0016131) brassinosteroid biosynthetic process(GO:0016132) |
| 0.0 | 0.6 | GO:0043550 | regulation of lipid kinase activity(GO:0043550) |
| 0.0 | 0.2 | GO:0048387 | negative regulation of retinoic acid receptor signaling pathway(GO:0048387) |
| 0.0 | 0.2 | GO:0035745 | T-helper 2 cell cytokine production(GO:0035745) |
| 0.0 | 1.7 | GO:0060606 | neural tube closure(GO:0001843) tube closure(GO:0060606) |
| 0.0 | 0.0 | GO:0048936 | neurofilament bundle assembly(GO:0033693) peripheral nervous system neuron axonogenesis(GO:0048936) response to sodium arsenite(GO:1903935) |
| 0.0 | 0.4 | GO:0007617 | mating behavior(GO:0007617) multi-organism reproductive behavior(GO:0044705) |
| 0.0 | 0.7 | GO:0051145 | smooth muscle cell differentiation(GO:0051145) |
| 0.0 | 0.8 | GO:0050688 | regulation of defense response to virus(GO:0050688) |
| 0.0 | 0.2 | GO:0060218 | hematopoietic stem cell differentiation(GO:0060218) |
| 0.0 | 0.2 | GO:0035641 | locomotory exploration behavior(GO:0035641) |
Gene overrepresentation in cellular component category:
| Log-likelihood per target | Total log-likelihood | Term | Description |
|---|---|---|---|
| 1.4 | 9.8 | GO:0008091 | spectrin(GO:0008091) |
| 1.1 | 8.0 | GO:0030670 | phagocytic vesicle membrane(GO:0030670) |
| 0.6 | 2.4 | GO:0033165 | interphotoreceptor matrix(GO:0033165) |
| 0.6 | 4.1 | GO:0097418 | neurofibrillary tangle(GO:0097418) |
| 0.5 | 3.0 | GO:0098651 | collagen type IV trimer(GO:0005587) network-forming collagen trimer(GO:0098642) collagen network(GO:0098645) basement membrane collagen trimer(GO:0098651) |
| 0.4 | 17.9 | GO:0055038 | recycling endosome membrane(GO:0055038) |
| 0.4 | 2.8 | GO:0097550 | transcriptional preinitiation complex(GO:0097550) |
| 0.4 | 13.6 | GO:0034364 | high-density lipoprotein particle(GO:0034364) |
| 0.3 | 11.1 | GO:0080008 | Cul4-RING E3 ubiquitin ligase complex(GO:0080008) |
| 0.2 | 0.7 | GO:0036125 | mitochondrial fatty acid beta-oxidation multienzyme complex(GO:0016507) fatty acid beta-oxidation multienzyme complex(GO:0036125) |
| 0.2 | 1.1 | GO:0032133 | chromosome passenger complex(GO:0032133) |
| 0.2 | 4.9 | GO:0000930 | gamma-tubulin complex(GO:0000930) |
| 0.2 | 1.1 | GO:0031265 | CD95 death-inducing signaling complex(GO:0031265) |
| 0.2 | 0.7 | GO:0030891 | VCB complex(GO:0030891) |
| 0.2 | 2.3 | GO:0070852 | cell body fiber(GO:0070852) |
| 0.2 | 1.1 | GO:0005726 | perichromatin fibrils(GO:0005726) |
| 0.1 | 2.2 | GO:0001518 | voltage-gated sodium channel complex(GO:0001518) |
| 0.1 | 0.5 | GO:0033185 | dolichol-phosphate-mannose synthase complex(GO:0033185) |
| 0.1 | 3.3 | GO:0043218 | compact myelin(GO:0043218) |
| 0.1 | 0.3 | GO:0048179 | activin receptor complex(GO:0048179) |
| 0.1 | 2.8 | GO:1990124 | messenger ribonucleoprotein complex(GO:1990124) |
| 0.1 | 0.6 | GO:0035032 | phosphatidylinositol 3-kinase complex, class III(GO:0035032) |
| 0.1 | 1.2 | GO:1990635 | proximal dendrite(GO:1990635) |
| 0.1 | 13.2 | GO:0072562 | blood microparticle(GO:0072562) |
| 0.1 | 0.5 | GO:0031462 | Cul2-RING ubiquitin ligase complex(GO:0031462) |
| 0.1 | 0.5 | GO:0030485 | smooth muscle contractile fiber(GO:0030485) |
| 0.1 | 6.8 | GO:0000502 | proteasome complex(GO:0000502) |
| 0.1 | 1.0 | GO:0008250 | oligosaccharyltransferase complex(GO:0008250) |
| 0.1 | 1.8 | GO:0005614 | interstitial matrix(GO:0005614) |
| 0.1 | 0.4 | GO:0030896 | checkpoint clamp complex(GO:0030896) |
| 0.1 | 1.1 | GO:0030061 | mitochondrial crista(GO:0030061) |
| 0.1 | 0.6 | GO:0048787 | presynaptic active zone membrane(GO:0048787) |
| 0.1 | 1.3 | GO:0016327 | apicolateral plasma membrane(GO:0016327) |
| 0.0 | 1.0 | GO:0031362 | anchored component of external side of plasma membrane(GO:0031362) |
| 0.0 | 1.0 | GO:0005797 | Golgi medial cisterna(GO:0005797) |
| 0.0 | 0.8 | GO:0031527 | filopodium membrane(GO:0031527) |
| 0.0 | 2.5 | GO:0016235 | aggresome(GO:0016235) |
| 0.0 | 0.3 | GO:0000439 | core TFIIH complex(GO:0000439) |
| 0.0 | 0.7 | GO:0000421 | autophagosome membrane(GO:0000421) |
| 0.0 | 0.3 | GO:0005750 | mitochondrial respiratory chain complex III(GO:0005750) |
| 0.0 | 1.8 | GO:0097610 | cleavage furrow(GO:0032154) cell surface furrow(GO:0097610) |
| 0.0 | 0.6 | GO:0017146 | NMDA selective glutamate receptor complex(GO:0017146) |
| 0.0 | 1.2 | GO:0005719 | nuclear euchromatin(GO:0005719) |
| 0.0 | 4.9 | GO:0043296 | apical junction complex(GO:0043296) |
| 0.0 | 0.5 | GO:0033655 | host cell cytoplasm(GO:0030430) host cell cytoplasm part(GO:0033655) |
| 0.0 | 1.3 | GO:0005891 | voltage-gated calcium channel complex(GO:0005891) |
| 0.0 | 0.5 | GO:0031528 | microvillus membrane(GO:0031528) |
| 0.0 | 0.3 | GO:0000177 | cytoplasmic exosome (RNase complex)(GO:0000177) |
| 0.0 | 2.2 | GO:0000118 | histone deacetylase complex(GO:0000118) |
| 0.0 | 6.8 | GO:0000139 | Golgi membrane(GO:0000139) |
| 0.0 | 0.4 | GO:0043196 | varicosity(GO:0043196) |
| 0.0 | 0.9 | GO:0008180 | COP9 signalosome(GO:0008180) |
| 0.0 | 0.5 | GO:0045334 | clathrin-coated endocytic vesicle(GO:0045334) |
| 0.0 | 0.2 | GO:0031209 | SCAR complex(GO:0031209) |
| 0.0 | 0.9 | GO:0005747 | mitochondrial respiratory chain complex I(GO:0005747) NADH dehydrogenase complex(GO:0030964) respiratory chain complex I(GO:0045271) |
| 0.0 | 1.0 | GO:0042734 | presynaptic membrane(GO:0042734) |
| 0.0 | 0.2 | GO:0042613 | MHC class II protein complex(GO:0042613) |
| 0.0 | 1.5 | GO:0005901 | caveola(GO:0005901) |
| 0.0 | 0.1 | GO:0070369 | beta-catenin-TCF7L2 complex(GO:0070369) catenin-TCF7L2 complex(GO:0071664) |
| 0.0 | 0.3 | GO:0070971 | endoplasmic reticulum exit site(GO:0070971) |
| 0.0 | 0.7 | GO:0097517 | stress fiber(GO:0001725) contractile actin filament bundle(GO:0097517) |
| 0.0 | 2.9 | GO:0030426 | growth cone(GO:0030426) |
| 0.0 | 3.6 | GO:0005938 | cell cortex(GO:0005938) |
| 0.0 | 3.6 | GO:0005911 | cell-cell junction(GO:0005911) |
| 0.0 | 1.3 | GO:0043679 | axon terminus(GO:0043679) |
| 0.0 | 1.4 | GO:0043197 | dendritic spine(GO:0043197) |
| 0.0 | 0.2 | GO:0000506 | glycosylphosphatidylinositol-N-acetylglucosaminyltransferase (GPI-GnT) complex(GO:0000506) |
| 0.0 | 19.3 | GO:0005783 | endoplasmic reticulum(GO:0005783) |
| 0.0 | 0.2 | GO:0030914 | STAGA complex(GO:0030914) |
| 0.0 | 0.3 | GO:0031588 | nucleotide-activated protein kinase complex(GO:0031588) |
| 0.0 | 0.3 | GO:0001533 | cornified envelope(GO:0001533) |
Gene overrepresentation in molecular function category:
| Log-likelihood per target | Total log-likelihood | Term | Description |
|---|---|---|---|
| 2.0 | 6.0 | GO:0016838 | carbon-oxygen lyase activity, acting on phosphates(GO:0016838) |
| 1.8 | 17.7 | GO:0019763 | immunoglobulin receptor activity(GO:0019763) |
| 1.3 | 7.6 | GO:0001517 | N-acetylglucosamine 6-O-sulfotransferase activity(GO:0001517) |
| 1.0 | 6.8 | GO:0008508 | bile acid:sodium symporter activity(GO:0008508) |
| 0.9 | 12.3 | GO:0005436 | sodium:phosphate symporter activity(GO:0005436) |
| 0.9 | 2.8 | GO:0031798 | type 1 metabotropic glutamate receptor binding(GO:0031798) RNA polymerase II transcription factor activity, estrogen-activated sequence-specific DNA binding(GO:0038052) |
| 0.8 | 2.5 | GO:0003858 | 3-hydroxybutyrate dehydrogenase activity(GO:0003858) |
| 0.8 | 5.3 | GO:0005534 | galactose binding(GO:0005534) |
| 0.7 | 2.2 | GO:0052739 | phosphatidylserine 1-acylhydrolase activity(GO:0052739) 1-acyl-2-lysophosphatidylserine acylhydrolase activity(GO:0052740) |
| 0.7 | 2.2 | GO:1902271 | D3 vitamins binding(GO:1902271) |
| 0.7 | 3.3 | GO:0055100 | adiponectin binding(GO:0055100) |
| 0.6 | 4.2 | GO:0005111 | type 2 fibroblast growth factor receptor binding(GO:0005111) |
| 0.6 | 3.5 | GO:0001758 | retinal dehydrogenase activity(GO:0001758) |
| 0.6 | 2.3 | GO:0016842 | amidine-lyase activity(GO:0016842) |
| 0.6 | 4.0 | GO:0099609 | microtubule lateral binding(GO:0099609) |
| 0.6 | 5.6 | GO:0004499 | N,N-dimethylaniline monooxygenase activity(GO:0004499) |
| 0.5 | 20.5 | GO:0015020 | glucuronosyltransferase activity(GO:0015020) |
| 0.5 | 1.6 | GO:0070996 | type 1 melanocortin receptor binding(GO:0070996) |
| 0.5 | 3.1 | GO:0047023 | androsterone dehydrogenase activity(GO:0047023) |
| 0.4 | 1.2 | GO:0038181 | bile acid receptor activity(GO:0038181) |
| 0.4 | 1.1 | GO:0018738 | S-formylglutathione hydrolase activity(GO:0018738) |
| 0.4 | 2.5 | GO:0086006 | voltage-gated sodium channel activity involved in cardiac muscle cell action potential(GO:0086006) |
| 0.4 | 1.1 | GO:0008970 | phosphatidylcholine 1-acylhydrolase activity(GO:0008970) |
| 0.3 | 9.0 | GO:0042056 | chemoattractant activity(GO:0042056) |
| 0.3 | 0.9 | GO:0047936 | glucose 1-dehydrogenase [NAD(P)] activity(GO:0047936) |
| 0.3 | 1.1 | GO:0034056 | estrogen response element binding(GO:0034056) |
| 0.3 | 3.9 | GO:0070513 | death domain binding(GO:0070513) |
| 0.3 | 3.3 | GO:0019911 | structural constituent of myelin sheath(GO:0019911) |
| 0.3 | 4.1 | GO:0046703 | natural killer cell lectin-like receptor binding(GO:0046703) |
| 0.3 | 13.1 | GO:0005044 | scavenger receptor activity(GO:0005044) |
| 0.2 | 1.2 | GO:0015254 | purine nucleobase transmembrane transporter activity(GO:0005345) pyrimidine nucleobase transmembrane transporter activity(GO:0005350) nucleobase transmembrane transporter activity(GO:0015205) glycerol channel activity(GO:0015254) |
| 0.2 | 3.3 | GO:0035925 | mRNA 3'-UTR AU-rich region binding(GO:0035925) |
| 0.2 | 5.7 | GO:0001848 | complement binding(GO:0001848) |
| 0.2 | 2.0 | GO:0004322 | ferroxidase activity(GO:0004322) oxidoreductase activity, oxidizing metal ions, oxygen as acceptor(GO:0016724) |
| 0.2 | 0.9 | GO:0008449 | N-acetylglucosamine-6-sulfatase activity(GO:0008449) |
| 0.2 | 0.5 | GO:0033754 | indoleamine 2,3-dioxygenase activity(GO:0033754) |
| 0.2 | 0.7 | GO:0016508 | long-chain-enoyl-CoA hydratase activity(GO:0016508) long-chain-3-hydroxyacyl-CoA dehydrogenase activity(GO:0016509) |
| 0.2 | 0.8 | GO:0004165 | dodecenoyl-CoA delta-isomerase activity(GO:0004165) |
| 0.1 | 1.0 | GO:0001642 | group III metabotropic glutamate receptor activity(GO:0001642) |
| 0.1 | 0.4 | GO:0051431 | corticotropin-releasing hormone receptor 2 binding(GO:0051431) |
| 0.1 | 7.1 | GO:0004364 | glutathione transferase activity(GO:0004364) |
| 0.1 | 5.9 | GO:0043015 | gamma-tubulin binding(GO:0043015) |
| 0.1 | 0.5 | GO:0004582 | dolichyl-phosphate beta-D-mannosyltransferase activity(GO:0004582) |
| 0.1 | 0.5 | GO:0038100 | nodal binding(GO:0038100) |
| 0.1 | 2.9 | GO:0042813 | Wnt-activated receptor activity(GO:0042813) |
| 0.1 | 3.5 | GO:0016709 | oxidoreductase activity, acting on paired donors, with incorporation or reduction of molecular oxygen, NAD(P)H as one donor, and incorporation of one atom of oxygen(GO:0016709) |
| 0.1 | 0.9 | GO:0017034 | Rap guanyl-nucleotide exchange factor activity(GO:0017034) |
| 0.1 | 0.5 | GO:0070506 | high-density lipoprotein particle receptor activity(GO:0070506) |
| 0.1 | 0.7 | GO:0047035 | alcohol dehydrogenase (NAD) activity(GO:0004022) testosterone dehydrogenase (NAD+) activity(GO:0047035) |
| 0.1 | 1.1 | GO:0097200 | cysteine-type endopeptidase activity involved in execution phase of apoptosis(GO:0097200) |
| 0.1 | 3.3 | GO:0004181 | metallocarboxypeptidase activity(GO:0004181) |
| 0.1 | 3.8 | GO:0005164 | tumor necrosis factor receptor binding(GO:0005164) |
| 0.1 | 2.1 | GO:0070628 | proteasome binding(GO:0070628) |
| 0.1 | 1.0 | GO:0015924 | mannosyl-oligosaccharide mannosidase activity(GO:0015924) |
| 0.1 | 0.7 | GO:0009374 | biotin binding(GO:0009374) |
| 0.1 | 4.8 | GO:0005504 | fatty acid binding(GO:0005504) |
| 0.1 | 4.3 | GO:0001786 | phosphatidylserine binding(GO:0001786) |
| 0.1 | 1.0 | GO:0004576 | oligosaccharyl transferase activity(GO:0004576) dolichyl-diphosphooligosaccharide-protein glycotransferase activity(GO:0004579) |
| 0.1 | 0.2 | GO:0022850 | serotonin-gated cation channel activity(GO:0022850) |
| 0.1 | 1.0 | GO:0003956 | NAD(P)+-protein-arginine ADP-ribosyltransferase activity(GO:0003956) |
| 0.1 | 2.5 | GO:0030676 | Rac guanyl-nucleotide exchange factor activity(GO:0030676) |
| 0.1 | 0.4 | GO:0008502 | melatonin receptor activity(GO:0008502) |
| 0.1 | 1.3 | GO:0008331 | high voltage-gated calcium channel activity(GO:0008331) |
| 0.1 | 1.9 | GO:0008137 | NADH dehydrogenase (ubiquinone) activity(GO:0008137) NADH dehydrogenase (quinone) activity(GO:0050136) |
| 0.1 | 1.2 | GO:0070402 | NADPH binding(GO:0070402) |
| 0.1 | 1.3 | GO:0005540 | hyaluronic acid binding(GO:0005540) |
| 0.1 | 1.8 | GO:0005520 | insulin-like growth factor binding(GO:0005520) |
| 0.1 | 0.8 | GO:0015143 | urate transmembrane transporter activity(GO:0015143) salt transmembrane transporter activity(GO:1901702) |
| 0.1 | 0.5 | GO:0016428 | tRNA (cytosine-5-)-methyltransferase activity(GO:0016428) |
| 0.1 | 0.5 | GO:0004767 | sphingomyelin phosphodiesterase activity(GO:0004767) |
| 0.1 | 1.8 | GO:0005086 | ARF guanyl-nucleotide exchange factor activity(GO:0005086) |
| 0.1 | 0.4 | GO:0047429 | nucleoside-triphosphate diphosphatase activity(GO:0047429) |
| 0.1 | 0.4 | GO:0036402 | proteasome-activating ATPase activity(GO:0036402) |
| 0.0 | 0.5 | GO:0031802 | type 5 metabotropic glutamate receptor binding(GO:0031802) |
| 0.0 | 0.3 | GO:0050694 | galactose 3-O-sulfotransferase activity(GO:0050694) |
| 0.0 | 0.5 | GO:0010181 | FMN binding(GO:0010181) |
| 0.0 | 0.8 | GO:0017166 | vinculin binding(GO:0017166) |
| 0.0 | 2.8 | GO:0008395 | steroid hydroxylase activity(GO:0008395) |
| 0.0 | 0.4 | GO:0099583 | neurotransmitter receptor activity involved in regulation of postsynaptic membrane potential(GO:0099529) neurotransmitter receptor activity involved in regulation of postsynaptic cytosolic calcium ion concentration(GO:0099583) |
| 0.0 | 0.3 | GO:0046404 | ATP-dependent polydeoxyribonucleotide 5'-hydroxyl-kinase activity(GO:0046404) polydeoxyribonucleotide kinase activity(GO:0051733) ATP-dependent polynucleotide kinase activity(GO:0051734) |
| 0.0 | 0.3 | GO:0008121 | ubiquinol-cytochrome-c reductase activity(GO:0008121) oxidoreductase activity, acting on diphenols and related substances as donors(GO:0016679) oxidoreductase activity, acting on diphenols and related substances as donors, cytochrome as acceptor(GO:0016681) |
| 0.0 | 0.4 | GO:0001025 | RNA polymerase III transcription factor binding(GO:0001025) |
| 0.0 | 0.2 | GO:0005250 | A-type (transient outward) potassium channel activity(GO:0005250) |
| 0.0 | 1.1 | GO:0017127 | cholesterol transporter activity(GO:0017127) |
| 0.0 | 0.4 | GO:0008889 | glycerophosphodiester phosphodiesterase activity(GO:0008889) |
| 0.0 | 0.6 | GO:0042809 | vitamin D receptor binding(GO:0042809) |
| 0.0 | 5.4 | GO:0004867 | serine-type endopeptidase inhibitor activity(GO:0004867) |
| 0.0 | 0.2 | GO:0003827 | alpha-1,3-mannosylglycoprotein 2-beta-N-acetylglucosaminyltransferase activity(GO:0003827) |
| 0.0 | 0.9 | GO:0005351 | sugar:proton symporter activity(GO:0005351) |
| 0.0 | 1.2 | GO:0048020 | CCR chemokine receptor binding(GO:0048020) |
| 0.0 | 2.0 | GO:0016278 | lysine N-methyltransferase activity(GO:0016278) protein-lysine N-methyltransferase activity(GO:0016279) |
| 0.0 | 0.3 | GO:0000182 | rDNA binding(GO:0000182) |
| 0.0 | 1.1 | GO:0035259 | glucocorticoid receptor binding(GO:0035259) |
| 0.0 | 0.5 | GO:0005537 | mannose binding(GO:0005537) |
| 0.0 | 1.3 | GO:0017112 | Rab guanyl-nucleotide exchange factor activity(GO:0017112) |
| 0.0 | 0.1 | GO:0034647 | histone demethylase activity (H3-trimethyl-K4 specific)(GO:0034647) |
| 0.0 | 4.5 | GO:0004252 | serine-type endopeptidase activity(GO:0004252) |
| 0.0 | 0.1 | GO:0031697 | beta-1 adrenergic receptor binding(GO:0031697) |
| 0.0 | 2.2 | GO:0019905 | syntaxin binding(GO:0019905) |
| 0.0 | 0.2 | GO:0015386 | potassium:proton antiporter activity(GO:0015386) |
| 0.0 | 1.1 | GO:0061631 | ubiquitin conjugating enzyme activity(GO:0061631) |
| 0.0 | 0.3 | GO:0004143 | diacylglycerol kinase activity(GO:0004143) |
| 0.0 | 1.9 | GO:0048306 | calcium-dependent protein binding(GO:0048306) |
| 0.0 | 2.9 | GO:0030165 | PDZ domain binding(GO:0030165) |
| 0.0 | 0.2 | GO:0044323 | retinoic acid-responsive element binding(GO:0044323) |
| 0.0 | 8.5 | GO:0045296 | cadherin binding(GO:0045296) |
| 0.0 | 1.0 | GO:0004712 | protein serine/threonine/tyrosine kinase activity(GO:0004712) |
| 0.0 | 0.2 | GO:0050692 | DBD domain binding(GO:0050692) |
| 0.0 | 0.2 | GO:0017176 | phosphatidylinositol N-acetylglucosaminyltransferase activity(GO:0017176) |
| 0.0 | 0.0 | GO:0016211 | glutamate-ammonia ligase activity(GO:0004356) ammonia ligase activity(GO:0016211) |
| 0.0 | 0.2 | GO:0003680 | AT DNA binding(GO:0003680) |
| 0.0 | 0.0 | GO:0047598 | sterol delta7 reductase activity(GO:0009918) 7-dehydrocholesterol reductase activity(GO:0047598) |
| 0.0 | 0.1 | GO:0050291 | sphingosine N-acyltransferase activity(GO:0050291) |
| 0.0 | 0.2 | GO:0023026 | MHC class II protein complex binding(GO:0023026) |
| 0.0 | 0.3 | GO:0004679 | AMP-activated protein kinase activity(GO:0004679) |
| 0.0 | 3.0 | GO:0003714 | transcription corepressor activity(GO:0003714) |
| 0.0 | 0.5 | GO:0048487 | beta-tubulin binding(GO:0048487) |
| 0.0 | 0.4 | GO:0008235 | metalloexopeptidase activity(GO:0008235) |
| 0.0 | 0.7 | GO:0030145 | manganese ion binding(GO:0030145) |
| 0.0 | 1.0 | GO:0030414 | peptidase inhibitor activity(GO:0030414) |
Gene overrepresentation in curated gene sets: canonical pathways category:
| Log-likelihood per target | Total log-likelihood | Term | Description |
|---|---|---|---|
| 0.2 | 4.0 | PID P38 GAMMA DELTA PATHWAY | Signaling mediated by p38-gamma and p38-delta |
| 0.2 | 6.8 | PID TOLL ENDOGENOUS PATHWAY | Endogenous TLR signaling |
| 0.2 | 16.7 | PID IL4 2PATHWAY | IL4-mediated signaling events |
| 0.2 | 7.1 | PID LIS1 PATHWAY | Lissencephaly gene (LIS1) in neuronal migration and development |
| 0.1 | 3.0 | ST G ALPHA S PATHWAY | G alpha s Pathway |
| 0.1 | 1.1 | SA FAS SIGNALING | The TNF-type receptor Fas induces apoptosis on ligand binding. |
| 0.1 | 5.7 | PID HNF3A PATHWAY | FOXA1 transcription factor network |
| 0.1 | 3.0 | NABA BASEMENT MEMBRANES | Genes encoding structural components of basement membranes |
| 0.1 | 2.4 | NABA PROTEOGLYCANS | Genes encoding proteoglycans |
| 0.0 | 1.2 | PID NECTIN PATHWAY | Nectin adhesion pathway |
| 0.0 | 0.9 | PID INTEGRIN A9B1 PATHWAY | Alpha9 beta1 integrin signaling events |
| 0.0 | 1.3 | PID WNT SIGNALING PATHWAY | Wnt signaling network |
| 0.0 | 9.4 | NABA ECM REGULATORS | Genes encoding enzymes and their regulators involved in the remodeling of the extracellular matrix |
| 0.0 | 1.0 | PID FRA PATHWAY | Validated transcriptional targets of AP1 family members Fra1 and Fra2 |
| 0.0 | 1.4 | PID AURORA B PATHWAY | Aurora B signaling |
| 0.0 | 0.5 | PID HIF1A PATHWAY | Hypoxic and oxygen homeostasis regulation of HIF-1-alpha |
| 0.0 | 1.2 | PID RXR VDR PATHWAY | RXR and RAR heterodimerization with other nuclear receptor |
| 0.0 | 0.4 | PID REELIN PATHWAY | Reelin signaling pathway |
| 0.0 | 1.6 | PID HIF1 TFPATHWAY | HIF-1-alpha transcription factor network |
| 0.0 | 6.5 | NABA SECRETED FACTORS | Genes encoding secreted soluble factors |
| 0.0 | 0.4 | PID UPA UPAR PATHWAY | Urokinase-type plasminogen activator (uPA) and uPAR-mediated signaling |
| 0.0 | 1.1 | PID AR TF PATHWAY | Regulation of Androgen receptor activity |
| 0.0 | 0.4 | PID ANGIOPOIETIN RECEPTOR PATHWAY | Angiopoietin receptor Tie2-mediated signaling |
| 0.0 | 0.4 | PID PRL SIGNALING EVENTS PATHWAY | Signaling events mediated by PRL |
| 0.0 | 1.3 | PID RAC1 REG PATHWAY | Regulation of RAC1 activity |
| 0.0 | 0.8 | PID NFAT TFPATHWAY | Calcineurin-regulated NFAT-dependent transcription in lymphocytes |
| 0.0 | 0.5 | PID TCPTP PATHWAY | Signaling events mediated by TCPTP |
| 0.0 | 0.5 | PID ECADHERIN STABILIZATION PATHWAY | Stabilization and expansion of the E-cadherin adherens junction |
| 0.0 | 1.0 | WNT SIGNALING | Genes related to Wnt-mediated signal transduction |
| 0.0 | 0.2 | PID MYC PATHWAY | C-MYC pathway |
Gene overrepresentation in curated gene sets: REACTOME pathways category:
| Log-likelihood per target | Total log-likelihood | Term | Description |
|---|---|---|---|
| 0.8 | 6.8 | REACTOME RECYCLING OF BILE ACIDS AND SALTS | Genes involved in Recycling of bile acids and salts |
| 0.7 | 5.7 | REACTOME CREATION OF C4 AND C2 ACTIVATORS | Genes involved in Creation of C4 and C2 activators |
| 0.4 | 3.0 | REACTOME INITIAL TRIGGERING OF COMPLEMENT | Genes involved in Initial triggering of complement |
| 0.3 | 3.5 | REACTOME SYNTHESIS OF BILE ACIDS AND BILE SALTS VIA 24 HYDROXYCHOLESTEROL | Genes involved in Synthesis of bile acids and bile salts via 24-hydroxycholesterol |
| 0.3 | 6.8 | REACTOME RIP MEDIATED NFKB ACTIVATION VIA DAI | Genes involved in RIP-mediated NFkB activation via DAI |
| 0.3 | 12.7 | REACTOME INTERACTION BETWEEN L1 AND ANKYRINS | Genes involved in Interaction between L1 and Ankyrins |
| 0.2 | 5.7 | REACTOME INTRINSIC PATHWAY | Genes involved in Intrinsic Pathway |
| 0.2 | 4.1 | REACTOME ACTIVATED POINT MUTANTS OF FGFR2 | Genes involved in Activated point mutants of FGFR2 |
| 0.2 | 2.1 | REACTOME GLUCURONIDATION | Genes involved in Glucuronidation |
| 0.1 | 4.0 | REACTOME CASPASE MEDIATED CLEAVAGE OF CYTOSKELETAL PROTEINS | Genes involved in Caspase-mediated cleavage of cytoskeletal proteins |
| 0.1 | 3.2 | REACTOME STEROID HORMONES | Genes involved in Steroid hormones |
| 0.1 | 5.0 | REACTOME PHASE1 FUNCTIONALIZATION OF COMPOUNDS | Genes involved in Phase 1 - Functionalization of compounds |
| 0.1 | 4.9 | REACTOME DARPP 32 EVENTS | Genes involved in DARPP-32 events |
| 0.1 | 1.1 | REACTOME EXTRINSIC PATHWAY FOR APOPTOSIS | Genes involved in Extrinsic Pathway for Apoptosis |
| 0.1 | 1.2 | REACTOME PASSIVE TRANSPORT BY AQUAPORINS | Genes involved in Passive Transport by Aquaporins |
| 0.1 | 1.4 | REACTOME MITOCHONDRIAL FATTY ACID BETA OXIDATION | Genes involved in Mitochondrial Fatty Acid Beta-Oxidation |
| 0.1 | 0.9 | REACTOME KERATAN SULFATE DEGRADATION | Genes involved in Keratan sulfate degradation |
| 0.1 | 1.2 | REACTOME SEMA3A PLEXIN REPULSION SIGNALING BY INHIBITING INTEGRIN ADHESION | Genes involved in SEMA3A-Plexin repulsion signaling by inhibiting Integrin adhesion |
| 0.1 | 7.4 | REACTOME L1CAM INTERACTIONS | Genes involved in L1CAM interactions |
| 0.1 | 3.8 | REACTOME NUCLEAR SIGNALING BY ERBB4 | Genes involved in Nuclear signaling by ERBB4 |
| 0.1 | 2.0 | REACTOME METAL ION SLC TRANSPORTERS | Genes involved in Metal ion SLC transporters |
| 0.1 | 0.8 | REACTOME FACILITATIVE NA INDEPENDENT GLUCOSE TRANSPORTERS | Genes involved in Facilitative Na+-independent glucose transporters |
| 0.0 | 1.0 | REACTOME CLASS C 3 METABOTROPIC GLUTAMATE PHEROMONE RECEPTORS | Genes involved in Class C/3 (Metabotropic glutamate/pheromone receptors) |
| 0.0 | 1.6 | REACTOME REGULATION OF GENE EXPRESSION IN BETA CELLS | Genes involved in Regulation of gene expression in beta cells |
| 0.0 | 1.5 | REACTOME LIPOPROTEIN METABOLISM | Genes involved in Lipoprotein metabolism |
| 0.0 | 0.4 | REACTOME GRB2 SOS PROVIDES LINKAGE TO MAPK SIGNALING FOR INTERGRINS | Genes involved in GRB2:SOS provides linkage to MAPK signaling for Intergrins |
| 0.0 | 0.7 | REACTOME OXYGEN DEPENDENT PROLINE HYDROXYLATION OF HYPOXIA INDUCIBLE FACTOR ALPHA | Genes involved in Oxygen-dependent Proline Hydroxylation of Hypoxia-inducible Factor Alpha |
| 0.0 | 0.6 | REACTOME SYNTHESIS OF PIPS AT THE LATE ENDOSOME MEMBRANE | Genes involved in Synthesis of PIPs at the late endosome membrane |
| 0.0 | 1.1 | REACTOME SIGNALING BY FGFR1 FUSION MUTANTS | Genes involved in Signaling by FGFR1 fusion mutants |
| 0.0 | 0.5 | REACTOME SYNTHESIS OF SUBSTRATES IN N GLYCAN BIOSYTHESIS | Genes involved in Synthesis of substrates in N-glycan biosythesis |
| 0.0 | 0.7 | REACTOME DCC MEDIATED ATTRACTIVE SIGNALING | Genes involved in DCC mediated attractive signaling |
| 0.0 | 0.5 | REACTOME CTLA4 INHIBITORY SIGNALING | Genes involved in CTLA4 inhibitory signaling |
| 0.0 | 2.6 | REACTOME INTEGRIN CELL SURFACE INTERACTIONS | Genes involved in Integrin cell surface interactions |
| 0.0 | 0.9 | REACTOME IL RECEPTOR SHC SIGNALING | Genes involved in Interleukin receptor SHC signaling |
| 0.0 | 1.1 | REACTOME ADHERENS JUNCTIONS INTERACTIONS | Genes involved in Adherens junctions interactions |
| 0.0 | 1.6 | REACTOME CROSS PRESENTATION OF SOLUBLE EXOGENOUS ANTIGENS ENDOSOMES | Genes involved in Cross-presentation of soluble exogenous antigens (endosomes) |
| 0.0 | 1.2 | REACTOME CHEMOKINE RECEPTORS BIND CHEMOKINES | Genes involved in Chemokine receptors bind chemokines |
| 0.0 | 0.5 | REACTOME TRYPTOPHAN CATABOLISM | Genes involved in Tryptophan catabolism |
| 0.0 | 2.4 | REACTOME RESPONSE TO ELEVATED PLATELET CYTOSOLIC CA2 | Genes involved in Response to elevated platelet cytosolic Ca2+ |
| 0.0 | 0.5 | REACTOME MITOCHONDRIAL TRNA AMINOACYLATION | Genes involved in Mitochondrial tRNA aminoacylation |
| 0.0 | 0.9 | REACTOME TRANSPORT OF VITAMINS NUCLEOSIDES AND RELATED MOLECULES | Genes involved in Transport of vitamins, nucleosides, and related molecules |
| 0.0 | 0.4 | REACTOME CREB PHOSPHORYLATION THROUGH THE ACTIVATION OF CAMKII | Genes involved in CREB phosphorylation through the activation of CaMKII |
| 0.0 | 1.0 | REACTOME METABOLISM OF NON CODING RNA | Genes involved in Metabolism of non-coding RNA |
| 0.0 | 2.3 | REACTOME METABOLISM OF AMINO ACIDS AND DERIVATIVES | Genes involved in Metabolism of amino acids and derivatives |
| 0.0 | 1.8 | REACTOME SRP DEPENDENT COTRANSLATIONAL PROTEIN TARGETING TO MEMBRANE | Genes involved in SRP-dependent cotranslational protein targeting to membrane |
| 0.0 | 0.3 | REACTOME SIGNALING BY NODAL | Genes involved in Signaling by NODAL |
| 0.0 | 0.5 | REACTOME ANTIVIRAL MECHANISM BY IFN STIMULATED GENES | Genes involved in Antiviral mechanism by IFN-stimulated genes |
| 0.0 | 0.1 | REACTOME P2Y RECEPTORS | Genes involved in P2Y receptors |
| 0.0 | 0.3 | REACTOME LIGAND GATED ION CHANNEL TRANSPORT | Genes involved in Ligand-gated ion channel transport |