Project
GSE43616: Time-course of wild-type Arabidopsis leaf
Navigation
Downloads
Results for AT5G60200
Z-value: 0.09
Transcription factors associated with AT5G60200
| Gene Symbol | Gene ID | Gene Info |
|---|---|---|
|
AT5G60200
|
AT5G60200 | TARGET OF MONOPTEROS 6 |
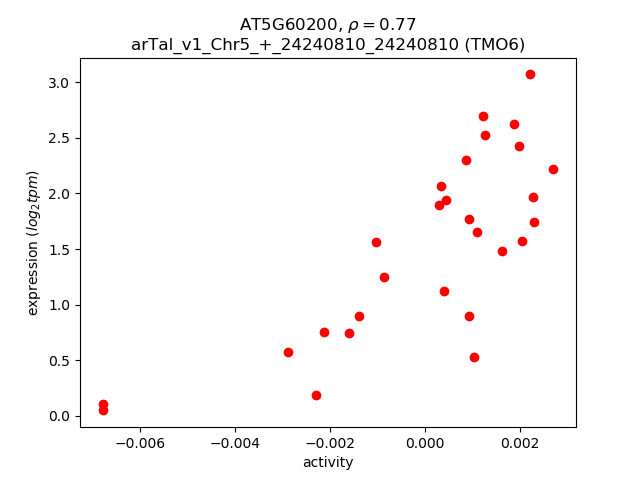
Activity-expression correlation:
| Gene | Promoter | Pearson corr. coef. | P-value | Plot |
|---|---|---|---|---|
| TMO6 | arTal_v1_Chr5_+_24240810_24240810 | 0.77 | 1.7e-06 | Click! |
Activity profile of AT5G60200 motif
Sorted Z-values of AT5G60200 motif
| Promoter | Log-likelihood | Transcript | Gene | Gene Info |
|---|---|---|---|---|
| arTal_v1_Chr2_-_14644355_14644355 | 0.15 |
AT2G34710.1
|
PHB
|
Homeobox-leucine zipper family protein / lipid-binding START domain-containing protein |
| arTal_v1_Chr2_-_17060652_17060652 | 0.13 |
AT2G40890.1
|
CYP98A3
|
cytochrome P450, family 98, subfamily A, polypeptide 3 |
| arTal_v1_Chr1_-_19161552_19161552 | 0.10 |
AT1G51680.3
AT1G51680.2 |
4CL1
|
4-coumarate:CoA ligase 1 |
| arTal_v1_Chr1_-_19161737_19161737 | 0.09 |
AT1G51680.1
|
4CL1
|
4-coumarate:CoA ligase 1 |
| arTal_v1_Chr5_+_24396981_24396981 | 0.08 |
AT5G60690.1
|
REV
|
Homeobox-leucine zipper family protein / lipid-binding START domain-containing protein |
| arTal_v1_Chr1_+_27076020_27076020 | 0.07 |
AT1G71930.1
|
VND7
|
vascular related NAC-domain protein 7 |
| arTal_v1_Chr1_+_27074702_27074702 | 0.06 |
AT1G71930.2
|
VND7
|
vascular related NAC-domain protein 7 |
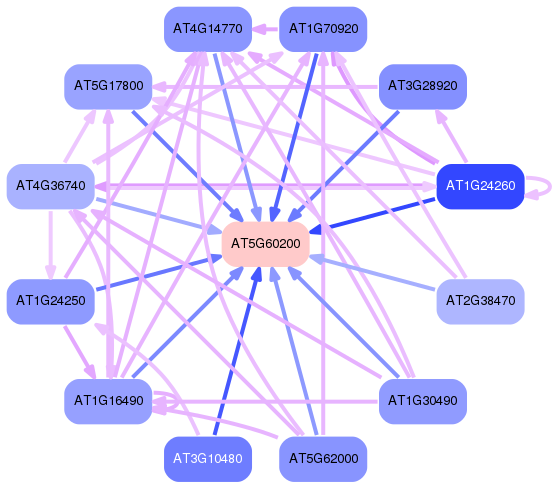
Network of associatons between targets according to the STRING database.

First level regulatory network of AT5G60200
Gene Ontology Analysis
Gene overrepresentation in biological process category:
| Log-likelihood per target | Total log-likelihood | Term | Description |
|---|---|---|---|
| 0.0 | 0.1 | GO:0009805 | coumarin biosynthetic process(GO:0009805) |
| 0.0 | 0.1 | GO:0090059 | protoxylem development(GO:0090059) |
Gene overrepresentation in molecular function category:
| Log-likelihood per target | Total log-likelihood | Term | Description |
|---|---|---|---|
| 0.0 | 0.1 | GO:0046409 | p-coumarate 3-hydroxylase activity(GO:0046409) |
| 0.0 | 0.2 | GO:0016207 | 4-coumarate-CoA ligase activity(GO:0016207) |