Project
GSE43616: Time-course of wild-type Arabidopsis leaf
Navigation
Downloads
Results for AT5G47230
Z-value: 0.40
Transcription factors associated with AT5G47230
| Gene Symbol | Gene ID | Gene Info |
|---|---|---|
|
AT5G47230
|
AT5G47230 | ethylene responsive element binding factor 5 |
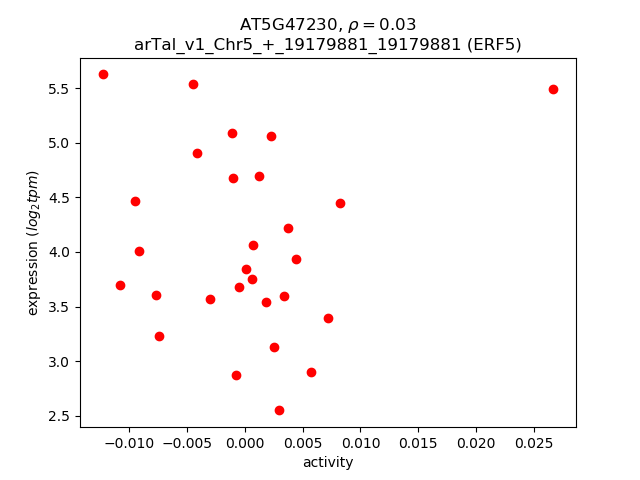
Activity-expression correlation:
| Gene | Promoter | Pearson corr. coef. | P-value | Plot |
|---|---|---|---|---|
| ERF5 | arTal_v1_Chr5_+_19179881_19179881 | 0.03 | 8.8e-01 | Click! |
Activity profile of AT5G47230 motif
Sorted Z-values of AT5G47230 motif
| Promoter | Log-likelihood | Transcript | Gene | Gene Info |
|---|---|---|---|---|
| arTal_v1_Chr1_+_5448611_5448726 | 0.54 |
AT1G15830.1
AT1G15830.3 |
AT1G15830
|
hypothetical protein |
| arTal_v1_Chr4_-_18275017_18275216 | 0.48 |
AT4G39260.4
AT4G39260.3 AT4G39260.2 AT4G39260.1 |
CCR1
|
cold, circadian rhythm, and RNA binding 1 |
| arTal_v1_Chr2_-_9767_9767 | 0.40 |
AT2G01023.1
|
AT2G01023
|
hypothetical protein |
| arTal_v1_Chr1_+_5448060_5448060 | 0.40 |
AT1G15830.2
|
AT1G15830
|
hypothetical protein |
| arTal_v1_Chr3_-_8902835_8902835 | 0.39 |
AT3G24480.1
|
AT3G24480
|
Leucine-rich repeat (LRR) family protein |
| arTal_v1_Chr1_+_23953099_23953099 | 0.37 |
AT1G64500.1
|
AT1G64500
|
Glutaredoxin family protein |
| arTal_v1_Chr3_+_18634546_18634546 | 0.37 |
AT3G50260.1
|
CEJ1
|
cooperatively regulated by ethylene and jasmonate 1 |
| arTal_v1_Chr4_+_7758275_7758275 | 0.33 |
AT4G13340.1
|
LRX3
|
Leucine-rich repeat (LRR) family protein |
| arTal_v1_Chr5_+_3253122_3253122 | 0.32 |
AT5G10340.1
|
AT5G10340
|
F-box family protein |
| arTal_v1_Chr4_+_9759203_9759203 | 0.28 |
AT4G17500.1
|
ERF-1
|
ethylene responsive element binding factor 1 |
| arTal_v1_Chr3_+_4525033_4525033 | 0.28 |
AT3G13780.1
|
AT3G13780
|
SMAD/FHA domain-containing protein |
| arTal_v1_Chr5_-_21688223_21688273 | 0.28 |
AT5G53440.2
AT5G53440.1 |
AT5G53440
|
LOW protein: zinc finger CCCH domain protein |
| arTal_v1_Chr1_+_3999157_3999202 | 0.28 |
AT1G11850.2
AT1G11850.4 AT1G11850.3 AT1G11850.1 |
AT1G11850
|
transmembrane protein |
| arTal_v1_Chr5_+_937817_937819 | 0.24 |
AT5G03660.3
AT5G03660.1 |
AT5G03660
|
transcriptional activator (DUF662) |
| arTal_v1_Chr5_+_937998_937998 | 0.24 |
AT5G03660.2
|
AT5G03660
|
transcriptional activator (DUF662) |
| arTal_v1_Chr4_-_12890261_12890262 | 0.24 |
AT4G25110.2
AT4G25110.1 |
MC2
|
metacaspase 2 |
| arTal_v1_Chr1_+_30138818_30138818 | 0.24 |
AT1G80120.1
|
AT1G80120
|
LURP-one-like protein (DUF567) |
| arTal_v1_Chr1_-_5645443_5645443 | 0.23 |
AT1G16510.1
|
AT1G16510
|
SAUR-like auxin-responsive protein family |
| arTal_v1_Chr3_+_5121303_5121303 | 0.23 |
AT3G15210.1
|
ERF4
|
ethylene responsive element binding factor 4 |
| arTal_v1_Chr4_-_10278794_10278794 | 0.23 |
AT4G18670.1
|
AT4G18670
|
Leucine-rich repeat (LRR) family protein |
| arTal_v1_Chr3_+_231610_231651 | 0.23 |
AT3G01610.1
AT3G01610.2 |
CDC48C
|
cell division cycle 48C |
| arTal_v1_Chr3_-_1010573_1010573 | 0.23 |
AT3G03920.1
|
AT3G03920
|
H/ACA ribonucleoprotein complex, subunit Gar1/Naf1 protein |
| arTal_v1_Chr1_-_5443911_5443911 | 0.23 |
AT1G15800.1
|
AT1G15800
|
hypothetical protein |
| arTal_v1_Chr3_+_22331427_22331485 | 0.23 |
AT3G60410.2
AT3G60410.1 AT3G60410.3 |
AT3G60410
|
hypothetical protein (DUF1639) |
| arTal_v1_Chr2_-_9266393_9266393 | 0.22 |
AT2G21660.2
|
GRP7
|
cold, circadian rhythm, and rna binding 2 |
| arTal_v1_Chr1_+_20876440_20876440 | 0.22 |
AT1G55850.1
|
CSLE1
|
cellulose synthase like E1 |
| arTal_v1_Chr2_-_9266557_9266557 | 0.22 |
AT2G21660.1
|
GRP7
|
cold, circadian rhythm, and rna binding 2 |
| arTal_v1_Chr3_+_5518211_5518331 | 0.21 |
AT3G16280.2
AT3G16280.1 |
AT3G16280
|
Integrase-type DNA-binding superfamily protein |
| arTal_v1_Chr5_+_24560501_24560501 | 0.21 |
AT5G61030.2
|
GR-RBP3
|
glycine-rich RNA-binding protein 3 |
| arTal_v1_Chr2_+_18145439_18145439 | 0.21 |
AT2G43800.1
|
AT2G43800
|
Actin-binding FH2 (formin homology 2) family protein |
| arTal_v1_Chr5_+_23384255_23384255 | 0.21 |
AT5G57710.1
|
AT5G57710
|
Double Clp-N motif-containing P-loop nucleoside triphosphate hydrolases superfamily protein |
| arTal_v1_Chr2_+_801527_801527 | 0.20 |
AT2G02810.1
|
UTR1
|
UDP-galactose transporter 1 |
| arTal_v1_Chr3_+_8410287_8410322 | 0.20 |
AT3G23450.2
AT3G23450.4 AT3G23450.3 |
AT3G23450
|
transmembrane protein |
| arTal_v1_Chr4_+_17768042_17768042 | 0.20 |
AT4G37790.1
|
HAT22
|
Homeobox-leucine zipper protein family |
| arTal_v1_Chr2_-_9706217_9706217 | 0.20 |
AT2G22800.1
|
HAT9
|
Homeobox-leucine zipper protein family |
| arTal_v1_Chr5_+_24560309_24560309 | 0.19 |
AT5G61030.1
|
GR-RBP3
|
glycine-rich RNA-binding protein 3 |
| arTal_v1_Chr1_-_28370008_28370061 | 0.19 |
AT1G75550.1
AT1G75550.2 |
AT1G75550
|
glycine-rich protein |
| arTal_v1_Chr2_-_11777529_11777553 | 0.19 |
AT2G27580.2
AT2G27580.1 |
AT2G27580
|
A20/AN1-like zinc finger family protein |
| arTal_v1_Chr2_+_15005064_15005064 | 0.18 |
AT2G35700.1
|
ERF38
|
ERF family protein 38 |
| arTal_v1_Chr5_-_834289_834289 | 0.17 |
AT5G03380.2
|
AT5G03380
|
Heavy metal transport/detoxification superfamily protein |
| arTal_v1_Chr3_-_4660945_4660945 | 0.17 |
AT3G14067.1
|
AT3G14067
|
Subtilase family protein |
| arTal_v1_Chr4_+_7042354_7042354 | 0.17 |
AT4G11660.1
|
AT-HSFB2B
|
winged-helix DNA-binding transcription factor family protein |
| arTal_v1_Chr1_-_9406369_9406369 | 0.17 |
AT1G27090.1
|
AT1G27090
|
glycine-rich protein |
| arTal_v1_Chr2_+_163954_163954 | 0.17 |
AT2G01340.1
|
At17.1
|
plastid movement impaired protein |
| arTal_v1_Chr1_-_8310916_8310916 | 0.17 |
AT1G23390.1
|
AT1G23390
|
Kelch repeat-containing F-box family protein |
| arTal_v1_Chr2_+_15592552_15592552 | 0.17 |
AT2G37110.1
|
AT2G37110
|
PLAC8 family protein |
| arTal_v1_Chr1_-_30142697_30142697 | 0.16 |
AT1G80130.1
|
AT1G80130
|
Tetratricopeptide repeat (TPR)-like superfamily protein |
| arTal_v1_Chr1_+_2649459_2649537 | 0.16 |
AT1G08420.1
AT1G08420.2 |
BSL2
|
BRI1 suppressor 1 (BSU1)-like 2 |
| arTal_v1_Chr5_-_23640973_23640973 | 0.16 |
AT5G58470.2
AT5G58470.1 |
TAF15b
|
TBP-associated factor 15B |
| arTal_v1_Chr3_+_9122197_9122215 | 0.16 |
AT3G25030.4
AT3G25030.1 AT3G25030.2 |
AT3G25030
|
RING/U-box superfamily protein |
| arTal_v1_Chr1_+_25018077_25018173 | 0.16 |
AT1G67035.2
AT1G67035.1 |
AT1G67035
|
homeobox Hox-B3-like protein |
| arTal_v1_Chr3_+_2953693_2953737 | 0.15 |
AT3G09630.1
AT3G09630.2 |
AT3G09630
|
Ribosomal protein L4/L1 family |
| arTal_v1_Chr1_+_18035967_18035967 | 0.15 |
AT1G48750.1
|
AT1G48750
|
Bifunctional inhibitor/lipid-transfer protein/seed storage 2S albumin superfamily protein |
| arTal_v1_Chr4_+_14418556_14418605 | 0.15 |
AT4G29240.1
AT4G29240.2 |
AT4G29240
|
Leucine-rich repeat (LRR) family protein |
| arTal_v1_Chr2_-_18706266_18706401 | 0.15 |
AT2G45400.4
AT2G45400.2 AT2G45400.1 |
BEN1
|
NAD(P)-binding Rossmann-fold superfamily protein |
| arTal_v1_Chr2_-_9527845_9527845 | 0.15 |
AT2G22430.1
|
HB6
|
homeobox protein 6 |
| arTal_v1_Chr5_-_834549_834549 | 0.15 |
AT5G03380.1
|
AT5G03380
|
Heavy metal transport/detoxification superfamily protein |
| arTal_v1_Chr1_-_5077981_5077981 | 0.15 |
AT1G14740.1
|
TTA1
|
class I heat shock protein, putative (DUF1423) |
| arTal_v1_Chr5_+_21700187_21700202 | 0.14 |
AT5G53460.1
AT5G53460.3 AT5G53460.2 |
GLT1
|
NADH-dependent glutamate synthase 1 |
| arTal_v1_Chr4_-_17044555_17044599 | 0.14 |
AT4G36020.3
AT4G36020.1 AT4G36020.2 |
CSDP1
|
cold shock domain protein 1 |
| arTal_v1_Chr5_-_26810116_26810116 | 0.14 |
AT5G67190.1
|
DEAR2
|
DREB and EAR motif protein 2 |
| arTal_v1_Chr2_+_17543005_17543005 | 0.14 |
AT2G42040.1
|
AT2G42040
|
WRC protein |
| arTal_v1_Chr1_-_16137463_16137463 | 0.13 |
AT1G42990.1
|
BZIP60
|
basic region/leucine zipper motif 60 |
| arTal_v1_Chr2_-_13864596_13864710 | 0.13 |
AT2G32690.2
AT2G32690.3 AT2G32690.5 AT2G32690.4 AT2G32690.1 |
GRP23
|
glycine-rich protein 23 |
| arTal_v1_Chr5_+_26939159_26939159 | 0.13 |
AT5G67520.3
AT5G67520.2 AT5G67520.1 |
APK4
|
adenosine-5'-phosphosulfate (APS) kinase 4 |
| arTal_v1_Chr2_-_19667192_19667192 | 0.13 |
AT2G48080.1
|
AT2G48080
|
oxidoreductase, 2OG-Fe(II) oxygenase family protein |
| arTal_v1_Chr3_+_8152038_8152038 | 0.13 |
AT3G22970.2
AT3G22970.1 |
AT3G22970
|
hypothetical protein (DUF506) |
| arTal_v1_Chr1_-_8935544_8935544 | 0.13 |
AT1G25440.1
|
BBX15
|
B-box type zinc finger protein with CCT domain-containing protein |
| arTal_v1_Chr1_-_17976663_17976663 | 0.13 |
AT1G48620.1
|
HON5
|
high mobility group A5 |
| arTal_v1_Chr5_+_25537074_25537074 | 0.13 |
AT5G63810.1
|
BGAL10
|
beta-galactosidase 10 |
| arTal_v1_Chr5_-_17831336_17831336 | 0.13 |
AT5G44260.1
|
AT5G44260
|
Zinc finger C-x8-C-x5-C-x3-H type family protein |
| arTal_v1_Chr5_-_8643516_8643516 | 0.13 |
AT5G25070.1
|
AT5G25070
|
neurofilament light protein |
| arTal_v1_Chr1_+_474373_474373 | 0.13 |
AT1G02370.1
|
AT1G02370
|
Tetratricopeptide repeat (TPR)-like superfamily protein |
| arTal_v1_Chr1_-_30129649_30129649 | 0.12 |
AT1G80080.1
|
TMM
|
Leucine-rich repeat (LRR) family protein |
| arTal_v1_Chr1_-_20967162_20967180 | 0.12 |
AT1G56060.2
AT1G56060.1 |
AT1G56060
|
cysteine-rich/transmembrane domain protein B |
| arTal_v1_Chr5_+_26660311_26660311 | 0.12 |
AT5G66770.1
|
AT5G66770
|
GRAS family transcription factor |
| arTal_v1_Chr5_+_23098872_23098872 | 0.12 |
AT5G57080.1
|
AT5G57080
|
transmembrane protein |
| arTal_v1_Chr4_-_16853035_16853035 | 0.12 |
AT4G35480.1
|
RHA3B
|
RING-H2 finger A3B |
| arTal_v1_Chr5_+_7207166_7207166 | 0.12 |
AT5G21170.3
|
AKINBETA1
|
5'-AMP-activated protein kinase beta-2 subunit protein |
| arTal_v1_Chr3_-_23411988_23411988 | 0.12 |
AT3G63390.1
|
AT3G63390
|
hypothetical protein |
| arTal_v1_Chr1_+_4028595_4028692 | 0.12 |
AT1G11930.2
AT1G11930.1 |
AT1G11930
|
Putative pyridoxal phosphate-dependent enzyme, YBL036C type |
| arTal_v1_Chr2_+_19472573_19472573 | 0.12 |
AT2G47450.1
|
CAO
|
chloroplast signal recognition particle component (CAO) |
| arTal_v1_Chr3_+_6605296_6605296 | 0.12 |
AT3G19100.1
|
AT3G19100
|
Protein kinase superfamily protein |
| arTal_v1_Chr3_+_10076809_10076819 | 0.12 |
AT3G27280.1
AT3G27280.2 |
PHB4
|
prohibitin 4 |
| arTal_v1_Chr1_+_26814260_26814260 | 0.11 |
AT1G71100.1
|
RSW10
|
Ribose 5-phosphate isomerase, type A protein |
| arTal_v1_Chr5_+_4156501_4156501 | 0.11 |
AT5G13100.1
|
AT5G13100
|
Gap junction beta-4 protein |
| arTal_v1_Chr3_-_18308091_18308091 | 0.11 |
AT3G49370.1
|
AT3G49370
|
Calcium-dependent protein kinase (CDPK) family protein |
| arTal_v1_Chr2_-_14211693_14211693 | 0.11 |
AT2G33550.1
|
AT2G33550
|
Homeodomain-like superfamily protein |
| arTal_v1_Chr1_-_29278631_29278631 | 0.11 |
AT1G77855.1
|
AT1G77855
|
BPS1-like protein |
| arTal_v1_Chr3_+_5081780_5081908 | 0.11 |
AT3G15095.2
AT3G15095.1 AT3G15095.3 |
HCF243
|
Serine/Threonine-kinase pakA-like protein |
| arTal_v1_Chr4_+_12909463_12909575 | 0.11 |
AT4G25170.1
AT4G25170.2 |
AT4G25170
|
Uncharacterized conserved protein (UCP012943) |
| arTal_v1_Chr2_+_12251784_12251784 | 0.11 |
AT2G28600.1
|
AT2G28600
|
P-loop containing nucleoside triphosphate hydrolases superfamily protein |
| arTal_v1_Chr4_+_17440177_17440177 | 0.11 |
AT4G36990.1
|
HSF4
|
heat shock factor 4 |
| arTal_v1_Chr4_+_17130246_17130246 | 0.11 |
AT4G36210.2
AT4G36210.1 AT4G36210.3 |
AT4G36210
|
transmembrane/coiled-coil protein (DUF726) |
| arTal_v1_Chr2_-_15151575_15151634 | 0.10 |
AT2G36080.3
AT2G36080.2 AT2G36080.4 AT2G36080.1 |
ABS2
|
AP2/B3-like transcriptional factor family protein |
| arTal_v1_Chr4_+_15490740_15490740 | 0.10 |
AT4G32030.2
|
AT4G32030
|
hypothetical protein |
| arTal_v1_Chr1_+_392831_392831 | 0.10 |
AT1G02110.1
|
AT1G02110
|
bZIP domain class transcription factor (DUF630 and DUF632) |
| arTal_v1_Chr3_-_5618322_5618322 | 0.10 |
AT3G16510.1
|
AT3G16510
|
Calcium-dependent lipid-binding (CaLB domain) family protein |
| arTal_v1_Chr1_+_10814612_10814612 | 0.10 |
AT1G30530.1
|
UGT78D1
|
UDP-glucosyl transferase 78D1 |
| arTal_v1_Chr3_+_3694956_3694956 | 0.10 |
AT3G11690.1
|
AT3G11690
|
hypothetical protein |
| arTal_v1_Chr4_+_15490566_15490566 | 0.10 |
AT4G32030.1
|
AT4G32030
|
hypothetical protein |
| arTal_v1_Chr1_-_17973303_17973402 | 0.10 |
AT1G48610.2
AT1G48610.1 |
AT1G48610
|
AT hook motif-containing protein |
| arTal_v1_Chr1_-_24807557_24807557 | 0.10 |
AT1G66480.1
|
AT1G66480
|
plastid movement impaired 2 |
| arTal_v1_Chr1_-_30244949_30244949 | 0.10 |
AT1G80450.1
|
AT1G80450
|
VQ motif-containing protein |
| arTal_v1_Chr4_+_13138957_13138957 | 0.10 |
AT4G25840.1
|
GPP1
|
glycerol-3-phosphatase 1 |
| arTal_v1_Chr5_+_22958509_22958509 | 0.10 |
AT5G56750.2
|
NDL1
|
N-MYC downregulated-like 1 |
| arTal_v1_Chr4_+_17540490_17540490 | 0.10 |
AT4G37260.1
|
MYB73
|
myb domain protein 73 |
| arTal_v1_Chr5_+_6833564_6833659 | 0.10 |
AT5G20250.2
AT5G20250.1 AT5G20250.4 AT5G20250.3 |
DIN10
|
Raffinose synthase family protein |
| arTal_v1_Chr5_+_23655140_23655140 | 0.10 |
AT5G58520.1
|
AT5G58520
|
Protein kinase superfamily protein |
| arTal_v1_Chr2_+_114926_114926 | 0.10 |
AT2G01190.1
|
PDE331
|
Octicosapeptide/Phox/Bem1p family protein |
| arTal_v1_Chr3_+_8410048_8410048 | 0.09 |
AT3G23450.1
|
AT3G23450
|
transmembrane protein |
| arTal_v1_Chr1_-_274569_274569 | 0.09 |
AT1G01740.5
AT1G01740.1 AT1G01740.4 |
BSK4
|
kinase with tetratricopeptide repeat domain-containing protein |
| arTal_v1_Chr5_+_4593198_4593198 | 0.09 |
AT5G14230.2
|
AT5G14230
|
ankyrin |
| arTal_v1_Chr5_-_21477024_21477024 | 0.09 |
AT5G52950.2
AT5G52950.1 |
AT5G52950
|
LIM domain protein |
| arTal_v1_Chr1_-_5243262_5243262 | 0.09 |
AT1G15230.1
|
AT1G15230
|
hypothetical protein |
| arTal_v1_Chr4_-_9421857_9421857 | 0.09 |
AT4G16750.1
|
AT4G16750
|
Integrase-type DNA-binding superfamily protein |
| arTal_v1_Chr4_+_17324519_17324519 | 0.09 |
AT4G36750.1
|
AT4G36750
|
Quinone reductase family protein |
| arTal_v1_Chr1_+_27784928_27784928 | 0.09 |
AT1G73880.1
|
UGT89B1
|
UDP-glucosyl transferase 89B1 |
| arTal_v1_Chr3_+_2413623_2413642 | 0.09 |
AT3G07565.1
AT3G07565.3 AT3G07565.4 AT3G07565.2 |
AT3G07565
|
histone H2A deubiquitinase (DUF3755) |
| arTal_v1_Chr4_+_16402129_16402265 | 0.09 |
AT4G34265.1
AT4G34265.4 AT4G34265.3 AT4G34265.2 AT4G34265.5 AT4G34265.6 |
AT4G34265
|
hypothetical protein |
| arTal_v1_Chr3_+_20210792_20210792 | 0.09 |
AT3G54600.1
|
DJ1F
|
Class I glutamine amidotransferase-like superfamily protein |
| arTal_v1_Chr5_+_7205667_7205667 | 0.09 |
AT5G21170.2
|
AKINBETA1
|
5'-AMP-activated protein kinase beta-2 subunit protein |
| arTal_v1_Chr1_-_5338326_5338326 | 0.09 |
AT1G15520.1
AT1G15520.2 |
ABCG40
|
pleiotropic drug resistance 12 |
| arTal_v1_Chr5_+_8005097_8005097 | 0.09 |
AT5G23730.1
|
RUP2
|
Transducin/WD40 repeat-like superfamily protein |
| arTal_v1_Chr5_-_25945442_25945442 | 0.09 |
AT5G64920.1
|
CIP8
|
COP1-interacting protein 8 |
| arTal_v1_Chr4_-_13016235_13016235 | 0.09 |
AT4G25470.1
|
CBF2
|
C-repeat/DRE binding factor 2 |
| arTal_v1_Chr4_+_17388649_17388649 | 0.08 |
AT4G36900.1
|
RAP2.10
|
related to AP2 10 |
| arTal_v1_Chr3_+_9120859_9120859 | 0.08 |
AT3G25030.3
|
AT3G25030
|
RING/U-box superfamily protein |
| arTal_v1_Chr5_+_7205477_7205477 | 0.08 |
AT5G21170.1
|
AKINBETA1
|
5'-AMP-activated protein kinase beta-2 subunit protein |
| arTal_v1_Chr5_+_25756272_25756272 | 0.08 |
AT5G64420.1
|
AT5G64420
|
DNA polymerase V family |
| arTal_v1_Chr4_+_15306702_15306702 | 0.08 |
AT4G31580.2
|
RSZ22
|
serine/arginine-rich 22 |
| arTal_v1_Chr5_+_23355337_23355337 | 0.08 |
AT5G57660.1
|
COL5
|
CONSTANS-like 5 |
| arTal_v1_Chr4_+_11484981_11484981 | 0.08 |
AT4G21600.1
|
ENDO5
|
endonuclease 5 |
| arTal_v1_Chr5_-_25379246_25379297 | 0.08 |
AT5G63320.1
AT5G63320.2 AT5G63320.3 |
NPX1
|
nuclear protein X1 |
| arTal_v1_Chr1_-_29965758_29965795 | 0.08 |
AT1G79630.2
AT1G79630.1 AT1G79630.7 AT1G79630.5 AT1G79630.4 AT1G79630.8 AT1G79630.3 AT1G79630.6 |
AT1G79630
|
Protein phosphatase 2C family protein |
| arTal_v1_Chr1_-_13125263_13125328 | 0.08 |
AT1G35580.3
AT1G35580.1 AT1G35580.2 |
CINV1
|
cytosolic invertase 1 |
| arTal_v1_Chr5_-_1931782_1931782 | 0.08 |
AT5G06320.1
|
NHL3
|
NDR1/HIN1-like 3 |
| arTal_v1_Chr4_+_4797841_4797841 | 0.08 |
AT4G07950.1
|
AT4G07950
|
DNA-directed RNA polymerase, subunit M, archaeal |
| arTal_v1_Chr4_+_7239200_7239200 | 0.08 |
AT4G12080.1
|
AHL1
|
AT-hook motif nuclear-localized protein 1 |
| arTal_v1_Chr5_-_22332078_22332078 | 0.08 |
AT5G55040.2
AT5G55040.1 |
AT5G55040
|
DNA-binding bromodomain-containing protein |
| arTal_v1_Chr1_+_18351324_18351324 | 0.08 |
AT1G49580.1
|
AT1G49580
|
Calcium-dependent protein kinase (CDPK) family protein |
| arTal_v1_Chr3_-_1583073_1583073 | 0.08 |
AT3G05470.1
|
AT3G05470
|
Actin-binding FH2 (formin homology 2) family protein |
| arTal_v1_Chr3_+_17935256_17935256 | 0.08 |
AT3G48430.1
|
REF6
|
relative of early flowering 6 |
| arTal_v1_Chr1_-_7531108_7531108 | 0.08 |
AT1G21500.1
|
AT1G21500
|
hypothetical protein |
| arTal_v1_Chr2_+_15514923_15514923 | 0.08 |
AT2G36950.1
|
AT2G36950
|
Heavy metal transport/detoxification superfamily protein |
| arTal_v1_Chr5_+_26749826_26749826 | 0.08 |
AT5G67020.1
|
AT5G67020
|
hypothetical protein |
| arTal_v1_Chr2_-_10122479_10122479 | 0.08 |
AT2G23770.1
|
LYK4
|
protein kinase family protein / peptidoglycan-binding LysM domain-containing protein |
| arTal_v1_Chr4_+_15306544_15306544 | 0.08 |
AT4G31580.1
|
RSZ22
|
serine/arginine-rich 22 |
| arTal_v1_Chr5_-_26456154_26456154 | 0.08 |
AT5G66200.1
|
ARO2
|
armadillo repeat only 2 |
| arTal_v1_Chr5_-_24317935_24317935 | 0.08 |
AT5G60460.2
|
AT5G60460
|
Preprotein translocase Sec, Sec61-beta subunit protein |
| arTal_v1_Chr4_+_1258532_1258532 | 0.08 |
AT4G02820.1
|
AT4G02820
|
Pentatricopeptide repeat (PPR) superfamily protein |
| arTal_v1_Chr5_-_24975632_24975708 | 0.08 |
AT5G62170.1
AT5G62170.2 AT5G62170.4 AT5G62170.3 |
TRM25
|
LOW protein: M-phase inducer phosphatase-like protein |
| arTal_v1_Chr5_+_15439249_15439249 | 0.08 |
AT5G38560.1
|
PERK8
|
Protein kinase superfamily protein |
| arTal_v1_Chr5_+_16781858_16781858 | 0.07 |
AT5G41940.1
|
AT5G41940
|
Ypt/Rab-GAP domain of gyp1p superfamily protein |
| arTal_v1_Chr2_+_15075343_15075343 | 0.07 |
AT2G35920.2
AT2G35920.3 |
AT2G35920
|
RNA helicase family protein |
| arTal_v1_Chr4_+_10061214_10061214 | 0.07 |
AT4G18170.1
|
WRKY28
|
WRKY DNA-binding protein 28 |
| arTal_v1_Chr1_+_19125583_19125583 | 0.07 |
AT1G51580.1
|
AT1G51580
|
RNA-binding KH domain-containing protein |
| arTal_v1_Chr3_+_6146015_6146058 | 0.07 |
AT3G17950.3
AT3G17950.1 AT3G17950.2 |
AT3G17950
|
transmembrane protein |
| arTal_v1_Chr5_-_24318241_24318241 | 0.07 |
AT5G60460.1
|
AT5G60460
|
Preprotein translocase Sec, Sec61-beta subunit protein |
| arTal_v1_Chr1_+_23569538_23569538 | 0.07 |
AT1G63550.1
|
AT1G63550
|
Receptor-like protein kinase-related family protein |
| arTal_v1_Chr5_+_22341750_22341750 | 0.07 |
AT5G55060.2
AT5G55060.1 |
AT5G55060
|
Rab3 GTPase-activating protein catalytic subunit |
| arTal_v1_Chr2_-_19650287_19650313 | 0.07 |
AT2G48030.1
AT2G48030.2 |
AT2G48030
|
DNAse I-like superfamily protein |
| arTal_v1_Chr1_-_274792_274930 | 0.07 |
AT1G01740.2
AT1G01740.3 |
BSK4
|
kinase with tetratricopeptide repeat domain-containing protein |
| arTal_v1_Chr3_+_6273966_6273966 | 0.07 |
AT3G18290.1
|
BTS
|
zinc finger protein-like protein |
| arTal_v1_Chr5_+_320349_320349 | 0.07 |
AT5G01830.1
|
SAUR21
|
ARM repeat superfamily protein |
| arTal_v1_Chr2_-_10988924_10988924 | 0.07 |
AT2G25760.2
|
AT2G25760
|
Protein kinase family protein |
| arTal_v1_Chr3_+_18255961_18255961 | 0.07 |
AT3G49240.1
|
emb1796
|
Pentatricopeptide repeat (PPR) superfamily protein |
| arTal_v1_Chr2_-_18888789_18888847 | 0.07 |
AT2G45900.2
AT2G45900.3 |
TRM13
|
Phosphatidylinositol N-acetyglucosaminlytransferase subunit P-like protein |
| arTal_v1_Chr2_-_10989117_10989117 | 0.07 |
AT2G25760.1
|
AT2G25760
|
Protein kinase family protein |
| arTal_v1_Chr5_+_26564560_26564691 | 0.07 |
AT5G66560.3
AT5G66560.4 |
AT5G66560
|
Phototropic-responsive NPH3 family protein |
| arTal_v1_Chr5_-_6730395_6730407 | 0.06 |
AT5G19900.1
AT5G19900.2 AT5G19900.5 AT5G19900.4 AT5G19900.3 |
AT5G19900
|
PRLI-interacting factor |
| arTal_v1_Chr2_+_9270784_9270844 | 0.06 |
AT2G21710.2
AT2G21710.1 AT2G21710.3 |
EMB2219
|
Mitochondrial transcription termination factor family protein |
| arTal_v1_Chr3_+_23172754_23172754 | 0.06 |
AT3G62660.1
|
GATL7
|
galacturonosyltransferase-like 7 |
| arTal_v1_Chr4_-_13935408_13935479 | 0.06 |
AT4G28020.4
AT4G28020.1 AT4G28020.2 |
AT4G28020
|
tRNA-thr(GGU) m(6)t(6)A37 methyltransferase |
| arTal_v1_Chr1_+_18416474_18416475 | 0.06 |
AT1G49760.2
AT1G49760.1 |
PAB8
|
poly(A) binding protein 8 |
| arTal_v1_Chr2_+_15075591_15075591 | 0.06 |
AT2G35920.1
|
AT2G35920
|
RNA helicase family protein |
| arTal_v1_Chr5_-_3728726_3728726 | 0.06 |
AT5G11590.1
|
TINY2
|
Integrase-type DNA-binding superfamily protein |
| arTal_v1_Chr4_+_2505979_2505979 | 0.06 |
AT4G04925.1
|
AT4G04925
|
transmembrane protein |
| arTal_v1_Chr2_-_18705625_18705625 | 0.06 |
AT2G45400.3
|
BEN1
|
NAD(P)-binding Rossmann-fold superfamily protein |
| arTal_v1_Chr3_+_3267825_3267879 | 0.06 |
AT3G10490.3
AT3G10490.2 AT3G10490.1 |
NAC052
|
NAC domain containing protein 52 |
| arTal_v1_Chr4_-_13934936_13934936 | 0.06 |
AT4G28020.3
|
AT4G28020
|
tRNA-thr(GGU) m(6)t(6)A37 methyltransferase |
| arTal_v1_Chr5_-_3709403_3709403 | 0.06 |
AT5G11550.1
|
AT5G11550
|
ARM repeat superfamily protein |
| arTal_v1_Chr5_+_22341967_22341967 | 0.06 |
AT5G55060.3
|
AT5G55060
|
Rab3 GTPase-activating protein catalytic subunit |
| arTal_v1_Chr5_+_1378954_1378954 | 0.06 |
AT5G04770.3
|
CAT6
|
cationic amino acid transporter 6 |
| arTal_v1_Chr5_+_1378788_1378788 | 0.06 |
AT5G04770.2
|
CAT6
|
cationic amino acid transporter 6 |
| arTal_v1_Chr5_+_1378621_1378621 | 0.05 |
AT5G04770.1
|
CAT6
|
cationic amino acid transporter 6 |
| arTal_v1_Chr1_-_26872152_26872152 | 0.05 |
AT1G71280.1
AT1G71280.2 |
AT1G71280
|
DEA(D/H)-box RNA helicase family protein |
| arTal_v1_Chr1_+_19045615_19045615 | 0.05 |
AT1G51370.2
|
AT1G51370
|
F-box/RNI-like/FBD-like domains-containing protein |
| arTal_v1_Chr2_-_18889178_18889178 | 0.05 |
AT2G45900.1
|
TRM13
|
Phosphatidylinositol N-acetyglucosaminlytransferase subunit P-like protein |
| arTal_v1_Chr3_-_23186720_23186720 | 0.05 |
AT3G62690.1
|
ATL5
|
AtL5 |
| arTal_v1_Chr5_+_26564188_26564188 | 0.05 |
AT5G66560.1
|
AT5G66560
|
Phototropic-responsive NPH3 family protein |
| arTal_v1_Chr5_+_7226606_7226606 | 0.05 |
AT5G21482.1
|
CKX7
|
cytokinin oxidase 7 |
| arTal_v1_Chr3_-_155639_155657 | 0.05 |
AT3G01410.2
AT3G01410.1 |
AT3G01410
|
Polynucleotidyl transferase, ribonuclease H-like superfamily protein |
| arTal_v1_Chr1_-_344400_344400 | 0.05 |
AT1G01990.1
|
AT1G01990
|
hypothetical protein |
| arTal_v1_Chr5_-_315405_315405 | 0.05 |
AT5G01820.1
|
SR1
|
serine/threonine protein kinase 1 |
| arTal_v1_Chr5_+_23096024_23096024 | 0.05 |
AT5G57070.1
|
AT5G57070
|
hydroxyproline-rich glycoprotein family protein |
| arTal_v1_Chr1_-_9733000_9733000 | 0.05 |
AT1G27930.1
|
AT1G27930
|
glucuronoxylan 4-O-methyltransferase-like protein (DUF579) |
| arTal_v1_Chr2_-_11685342_11685342 | 0.05 |
AT2G27310.1
|
AT2G27310
|
F-box family protein |
| arTal_v1_Chr3_+_19184926_19184926 | 0.05 |
AT3G51720.1
|
AT3G51720
|
WEB family protein (DUF827) |
| arTal_v1_Chr4_+_15106558_15106614 | 0.05 |
AT4G31010.1
AT4G31010.2 |
AT4G31010
|
RNA-binding CRS1 / YhbY (CRM) domain-containing protein |
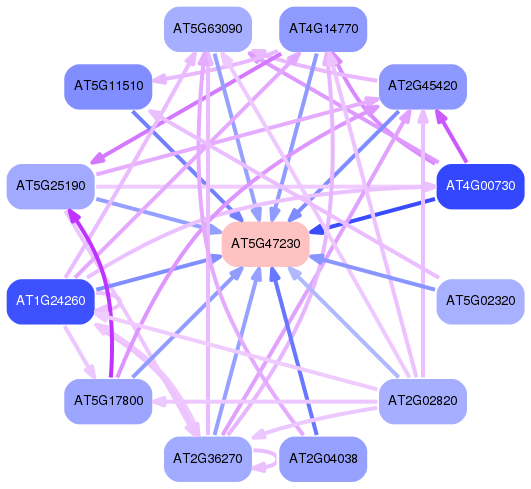
Network of associatons between targets according to the STRING database.

First level regulatory network of AT5G47230
Gene Ontology Analysis
Gene overrepresentation in biological process category:
| Log-likelihood per target | Total log-likelihood | Term | Description |
|---|---|---|---|
| 0.1 | 0.2 | GO:0051973 | positive regulation of telomerase activity(GO:0051973) |
| 0.0 | 0.1 | GO:0010501 | RNA secondary structure unwinding(GO:0010501) |
| 0.0 | 0.2 | GO:0019218 | regulation of brassinosteroid biosynthetic process(GO:0010422) regulation of steroid metabolic process(GO:0019218) regulation of steroid biosynthetic process(GO:0050810) regulation of steroid hormone biosynthetic process(GO:0090030) |
| 0.0 | 0.1 | GO:0097054 | L-glutamate biosynthetic process(GO:0097054) |
| 0.0 | 0.3 | GO:0031118 | rRNA pseudouridine synthesis(GO:0031118) |
| 0.0 | 0.1 | GO:0006386 | termination of RNA polymerase III transcription(GO:0006386) |
| 0.0 | 0.2 | GO:0072334 | UDP-galactose transport(GO:0015785) UDP-galactose transmembrane transport(GO:0072334) |
| 0.0 | 0.1 | GO:0010376 | stomatal complex formation(GO:0010376) |
| 0.0 | 0.1 | GO:0030174 | regulation of DNA-dependent DNA replication initiation(GO:0030174) |
| 0.0 | 0.1 | GO:0015692 | lead ion transport(GO:0015692) abscisic acid transport(GO:0080168) |
| 0.0 | 0.1 | GO:0019401 | alditol biosynthetic process(GO:0019401) |
| 0.0 | 0.1 | GO:1903792 | negative regulation of anion channel activity(GO:0010360) regulation of anion channel activity by blue light(GO:0010361) negative regulation of anion channel activity by blue light(GO:0010362) negative regulation of transporter activity(GO:0032410) negative regulation of ion transmembrane transporter activity(GO:0032413) negative regulation of transmembrane transport(GO:0034763) negative regulation of ion transmembrane transport(GO:0034766) negative regulation of anion transport(GO:1903792) negative regulation of anion transmembrane transport(GO:1903960) |
| 0.0 | 0.4 | GO:0061572 | actin filament bundle assembly(GO:0051017) actin filament bundle organization(GO:0061572) |
| 0.0 | 0.1 | GO:0045038 | protein import into chloroplast thylakoid membrane(GO:0045038) |
| 0.0 | 0.2 | GO:0009864 | induced systemic resistance, jasmonic acid mediated signaling pathway(GO:0009864) |
| 0.0 | 0.2 | GO:0016584 | nucleosome positioning(GO:0016584) |
| 0.0 | 0.1 | GO:0071323 | cellular response to chitin(GO:0071323) |
| 0.0 | 0.0 | GO:0034626 | fatty acid elongation, saturated fatty acid(GO:0019367) fatty acid elongation, unsaturated fatty acid(GO:0019368) fatty acid elongation, monounsaturated fatty acid(GO:0034625) fatty acid elongation, polyunsaturated fatty acid(GO:0034626) |
| 0.0 | 0.1 | GO:0018315 | molybdenum incorporation into molybdenum-molybdopterin complex(GO:0018315) metal incorporation into metallo-molybdopterin complex(GO:0042040) |
| 0.0 | 0.1 | GO:0031204 | posttranslational protein targeting to membrane, translocation(GO:0031204) |
| 0.0 | 0.1 | GO:0070814 | hydrogen sulfide biosynthetic process(GO:0070814) |
| 0.0 | 0.1 | GO:0009052 | pentose-phosphate shunt, non-oxidative branch(GO:0009052) |
| 0.0 | 0.1 | GO:0010929 | positive regulation of auxin mediated signaling pathway(GO:0010929) |
| 0.0 | 0.1 | GO:0035067 | histone H3-K9 demethylation(GO:0033169) negative regulation of histone acetylation(GO:0035067) negative regulation of protein acetylation(GO:1901984) negative regulation of peptidyl-lysine acetylation(GO:2000757) |
| 0.0 | 0.1 | GO:0048871 | multicellular organismal homeostasis(GO:0048871) |
| 0.0 | 0.0 | GO:0010288 | response to lead ion(GO:0010288) |
| 0.0 | 0.0 | GO:0010541 | acropetal auxin transport(GO:0010541) |
Gene overrepresentation in cellular component category:
| Log-likelihood per target | Total log-likelihood | Term | Description |
|---|---|---|---|
| 0.0 | 0.4 | GO:0005884 | actin filament(GO:0005884) |
| 0.0 | 0.2 | GO:0072588 | box H/ACA snoRNP complex(GO:0031429) box H/ACA RNP complex(GO:0072588) |
| 0.0 | 0.3 | GO:0031588 | nucleotide-activated protein kinase complex(GO:0031588) |
| 0.0 | 0.1 | GO:0031205 | endoplasmic reticulum Sec complex(GO:0031205) |
| 0.0 | 0.0 | GO:0009514 | glyoxysome(GO:0009514) |
Gene overrepresentation in molecular function category:
| Log-likelihood per target | Total log-likelihood | Term | Description |
|---|---|---|---|
| 0.1 | 0.3 | GO:1901982 | disaccharide binding(GO:0048030) maltose binding(GO:1901982) |
| 0.1 | 0.5 | GO:0016621 | cinnamoyl-CoA reductase activity(GO:0016621) |
| 0.1 | 0.2 | GO:0034513 | box H/ACA snoRNA binding(GO:0034513) |
| 0.0 | 0.2 | GO:0005460 | UDP-glucose transmembrane transporter activity(GO:0005460) |
| 0.0 | 0.1 | GO:0015930 | glutamate synthase activity(GO:0015930) glutamate synthase (NADH) activity(GO:0016040) glutamate synthase activity, NAD(P)H as acceptor(GO:0045181) |
| 0.0 | 0.7 | GO:0005199 | structural constituent of cell wall(GO:0005199) |
| 0.0 | 0.1 | GO:0004751 | ribose-5-phosphate isomerase activity(GO:0004751) |
| 0.0 | 0.1 | GO:0019166 | trans-2-enoyl-CoA reductase (NADPH) activity(GO:0019166) |
| 0.0 | 0.1 | GO:0016426 | tRNA (adenine) methyltransferase activity(GO:0016426) |
| 0.0 | 0.1 | GO:0031492 | nucleosomal DNA binding(GO:0031492) |
| 0.0 | 0.1 | GO:0005223 | intracellular cGMP activated cation channel activity(GO:0005223) |
| 0.0 | 0.1 | GO:0043765 | T/G mismatch-specific endonuclease activity(GO:0043765) |
| 0.0 | 0.1 | GO:0003680 | AT DNA binding(GO:0003680) |
| 0.0 | 0.1 | GO:0005086 | ARF guanyl-nucleotide exchange factor activity(GO:0005086) |
| 0.0 | 0.1 | GO:0004020 | adenylylsulfate kinase activity(GO:0004020) |
| 0.0 | 0.1 | GO:0033836 | flavonol 7-O-beta-glucosyltransferase activity(GO:0033836) |
| 0.0 | 0.1 | GO:0047274 | galactinol-sucrose galactosyltransferase activity(GO:0047274) |
| 0.0 | 0.0 | GO:0016712 | oxidoreductase activity, acting on paired donors, with incorporation or reduction of molecular oxygen, reduced flavin or flavoprotein as one donor, and incorporation of one atom of oxygen(GO:0016712) aromatase activity(GO:0070330) |
| 0.0 | 0.1 | GO:0052622 | ATP dimethylallyltransferase activity(GO:0052622) ADP dimethylallyltransferase activity(GO:0052623) |
| 0.0 | 0.1 | GO:0009882 | blue light photoreceptor activity(GO:0009882) |
Gene overrepresentation in curated gene sets: REACTOME pathways category:
| Log-likelihood per target | Total log-likelihood | Term | Description |
|---|---|---|---|
| 0.1 | 0.5 | REACTOME CHEMOKINE RECEPTORS BIND CHEMOKINES | Genes involved in Chemokine receptors bind chemokines |