Project
GSE43616: Time-course of wild-type Arabidopsis leaf
Navigation
Downloads
Results for AT5G05410
Z-value: 0.04
Transcription factors associated with AT5G05410
| Gene Symbol | Gene ID | Gene Info |
|---|---|---|
|
AT5G05410
|
AT5G05410 | DRE-binding protein 2A |
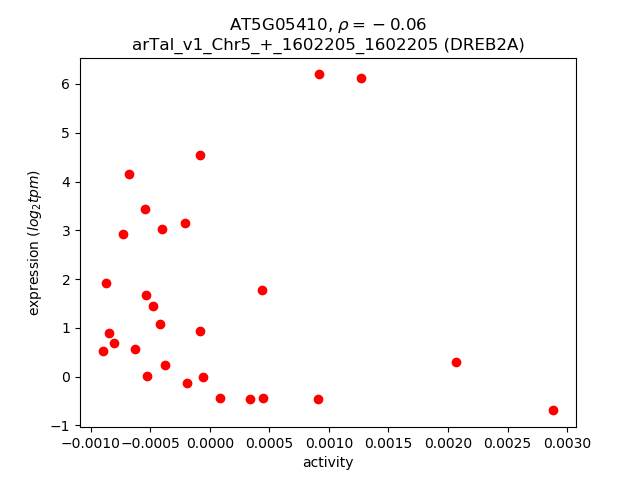
Activity-expression correlation:
| Gene | Promoter | Pearson corr. coef. | P-value | Plot |
|---|---|---|---|---|
| DREB2A | arTal_v1_Chr5_+_1602205_1602205 | -0.06 | 7.5e-01 | Click! |
Activity profile of AT5G05410 motif
Sorted Z-values of AT5G05410 motif
| Promoter | Log-likelihood | Transcript | Gene | Gene Info |
|---|---|---|---|---|
| arTal_v1_Chr5_-_5741500_5741500 | 0.06 |
AT5G17420.1
|
IRX3
|
Cellulose synthase family protein |
| arTal_v1_Chr4_-_16063070_16063251 | 0.02 |
AT4G33330.2
AT4G33330.1 AT4G33330.5 AT4G33330.3 AT4G33330.4 |
PGSIP3
|
plant glycogenin-like starch initiation protein 3 |
| arTal_v1_Chr1_+_27076020_27076020 | 0.02 |
AT1G71930.1
|
VND7
|
vascular related NAC-domain protein 7 |
| arTal_v1_Chr1_+_27074702_27074702 | 0.01 |
AT1G71930.2
|
VND7
|
vascular related NAC-domain protein 7 |
| arTal_v1_Chr5_-_4065075_4065075 | 0.00 |
AT5G12870.1
|
MYB46
|
myb domain protein 46 |
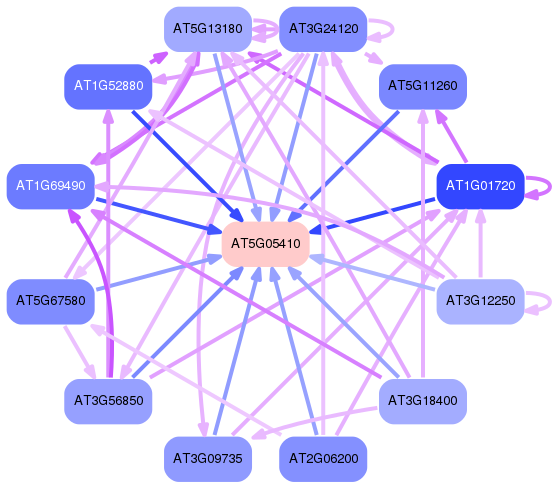
Network of associatons between targets according to the STRING database.

First level regulatory network of AT5G05410
Gene Ontology Analysis
Gene overrepresentation in biological process category:
| Log-likelihood per target | Total log-likelihood | Term | Description |
|---|---|---|---|
| 0.0 | 0.1 | GO:0010395 | rhamnogalacturonan I metabolic process(GO:0010395) |
Gene overrepresentation in cellular component category:
| Log-likelihood per target | Total log-likelihood | Term | Description |
|---|---|---|---|
| 0.0 | 0.1 | GO:0010330 | cellulose synthase complex(GO:0010330) |