Project
GSE43616: Time-course of wild-type Arabidopsis leaf
Navigation
Downloads
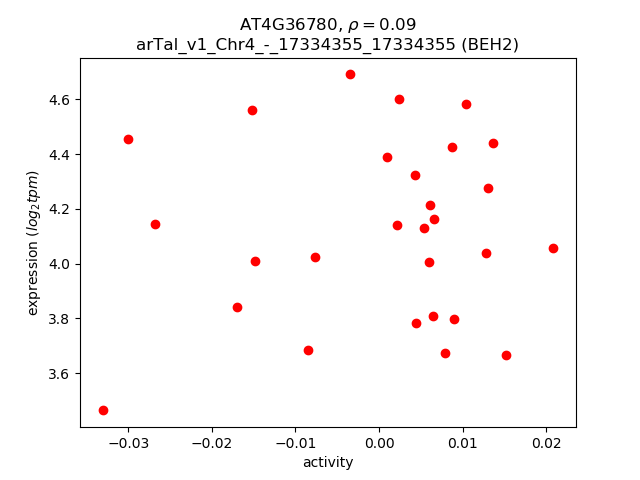
Results for AT4G36780
Z-value: 1.17
Transcription factors associated with AT4G36780
| Gene Symbol | Gene ID | Gene Info |
|---|---|---|
|
AT4G36780
|
AT4G36780 | BES1/BZR1 homolog 2 |
Activity-expression correlation:
| Gene | Promoter | Pearson corr. coef. | P-value | Plot |
|---|---|---|---|---|
| BEH2 | arTal_v1_Chr4_-_17334355_17334355 | 0.09 | 6.7e-01 | Click! |
Activity profile of AT4G36780 motif
Sorted Z-values of AT4G36780 motif
| Promoter | Log-likelihood | Transcript | Gene | Gene Info |
|---|---|---|---|---|
| arTal_v1_Chr3_-_21189859_21189967 | 3.73 |
AT3G57260.1
AT3G57260.2 |
BGL2
|
beta-1,3-glucanase 2 |
| arTal_v1_Chr1_+_21207537_21207537 | 3.43 |
AT1G56600.1
|
GolS2
|
galactinol synthase 2 |
| arTal_v1_Chr1_+_11310997_11310997 | 2.97 |
AT1G31580.1
|
ECS1
|
ECS1 |
| arTal_v1_Chr1_+_8542212_8542212 | 2.82 |
AT1G24147.1
|
AT1G24147
|
transmembrane protein |
| arTal_v1_Chr5_-_3402389_3402389 | 2.73 |
AT5G10760.1
|
AT5G10760
|
Eukaryotic aspartyl protease family protein |
| arTal_v1_Chr2_+_7845923_7845999 | 2.67 |
AT2G18050.2
AT2G18050.1 |
HIS1-3
|
histone H1-3 |
| arTal_v1_Chr2_-_6493512_6493512 | 2.65 |
AT2G15020.1
|
AT2G15020
|
hypothetical protein |
| arTal_v1_Chr1_+_19515143_19515151 | 2.56 |
AT1G52400.3
AT1G52400.2 |
BGLU18
|
beta glucosidase 18 |
| arTal_v1_Chr1_+_19514989_19514989 | 2.46 |
AT1G52400.1
|
BGLU18
|
beta glucosidase 18 |
| arTal_v1_Chr1_+_1882907_1882907 | 2.43 |
AT1G06160.1
|
ORA59
|
octadecanoid-responsive AP2/ERF 59 |
| arTal_v1_Chr3_-_1286760_1286760 | 2.42 |
AT3G04720.1
|
PR4
|
pathogenesis-related 4 |
| arTal_v1_Chr2_-_6242541_6242541 | 2.39 |
AT2G14610.1
|
PR1
|
pathogenesis-related protein 1 |
| arTal_v1_Chr3_+_5243432_5243432 | 2.09 |
AT3G15510.1
|
NAC2
|
NAC domain containing protein 2 |
| arTal_v1_Chr2_-_16690182_16690182 | 2.04 |
AT2G39980.1
|
AT2G39980
|
HXXXD-type acyl-transferase family protein |
| arTal_v1_Chr3_-_22907958_22907958 | 2.04 |
AT3G61880.1
AT3G61880.2 |
CYP78A9
|
cytochrome p450 78a9 |
| arTal_v1_Chr5_-_1459039_1459039 | 1.95 |
AT5G04950.1
|
NAS1
|
nicotianamine synthase 1 |
| arTal_v1_Chr3_-_23355480_23355480 | 1.94 |
AT3G63210.1
|
AT3G63210
|
mediator of aba-regulated dormancy protein (DUF581) |
| arTal_v1_Chr1_-_30142697_30142697 | 1.91 |
AT1G80130.1
|
AT1G80130
|
Tetratricopeptide repeat (TPR)-like superfamily protein |
| arTal_v1_Chr1_-_27171410_27171410 | 1.90 |
AT1G72200.1
|
AT1G72200
|
RING/U-box superfamily protein |
| arTal_v1_Chr3_+_19239305_19239412 | 1.89 |
AT3G51860.1
AT3G51860.2 |
CAX3
|
cation exchanger 3 |
| arTal_v1_Chr5_-_21265460_21265460 | 1.87 |
AT5G52390.1
|
AT5G52390
|
PAR1 protein |
| arTal_v1_Chr4_+_2445775_2445794 | 1.82 |
AT4G04830.1
AT4G04830.2 |
MSRB5
|
methionine sulfoxide reductase B5 |
| arTal_v1_Chr5_+_23928954_23928954 | 1.82 |
AT5G59320.1
|
LTP3
|
lipid transfer protein 3 |
| arTal_v1_Chr3_-_9375671_9375671 | 1.79 |
AT3G25717.1
|
RTFL16
|
ROTUNDIFOLIA like 16 |
| arTal_v1_Chr1_+_6450585_6450585 | 1.79 |
AT1G18710.1
|
MYB47
|
myb domain protein 47 |
| arTal_v1_Chr2_+_15528877_15528877 | 1.78 |
AT2G36970.1
|
AT2G36970
|
UDP-Glycosyltransferase superfamily protein |
| arTal_v1_Chr3_-_20475332_20475332 | 1.77 |
AT3G55240.1
|
AT3G55240
|
Plant protein 1589 of unknown function |
| arTal_v1_Chr1_+_7366775_7366775 | 1.73 |
AT1G21050.1
|
AT1G21050
|
MIZU-KUSSEI-like protein (Protein of unknown function, DUF617) |
| arTal_v1_Chr2_+_17507343_17507343 | 1.71 |
AT2G41940.1
|
ZFP8
|
zinc finger protein 8 |
| arTal_v1_Chr1_+_7366590_7366590 | 1.67 |
AT1G21050.2
|
AT1G21050
|
MIZU-KUSSEI-like protein (Protein of unknown function, DUF617) |
| arTal_v1_Chr4_-_15903523_15903523 | 1.66 |
AT4G32940.1
|
GAMMA-VPE
|
gamma vacuolar processing enzyme |
| arTal_v1_Chr5_-_24083528_24083562 | 1.66 |
AT5G59780.2
AT5G59780.1 AT5G59780.3 |
MYB59
|
myb domain protein 59 |
| arTal_v1_Chr4_-_13998604_13998604 | 1.64 |
AT4G28240.1
|
AT4G28240
|
Wound-responsive family protein |
| arTal_v1_Chr1_-_12003005_12003005 | 1.63 |
AT1G33102.1
|
AT1G33102
|
hypothetical protein |
| arTal_v1_Chr2_-_12542465_12542465 | 1.62 |
AT2G29170.1
|
AT2G29170
|
NAD(P)-binding Rossmann-fold superfamily protein |
| arTal_v1_Chr5_+_17806397_17806397 | 1.61 |
AT5G44210.1
|
ERF9
|
erf domain protein 9 |
| arTal_v1_Chr5_+_7703041_7703092 | 1.60 |
AT5G23010.2
AT5G23010.1 AT5G23010.3 |
MAM1
|
methylthioalkylmalate synthase 1 |
| arTal_v1_Chr2_-_14537556_14537556 | 1.60 |
AT2G34490.1
|
CYP710A2
|
cytochrome P450, family 710, subfamily A, polypeptide 2 |
| arTal_v1_Chr1_-_13117235_13117235 | 1.59 |
AT1G35560.1
|
AT1G35560
|
TCP family transcription factor |
| arTal_v1_Chr2_+_17909007_17909007 | 1.58 |
AT2G43060.1
|
IBH1
|
ILI1 binding bHLH 1 |
| arTal_v1_Chr3_+_11527756_11527756 | 1.56 |
AT3G29670.1
|
PMAT2
|
HXXXD-type acyl-transferase family protein |
| arTal_v1_Chr3_-_9595283_9595283 | 1.55 |
AT3G26210.1
|
CYP71B23
|
cytochrome P450, family 71, subfamily B, polypeptide 23 |
| arTal_v1_Chr4_+_11150049_11150049 | 1.55 |
AT4G20820.1
|
AT4G20820
|
FAD-binding Berberine family protein |
| arTal_v1_Chr4_-_13022996_13022996 | 1.54 |
AT4G25490.1
|
CBF1
|
C-repeat/DRE binding factor 1 |
| arTal_v1_Chr3_+_9406669_9406669 | 1.53 |
AT3G25770.1
|
AOC2
|
allene oxide cyclase 2 |
| arTal_v1_Chr4_-_7992429_7992429 | 1.53 |
AT4G13770.1
|
CYP83A1
|
cytochrome P450, family 83, subfamily A, polypeptide 1 |
| arTal_v1_Chr1_-_2175038_2175038 | 1.52 |
AT1G07090.1
|
LSH6
|
LIGHT-DEPENDENT SHORT HYPOCOTYLS-like protein (DUF640) |
| arTal_v1_Chr5_+_1615507_1615507 | 1.51 |
AT5G05460.1
|
ENGase85A
|
Glycosyl hydrolase family 85 |
| arTal_v1_Chr3_+_22602816_22602910 | 1.51 |
AT3G61060.1
AT3G61060.2 |
PP2-A13
|
phloem protein 2-A13 |
| arTal_v1_Chr2_-_17712290_17712330 | 1.48 |
AT2G42540.2
AT2G42540.4 AT2G42540.1 AT2G42540.3 |
COR15A
|
cold-regulated 15a |
| arTal_v1_Chr3_-_2890520_2890574 | 1.47 |
AT3G09390.2
AT3G09390.1 |
MT2A
|
metallothionein 2A |
| arTal_v1_Chr3_+_10061009_10061043 | 1.47 |
AT3G27250.1
AT3G27250.2 |
AT3G27250
|
hypothetical protein |
| arTal_v1_Chr4_+_2441241_2441241 | 1.45 |
AT4G04810.2
AT4G04810.1 |
MSRB4
|
methionine sulfoxide reductase B4 |
| arTal_v1_Chr1_+_28458691_28458691 | 1.44 |
AT1G75800.1
|
AT1G75800
|
Pathogenesis-related thaumatin superfamily protein |
| arTal_v1_Chr3_+_5341356_5341356 | 1.43 |
AT3G15780.1
|
AT3G15780
|
transmembrane protein |
| arTal_v1_Chr1_+_27931836_27931836 | 1.43 |
AT1G74290.1
|
AT1G74290
|
alpha/beta-Hydrolases superfamily protein |
| arTal_v1_Chr1_+_4794664_4794756 | 1.42 |
AT1G13990.1
AT1G13990.2 AT1G13990.3 |
AT1G13990
|
plant/protein |
| arTal_v1_Chr1_-_29518028_29518028 | 1.38 |
AT1G78450.1
|
AT1G78450
|
SOUL heme-binding family protein |
| arTal_v1_Chr1_-_28284036_28284168 | 1.38 |
AT1G75380.3
AT1G75380.1 AT1G75380.2 AT1G75380.4 |
BBD1
|
bifunctional nuclease in basal defense response 1 |
| arTal_v1_Chr3_+_4510965_4510965 | 1.37 |
AT3G13750.1
|
BGAL1
|
beta galactosidase 1 |
| arTal_v1_Chr1_-_24502776_24502776 | 1.36 |
AT1G65860.1
|
FMO GS-OX1
|
flavin-monooxygenase glucosinolate S-oxygenase 1 |
| arTal_v1_Chr1_-_24062804_24062804 | 1.35 |
AT1G64780.1
|
AMT1%3B2
|
ammonium transporter 1;2 |
| arTal_v1_Chr1_+_26687202_26687202 | 1.35 |
AT1G70760.1
|
NdhL
|
inorganic carbon transport protein-like protein |
| arTal_v1_Chr1_-_25446952_25446952 | 1.34 |
AT1G67865.1
|
AT1G67865
|
hypothetical protein |
| arTal_v1_Chr1_-_25447622_25447622 | 1.33 |
AT1G67865.2
|
AT1G67865
|
hypothetical protein |
| arTal_v1_Chr5_+_4776733_4776733 | 1.33 |
AT5G14780.1
AT5G14780.3 AT5G14780.2 |
FDH
|
formate dehydrogenase |
| arTal_v1_Chr1_+_25426234_25426234 | 1.32 |
AT1G67810.1
|
SUFE2
|
sulfur E2 |
| arTal_v1_Chr1_+_21017311_21017311 | 1.32 |
AT1G56150.1
|
AT1G56150
|
SAUR-like auxin-responsive protein family |
| arTal_v1_Chr1_-_105330_105330 | 1.31 |
AT1G01250.1
|
AT1G01250
|
Integrase-type DNA-binding superfamily protein |
| arTal_v1_Chr4_+_18519599_18519599 | 1.31 |
AT4G39940.1
|
AKN2
|
APS-kinase 2 |
| arTal_v1_Chr1_-_2287730_2287791 | 1.31 |
AT1G07440.2
AT1G07440.1 |
AT1G07440
|
NAD(P)-binding Rossmann-fold superfamily protein |
| arTal_v1_Chr4_-_14820595_14820595 | 1.30 |
AT4G30270.1
|
XTH24
|
xyloglucan endotransglucosylase/hydrolase 24 |
| arTal_v1_Chr5_+_26573964_26573964 | 1.30 |
AT5G66590.1
|
AT5G66590
|
CAP (Cysteine-rich secretory proteins, Antigen 5, and Pathogenesis-related 1 protein) superfamily protein |
| arTal_v1_Chr3_-_10790553_10790553 | 1.30 |
AT3G28740.1
|
CYP81D11
|
Cytochrome P450 superfamily protein |
| arTal_v1_Chr2_+_17920647_17920647 | 1.29 |
AT2G43100.1
|
IPMI2
|
isopropylmalate isomerase 2 |
| arTal_v1_Chr1_+_27092893_27092893 | 1.29 |
AT1G71970.1
|
AT1G71970
|
hypothetical protein |
| arTal_v1_Chr2_-_17403050_17403050 | 1.29 |
AT2G41710.3
AT2G41710.2 AT2G41710.1 AT2G41710.4 |
AT2G41710
|
Integrase-type DNA-binding superfamily protein |
| arTal_v1_Chr5_-_6428454_6428468 | 1.28 |
AT5G19150.2
AT5G19150.1 |
AT5G19150
|
pfkB-like carbohydrate kinase family protein |
| arTal_v1_Chr5_-_5177897_5177897 | 1.25 |
AT5G15850.1
|
COL1
|
CONSTANS-like 1 |
| arTal_v1_Chr5_+_17171807_17171807 | 1.25 |
AT5G42825.1
|
AT5G42825
|
hypothetical protein |
| arTal_v1_Chr2_-_9454270_9454300 | 1.24 |
AT2G22240.3
AT2G22240.1 |
MIPS2
|
myo-inositol-1-phosphate synthase 2 |
| arTal_v1_Chr4_+_11639757_11639757 | 1.24 |
AT4G21930.1
|
AT4G21930
|
senescence regulator (Protein of unknown function, DUF584) |
| arTal_v1_Chr5_-_3190321_3190321 | 1.22 |
AT5G10170.1
|
MIPS3
|
myo-inositol-1-phosphate synthase 3 |
| arTal_v1_Chr1_+_23159734_23159734 | 1.22 |
AT1G62560.1
AT1G62560.2 |
FMO GS-OX3
|
flavin-monooxygenase glucosinolate S-oxygenase 3 |
| arTal_v1_Chr4_+_9171280_9171280 | 1.22 |
AT4G16190.1
|
AT4G16190
|
Papain family cysteine protease |
| arTal_v1_Chr5_-_22312832_22312832 | 1.22 |
AT5G54960.1
|
PDC2
|
pyruvate decarboxylase-2 |
| arTal_v1_Chr1_-_149806_149848 | 1.21 |
AT1G01390.1
AT1G01390.2 |
AT1G01390
|
UDP-Glycosyltransferase superfamily protein |
| arTal_v1_Chr3_-_7993588_7993588 | 1.21 |
AT3G22550.1
|
AT3G22550
|
NAD(P)H-quinone oxidoreductase subunit, putative (DUF581) |
| arTal_v1_Chr5_+_17324909_17324909 | 1.21 |
AT5G43150.1
|
AT5G43150
|
elongation factor |
| arTal_v1_Chr3_-_8229619_8229619 | 1.20 |
AT3G23120.1
|
RLP38
|
receptor like protein 38 |
| arTal_v1_Chr2_+_17165191_17165191 | 1.20 |
AT2G41180.1
|
SIB2
|
VQ motif-containing protein |
| arTal_v1_Chr5_-_8916856_8916856 | 1.20 |
AT5G25610.1
|
RD22
|
BURP domain-containing protein |
| arTal_v1_Chr5_+_17798262_17798281 | 1.20 |
AT5G44190.2
AT5G44190.1 |
GLK2
|
GOLDEN2-like 2 |
| arTal_v1_Chr4_+_13890472_13890472 | 1.20 |
AT4G27900.1
AT4G27900.2 |
AT4G27900
|
CCT motif family protein |
| arTal_v1_Chr2_-_9454094_9454094 | 1.19 |
AT2G22240.2
|
MIPS2
|
myo-inositol-1-phosphate synthase 2 |
| arTal_v1_Chr4_+_7304323_7304323 | 1.19 |
AT4G12290.2
|
AT4G12290
|
Copper amine oxidase family protein |
| arTal_v1_Chr5_-_1139631_1139633 | 1.19 |
AT5G04150.2
AT5G04150.1 |
BHLH101
|
basic helix-loop-helix (bHLH) DNA-binding superfamily protein |
| arTal_v1_Chr5_-_5367612_5367612 | 1.19 |
AT5G16410.1
|
AT5G16410
|
HXXXD-type acyl-transferase family protein |
| arTal_v1_Chr5_+_22175461_22175461 | 1.19 |
AT5G54585.1
|
AT5G54585
|
hypothetical protein |
| arTal_v1_Chr2_+_9259511_9259511 | 1.19 |
AT2G21650.1
|
MEE3
|
Homeodomain-like superfamily protein |
| arTal_v1_Chr2_+_11364996_11364996 | 1.18 |
AT2G26695.2
AT2G26695.1 |
AT2G26695
|
Ran BP2/NZF zinc finger-like superfamily protein |
| arTal_v1_Chr3_+_10023931_10023931 | 1.17 |
AT3G27170.1
|
CLC-B
|
chloride channel B |
| arTal_v1_Chr4_+_7303985_7303985 | 1.17 |
AT4G12290.1
|
AT4G12290
|
Copper amine oxidase family protein |
| arTal_v1_Chr5_-_3447278_3447278 | 1.17 |
AT5G10930.1
|
CIPK5
|
CBL-interacting protein kinase 5 |
| arTal_v1_Chr2_+_9254378_9254378 | 1.17 |
AT2G21640.1
|
AT2G21640
|
marker for oxidative stress response protein |
| arTal_v1_Chr1_+_2238017_2238154 | 1.17 |
AT1G07280.1
AT1G07280.2 AT1G07280.4 AT1G07280.3 |
AT1G07280
|
Tetratricopeptide repeat (TPR)-like superfamily protein |
| arTal_v1_Chr4_-_11648644_11648644 | 1.17 |
AT4G21960.1
|
PRXR1
|
Peroxidase superfamily protein |
| arTal_v1_Chr5_-_8181107_8181107 | 1.17 |
AT5G24155.2
AT5G24155.3 AT5G24155.1 |
AT5G24155
|
FAD/NAD(P)-binding oxidoreductase family protein |
| arTal_v1_Chr3_+_19086344_19086452 | 1.16 |
AT3G51430.1
AT3G51430.2 |
YLS2
|
Calcium-dependent phosphotriesterase superfamily protein |
| arTal_v1_Chr3_-_8459990_8459990 | 1.16 |
AT3G23570.2
AT3G23570.3 |
AT3G23570
|
alpha/beta-Hydrolases superfamily protein |
| arTal_v1_Chr3_+_4544364_4544384 | 1.16 |
AT3G13810.5
AT3G13810.3 AT3G13810.4 AT3G13810.6 AT3G13810.2 AT3G13810.1 |
IDD11
|
indeterminate(ID)-domain 11 |
| arTal_v1_Chr2_-_852321_852321 | 1.16 |
AT2G02930.1
|
GSTF3
|
glutathione S-transferase F3 |
| arTal_v1_Chr2_+_16556801_16556801 | 1.15 |
AT2G39705.1
|
RTFL8
|
ROTUNDIFOLIA like 8 |
| arTal_v1_Chr5_-_20667312_20667312 | 1.15 |
AT5G50800.1
|
SWEET13
|
Nodulin MtN3 family protein |
| arTal_v1_Chr5_+_6127773_6127773 | 1.15 |
AT5G18470.1
|
AT5G18470
|
Curculin-like (mannose-binding) lectin family protein |
| arTal_v1_Chr1_+_27669152_27669152 | 1.14 |
AT1G73600.2
|
AT1G73600
|
S-adenosyl-L-methionine-dependent methyltransferases superfamily protein |
| arTal_v1_Chr1_+_27670626_27670626 | 1.14 |
AT1G73600.1
|
AT1G73600
|
S-adenosyl-L-methionine-dependent methyltransferases superfamily protein |
| arTal_v1_Chr5_-_2652535_2652535 | 1.14 |
AT5G08240.1
|
AT5G08240
|
transmembrane protein |
| arTal_v1_Chr5_+_19309227_19309227 | 1.14 |
AT5G47640.1
|
NF-YB2
|
nuclear factor Y, subunit B2 |
| arTal_v1_Chr1_-_19822399_19822399 | 1.13 |
AT1G53170.1
|
ERF8
|
ethylene response factor 8 |
| arTal_v1_Chr3_-_5598027_5598044 | 1.13 |
AT3G16470.2
AT3G16470.1 |
JR1
|
Mannose-binding lectin superfamily protein |
| arTal_v1_Chr1_+_11532199_11532199 | 1.12 |
AT1G32060.1
|
PRK
|
phosphoribulokinase |
| arTal_v1_Chr1_-_1552587_1552587 | 1.12 |
AT1G05310.1
|
AT1G05310
|
Pectin lyase-like superfamily protein |
| arTal_v1_Chr5_-_131687_131687 | 1.11 |
AT5G01320.1
|
AT5G01320
|
Thiamine pyrophosphate dependent pyruvate decarboxylase family protein |
| arTal_v1_Chr5_+_24480291_24480291 | 1.11 |
AT5G60850.1
|
OBP4
|
OBF binding protein 4 |
| arTal_v1_Chr5_+_6673874_6673874 | 1.11 |
AT5G19740.1
|
AT5G19740
|
Peptidase M28 family protein |
| arTal_v1_Chr2_+_8855302_8855358 | 1.11 |
AT2G20570.1
AT2G20570.3 AT2G20570.2 |
GPRI1
|
GBF's pro-rich region-interacting factor 1 |
| arTal_v1_Chr3_-_8459814_8459814 | 1.10 |
AT3G23570.1
|
AT3G23570
|
alpha/beta-Hydrolases superfamily protein |
| arTal_v1_Chr2_+_13107909_13107909 | 1.10 |
AT2G30766.2
|
AT2G30766
|
hypothetical protein |
| arTal_v1_Chr5_-_2176446_2176446 | 1.09 |
AT5G07010.1
|
ST2A
|
sulfotransferase 2A |
| arTal_v1_Chr5_-_7410102_7410102 | 1.08 |
AT5G22380.1
|
NAC090
|
NAC domain containing protein 90 |
| arTal_v1_Chr2_-_15092353_15092415 | 1.08 |
AT2G35940.3
AT2G35940.1 |
BLH1
|
BEL1-like homeodomain 1 |
| arTal_v1_Chr3_-_7063372_7063372 | 1.08 |
AT3G20250.2
AT3G20250.1 |
PUM5
|
pumilio 5 |
| arTal_v1_Chr5_-_17962276_17962276 | 1.08 |
AT5G44568.1
|
AT5G44568
|
transmembrane protein |
| arTal_v1_Chr3_+_23266227_23266227 | 1.08 |
AT3G62950.1
|
AT3G62950
|
Thioredoxin superfamily protein |
| arTal_v1_Chr4_-_15931332_15931422 | 1.08 |
AT4G33010.2
AT4G33010.1 |
GLDP1
|
glycine decarboxylase P-protein 1 |
| arTal_v1_Chr3_+_9887917_9887917 | 1.08 |
AT3G26830.1
|
PAD3
|
Cytochrome P450 superfamily protein |
| arTal_v1_Chr5_+_19678825_19678917 | 1.07 |
AT5G48550.2
AT5G48550.1 |
AT5G48550
|
F-box associated ubiquitination effector family protein |
| arTal_v1_Chr1_+_3288087_3288087 | 1.07 |
AT1G10070.3
AT1G10070.2 AT1G10070.1 |
BCAT-2
|
branched-chain amino acid transaminase 2 |
| arTal_v1_Chr4_-_11640164_11640164 | 1.06 |
AT4G21926.1
|
AT4G21926
|
hypothetical protein |
| arTal_v1_Chr3_-_4591483_4591541 | 1.06 |
AT3G13910.2
AT3G13910.1 |
AT3G13910
|
hypothetical protein (DUF3511) |
| arTal_v1_Chr3_-_5599224_5599224 | 1.06 |
AT3G16470.3
AT3G16470.4 |
JR1
|
Mannose-binding lectin superfamily protein |
| arTal_v1_Chr2_-_2983602_2983657 | 1.06 |
AT2G07180.2
AT2G07180.1 |
AT2G07180
|
Protein kinase superfamily protein |
| arTal_v1_Chr2_-_12685145_12685151 | 1.05 |
AT2G29670.2
AT2G29670.1 |
AT2G29670
|
Tetratricopeptide repeat (TPR)-like superfamily protein |
| arTal_v1_Chr2_-_15092178_15092178 | 1.05 |
AT2G35940.2
|
BLH1
|
BEL1-like homeodomain 1 |
| arTal_v1_Chr2_+_13107583_13107583 | 1.04 |
AT2G30766.1
|
AT2G30766
|
hypothetical protein |
| arTal_v1_Chr1_+_29759030_29759158 | 1.04 |
AT1G79110.2
AT1G79110.3 AT1G79110.1 |
BRG2
|
zinc ion binding protein |
| arTal_v1_Chr5_+_8217191_8217213 | 1.04 |
AT5G24210.1
AT5G24210.2 AT5G24210.3 |
AT5G24210
|
alpha/beta-Hydrolases superfamily protein |
| arTal_v1_Chr1_+_2672198_2672198 | 1.04 |
AT1G08460.1
AT1G08460.2 |
HDA08
|
histone deacetylase 8 |
| arTal_v1_Chr5_+_5211719_5211719 | 1.04 |
AT5G15970.1
|
KIN2
|
stress-responsive protein (KIN2) / stress-induced protein (KIN2) / cold-responsive protein (COR6.6) / cold-regulated protein (COR6.6) |
| arTal_v1_Chr2_-_6668046_6668046 | 1.04 |
AT2G15320.1
|
AT2G15320
|
Leucine-rich repeat (LRR) family protein |
| arTal_v1_Chr1_+_27861116_27861116 | 1.03 |
AT1G74088.2
AT1G74088.1 |
AT1G74088
|
galacturonosyltransferase |
| arTal_v1_Chr1_-_8271933_8272021 | 1.03 |
AT1G23310.2
AT1G23310.1 |
GGT1
|
glutamate:glyoxylate aminotransferase |
| arTal_v1_Chr1_-_26540818_26540818 | 1.02 |
AT1G70420.1
|
AT1G70420
|
DNA ligase-like protein, putative (DUF1645) |
| arTal_v1_Chr2_-_19370478_19370478 | 1.02 |
AT2G47180.1
|
GolS1
|
galactinol synthase 1 |
| arTal_v1_Chr1_+_28145978_28145978 | 1.02 |
AT1G74940.1
|
AT1G74940
|
cyclin-dependent kinase, putative (DUF581) |
| arTal_v1_Chr1_-_6802652_6802906 | 1.02 |
AT1G19660.2
AT1G19660.3 AT1G19660.1 |
AT1G19660
|
Wound-responsive family protein |
| arTal_v1_Chr5_+_2446669_2446669 | 1.01 |
AT5G07690.1
|
MYB29
|
myb domain protein 29 |
| arTal_v1_Chr2_-_10831655_10831655 | 1.01 |
AT2G25450.1
|
AT2G25450
|
2-oxoglutarate (2OG) and Fe(II)-dependent oxygenase superfamily protein |
| arTal_v1_Chr2_+_18537177_18537177 | 1.00 |
AT2G44940.1
|
AT2G44940
|
Integrase-type DNA-binding superfamily protein |
| arTal_v1_Chr2_+_18789489_18789489 | 1.00 |
AT2G45600.1
|
AT2G45600
|
alpha/beta-Hydrolases superfamily protein |
| arTal_v1_Chr2_-_13307572_13307572 | 1.00 |
AT2G31230.1
|
ERF15
|
ethylene-responsive element binding factor 15 |
| arTal_v1_Chr1_-_17076417_17076417 | 0.99 |
AT1G45145.1
|
TRX5
|
thioredoxin H-type 5 |
| arTal_v1_Chr5_+_5168194_5168194 | 0.99 |
AT5G15830.1
|
bZIP3
|
basic leucine-zipper 3 |
| arTal_v1_Chr4_+_8218261_8218261 | 0.98 |
AT4G14270.2
|
AT4G14270
|
polyadenylate-binding protein interacting protein |
| arTal_v1_Chr1_-_7900335_7900335 | 0.98 |
AT1G22370.1
AT1G22370.2 |
UGT85A5
|
UDP-glucosyl transferase 85A5 |
| arTal_v1_Chr2_+_15050677_15050677 | 0.98 |
AT2G35820.1
|
AT2G35820
|
ureidoglycolate hydrolase |
| arTal_v1_Chr5_+_22038165_22038165 | 0.98 |
AT5G54270.1
|
LHCB3
|
light-harvesting chlorophyll B-binding protein 3 |
| arTal_v1_Chr1_-_23137254_23137254 | 0.98 |
AT1G62510.1
|
AT1G62510
|
Bifunctional inhibitor/lipid-transfer protein/seed storage 2S albumin superfamily protein |
| arTal_v1_Chr4_-_14619573_14619685 | 0.97 |
AT4G29900.2
AT4G29900.1 |
ACA10
|
autoinhibited Ca(2+)-ATPase 10 |
| arTal_v1_Chr4_+_8218083_8218083 | 0.97 |
AT4G14270.1
|
AT4G14270
|
polyadenylate-binding protein interacting protein |
| arTal_v1_Chr3_+_10524181_10524181 | 0.97 |
AT3G28220.1
|
AT3G28220
|
TRAF-like family protein |
| arTal_v1_Chr5_+_7168106_7168106 | 0.97 |
AT5G21100.1
|
AT5G21100
|
Plant L-ascorbate oxidase |
| arTal_v1_Chr2_+_15050498_15050498 | 0.97 |
AT2G35820.2
|
AT2G35820
|
ureidoglycolate hydrolase |
| arTal_v1_Chr1_+_24647121_24647121 | 0.97 |
AT1G66180.1
|
AT1G66180
|
Eukaryotic aspartyl protease family protein |
| arTal_v1_Chr1_-_25451051_25451051 | 0.96 |
AT1G67870.1
|
AT1G67870
|
glycine-rich protein |
| arTal_v1_Chr4_+_8360996_8360996 | 0.96 |
AT4G14560.1
|
IAA1
|
indole-3-acetic acid inducible |
| arTal_v1_Chr4_-_18573084_18573084 | 0.96 |
AT4G40060.1
|
HB16
|
homeobox protein 16 |
| arTal_v1_Chr2_-_7919345_7919345 | 0.96 |
AT2G18193.1
|
AT2G18193
|
P-loop containing nucleoside triphosphate hydrolases superfamily protein |
| arTal_v1_Chr1_+_6027487_6027487 | 0.96 |
AT1G17530.1
AT1G17530.2 |
TIM23-1
|
translocase of inner mitochondrial membrane 23 |
| arTal_v1_Chr3_-_9712659_9712660 | 0.96 |
AT3G26510.3
AT3G26510.7 AT3G26510.2 |
AT3G26510
|
Octicosapeptide/Phox/Bem1p family protein |
| arTal_v1_Chr5_-_21651626_21651713 | 0.96 |
AT5G53370.1
AT5G53370.2 |
PMEPCRF
|
pectin methylesterase PCR fragment F |
| arTal_v1_Chr1_+_7337605_7337605 | 0.96 |
AT1G21000.1
|
AT1G21000
|
PLATZ transcription factor family protein |
| arTal_v1_Chr1_-_17906873_17906873 | 0.95 |
AT1G48430.2
AT1G48430.1 |
AT1G48430
|
Dihydroxyacetone kinase |
| arTal_v1_Chr2_-_14200674_14200674 | 0.95 |
AT2G33530.1
|
scpl46
|
serine carboxypeptidase-like 46 |
| arTal_v1_Chr3_-_9712826_9712900 | 0.95 |
AT3G26510.5
AT3G26510.4 AT3G26510.1 AT3G26510.6 |
AT3G26510
|
Octicosapeptide/Phox/Bem1p family protein |
| arTal_v1_Chr1_+_19434480_19434480 | 0.95 |
AT1G52190.1
|
AT1G52190
|
Major facilitator superfamily protein |
| arTal_v1_Chr5_-_1624270_1624270 | 0.94 |
AT5G05480.1
|
AT5G05480
|
Peptide-N4-(N-acetyl-beta-glucosaminyl)asparagine amidase A protein |
| arTal_v1_Chr3_-_16735951_16735951 | 0.94 |
AT3G45600.1
AT3G45600.2 |
TET3
|
tetraspanin3 |
| arTal_v1_Chr1_+_18138169_18138169 | 0.94 |
AT1G49032.2
|
AT1G49032
|
hypothetical protein |
| arTal_v1_Chr4_-_8095749_8095749 | 0.94 |
AT4G14020.1
|
AT4G14020
|
Rapid alkalinization factor (RALF) family protein |
| arTal_v1_Chr5_-_19172956_19172956 | 0.94 |
AT5G47220.1
|
ERF2
|
ethylene responsive element binding factor 2 |
| arTal_v1_Chr1_+_22198266_22198266 | 0.93 |
AT1G60190.1
|
PUB19
|
ARM repeat superfamily protein |
| arTal_v1_Chr5_+_5206156_5206156 | 0.93 |
AT5G15950.2
|
AT5G15950
|
Adenosylmethionine decarboxylase family protein |
| arTal_v1_Chr2_+_16666023_16666023 | 0.93 |
AT2G39930.3
AT2G39930.2 |
ISA1
|
isoamylase 1 |
| arTal_v1_Chr3_+_21238223_21238223 | 0.93 |
AT3G57400.1
|
AT3G57400
|
transmembrane protein |
| arTal_v1_Chr3_-_18946621_18946621 | 0.93 |
AT3G51000.1
|
AT3G51000
|
alpha/beta-Hydrolases superfamily protein |
| arTal_v1_Chr3_-_21008064_21008068 | 0.92 |
AT3G56710.1
AT3G56710.2 |
SIB1
|
sigma factor binding protein 1 |
| arTal_v1_Chr1_+_8709941_8709941 | 0.92 |
AT1G24580.1
|
AT1G24580
|
RING/U-box superfamily protein |
| arTal_v1_Chr1_+_21136835_21136835 | 0.92 |
AT1G56430.1
|
NAS4
|
nicotianamine synthase 4 |
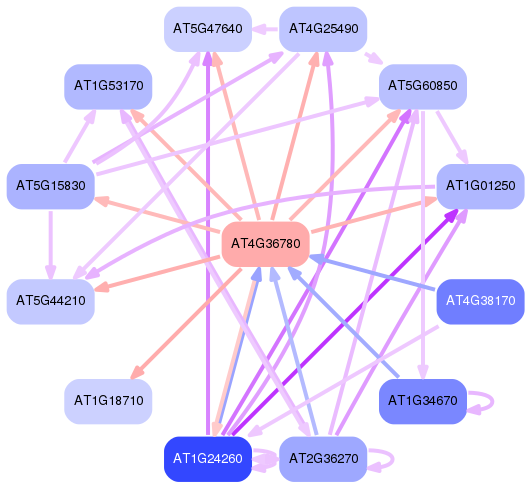
Network of associatons between targets according to the STRING database.

First level regulatory network of AT4G36780
Gene Ontology Analysis
Gene overrepresentation in biological process category:
| Log-likelihood per target | Total log-likelihood | Term | Description |
|---|---|---|---|
| 0.9 | 2.7 | GO:0033321 | homomethionine metabolic process(GO:0033321) glucosinolate biosynthetic process from homomethionine(GO:0033506) |
| 0.8 | 2.4 | GO:0010266 | response to vitamin B1(GO:0010266) |
| 0.7 | 2.9 | GO:0072351 | nicotianamine metabolic process(GO:0030417) nicotianamine biosynthetic process(GO:0030418) tricarboxylic acid biosynthetic process(GO:0072351) |
| 0.6 | 5.2 | GO:0009819 | drought recovery(GO:0009819) |
| 0.6 | 4.0 | GO:0006021 | inositol biosynthetic process(GO:0006021) |
| 0.5 | 2.1 | GO:0010351 | lithium ion transport(GO:0010351) |
| 0.4 | 4.7 | GO:0009610 | response to symbiotic fungus(GO:0009610) |
| 0.4 | 2.1 | GO:0051091 | positive regulation of sequence-specific DNA binding transcription factor activity(GO:0051091) |
| 0.4 | 1.7 | GO:0035865 | cellular response to potassium ion(GO:0035865) |
| 0.4 | 1.6 | GO:0097054 | L-glutamate biosynthetic process(GO:0097054) |
| 0.4 | 0.4 | GO:1901881 | positive regulation of protein depolymerization(GO:1901881) |
| 0.4 | 0.4 | GO:0043605 | cellular amide catabolic process(GO:0043605) |
| 0.4 | 1.8 | GO:0006106 | fumarate metabolic process(GO:0006106) |
| 0.4 | 1.8 | GO:0006517 | protein deglycosylation(GO:0006517) |
| 0.3 | 4.7 | GO:0030104 | water homeostasis(GO:0030104) |
| 0.3 | 1.0 | GO:0009769 | photosynthesis, light harvesting in photosystem II(GO:0009769) |
| 0.3 | 1.0 | GO:0050687 | negative regulation of immune effector process(GO:0002698) negative regulation of defense response to virus(GO:0050687) |
| 0.3 | 3.5 | GO:2000896 | amylopectin biosynthetic process(GO:0010021) amylopectin metabolic process(GO:2000896) |
| 0.3 | 0.9 | GO:0032490 | detection of molecule of bacterial origin(GO:0032490) |
| 0.3 | 4.2 | GO:0009098 | leucine biosynthetic process(GO:0009098) |
| 0.3 | 1.1 | GO:0000023 | maltose metabolic process(GO:0000023) |
| 0.3 | 0.8 | GO:0033528 | S-methylmethionine metabolic process(GO:0033477) S-methylmethionine cycle(GO:0033528) |
| 0.3 | 1.7 | GO:0006624 | vacuolar protein processing(GO:0006624) |
| 0.3 | 2.7 | GO:0016584 | nucleosome positioning(GO:0016584) |
| 0.3 | 0.8 | GO:0010395 | rhamnogalacturonan I metabolic process(GO:0010395) |
| 0.3 | 0.8 | GO:0080058 | protein deglutathionylation(GO:0080058) |
| 0.3 | 1.0 | GO:0006481 | C-terminal protein methylation(GO:0006481) |
| 0.3 | 1.5 | GO:0042754 | negative regulation of circadian rhythm(GO:0042754) |
| 0.2 | 2.4 | GO:0010106 | cellular response to iron ion starvation(GO:0010106) |
| 0.2 | 0.7 | GO:0051090 | regulation of sequence-specific DNA binding transcription factor activity(GO:0051090) |
| 0.2 | 0.7 | GO:1990532 | stress response to nickel ion(GO:1990532) |
| 0.2 | 1.4 | GO:0055129 | L-proline biosynthetic process(GO:0055129) |
| 0.2 | 2.1 | GO:0070814 | hydrogen sulfide biosynthetic process(GO:0070814) |
| 0.2 | 0.7 | GO:0010541 | acropetal auxin transport(GO:0010541) |
| 0.2 | 1.3 | GO:0010258 | NADH dehydrogenase complex (plastoquinone) assembly(GO:0010258) |
| 0.2 | 1.3 | GO:0009759 | indole glucosinolate biosynthetic process(GO:0009759) |
| 0.2 | 3.9 | GO:0009768 | photosynthesis, light harvesting in photosystem I(GO:0009768) |
| 0.2 | 2.9 | GO:0009864 | induced systemic resistance, jasmonic acid mediated signaling pathway(GO:0009864) |
| 0.2 | 3.1 | GO:0010161 | red light signaling pathway(GO:0010161) |
| 0.2 | 0.4 | GO:0010376 | stomatal complex formation(GO:0010376) |
| 0.2 | 1.0 | GO:1903960 | negative regulation of anion channel activity(GO:0010360) regulation of anion channel activity by blue light(GO:0010361) negative regulation of anion channel activity by blue light(GO:0010362) negative regulation of transporter activity(GO:0032410) negative regulation of ion transmembrane transporter activity(GO:0032413) negative regulation of transmembrane transport(GO:0034763) negative regulation of ion transmembrane transport(GO:0034766) negative regulation of anion transport(GO:1903792) negative regulation of anion transmembrane transport(GO:1903960) |
| 0.2 | 0.2 | GO:0046349 | UDP-N-acetylglucosamine metabolic process(GO:0006047) amino sugar biosynthetic process(GO:0046349) |
| 0.2 | 5.1 | GO:0030091 | protein repair(GO:0030091) |
| 0.2 | 0.4 | GO:0048832 | specification of organ number(GO:0048832) specification of floral organ number(GO:0048833) |
| 0.2 | 0.2 | GO:0009245 | lipid A biosynthetic process(GO:0009245) lipid A metabolic process(GO:0046493) lipooligosaccharide metabolic process(GO:1901269) lipooligosaccharide biosynthetic process(GO:1901271) |
| 0.2 | 1.9 | GO:0048363 | mucilage pectin metabolic process(GO:0048363) |
| 0.2 | 1.0 | GO:0010450 | inflorescence meristem growth(GO:0010450) |
| 0.2 | 2.7 | GO:0010274 | hydrotropism(GO:0010274) |
| 0.2 | 0.6 | GO:0000349 | generation of catalytic spliceosome for first transesterification step(GO:0000349) |
| 0.2 | 0.7 | GO:0019336 | phenol-containing compound catabolic process(GO:0019336) |
| 0.2 | 0.5 | GO:0050996 | positive regulation of fatty acid beta-oxidation(GO:0032000) positive regulation of lipid catabolic process(GO:0050996) |
| 0.2 | 1.2 | GO:0006751 | glutathione catabolic process(GO:0006751) |
| 0.2 | 2.1 | GO:1900056 | negative regulation of leaf senescence(GO:1900056) |
| 0.2 | 0.9 | GO:0009590 | detection of gravity(GO:0009590) |
| 0.2 | 0.9 | GO:0048281 | inflorescence morphogenesis(GO:0048281) |
| 0.2 | 0.5 | GO:0042353 | fucose biosynthetic process(GO:0042353) |
| 0.2 | 0.7 | GO:0006741 | NADP biosynthetic process(GO:0006741) |
| 0.2 | 0.2 | GO:0080001 | mucilage extrusion from seed coat(GO:0080001) |
| 0.2 | 3.0 | GO:0030388 | fructose 1,6-bisphosphate metabolic process(GO:0030388) |
| 0.2 | 0.8 | GO:0071786 | endoplasmic reticulum tubular network organization(GO:0071786) |
| 0.2 | 1.5 | GO:1903959 | regulation of anion transmembrane transport(GO:1903959) |
| 0.2 | 2.1 | GO:0048317 | seed morphogenesis(GO:0048317) |
| 0.2 | 0.8 | GO:0071260 | cellular response to mechanical stimulus(GO:0071260) |
| 0.2 | 0.6 | GO:1901568 | icosanoid metabolic process(GO:0006690) fatty acid derivative metabolic process(GO:1901568) |
| 0.2 | 0.5 | GO:0010447 | response to acidic pH(GO:0010447) |
| 0.2 | 0.8 | GO:1900370 | positive regulation of RNA interference(GO:1900370) |
| 0.2 | 1.1 | GO:0019464 | glycine decarboxylation via glycine cleavage system(GO:0019464) |
| 0.2 | 0.6 | GO:2000692 | negative regulation of seed maturation(GO:2000692) |
| 0.2 | 0.5 | GO:1901537 | positive regulation of DNA demethylation(GO:1901537) |
| 0.2 | 4.7 | GO:0006012 | galactose metabolic process(GO:0006012) |
| 0.1 | 2.5 | GO:0080027 | response to herbivore(GO:0080027) |
| 0.1 | 1.1 | GO:0010188 | response to microbial phytotoxin(GO:0010188) |
| 0.1 | 0.4 | GO:1900459 | positive regulation of brassinosteroid mediated signaling pathway(GO:1900459) |
| 0.1 | 2.1 | GO:0006857 | oligopeptide transport(GO:0006857) peptide transport(GO:0015833) |
| 0.1 | 0.6 | GO:0015669 | gas transport(GO:0015669) |
| 0.1 | 0.4 | GO:0046203 | spermidine catabolic process(GO:0046203) |
| 0.1 | 0.4 | GO:2000058 | protein ubiquitination involved in ubiquitin-dependent protein catabolic process(GO:0042787) regulation of protein ubiquitination involved in ubiquitin-dependent protein catabolic process(GO:2000058) |
| 0.1 | 0.7 | GO:0010135 | ureide metabolic process(GO:0010135) ureide catabolic process(GO:0010136) |
| 0.1 | 0.7 | GO:0009800 | cinnamic acid biosynthetic process(GO:0009800) |
| 0.1 | 0.7 | GO:0042549 | photosystem II stabilization(GO:0042549) |
| 0.1 | 1.5 | GO:0006878 | cellular copper ion homeostasis(GO:0006878) |
| 0.1 | 1.2 | GO:0060866 | leaf abscission(GO:0060866) |
| 0.1 | 1.5 | GO:0006734 | NADH metabolic process(GO:0006734) |
| 0.1 | 0.4 | GO:0033194 | response to hydroperoxide(GO:0033194) |
| 0.1 | 0.4 | GO:0010507 | negative regulation of autophagy(GO:0010507) |
| 0.1 | 0.5 | GO:0006805 | xenobiotic metabolic process(GO:0006805) xenobiotic catabolic process(GO:0042178) cellular response to xenobiotic stimulus(GO:0071466) |
| 0.1 | 0.6 | GO:1902025 | nitrate import(GO:1902025) |
| 0.1 | 2.6 | GO:0010112 | regulation of systemic acquired resistance(GO:0010112) |
| 0.1 | 1.2 | GO:0000103 | sulfate assimilation(GO:0000103) |
| 0.1 | 2.4 | GO:0009861 | jasmonic acid and ethylene-dependent systemic resistance(GO:0009861) |
| 0.1 | 1.2 | GO:0015977 | carbon fixation(GO:0015977) reductive pentose-phosphate cycle(GO:0019253) |
| 0.1 | 0.7 | GO:0051775 | response to redox state(GO:0051775) |
| 0.1 | 0.7 | GO:0009745 | sucrose mediated signaling(GO:0009745) |
| 0.1 | 0.5 | GO:0046741 | transport of virus in host, tissue to tissue(GO:0046741) |
| 0.1 | 0.7 | GO:0009726 | detection of hormone stimulus(GO:0009720) detection of endogenous stimulus(GO:0009726) |
| 0.1 | 0.5 | GO:0006501 | C-terminal protein lipidation(GO:0006501) |
| 0.1 | 1.4 | GO:0080144 | amino acid homeostasis(GO:0080144) |
| 0.1 | 0.5 | GO:0007569 | cell aging(GO:0007569) regulation of cell aging(GO:0090342) |
| 0.1 | 0.7 | GO:0019563 | alditol catabolic process(GO:0019405) glycerol catabolic process(GO:0019563) |
| 0.1 | 3.2 | GO:0019761 | S-glycoside biosynthetic process(GO:0016144) glycosinolate biosynthetic process(GO:0019758) glucosinolate biosynthetic process(GO:0019761) |
| 0.1 | 0.3 | GO:0009660 | amyloplast organization(GO:0009660) |
| 0.1 | 0.5 | GO:0034051 | negative regulation of plant-type hypersensitive response(GO:0034051) |
| 0.1 | 0.3 | GO:0051639 | actin filament network formation(GO:0051639) |
| 0.1 | 1.9 | GO:0010229 | inflorescence development(GO:0010229) |
| 0.1 | 0.5 | GO:0019419 | sulfate reduction(GO:0019419) |
| 0.1 | 1.5 | GO:0009299 | mRNA transcription(GO:0009299) |
| 0.1 | 0.4 | GO:0051457 | maintenance of protein location in nucleus(GO:0051457) |
| 0.1 | 0.5 | GO:0005980 | glycogen catabolic process(GO:0005980) |
| 0.1 | 0.8 | GO:1905156 | photoinhibition(GO:0010205) negative regulation of photosynthesis, light reaction(GO:0043155) negative regulation of photosynthesis(GO:1905156) |
| 0.1 | 0.9 | GO:0047484 | regulation of response to osmotic stress(GO:0047484) |
| 0.1 | 0.9 | GO:0006086 | acetyl-CoA biosynthetic process from pyruvate(GO:0006086) |
| 0.1 | 0.4 | GO:0070676 | intralumenal vesicle formation(GO:0070676) |
| 0.1 | 0.6 | GO:1902584 | positive regulation of response to water deprivation(GO:1902584) |
| 0.1 | 0.8 | GO:0008535 | respiratory chain complex IV assembly(GO:0008535) mitochondrial respiratory chain complex IV assembly(GO:0033617) mitochondrial respiratory chain complex IV biogenesis(GO:0097034) |
| 0.1 | 1.0 | GO:0048354 | mucilage biosynthetic process involved in seed coat development(GO:0048354) |
| 0.1 | 0.8 | GO:0044375 | regulation of peroxisome size(GO:0044375) |
| 0.1 | 1.1 | GO:0045723 | positive regulation of fatty acid biosynthetic process(GO:0045723) |
| 0.1 | 0.5 | GO:0019745 | pentacyclic triterpenoid metabolic process(GO:0019742) pentacyclic triterpenoid biosynthetic process(GO:0019745) |
| 0.1 | 0.4 | GO:0006571 | tyrosine biosynthetic process(GO:0006571) |
| 0.1 | 0.7 | GO:2000306 | positive regulation of photomorphogenesis(GO:2000306) |
| 0.1 | 0.3 | GO:0090322 | regulation of superoxide metabolic process(GO:0090322) |
| 0.1 | 0.7 | GO:0009438 | lactate metabolic process(GO:0006089) methylglyoxal metabolic process(GO:0009438) methylglyoxal catabolic process to D-lactate via S-lactoyl-glutathione(GO:0019243) ketone catabolic process(GO:0042182) methylglyoxal catabolic process(GO:0051596) methylglyoxal catabolic process to lactate(GO:0061727) |
| 0.1 | 0.9 | GO:0042344 | indole glucosinolate catabolic process(GO:0042344) |
| 0.1 | 0.4 | GO:1905157 | positive regulation of photosynthesis(GO:1905157) |
| 0.1 | 0.9 | GO:0030308 | negative regulation of cell growth(GO:0030308) |
| 0.1 | 0.3 | GO:0009915 | phloem sucrose loading(GO:0009915) |
| 0.1 | 0.4 | GO:0006361 | transcription initiation from RNA polymerase I promoter(GO:0006361) |
| 0.1 | 0.3 | GO:0017196 | N-terminal protein amino acid acetylation(GO:0006474) N-terminal peptidyl-methionine acetylation(GO:0017196) |
| 0.1 | 1.0 | GO:0046337 | phosphatidylethanolamine biosynthetic process(GO:0006646) phosphatidylethanolamine metabolic process(GO:0046337) |
| 0.1 | 0.4 | GO:0006651 | diacylglycerol biosynthetic process(GO:0006651) |
| 0.1 | 0.6 | GO:0048578 | positive regulation of long-day photoperiodism, flowering(GO:0048578) |
| 0.1 | 0.5 | GO:0046865 | isoprenoid transport(GO:0046864) terpenoid transport(GO:0046865) |
| 0.1 | 1.7 | GO:0009269 | response to desiccation(GO:0009269) |
| 0.1 | 0.6 | GO:0007188 | G-protein coupled receptor signaling pathway, coupled to cyclic nucleotide second messenger(GO:0007187) adenylate cyclase-modulating G-protein coupled receptor signaling pathway(GO:0007188) |
| 0.1 | 0.8 | GO:0052548 | negative regulation of endopeptidase activity(GO:0010951) regulation of endopeptidase activity(GO:0052548) |
| 0.1 | 0.3 | GO:0010731 | protein glutathionylation(GO:0010731) |
| 0.1 | 0.5 | GO:0060359 | response to ammonium ion(GO:0060359) |
| 0.1 | 0.7 | GO:0046685 | response to arsenic-containing substance(GO:0046685) |
| 0.1 | 1.5 | GO:0006074 | (1->3)-beta-D-glucan metabolic process(GO:0006074) (1->3)-beta-D-glucan biosynthetic process(GO:0006075) |
| 0.1 | 2.4 | GO:0016575 | histone deacetylation(GO:0016575) |
| 0.1 | 0.5 | GO:0031930 | mitochondria-nucleus signaling pathway(GO:0031930) |
| 0.1 | 3.1 | GO:0016126 | sterol biosynthetic process(GO:0016126) |
| 0.1 | 0.9 | GO:0048280 | vesicle fusion with Golgi apparatus(GO:0048280) |
| 0.1 | 0.2 | GO:0071219 | cellular response to molecule of bacterial origin(GO:0071219) |
| 0.1 | 0.4 | GO:0019310 | inositol catabolic process(GO:0019310) |
| 0.1 | 0.8 | GO:0016123 | xanthophyll biosynthetic process(GO:0016123) |
| 0.1 | 1.1 | GO:1901371 | regulation of leaf morphogenesis(GO:1901371) |
| 0.1 | 0.2 | GO:0080171 | lytic vacuole organization(GO:0080171) |
| 0.1 | 0.4 | GO:0033591 | response to vitamin(GO:0033273) response to L-ascorbic acid(GO:0033591) |
| 0.1 | 0.4 | GO:0010306 | rhamnogalacturonan II biosynthetic process(GO:0010306) rhamnogalacturonan II metabolic process(GO:0010396) |
| 0.1 | 0.3 | GO:0045046 | protein import into peroxisome membrane(GO:0045046) |
| 0.1 | 0.4 | GO:0080024 | indolebutyric acid metabolic process(GO:0080024) response to indolebutyric acid(GO:0080026) |
| 0.1 | 0.2 | GO:0051341 | regulation of oxidoreductase activity(GO:0051341) |
| 0.1 | 0.2 | GO:0055064 | chloride ion homeostasis(GO:0055064) |
| 0.1 | 0.3 | GO:0002679 | respiratory burst involved in defense response(GO:0002679) respiratory burst(GO:0045730) |
| 0.1 | 1.4 | GO:0098869 | cellular oxidant detoxification(GO:0098869) |
| 0.1 | 0.2 | GO:0009107 | lipoate biosynthetic process(GO:0009107) |
| 0.1 | 0.1 | GO:0043970 | histone H3-K9 acetylation(GO:0043970) |
| 0.1 | 0.2 | GO:0010213 | non-photoreactive DNA repair(GO:0010213) |
| 0.1 | 0.4 | GO:0060919 | auxin influx(GO:0060919) |
| 0.1 | 0.6 | GO:0080190 | lateral growth(GO:0080190) |
| 0.1 | 0.4 | GO:0031116 | positive regulation of microtubule polymerization or depolymerization(GO:0031112) positive regulation of microtubule polymerization(GO:0031116) |
| 0.1 | 0.8 | GO:0070298 | negative regulation of ethylene-activated signaling pathway(GO:0010105) negative regulation of phosphorelay signal transduction system(GO:0070298) |
| 0.1 | 0.3 | GO:0043481 | pigment accumulation in response to UV light(GO:0043478) pigment accumulation in tissues in response to UV light(GO:0043479) pigment accumulation in tissues(GO:0043480) anthocyanin accumulation in tissues in response to UV light(GO:0043481) |
| 0.1 | 1.2 | GO:0009773 | photosynthetic electron transport in photosystem I(GO:0009773) |
| 0.1 | 1.1 | GO:0032511 | late endosome to vacuole transport via multivesicular body sorting pathway(GO:0032511) |
| 0.1 | 0.3 | GO:0048530 | fruit morphogenesis(GO:0048530) |
| 0.1 | 0.6 | GO:0010023 | proanthocyanidin biosynthetic process(GO:0010023) |
| 0.1 | 1.6 | GO:0009944 | polarity specification of adaxial/abaxial axis(GO:0009944) specification of axis polarity(GO:0065001) |
| 0.1 | 0.2 | GO:0060860 | regulation of floral organ abscission(GO:0060860) negative regulation of floral organ abscission(GO:0060862) |
| 0.1 | 3.8 | GO:0009873 | ethylene-activated signaling pathway(GO:0009873) |
| 0.1 | 0.2 | GO:0010028 | xanthophyll cycle(GO:0010028) |
| 0.1 | 0.3 | GO:1902418 | (+)-abscisic acid D-glucopyranosyl ester transmembrane transport(GO:1902418) |
| 0.1 | 0.5 | GO:0009854 | oxidative photosynthetic carbon pathway(GO:0009854) |
| 0.1 | 0.3 | GO:0001682 | tRNA 5'-leader removal(GO:0001682) |
| 0.1 | 0.4 | GO:0019632 | shikimate metabolic process(GO:0019632) |
| 0.1 | 0.2 | GO:0071216 | cellular response to biotic stimulus(GO:0071216) |
| 0.1 | 0.6 | GO:0010315 | auxin efflux(GO:0010315) |
| 0.1 | 0.4 | GO:0046085 | adenosine metabolic process(GO:0046085) |
| 0.1 | 1.8 | GO:0042026 | protein refolding(GO:0042026) |
| 0.1 | 0.2 | GO:0071836 | nectar secretion(GO:0071836) |
| 0.1 | 0.2 | GO:0044208 | 'de novo' AMP biosynthetic process(GO:0044208) |
| 0.1 | 0.9 | GO:0010207 | photosystem II assembly(GO:0010207) |
| 0.1 | 0.3 | GO:1901332 | negative regulation of lateral root development(GO:1901332) |
| 0.1 | 0.9 | GO:0050779 | RNA destabilization(GO:0050779) mRNA destabilization(GO:0061157) |
| 0.1 | 0.3 | GO:0045824 | negative regulation of innate immune response(GO:0045824) |
| 0.1 | 0.3 | GO:0051098 | regulation of binding(GO:0051098) |
| 0.1 | 1.3 | GO:0009691 | cytokinin biosynthetic process(GO:0009691) |
| 0.1 | 0.8 | GO:1990069 | stomatal opening(GO:1990069) |
| 0.1 | 1.2 | GO:0006863 | purine nucleobase transport(GO:0006863) |
| 0.1 | 0.2 | GO:0072337 | modified amino acid transport(GO:0072337) |
| 0.1 | 0.6 | GO:0010540 | basipetal auxin transport(GO:0010540) |
| 0.1 | 0.2 | GO:0042724 | thiamine biosynthetic process(GO:0009228) thiamine-containing compound biosynthetic process(GO:0042724) |
| 0.1 | 0.4 | GO:0006542 | glutamine biosynthetic process(GO:0006542) |
| 0.1 | 0.1 | GO:0080140 | regulation of jasmonic acid metabolic process(GO:0080140) regulation of jasmonic acid biosynthetic process(GO:0080141) |
| 0.1 | 0.6 | GO:0051553 | flavone biosynthetic process(GO:0051553) flavonol biosynthetic process(GO:0051555) |
| 0.1 | 0.2 | GO:0046499 | S-adenosylmethioninamine biosynthetic process(GO:0006557) S-adenosylmethioninamine metabolic process(GO:0046499) |
| 0.1 | 1.0 | GO:0043649 | dicarboxylic acid catabolic process(GO:0043649) |
| 0.1 | 0.9 | GO:0009938 | negative regulation of gibberellic acid mediated signaling pathway(GO:0009938) |
| 0.1 | 0.1 | GO:0016574 | histone ubiquitination(GO:0016574) |
| 0.0 | 0.9 | GO:0048015 | phosphatidylinositol-mediated signaling(GO:0048015) |
| 0.0 | 0.2 | GO:0006828 | manganese ion transport(GO:0006828) |
| 0.0 | 0.2 | GO:0010019 | chloroplast-nucleus signaling pathway(GO:0010019) |
| 0.0 | 0.1 | GO:0033258 | plastid DNA metabolic process(GO:0033258) plastid DNA replication(GO:0033259) |
| 0.0 | 0.6 | GO:0010600 | regulation of auxin biosynthetic process(GO:0010600) |
| 0.0 | 0.6 | GO:0032544 | plastid translation(GO:0032544) |
| 0.0 | 0.6 | GO:2000142 | regulation of DNA-templated transcription, initiation(GO:2000142) |
| 0.0 | 0.6 | GO:0071712 | ER-associated misfolded protein catabolic process(GO:0071712) |
| 0.0 | 0.3 | GO:0046900 | tetrahydrofolylpolyglutamate metabolic process(GO:0046900) |
| 0.0 | 0.1 | GO:0031538 | negative regulation of anthocyanin metabolic process(GO:0031538) |
| 0.0 | 0.5 | GO:0006621 | protein retention in ER lumen(GO:0006621) |
| 0.0 | 0.4 | GO:0006656 | phosphatidylcholine biosynthetic process(GO:0006656) |
| 0.0 | 0.1 | GO:0017145 | stem cell division(GO:0017145) |
| 0.0 | 0.8 | GO:0052249 | virus induced gene silencing(GO:0009616) modulation by symbiont of RNA levels in host(GO:0052018) modulation of RNA levels in other organism involved in symbiotic interaction(GO:0052249) |
| 0.0 | 0.5 | GO:0009554 | megasporogenesis(GO:0009554) |
| 0.0 | 0.4 | GO:0015691 | cadmium ion transport(GO:0015691) |
| 0.0 | 0.7 | GO:0045324 | late endosome to vacuole transport(GO:0045324) |
| 0.0 | 0.1 | GO:0071494 | cellular response to UV-C(GO:0071494) |
| 0.0 | 0.1 | GO:0043171 | peptide catabolic process(GO:0043171) |
| 0.0 | 0.6 | GO:0045926 | negative regulation of growth(GO:0045926) |
| 0.0 | 1.1 | GO:0030150 | protein import into mitochondrial matrix(GO:0030150) |
| 0.0 | 1.6 | GO:0006635 | fatty acid beta-oxidation(GO:0006635) |
| 0.0 | 0.5 | GO:0032366 | intracellular sterol transport(GO:0032366) |
| 0.0 | 0.1 | GO:0006059 | hexitol metabolic process(GO:0006059) hexitol biosynthetic process(GO:0019406) mannitol biosynthetic process(GO:0019593) mannitol metabolic process(GO:0019594) |
| 0.0 | 0.3 | GO:0009090 | homoserine biosynthetic process(GO:0009090) |
| 0.0 | 0.4 | GO:0010262 | somatic embryogenesis(GO:0010262) |
| 0.0 | 0.4 | GO:0009094 | L-phenylalanine biosynthetic process(GO:0009094) aromatic amino acid family biosynthetic process, prephenate pathway(GO:0009095) erythrose 4-phosphate/phosphoenolpyruvate family amino acid biosynthetic process(GO:1902223) |
| 0.0 | 1.0 | GO:0048574 | long-day photoperiodism, flowering(GO:0048574) |
| 0.0 | 1.6 | GO:0010017 | red or far-red light signaling pathway(GO:0010017) |
| 0.0 | 0.4 | GO:2001289 | lipid X metabolic process(GO:2001289) |
| 0.0 | 0.1 | GO:0034067 | protein localization to Golgi apparatus(GO:0034067) |
| 0.0 | 2.7 | GO:0031146 | SCF-dependent proteasomal ubiquitin-dependent protein catabolic process(GO:0031146) |
| 0.0 | 2.2 | GO:0006972 | hyperosmotic response(GO:0006972) |
| 0.0 | 0.2 | GO:0010500 | transmitting tissue development(GO:0010500) |
| 0.0 | 0.2 | GO:1902751 | positive regulation of G2/M transition of mitotic cell cycle(GO:0010971) positive regulation of cell cycle G2/M phase transition(GO:1902751) |
| 0.0 | 0.4 | GO:0010044 | response to aluminum ion(GO:0010044) |
| 0.0 | 0.2 | GO:0015785 | UDP-galactose transport(GO:0015785) UDP-galactose transmembrane transport(GO:0072334) |
| 0.0 | 1.0 | GO:0010268 | brassinosteroid homeostasis(GO:0010268) |
| 0.0 | 0.0 | GO:0048479 | style development(GO:0048479) |
| 0.0 | 0.2 | GO:0010071 | root meristem specification(GO:0010071) |
| 0.0 | 0.3 | GO:0007155 | cell adhesion(GO:0007155) biological adhesion(GO:0022610) |
| 0.0 | 0.1 | GO:0031929 | TOR signaling(GO:0031929) |
| 0.0 | 0.5 | GO:0018401 | protein hydroxylation(GO:0018126) peptidyl-proline hydroxylation to 4-hydroxy-L-proline(GO:0018401) 4-hydroxyproline metabolic process(GO:0019471) peptidyl-proline hydroxylation(GO:0019511) |
| 0.0 | 2.2 | GO:0045454 | cell redox homeostasis(GO:0045454) |
| 0.0 | 0.3 | GO:0006488 | dolichol-linked oligosaccharide biosynthetic process(GO:0006488) |
| 0.0 | 0.4 | GO:0006188 | IMP biosynthetic process(GO:0006188) IMP metabolic process(GO:0046040) |
| 0.0 | 0.2 | GO:0042343 | indole glucosinolate metabolic process(GO:0042343) |
| 0.0 | 0.4 | GO:0008285 | negative regulation of cell proliferation(GO:0008285) |
| 0.0 | 0.2 | GO:0010569 | regulation of double-strand break repair via homologous recombination(GO:0010569) |
| 0.0 | 1.6 | GO:0006897 | endocytosis(GO:0006897) |
| 0.0 | 1.4 | GO:0090487 | toxin catabolic process(GO:0009407) secondary metabolite catabolic process(GO:0090487) |
| 0.0 | 1.8 | GO:0009615 | response to virus(GO:0009615) |
| 0.0 | 0.8 | GO:0070816 | phosphorylation of RNA polymerase II C-terminal domain(GO:0070816) |
| 0.0 | 0.4 | GO:0052546 | cell wall pectin metabolic process(GO:0052546) |
| 0.0 | 0.3 | GO:0048829 | root cap development(GO:0048829) |
| 0.0 | 0.1 | GO:0010480 | microsporocyte differentiation(GO:0010480) |
| 0.0 | 0.5 | GO:0006465 | signal peptide processing(GO:0006465) |
| 0.0 | 0.1 | GO:0001672 | regulation of chromatin assembly or disassembly(GO:0001672) |
| 0.0 | 0.4 | GO:1900055 | regulation of leaf senescence(GO:1900055) |
| 0.0 | 0.3 | GO:0010506 | regulation of autophagy(GO:0010506) |
| 0.0 | 0.3 | GO:0046688 | response to copper ion(GO:0046688) |
| 0.0 | 1.0 | GO:0009226 | nucleotide-sugar biosynthetic process(GO:0009226) |
| 0.0 | 1.0 | GO:2000022 | regulation of jasmonic acid mediated signaling pathway(GO:2000022) |
| 0.0 | 0.9 | GO:0006284 | base-excision repair(GO:0006284) |
| 0.0 | 0.1 | GO:0071481 | cellular response to X-ray(GO:0071481) |
| 0.0 | 0.3 | GO:0070973 | protein localization to endoplasmic reticulum exit site(GO:0070973) |
| 0.0 | 0.2 | GO:0051346 | negative regulation of hydrolase activity(GO:0051346) |
| 0.0 | 0.2 | GO:0006513 | protein monoubiquitination(GO:0006513) |
| 0.0 | 0.1 | GO:0019720 | Mo-molybdopterin cofactor biosynthetic process(GO:0006777) Mo-molybdopterin cofactor metabolic process(GO:0019720) molybdopterin cofactor biosynthetic process(GO:0032324) molybdopterin cofactor metabolic process(GO:0043545) prosthetic group metabolic process(GO:0051189) |
| 0.0 | 0.5 | GO:1901259 | chloroplast rRNA processing(GO:1901259) |
| 0.0 | 0.7 | GO:0003333 | amino acid transmembrane transport(GO:0003333) |
| 0.0 | 0.4 | GO:0055083 | monovalent inorganic anion homeostasis(GO:0055083) |
| 0.0 | 0.3 | GO:0005983 | starch catabolic process(GO:0005983) |
| 0.0 | 0.6 | GO:1900150 | regulation of defense response to fungus(GO:1900150) |
| 0.0 | 0.5 | GO:0010193 | response to ozone(GO:0010193) |
| 0.0 | 1.7 | GO:0009734 | auxin-activated signaling pathway(GO:0009734) |
| 0.0 | 0.7 | GO:0031163 | iron-sulfur cluster assembly(GO:0016226) metallo-sulfur cluster assembly(GO:0031163) |
| 0.0 | 0.1 | GO:0045905 | positive regulation of protein complex disassembly(GO:0043243) positive regulation of translational elongation(GO:0045901) positive regulation of translational termination(GO:0045905) |
| 0.0 | 0.1 | GO:0015868 | ADP transport(GO:0015866) ATP transport(GO:0015867) purine ribonucleotide transport(GO:0015868) AMP transport(GO:0080121) |
| 0.0 | 0.1 | GO:0016598 | protein arginylation(GO:0016598) |
| 0.0 | 1.9 | GO:0009741 | response to brassinosteroid(GO:0009741) |
| 0.0 | 0.5 | GO:0007030 | Golgi organization(GO:0007030) |
| 0.0 | 0.2 | GO:0071248 | cellular response to metal ion(GO:0071248) |
| 0.0 | 0.1 | GO:0045038 | protein import into chloroplast thylakoid membrane(GO:0045038) |
| 0.0 | 0.1 | GO:0010148 | transpiration(GO:0010148) hexose catabolic process(GO:0019320) |
| 0.0 | 0.2 | GO:0048209 | regulation of vesicle targeting, to, from or within Golgi(GO:0048209) |
| 0.0 | 0.3 | GO:0008361 | regulation of cell size(GO:0008361) |
| 0.0 | 0.7 | GO:0042752 | regulation of circadian rhythm(GO:0042752) |
| 0.0 | 0.3 | GO:0006890 | retrograde vesicle-mediated transport, Golgi to ER(GO:0006890) |
| 0.0 | 0.4 | GO:0007186 | G-protein coupled receptor signaling pathway(GO:0007186) |
| 0.0 | 0.0 | GO:1902448 | regulation of shade avoidance(GO:1902446) positive regulation of shade avoidance(GO:1902448) |
| 0.0 | 0.1 | GO:0009154 | purine ribonucleotide catabolic process(GO:0009154) ribonucleotide catabolic process(GO:0009261) coenzyme A catabolic process(GO:0015938) nucleoside bisphosphate catabolic process(GO:0033869) ribonucleoside bisphosphate catabolic process(GO:0034031) purine nucleoside bisphosphate catabolic process(GO:0034034) |
| 0.0 | 0.1 | GO:0072659 | protein localization to plasma membrane(GO:0072659) |
| 0.0 | 0.1 | GO:0034765 | regulation of ion transmembrane transport(GO:0034765) |
| 0.0 | 0.1 | GO:0052192 | movement in host(GO:0044000) transport of virus in multicellular host(GO:0046739) transport of virus(GO:0046794) movement in other organism involved in symbiotic interaction(GO:0051814) movement in host environment(GO:0052126) movement in environment of other organism involved in symbiotic interaction(GO:0052192) |
| 0.0 | 0.8 | GO:0019684 | photosynthesis, light reaction(GO:0019684) |
| 0.0 | 1.8 | GO:0000209 | protein polyubiquitination(GO:0000209) |
| 0.0 | 0.2 | GO:0000266 | mitochondrial fission(GO:0000266) |
| 0.0 | 0.9 | GO:0048278 | vesicle docking(GO:0048278) |
| 0.0 | 0.2 | GO:0000165 | MAPK cascade(GO:0000165) |
| 0.0 | 0.2 | GO:0005986 | sucrose biosynthetic process(GO:0005986) |
| 0.0 | 0.1 | GO:0033619 | membrane protein proteolysis(GO:0033619) |
| 0.0 | 0.4 | GO:0071472 | cellular response to salt stress(GO:0071472) |
| 0.0 | 0.1 | GO:0071108 | protein K48-linked deubiquitination(GO:0071108) |
| 0.0 | 0.3 | GO:0000162 | tryptophan biosynthetic process(GO:0000162) indolalkylamine biosynthetic process(GO:0046219) |
| 0.0 | 0.2 | GO:0048496 | maintenance of organ identity(GO:0048496) maintenance of floral organ identity(GO:0048497) |
| 0.0 | 0.5 | GO:0046856 | phospholipid dephosphorylation(GO:0046839) phosphatidylinositol dephosphorylation(GO:0046856) |
| 0.0 | 0.2 | GO:0090506 | axillary shoot meristem initiation(GO:0090506) |
| 0.0 | 0.1 | GO:0043981 | histone H4-K5 acetylation(GO:0043981) |
| 0.0 | 0.7 | GO:0009631 | cold acclimation(GO:0009631) |
| 0.0 | 0.6 | GO:0009863 | salicylic acid mediated signaling pathway(GO:0009863) |
| 0.0 | 0.1 | GO:0098719 | sodium ion transmembrane transport(GO:0035725) sodium ion import(GO:0097369) inorganic cation import into cell(GO:0098659) sodium ion import across plasma membrane(GO:0098719) inorganic ion import into cell(GO:0099587) sodium ion import into cell(GO:1990118) |
| 0.0 | 0.7 | GO:0008283 | cell proliferation(GO:0008283) |
| 0.0 | 0.5 | GO:0061077 | chaperone-mediated protein folding(GO:0061077) |
| 0.0 | 0.2 | GO:0006896 | Golgi to vacuole transport(GO:0006896) |
| 0.0 | 0.0 | GO:0006296 | nucleotide-excision repair, DNA incision, 5'-to lesion(GO:0006296) |
| 0.0 | 0.1 | GO:0010587 | miRNA metabolic process(GO:0010586) miRNA catabolic process(GO:0010587) |
| 0.0 | 0.0 | GO:0015755 | hexose transport(GO:0008645) fructose transport(GO:0015755) vacuolar transmembrane transport(GO:0034486) |
| 0.0 | 0.1 | GO:0033512 | lysine catabolic process(GO:0006554) L-lysine catabolic process to acetyl-CoA(GO:0019474) L-lysine catabolic process(GO:0019477) L-lysine catabolic process to acetyl-CoA via saccharopine(GO:0033512) L-lysine metabolic process(GO:0046440) |
| 0.0 | 0.1 | GO:1901006 | ubiquinone-6 metabolic process(GO:1901004) ubiquinone-6 biosynthetic process(GO:1901006) |
| 0.0 | 0.1 | GO:0015969 | guanosine tetraphosphate metabolic process(GO:0015969) purine ribonucleoside bisphosphate metabolic process(GO:0034035) |
| 0.0 | 0.1 | GO:0000012 | single strand break repair(GO:0000012) |
| 0.0 | 0.2 | GO:0032981 | mitochondrial respiratory chain complex I assembly(GO:0032981) mitochondrial respiratory chain complex I biogenesis(GO:0097031) |
| 0.0 | 0.1 | GO:0034414 | tRNA 3'-trailer cleavage, endonucleolytic(GO:0034414) |
| 0.0 | 0.1 | GO:0010337 | regulation of salicylic acid metabolic process(GO:0010337) |
| 0.0 | 0.2 | GO:0006888 | ER to Golgi vesicle-mediated transport(GO:0006888) |
| 0.0 | 0.2 | GO:0090332 | stomatal closure(GO:0090332) |
| 0.0 | 0.0 | GO:0008615 | pyridoxine biosynthetic process(GO:0008615) |
| 0.0 | 0.3 | GO:0031124 | mRNA 3'-end processing(GO:0031124) |
| 0.0 | 0.1 | GO:0035336 | long-chain fatty-acyl-CoA metabolic process(GO:0035336) |
| 0.0 | 0.7 | GO:0006400 | tRNA modification(GO:0006400) |
| 0.0 | 0.1 | GO:0034219 | carbohydrate transmembrane transport(GO:0034219) |
| 0.0 | 0.4 | GO:0006367 | transcription initiation from RNA polymerase II promoter(GO:0006367) |
| 0.0 | 0.0 | GO:0006493 | protein O-linked glycosylation(GO:0006493) |
| 0.0 | 0.3 | GO:0006506 | GPI anchor metabolic process(GO:0006505) GPI anchor biosynthetic process(GO:0006506) |
Gene overrepresentation in cellular component category:
| Log-likelihood per target | Total log-likelihood | Term | Description |
|---|---|---|---|
| 0.5 | 5.0 | GO:0010168 | ER body(GO:0010168) |
| 0.2 | 1.6 | GO:0000153 | cytoplasmic ubiquitin ligase complex(GO:0000153) |
| 0.2 | 1.1 | GO:0005960 | glycine cleavage complex(GO:0005960) |
| 0.2 | 0.8 | GO:0005967 | mitochondrial pyruvate dehydrogenase complex(GO:0005967) |
| 0.2 | 2.2 | GO:0000322 | storage vacuole(GO:0000322) protein storage vacuole(GO:0000326) |
| 0.2 | 7.3 | GO:0010319 | stromule(GO:0010319) |
| 0.2 | 2.6 | GO:0010598 | NAD(P)H dehydrogenase complex (plastoquinone)(GO:0010598) |
| 0.2 | 0.5 | GO:0034274 | Atg12-Atg5-Atg16 complex(GO:0034274) |
| 0.1 | 2.8 | GO:0016602 | CCAAT-binding factor complex(GO:0016602) |
| 0.1 | 1.3 | GO:0030076 | thylakoid light-harvesting complex(GO:0009503) PSII associated light-harvesting complex II(GO:0009517) light-harvesting complex(GO:0030076) |
| 0.1 | 0.6 | GO:0019897 | extrinsic component of plasma membrane(GO:0019897) |
| 0.1 | 6.4 | GO:0010287 | plastoglobule(GO:0010287) |
| 0.1 | 1.0 | GO:0009538 | photosystem I reaction center(GO:0009538) |
| 0.1 | 0.3 | GO:0032432 | actin filament bundle(GO:0032432) |
| 0.1 | 0.3 | GO:0005674 | transcription factor TFIIF complex(GO:0005674) |
| 0.1 | 0.3 | GO:0045495 | P granule(GO:0043186) pole plasm(GO:0045495) germ plasm(GO:0060293) |
| 0.1 | 1.6 | GO:0000786 | nucleosome(GO:0000786) |
| 0.1 | 1.2 | GO:0030131 | clathrin adaptor complex(GO:0030131) |
| 0.1 | 0.4 | GO:0031314 | extrinsic component of mitochondrial inner membrane(GO:0031314) |
| 0.1 | 0.3 | GO:0031417 | N-terminal protein acetyltransferase complex(GO:0031414) NatC complex(GO:0031417) |
| 0.1 | 1.2 | GO:0031902 | late endosome membrane(GO:0031902) |
| 0.1 | 1.8 | GO:0009898 | cytoplasmic side of plasma membrane(GO:0009898) |
| 0.1 | 0.2 | GO:0000110 | nucleotide-excision repair factor 1 complex(GO:0000110) |
| 0.1 | 1.5 | GO:0000148 | 1,3-beta-D-glucan synthase complex(GO:0000148) |
| 0.1 | 0.6 | GO:0071012 | U2-type catalytic step 1 spliceosome(GO:0071006) catalytic step 1 spliceosome(GO:0071012) |
| 0.1 | 0.9 | GO:0032806 | holo TFIIH complex(GO:0005675) carboxy-terminal domain protein kinase complex(GO:0032806) |
| 0.1 | 1.1 | GO:0071458 | integral component of cytoplasmic side of endoplasmic reticulum membrane(GO:0071458) cytoplasmic side of endoplasmic reticulum membrane(GO:0098554) |
| 0.1 | 0.5 | GO:0009522 | photosystem I(GO:0009522) |
| 0.1 | 0.4 | GO:0001673 | male germ cell nucleus(GO:0001673) |
| 0.1 | 1.1 | GO:0005779 | integral component of peroxisomal membrane(GO:0005779) intrinsic component of peroxisomal membrane(GO:0031231) |
| 0.1 | 4.2 | GO:0019005 | SCF ubiquitin ligase complex(GO:0019005) |
| 0.1 | 0.7 | GO:0030118 | clathrin coat(GO:0030118) clathrin vesicle coat(GO:0030125) |
| 0.1 | 1.1 | GO:0033179 | proton-transporting V-type ATPase, V0 domain(GO:0033179) |
| 0.1 | 1.4 | GO:0009654 | photosystem II oxygen evolving complex(GO:0009654) |
| 0.1 | 1.3 | GO:0045239 | tricarboxylic acid cycle enzyme complex(GO:0045239) |
| 0.1 | 0.3 | GO:0046695 | SLIK (SAGA-like) complex(GO:0046695) |
| 0.1 | 0.3 | GO:0034098 | VCP-NPL4-UFD1 AAA ATPase complex(GO:0034098) |
| 0.1 | 0.3 | GO:0009897 | external side of plasma membrane(GO:0009897) |
| 0.1 | 1.1 | GO:0005744 | mitochondrial inner membrane presequence translocase complex(GO:0005744) |
| 0.1 | 0.3 | GO:0043076 | megasporocyte nucleus(GO:0043076) polar nucleus(GO:0043078) |
| 0.0 | 0.8 | GO:0005793 | endoplasmic reticulum-Golgi intermediate compartment(GO:0005793) |
| 0.0 | 1.7 | GO:0000137 | Golgi cis cisterna(GO:0000137) |
| 0.0 | 0.4 | GO:0072546 | ER membrane protein complex(GO:0072546) |
| 0.0 | 0.3 | GO:0005787 | signal peptidase complex(GO:0005787) |
| 0.0 | 0.7 | GO:0031011 | Ino80 complex(GO:0031011) DNA helicase complex(GO:0033202) |
| 0.0 | 0.2 | GO:0000164 | protein phosphatase type 1 complex(GO:0000164) |
| 0.0 | 0.1 | GO:0031080 | nuclear pore outer ring(GO:0031080) |
| 0.0 | 0.2 | GO:0031380 | RNA-directed RNA polymerase complex(GO:0031379) nuclear RNA-directed RNA polymerase complex(GO:0031380) |
| 0.0 | 1.0 | GO:0031228 | integral component of Golgi membrane(GO:0030173) intrinsic component of Golgi membrane(GO:0031228) |
| 0.0 | 5.6 | GO:0099503 | secretory vesicle(GO:0099503) |
| 0.0 | 0.2 | GO:0000276 | mitochondrial proton-transporting ATP synthase complex, coupling factor F(o)(GO:0000276) |
| 0.0 | 1.5 | GO:0031201 | SNARE complex(GO:0031201) |
| 0.0 | 0.1 | GO:0005884 | actin filament(GO:0005884) |
| 0.0 | 0.1 | GO:0033588 | Elongator holoenzyme complex(GO:0033588) |
| 0.0 | 0.5 | GO:0005769 | early endosome(GO:0005769) |
| 0.0 | 0.2 | GO:0005697 | telomerase holoenzyme complex(GO:0005697) |
| 0.0 | 0.5 | GO:0031307 | intrinsic component of mitochondrial outer membrane(GO:0031306) integral component of mitochondrial outer membrane(GO:0031307) |
| 0.0 | 0.1 | GO:0033063 | Rad51B-Rad51C-Rad51D-XRCC2 complex(GO:0033063) |
| 0.0 | 2.0 | GO:0000138 | Golgi trans cisterna(GO:0000138) |
| 0.0 | 0.7 | GO:0030176 | integral component of endoplasmic reticulum membrane(GO:0030176) |
| 0.0 | 0.2 | GO:0070461 | SAGA-type complex(GO:0070461) |
| 0.0 | 0.4 | GO:0005778 | peroxisomal membrane(GO:0005778) microbody membrane(GO:0031903) |
| 0.0 | 0.2 | GO:0017119 | Golgi transport complex(GO:0017119) |
| 0.0 | 0.0 | GO:0031227 | intrinsic component of endoplasmic reticulum membrane(GO:0031227) |
| 0.0 | 0.5 | GO:0000159 | protein phosphatase type 2A complex(GO:0000159) |
| 0.0 | 5.6 | GO:0005777 | peroxisome(GO:0005777) microbody(GO:0042579) |
| 0.0 | 0.1 | GO:0031248 | histone acetyltransferase complex(GO:0000123) protein acetyltransferase complex(GO:0031248) acetyltransferase complex(GO:1902493) |
| 0.0 | 0.2 | GO:0035267 | NuA4 histone acetyltransferase complex(GO:0035267) H4/H2A histone acetyltransferase complex(GO:0043189) H4 histone acetyltransferase complex(GO:1902562) |
| 0.0 | 0.8 | GO:0090575 | RNA polymerase II transcription factor complex(GO:0090575) |
| 0.0 | 0.1 | GO:0048188 | Set1C/COMPASS complex(GO:0048188) |
| 0.0 | 0.1 | GO:0031083 | BLOC complex(GO:0031082) BLOC-1 complex(GO:0031083) |
| 0.0 | 3.6 | GO:0009579 | thylakoid(GO:0009579) |
| 0.0 | 8.1 | GO:0009941 | chloroplast envelope(GO:0009941) |
| 0.0 | 5.4 | GO:0044434 | chloroplast part(GO:0044434) |
| 0.0 | 0.2 | GO:0005763 | mitochondrial small ribosomal subunit(GO:0005763) |
| 0.0 | 0.2 | GO:0008180 | COP9 signalosome(GO:0008180) |
| 0.0 | 1.7 | GO:0080008 | Cul4-RING E3 ubiquitin ligase complex(GO:0080008) |
| 0.0 | 0.0 | GO:0097550 | transcriptional preinitiation complex(GO:0097550) |
| 0.0 | 0.2 | GO:0005885 | Arp2/3 protein complex(GO:0005885) |
| 0.0 | 0.3 | GO:0000307 | cyclin-dependent protein kinase holoenzyme complex(GO:0000307) |
| 0.0 | 0.1 | GO:0016281 | eukaryotic translation initiation factor 4F complex(GO:0016281) |
| 0.0 | 0.1 | GO:0031519 | PcG protein complex(GO:0031519) |
| 0.0 | 0.5 | GO:0005667 | transcription factor complex(GO:0005667) |
| 0.0 | 0.1 | GO:0030906 | retromer, cargo-selective complex(GO:0030906) |
Gene overrepresentation in molecular function category:
| Log-likelihood per target | Total log-likelihood | Term | Description |
|---|---|---|---|
| 1.0 | 4.0 | GO:0004512 | inositol-3-phosphate synthase activity(GO:0004512) |
| 0.9 | 2.6 | GO:0080104 | 3-methylthiopropyl glucosinolate S-oxygenase activity(GO:0080102) 5-methylthiopropyl glucosinolate S-oxygenase activity(GO:0080104) 7-methylthiopropyl glucosinolate S-oxygenase activity(GO:0080106) |
| 0.7 | 2.9 | GO:0030410 | nicotianamine synthase activity(GO:0030410) |
| 0.6 | 3.7 | GO:0004848 | ureidoglycolate hydrolase activity(GO:0004848) |
| 0.6 | 2.3 | GO:0004737 | pyruvate decarboxylase activity(GO:0004737) |
| 0.5 | 1.6 | GO:0000249 | C-22 sterol desaturase activity(GO:0000249) |
| 0.5 | 1.6 | GO:0050736 | O-malonyltransferase activity(GO:0050736) |
| 0.5 | 4.3 | GO:0047216 | inositol 3-alpha-galactosyltransferase activity(GO:0047216) |
| 0.5 | 1.9 | GO:0070401 | NADP+ binding(GO:0070401) |
| 0.4 | 1.7 | GO:0019156 | isoamylase activity(GO:0019156) |
| 0.4 | 1.3 | GO:0003861 | 3-isopropylmalate dehydratase activity(GO:0003861) |
| 0.4 | 1.7 | GO:0003852 | 2-isopropylmalate synthase activity(GO:0003852) |
| 0.4 | 1.6 | GO:0016040 | glutamate synthase activity(GO:0015930) glutamate synthase (NADH) activity(GO:0016040) glutamate synthase activity, NAD(P)H as acceptor(GO:0045181) |
| 0.4 | 4.4 | GO:0033743 | peptide-methionine (R)-S-oxide reductase activity(GO:0033743) |
| 0.4 | 1.2 | GO:0009671 | nitrate:proton symporter activity(GO:0009671) |
| 0.4 | 2.7 | GO:0031492 | nucleosomal DNA binding(GO:0031492) |
| 0.4 | 1.1 | GO:0045485 | omega-6 fatty acid desaturase activity(GO:0045485) |
| 0.4 | 1.5 | GO:0033925 | mannosyl-glycoprotein endo-beta-N-acetylglucosaminidase activity(GO:0033925) |
| 0.4 | 1.1 | GO:0004133 | glycogen debranching enzyme activity(GO:0004133) |
| 0.4 | 1.1 | GO:0004375 | glycine dehydrogenase (decarboxylating) activity(GO:0004375) oxidoreductase activity, acting on the CH-NH2 group of donors, disulfide as acceptor(GO:0016642) |
| 0.4 | 1.8 | GO:0004333 | fumarate hydratase activity(GO:0004333) |
| 0.4 | 1.4 | GO:0004350 | glutamate 5-kinase activity(GO:0004349) glutamate-5-semialdehyde dehydrogenase activity(GO:0004350) |
| 0.3 | 1.3 | GO:0046423 | allene-oxide cyclase activity(GO:0046423) |
| 0.3 | 1.8 | GO:0015369 | calcium:proton antiporter activity(GO:0015369) |
| 0.3 | 0.9 | GO:0035671 | enone reductase activity(GO:0035671) |
| 0.3 | 0.9 | GO:0047364 | desulfoglucosinolate sulfotransferase activity(GO:0047364) |
| 0.3 | 0.8 | GO:0008898 | S-adenosylmethionine-homocysteine S-methyltransferase activity(GO:0008898) betaine-homocysteine S-methyltransferase activity(GO:0047150) |
| 0.3 | 1.8 | GO:0016781 | phosphotransferase activity, paired acceptors(GO:0016781) |
| 0.3 | 1.0 | GO:0004671 | protein C-terminal carboxyl O-methyltransferase activity(GO:0003880) protein C-terminal S-isoprenylcysteine carboxyl O-methyltransferase activity(GO:0004671) |
| 0.2 | 1.2 | GO:0036374 | peptidyltransferase activity(GO:0000048) glutathione hydrolase activity(GO:0036374) |
| 0.2 | 0.7 | GO:0004462 | lactoylglutathione lyase activity(GO:0004462) |
| 0.2 | 1.0 | GO:0004307 | ethanolaminephosphotransferase activity(GO:0004307) |
| 0.2 | 1.0 | GO:0015368 | calcium:cation antiporter activity(GO:0015368) |
| 0.2 | 0.7 | GO:0004412 | homoserine dehydrogenase activity(GO:0004412) |
| 0.2 | 2.1 | GO:0004020 | adenylylsulfate kinase activity(GO:0004020) |
| 0.2 | 1.3 | GO:0005230 | ionotropic glutamate receptor activity(GO:0004970) extracellular ligand-gated ion channel activity(GO:0005230) transmitter-gated ion channel activity(GO:0022824) transmitter-gated channel activity(GO:0022835) neurotransmitter receptor activity(GO:0030594) |
| 0.2 | 1.3 | GO:0052656 | L-leucine transaminase activity(GO:0052654) L-valine transaminase activity(GO:0052655) L-isoleucine transaminase activity(GO:0052656) |
| 0.2 | 1.6 | GO:0004506 | squalene monooxygenase activity(GO:0004506) |
| 0.2 | 1.2 | GO:0016312 | inositol bisphosphate phosphatase activity(GO:0016312) |
| 0.2 | 1.2 | GO:0019904 | protein domain specific binding(GO:0019904) |
| 0.2 | 0.8 | GO:0051998 | protein carboxyl O-methyltransferase activity(GO:0051998) |
| 0.2 | 1.7 | GO:0004096 | catalase activity(GO:0004096) |
| 0.2 | 0.9 | GO:0003959 | NADPH dehydrogenase activity(GO:0003959) |
| 0.2 | 2.4 | GO:0004332 | fructose-bisphosphate aldolase activity(GO:0004332) |
| 0.2 | 1.3 | GO:0033201 | starch synthase activity(GO:0009011) alpha-1,4-glucan synthase activity(GO:0033201) |
| 0.2 | 2.0 | GO:0008061 | chitin binding(GO:0008061) |
| 0.2 | 0.8 | GO:0008430 | selenium binding(GO:0008430) |
| 0.2 | 0.8 | GO:1990841 | promoter-specific chromatin binding(GO:1990841) |
| 0.2 | 0.6 | GO:0016856 | racemase and epimerase activity, acting on hydroxy acids and derivatives(GO:0016856) |
| 0.1 | 0.5 | GO:0016314 | phosphatidylinositol-3,4,5-trisphosphate 3-phosphatase activity(GO:0016314) |
| 0.1 | 0.6 | GO:0042132 | fructose 1,6-bisphosphate 1-phosphatase activity(GO:0042132) |
| 0.1 | 0.4 | GO:0003844 | 1,4-alpha-glucan branching enzyme activity(GO:0003844) |
| 0.1 | 0.4 | GO:0000179 | rRNA (adenine-N6,N6-)-dimethyltransferase activity(GO:0000179) |
| 0.1 | 0.5 | GO:0034722 | gamma-glutamyl-peptidase activity(GO:0034722) |
| 0.1 | 1.9 | GO:0016844 | strictosidine synthase activity(GO:0016844) |
| 0.1 | 0.4 | GO:0036381 | pyridoxal 5'-phosphate synthase (glutamine hydrolysing) activity(GO:0036381) |
| 0.1 | 0.7 | GO:0010313 | phytochrome binding(GO:0010313) |
| 0.1 | 0.9 | GO:0004739 | pyruvate dehydrogenase (acetyl-transferring) activity(GO:0004739) |
| 0.1 | 3.2 | GO:0016168 | chlorophyll binding(GO:0016168) |
| 0.1 | 0.5 | GO:0004475 | mannose-1-phosphate guanylyltransferase activity(GO:0004475) |
| 0.1 | 0.7 | GO:0047769 | prephenate dehydratase activity(GO:0004664) arogenate dehydratase activity(GO:0047769) |
| 0.1 | 0.5 | GO:0042299 | lupeol synthase activity(GO:0042299) |
| 0.1 | 0.4 | GO:0047874 | dolichyldiphosphatase activity(GO:0047874) |
| 0.1 | 0.5 | GO:0015018 | galactosylgalactosylxylosylprotein 3-beta-glucuronosyltransferase activity(GO:0015018) |
| 0.1 | 0.4 | GO:0043812 | phosphatidylinositol phosphate 4-phosphatase activity(GO:0034596) phosphatidylinositol-4-phosphate phosphatase activity(GO:0043812) |
| 0.1 | 0.6 | GO:0031956 | medium-chain fatty acid-CoA ligase activity(GO:0031956) |
| 0.1 | 0.9 | GO:0070696 | transmembrane receptor protein serine/threonine kinase binding(GO:0070696) |
| 0.1 | 2.3 | GO:0022839 | calcium activated cation channel activity(GO:0005227) ion gated channel activity(GO:0022839) |
| 0.1 | 0.7 | GO:0016813 | hydrolase activity, acting on carbon-nitrogen (but not peptide) bonds, in linear amidines(GO:0016813) |
| 0.1 | 3.7 | GO:0016671 | oxidoreductase activity, acting on a sulfur group of donors, disulfide as acceptor(GO:0016671) |
| 0.1 | 0.8 | GO:0010178 | IAA-amino acid conjugate hydrolase activity(GO:0010178) |
| 0.1 | 1.0 | GO:0009882 | blue light photoreceptor activity(GO:0009882) |
| 0.1 | 0.8 | GO:2001070 | starch binding(GO:2001070) |
| 0.1 | 1.1 | GO:0004602 | glutathione peroxidase activity(GO:0004602) |
| 0.1 | 0.5 | GO:0015186 | L-glutamine transmembrane transporter activity(GO:0015186) |
| 0.1 | 0.5 | GO:0004108 | citrate (Si)-synthase activity(GO:0004108) citrate synthase activity(GO:0036440) |
| 0.1 | 0.3 | GO:0008963 | phospho-N-acetylmuramoyl-pentapeptide-transferase activity(GO:0008963) |
| 0.1 | 1.0 | GO:0017136 | NAD-dependent histone deacetylase activity(GO:0017136) histone deacetylase activity (H3-K14 specific)(GO:0031078) NAD-dependent histone deacetylase activity (H3-K14 specific)(GO:0032041) NAD-dependent protein deacetylase activity(GO:0034979) |
| 0.1 | 0.3 | GO:0003857 | 3-hydroxyacyl-CoA dehydrogenase activity(GO:0003857) |
| 0.1 | 0.5 | GO:0008184 | glycogen phosphorylase activity(GO:0008184) |
| 0.1 | 0.6 | GO:0005483 | soluble NSF attachment protein activity(GO:0005483) |
| 0.1 | 1.4 | GO:0008028 | monocarboxylic acid transmembrane transporter activity(GO:0008028) |
| 0.1 | 2.2 | GO:0008559 | xenobiotic-transporting ATPase activity(GO:0008559) |
| 0.1 | 0.8 | GO:0030151 | molybdenum ion binding(GO:0030151) |
| 0.1 | 0.2 | GO:0005315 | inorganic phosphate transmembrane transporter activity(GO:0005315) |
| 0.1 | 0.9 | GO:0004362 | glutathione-disulfide reductase activity(GO:0004362) |
| 0.1 | 0.8 | GO:0003954 | NADH dehydrogenase activity(GO:0003954) |
| 0.1 | 4.6 | GO:0042910 | xenobiotic transporter activity(GO:0042910) |
| 0.1 | 0.6 | GO:0019825 | oxygen binding(GO:0019825) |
| 0.1 | 0.3 | GO:0004046 | aminoacylase activity(GO:0004046) |
| 0.1 | 0.3 | GO:0070259 | tyrosyl-DNA phosphodiesterase activity(GO:0070259) |
| 0.1 | 2.0 | GO:0003756 | protein disulfide isomerase activity(GO:0003756) intramolecular oxidoreductase activity, transposing S-S bonds(GO:0016864) |
| 0.1 | 0.4 | GO:0004765 | shikimate kinase activity(GO:0004765) |
| 0.1 | 0.6 | GO:0016703 | oxidoreductase activity, acting on single donors with incorporation of molecular oxygen, incorporation of one atom of oxygen (internal monooxygenases or internal mixed function oxidases)(GO:0016703) |
| 0.1 | 1.0 | GO:0102391 | acyl-CoA ligase activity(GO:0003996) long-chain fatty acid-CoA ligase activity(GO:0004467) decanoate--CoA ligase activity(GO:0102391) |
| 0.1 | 0.6 | GO:0030332 | cyclin binding(GO:0030332) |
| 0.1 | 0.4 | GO:0005460 | UDP-glucose transmembrane transporter activity(GO:0005460) |
| 0.1 | 0.5 | GO:0051723 | protein methylesterase activity(GO:0051723) |
| 0.1 | 0.6 | GO:0004834 | tryptophan synthase activity(GO:0004834) |
| 0.1 | 1.5 | GO:0003843 | 1,3-beta-D-glucan synthase activity(GO:0003843) |
| 0.1 | 0.7 | GO:1904680 | oligopeptide transmembrane transporter activity(GO:0035673) peptide transmembrane transporter activity(GO:1904680) |
| 0.1 | 1.3 | GO:0010329 | auxin efflux transmembrane transporter activity(GO:0010329) |
| 0.1 | 0.8 | GO:0004435 | phosphatidylinositol phospholipase C activity(GO:0004435) |
| 0.1 | 0.2 | GO:0047134 | protein-disulfide reductase activity(GO:0047134) |
| 0.1 | 0.4 | GO:0050113 | inositol oxygenase activity(GO:0050113) |
| 0.1 | 0.7 | GO:0004869 | cysteine-type endopeptidase inhibitor activity(GO:0004869) |
| 0.1 | 2.2 | GO:0008266 | poly(U) RNA binding(GO:0008266) |
| 0.1 | 1.2 | GO:0008146 | sulfotransferase activity(GO:0008146) |
| 0.1 | 0.6 | GO:0050307 | sucrose-phosphate phosphatase activity(GO:0050307) |
| 0.1 | 0.2 | GO:0016979 | lipoate-protein ligase activity(GO:0016979) lipoate synthase activity(GO:0016992) |
| 0.1 | 0.5 | GO:0052852 | very-long-chain-(S)-2-hydroxy-acid oxidase activity(GO:0052852) long-chain-(S)-2-hydroxy-long-chain-acid oxidase activity(GO:0052853) medium-chain-(S)-2-hydroxy-acid oxidase activity(GO:0052854) |
| 0.1 | 3.1 | GO:0003727 | single-stranded RNA binding(GO:0003727) |
| 0.1 | 1.0 | GO:0030674 | protein binding, bridging(GO:0030674) |
| 0.1 | 0.2 | GO:0019789 | SUMO transferase activity(GO:0019789) |
| 0.1 | 0.3 | GO:0004325 | ferrochelatase activity(GO:0004325) |
| 0.1 | 0.5 | GO:0052622 | ATP dimethylallyltransferase activity(GO:0052622) ADP dimethylallyltransferase activity(GO:0052623) |
| 0.1 | 0.3 | GO:0004048 | anthranilate phosphoribosyltransferase activity(GO:0004048) |
| 0.1 | 0.9 | GO:0070567 | cytidylyltransferase activity(GO:0070567) |
| 0.1 | 0.6 | GO:0004930 | G-protein coupled receptor activity(GO:0004930) |
| 0.1 | 0.3 | GO:0005247 | voltage-gated chloride channel activity(GO:0005247) chloride channel activity(GO:0005254) |
| 0.1 | 0.7 | GO:0004565 | beta-galactosidase activity(GO:0004565) |
| 0.1 | 0.5 | GO:0032977 | membrane insertase activity(GO:0032977) |
| 0.1 | 0.2 | GO:0045430 | chalcone isomerase activity(GO:0045430) |
| 0.1 | 1.9 | GO:0044183 | protein binding involved in protein folding(GO:0044183) |
| 0.1 | 0.4 | GO:0046923 | ER retention sequence binding(GO:0046923) |
| 0.1 | 0.5 | GO:0080046 | quercetin 4'-O-glucosyltransferase activity(GO:0080046) |
| 0.1 | 0.3 | GO:0045544 | gibberellin 20-oxidase activity(GO:0045544) |
| 0.1 | 0.5 | GO:0016987 | core DNA-dependent RNA polymerase binding promoter specificity activity(GO:0000996) sigma factor activity(GO:0016987) |
| 0.1 | 1.2 | GO:0008353 | RNA polymerase II carboxy-terminal domain kinase activity(GO:0008353) |
| 0.1 | 0.2 | GO:0051377 | mannose-ethanolamine phosphotransferase activity(GO:0051377) |
| 0.1 | 0.7 | GO:0008195 | phosphatidate phosphatase activity(GO:0008195) |
| 0.1 | 0.5 | GO:0004032 | alditol:NADP+ 1-oxidoreductase activity(GO:0004032) |
| 0.1 | 0.3 | GO:0030371 | translation repressor activity(GO:0030371) |
| 0.1 | 0.9 | GO:0005375 | copper ion transmembrane transporter activity(GO:0005375) |
| 0.1 | 1.1 | GO:0043295 | glutathione binding(GO:0043295) oligopeptide binding(GO:1900750) |
| 0.1 | 0.4 | GO:0008157 | protein phosphatase 1 binding(GO:0008157) |
| 0.1 | 0.3 | GO:0050664 | NAD(P)H oxidase activity(GO:0016174) oxidoreductase activity, acting on NAD(P)H, oxygen as acceptor(GO:0050664) |
| 0.1 | 0.5 | GO:0008318 | protein prenyltransferase activity(GO:0008318) |
| 0.1 | 0.4 | GO:0009916 | alternative oxidase activity(GO:0009916) |
| 0.1 | 0.4 | GO:0004356 | glutamate-ammonia ligase activity(GO:0004356) |
| 0.1 | 0.4 | GO:0017091 | AU-rich element binding(GO:0017091) |
| 0.1 | 0.3 | GO:0098599 | palmitoyl hydrolase activity(GO:0098599) |
| 0.1 | 0.3 | GO:0004028 | 3-chloroallyl aldehyde dehydrogenase activity(GO:0004028) |
| 0.1 | 0.2 | GO:0004014 | adenosylmethionine decarboxylase activity(GO:0004014) |
| 0.1 | 0.4 | GO:0043855 | intracellular cyclic nucleotide activated cation channel activity(GO:0005221) cyclic nucleotide-gated ion channel activity(GO:0043855) |
| 0.1 | 0.9 | GO:0015386 | potassium:proton antiporter activity(GO:0015386) |
| 0.0 | 0.4 | GO:0016423 | tRNA (guanine) methyltransferase activity(GO:0016423) |
| 0.0 | 1.2 | GO:0005345 | purine nucleobase transmembrane transporter activity(GO:0005345) |
| 0.0 | 4.5 | GO:0008422 | beta-glucosidase activity(GO:0008422) |
| 0.0 | 0.6 | GO:0032440 | 2-alkenal reductase [NAD(P)] activity(GO:0032440) |
| 0.0 | 0.3 | GO:0016621 | cinnamoyl-CoA reductase activity(GO:0016621) |
| 0.0 | 0.5 | GO:0016688 | L-ascorbate peroxidase activity(GO:0016688) |
| 0.0 | 0.5 | GO:0103075 | indole-3-pyruvate monooxygenase activity(GO:0103075) |
| 0.0 | 0.2 | GO:0046509 | 1,2-diacylglycerol 3-beta-galactosyltransferase activity(GO:0046509) |
| 0.0 | 2.6 | GO:0061631 | ubiquitin conjugating enzyme activity(GO:0061631) ubiquitin-like protein conjugating enzyme activity(GO:0061650) |
| 0.0 | 0.5 | GO:0000293 | ferric-chelate reductase activity(GO:0000293) oxidoreductase activity, oxidizing metal ions, NAD or NADP as acceptor(GO:0016723) |
| 0.0 | 0.3 | GO:0001872 | (1->3)-beta-D-glucan binding(GO:0001872) |
| 0.0 | 1.4 | GO:0048029 | monosaccharide binding(GO:0048029) |
| 0.0 | 0.4 | GO:0035252 | UDP-xylosyltransferase activity(GO:0035252) |
| 0.0 | 0.8 | GO:0003951 | NAD+ kinase activity(GO:0003951) |
| 0.0 | 0.3 | GO:0000990 | transcription factor activity, core RNA polymerase binding(GO:0000990) |
| 0.0 | 1.0 | GO:0016868 | intramolecular transferase activity, phosphotransferases(GO:0016868) |
| 0.0 | 0.1 | GO:0001054 | RNA polymerase I activity(GO:0001054) RNA polymerase III activity(GO:0001056) |
| 0.0 | 0.1 | GO:0001046 | core promoter sequence-specific DNA binding(GO:0001046) core promoter binding(GO:0001047) |
| 0.0 | 0.1 | GO:0004477 | methenyltetrahydrofolate cyclohydrolase activity(GO:0004477) methylenetetrahydrofolate dehydrogenase (NADP+) activity(GO:0004488) |
| 0.0 | 1.1 | GO:0070566 | adenylyltransferase activity(GO:0070566) |
| 0.0 | 0.5 | GO:0051747 | cytosine C-5 DNA demethylase activity(GO:0051747) |
| 0.0 | 0.2 | GO:0070034 | telomerase RNA binding(GO:0070034) |
| 0.0 | 0.2 | GO:0019784 | NEDD8-specific protease activity(GO:0019784) |
| 0.0 | 0.3 | GO:0016151 | nickel cation binding(GO:0016151) |
| 0.0 | 0.5 | GO:0016208 | AMP binding(GO:0016208) |
| 0.0 | 1.1 | GO:0016655 | oxidoreductase activity, acting on NAD(P)H, quinone or similar compound as acceptor(GO:0016655) |
| 0.0 | 0.1 | GO:0004618 | phosphoglycerate kinase activity(GO:0004618) |
| 0.0 | 2.0 | GO:0005484 | SNAP receptor activity(GO:0005484) |
| 0.0 | 0.2 | GO:0003968 | RNA-directed RNA polymerase activity(GO:0003968) |
| 0.0 | 0.3 | GO:0004526 | ribonuclease P activity(GO:0004526) |
| 0.0 | 0.1 | GO:0003986 | acetyl-CoA hydrolase activity(GO:0003986) |
| 0.0 | 0.3 | GO:0003906 | DNA-(apurinic or apyrimidinic site) lyase activity(GO:0003906) |
| 0.0 | 1.3 | GO:0080030 | methyl indole-3-acetate esterase activity(GO:0080030) |
| 0.0 | 0.2 | GO:0016872 | intramolecular lyase activity(GO:0016872) |
| 0.0 | 0.6 | GO:0034595 | phosphatidylinositol-4,5-bisphosphate 5-phosphatase activity(GO:0004439) phosphatidylinositol phosphate 5-phosphatase activity(GO:0034595) |
| 0.0 | 0.2 | GO:0042171 | 1-acylglycerol-3-phosphate O-acyltransferase activity(GO:0003841) lysophosphatidic acid acyltransferase activity(GO:0042171) |
| 0.0 | 0.3 | GO:0003860 | 3-hydroxyisobutyryl-CoA hydrolase activity(GO:0003860) |
| 0.0 | 0.3 | GO:0051537 | 2 iron, 2 sulfur cluster binding(GO:0051537) |
| 0.0 | 3.9 | GO:0030246 | carbohydrate binding(GO:0030246) |
| 0.0 | 0.3 | GO:0042500 | aspartic endopeptidase activity, intramembrane cleaving(GO:0042500) |
| 0.0 | 0.9 | GO:0005496 | steroid binding(GO:0005496) |
| 0.0 | 0.1 | GO:0008460 | dTDP-glucose 4,6-dehydratase activity(GO:0008460) |
| 0.0 | 0.1 | GO:1990380 | Lys48-specific deubiquitinase activity(GO:1990380) |
| 0.0 | 0.2 | GO:0010011 | auxin binding(GO:0010011) |
| 0.0 | 1.0 | GO:0016706 | oxidoreductase activity, acting on paired donors, with incorporation or reduction of molecular oxygen, 2-oxoglutarate as one donor, and incorporation of one atom each of oxygen into both donors(GO:0016706) |
| 0.0 | 1.4 | GO:0008080 | N-acetyltransferase activity(GO:0008080) |
| 0.0 | 0.4 | GO:0043175 | RNA polymerase II core binding(GO:0000993) RNA polymerase core enzyme binding(GO:0043175) |
| 0.0 | 1.3 | GO:0016620 | oxidoreductase activity, acting on the aldehyde or oxo group of donors, NAD or NADP as acceptor(GO:0016620) |
| 0.0 | 0.2 | GO:0003988 | acetyl-CoA C-acyltransferase activity(GO:0003988) |
| 0.0 | 1.2 | GO:0004364 | glutathione transferase activity(GO:0004364) |
| 0.0 | 0.7 | GO:0005388 | calcium-transporting ATPase activity(GO:0005388) |
| 0.0 | 0.3 | GO:0004351 | glutamate decarboxylase activity(GO:0004351) |
| 0.0 | 0.2 | GO:0000095 | S-adenosyl-L-methionine transmembrane transporter activity(GO:0000095) coenzyme transporter activity(GO:0051185) |
| 0.0 | 0.8 | GO:0015450 | P-P-bond-hydrolysis-driven protein transmembrane transporter activity(GO:0015450) |
| 0.0 | 43.9 | GO:0003700 | nucleic acid binding transcription factor activity(GO:0001071) transcription factor activity, sequence-specific DNA binding(GO:0003700) |
| 0.0 | 0.1 | GO:0080122 | AMP transmembrane transporter activity(GO:0080122) |
| 0.0 | 0.1 | GO:0004057 | arginyltransferase activity(GO:0004057) |
| 0.0 | 0.6 | GO:0031386 | protein tag(GO:0031386) |
| 0.0 | 1.5 | GO:0016799 | hydrolase activity, hydrolyzing N-glycosyl compounds(GO:0016799) |
| 0.0 | 0.1 | GO:0004750 | ribulose-phosphate 3-epimerase activity(GO:0004750) |
| 0.0 | 1.3 | GO:0016811 | hydrolase activity, acting on carbon-nitrogen (but not peptide) bonds, in linear amides(GO:0016811) |
| 0.0 | 0.2 | GO:0019210 | kinase inhibitor activity(GO:0019210) |
| 0.0 | 0.3 | GO:0016780 | phosphotransferase activity, for other substituted phosphate groups(GO:0016780) |
| 0.0 | 0.1 | GO:0004367 | glycerol-3-phosphate dehydrogenase [NAD+] activity(GO:0004367) |
| 0.0 | 1.2 | GO:0004185 | serine-type carboxypeptidase activity(GO:0004185) |
| 0.0 | 0.9 | GO:0003713 | transcription coactivator activity(GO:0003713) |
| 0.0 | 0.8 | GO:0005319 | lipid transporter activity(GO:0005319) |
| 0.0 | 0.4 | GO:0005089 | Rho guanyl-nucleotide exchange factor activity(GO:0005089) |
| 0.0 | 0.5 | GO:0000156 | phosphorelay response regulator activity(GO:0000156) |
| 0.0 | 0.3 | GO:0008409 | 5'-3' exonuclease activity(GO:0008409) |
| 0.0 | 0.3 | GO:0030276 | clathrin binding(GO:0030276) |
| 0.0 | 0.2 | GO:0009927 | histidine phosphotransfer kinase activity(GO:0009927) |
| 0.0 | 0.0 | GO:0016843 | amine-lyase activity(GO:0016843) |
| 0.0 | 0.1 | GO:0004326 | tetrahydrofolylpolyglutamate synthase activity(GO:0004326) |
| 0.0 | 0.2 | GO:0030295 | kinase activator activity(GO:0019209) protein kinase activator activity(GO:0030295) |
| 0.0 | 0.1 | GO:0008728 | GTP diphosphokinase activity(GO:0008728) |
| 0.0 | 0.3 | GO:0015174 | basic amino acid transmembrane transporter activity(GO:0015174) |
| 0.0 | 1.4 | GO:0008047 | enzyme activator activity(GO:0008047) |
| 0.0 | 0.0 | GO:0016767 | geranylgeranyl-diphosphate geranylgeranyltransferase activity(GO:0016767) |
| 0.0 | 0.1 | GO:0102360 | daphnetin 3-O-glucosyltransferase activity(GO:0102360) |
| 0.0 | 0.1 | GO:0003910 | DNA ligase activity(GO:0003909) DNA ligase (ATP) activity(GO:0003910) |
| 0.0 | 0.1 | GO:0004149 | dihydrolipoyllysine-residue succinyltransferase activity(GO:0004149) succinyltransferase activity(GO:0016748) S-succinyltransferase activity(GO:0016751) |
| 0.0 | 0.5 | GO:0005179 | hormone activity(GO:0005179) |
| 0.0 | 1.0 | GO:0004197 | cysteine-type endopeptidase activity(GO:0004197) |
| 0.0 | 0.1 | GO:0001102 | RNA polymerase II activating transcription factor binding(GO:0001102) |
| 0.0 | 0.2 | GO:0000149 | SNARE binding(GO:0000149) |
| 0.0 | 0.1 | GO:0042781 | 3'-tRNA processing endoribonuclease activity(GO:0042781) |
| 0.0 | 0.2 | GO:0070628 | proteasome binding(GO:0070628) |
| 0.0 | 1.8 | GO:0043531 | ADP binding(GO:0043531) |
| 0.0 | 0.1 | GO:0030942 | endoplasmic reticulum signal peptide binding(GO:0030942) |
| 0.0 | 1.1 | GO:0051015 | actin filament binding(GO:0051015) |
| 0.0 | 0.0 | GO:0004563 | beta-N-acetylhexosaminidase activity(GO:0004563) |
| 0.0 | 0.0 | GO:0005353 | fructose transmembrane transporter activity(GO:0005353) |
Gene overrepresentation in curated gene sets: canonical pathways category:
| Log-likelihood per target | Total log-likelihood | Term | Description |
|---|---|---|---|
| 0.1 | 0.4 | PID ARF6 DOWNSTREAM PATHWAY | Arf6 downstream pathway |
| 0.1 | 0.4 | SA G1 AND S PHASES | Cdk2, 4, and 6 bind cyclin D in G1, while cdk2/cyclin E promotes the G1/S transition. |
| 0.1 | 0.7 | PID AP1 PATHWAY | AP-1 transcription factor network |
| 0.1 | 0.6 | PID HES HEY PATHWAY | Notch-mediated HES/HEY network |
| 0.1 | 0.4 | ST ERK1 ERK2 MAPK PATHWAY | ERK1/ERK2 MAPK Pathway |
| 0.1 | 0.4 | NABA MATRISOME ASSOCIATED | Ensemble of genes encoding ECM-associated proteins including ECM-affilaited proteins, ECM regulators and secreted factors |
| 0.1 | 0.2 | PID AMB2 NEUTROPHILS PATHWAY | amb2 Integrin signaling |
| 0.1 | 0.5 | PID NOTCH PATHWAY | Notch signaling pathway |
| 0.0 | 0.5 | PID E2F PATHWAY | E2F transcription factor network |
| 0.0 | 0.1 | PID HIF2PATHWAY | HIF-2-alpha transcription factor network |
| 0.0 | 0.2 | PID CDC42 PATHWAY | CDC42 signaling events |
| 0.0 | 0.1 | ST G ALPHA I PATHWAY | G alpha i Pathway |
Gene overrepresentation in curated gene sets: REACTOME pathways category:
| Log-likelihood per target | Total log-likelihood | Term | Description |
|---|---|---|---|
| 0.4 | 1.2 | REACTOME GLUTATHIONE CONJUGATION | Genes involved in Glutathione conjugation |
| 0.3 | 0.8 | REACTOME REGULATION OF INSULIN SECRETION | Genes involved in Regulation of Insulin Secretion |
| 0.2 | 1.5 | REACTOME INTERFERON SIGNALING | Genes involved in Interferon Signaling |
| 0.1 | 0.5 | REACTOME SIGNALING BY NOTCH1 | Genes involved in Signaling by NOTCH1 |
| 0.1 | 0.6 | REACTOME RECYCLING OF BILE ACIDS AND SALTS | Genes involved in Recycling of bile acids and salts |
| 0.1 | 0.3 | REACTOME SYNTHESIS OF PIPS AT THE GOLGI MEMBRANE | Genes involved in Synthesis of PIPs at the Golgi membrane |
| 0.1 | 0.3 | REACTOME AMINO ACID SYNTHESIS AND INTERCONVERSION TRANSAMINATION | Genes involved in Amino acid synthesis and interconversion (transamination) |
| 0.1 | 0.1 | REACTOME TRANSCRIPTIONAL REGULATION OF WHITE ADIPOCYTE DIFFERENTIATION | Genes involved in Transcriptional Regulation of White Adipocyte Differentiation |
| 0.1 | 0.3 | REACTOME APOPTOSIS INDUCED DNA FRAGMENTATION | Genes involved in Apoptosis induced DNA fragmentation |
| 0.1 | 0.5 | REACTOME G0 AND EARLY G1 | Genes involved in G0 and Early G1 |
| 0.1 | 0.3 | REACTOME INNATE IMMUNE SYSTEM | Genes involved in Innate Immune System |
| 0.0 | 0.1 | REACTOME FRS2 MEDIATED CASCADE | Genes involved in FRS2-mediated cascade |
| 0.0 | 0.2 | REACTOME FORMATION OF INCISION COMPLEX IN GG NER | Genes involved in Formation of incision complex in GG-NER |
| 0.0 | 0.5 | REACTOME FATTY ACID TRIACYLGLYCEROL AND KETONE BODY METABOLISM | Genes involved in Fatty acid, triacylglycerol, and ketone body metabolism |
| 0.0 | 0.3 | REACTOME TCA CYCLE AND RESPIRATORY ELECTRON TRANSPORT | Genes involved in The citric acid (TCA) cycle and respiratory electron transport |