Project
GSE43616: Time-course of wild-type Arabidopsis leaf
Navigation
Downloads
Results for AT4G36740
Z-value: 1.25
Transcription factors associated with AT4G36740
| Gene Symbol | Gene ID | Gene Info |
|---|---|---|
|
AT4G36740
|
AT4G36740 | homeobox protein 40 |
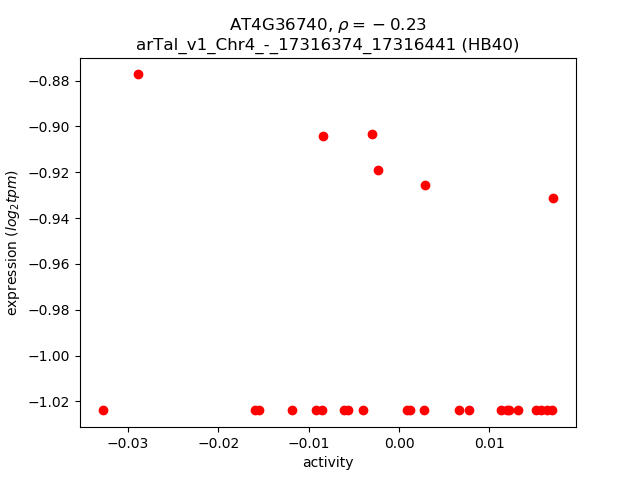
Activity-expression correlation:
| Gene | Promoter | Pearson corr. coef. | P-value | Plot |
|---|---|---|---|---|
| HB40 | arTal_v1_Chr4_-_17316374_17316441 | -0.23 | 2.5e-01 | Click! |
Activity profile of AT4G36740 motif
Sorted Z-values of AT4G36740 motif
| Promoter | Log-likelihood | Transcript | Gene | Gene Info |
|---|---|---|---|---|
| arTal_v1_Chr5_+_9072708_9072727 | 5.95 |
AT5G25980.2
AT5G25980.1 AT5G25980.3 |
TGG2
|
glucoside glucohydrolase 2 |
| arTal_v1_Chr2_-_4312103_4312162 | 5.81 |
AT2G10940.2
AT2G10940.1 |
AT2G10940
|
Bifunctional inhibitor/lipid-transfer protein/seed storage 2S albumin superfamily protein |
| arTal_v1_Chr3_+_10255906_10255941 | 5.67 |
AT3G27690.2
AT3G27690.1 |
LHCB2.3
|
photosystem II light harvesting complex protein 2.3 |
| arTal_v1_Chr4_-_18098633_18098633 | 5.38 |
AT4G38770.1
|
PRP4
|
proline-rich protein 4 |
| arTal_v1_Chr2_-_16950705_16950705 | 5.31 |
AT2G40610.1
|
EXPA8
|
expansin A8 |
| arTal_v1_Chr3_+_5505360_5505360 | 5.11 |
AT3G16240.1
|
DELTA-TIP
|
delta tonoplast integral protein |
| arTal_v1_Chr1_-_29635931_29635931 | 4.96 |
AT1G78820.1
|
AT1G78820
|
D-mannose binding lectin protein with Apple-like carbohydrate-binding domain-containing protein |
| arTal_v1_Chr3_-_197974_197974 | 4.86 |
AT3G01500.1
|
CA1
|
carbonic anhydrase 1 |
| arTal_v1_Chr3_-_198160_198160 | 4.81 |
AT3G01500.2
|
CA1
|
carbonic anhydrase 1 |
| arTal_v1_Chr3_-_198664_198664 | 4.77 |
AT3G01500.3
|
CA1
|
carbonic anhydrase 1 |
| arTal_v1_Chr4_-_17777445_17777445 | 4.73 |
AT4G37800.1
|
XTH7
|
xyloglucan endotransglucosylase/hydrolase 7 |
| arTal_v1_Chr5_-_9082384_9082384 | 4.72 |
AT5G26000.1
AT5G26000.2 |
TGG1
|
thioglucoside glucohydrolase 1 |
| arTal_v1_Chr3_-_197564_197564 | 4.67 |
AT3G01500.4
|
CA1
|
carbonic anhydrase 1 |
| arTal_v1_Chr1_-_4682309_4682382 | 4.63 |
AT1G13650.3
AT1G13650.4 AT1G13650.2 AT1G13650.1 |
AT1G13650
|
hypothetical protein |
| arTal_v1_Chr1_-_4090857_4090857 | 4.58 |
AT1G12090.1
|
ELP
|
extensin-like protein |
| arTal_v1_Chr5_-_19648362_19648362 | 4.49 |
AT5G48490.1
|
AT5G48490
|
Bifunctional inhibitor/lipid-transfer protein/seed storage 2S albumin superfamily protein |
| arTal_v1_Chr5_+_8863224_8863224 | 4.38 |
AT5G25460.1
|
DGR2
|
transmembrane protein, putative (Protein of unknown function, DUF642) |
| arTal_v1_Chr4_+_13391293_13391344 | 4.32 |
AT4G26530.2
AT4G26530.1 |
FBA5
|
Aldolase superfamily protein |
| arTal_v1_Chr3_+_5556710_5556710 | 4.28 |
AT3G16370.1
|
AT3G16370
|
GDSL-like Lipase/Acylhydrolase superfamily protein |
| arTal_v1_Chr5_+_4757856_4757972 | 4.23 |
AT5G14740.3
AT5G14740.6 AT5G14740.1 AT5G14740.7 AT5G14740.8 AT5G14740.2 AT5G14740.4 AT5G14740.5 |
CA2
|
carbonic anhydrase 2 |
| arTal_v1_Chr5_+_26298728_26298728 | 4.21 |
AT5G65730.1
|
XTH6
|
xyloglucan endotransglucosylase/hydrolase 6 |
| arTal_v1_Chr5_+_17712203_17712203 | 4.19 |
AT5G44020.1
|
AT5G44020
|
HAD superfamily, subfamily IIIB acid phosphatase |
| arTal_v1_Chr4_+_13390754_13390754 | 4.06 |
AT4G26530.3
|
FBA5
|
Aldolase superfamily protein |
| arTal_v1_Chr1_+_10375754_10375754 | 4.04 |
AT1G29670.1
|
AT1G29670
|
GDSL-like Lipase/Acylhydrolase superfamily protein |
| arTal_v1_Chr2_-_17648945_17649062 | 4.01 |
AT2G42380.1
AT2G42380.4 AT2G42380.3 AT2G42380.2 AT2G42380.5 |
BZIP34
|
Basic-leucine zipper (bZIP) transcription factor family protein |
| arTal_v1_Chr5_-_25343369_25343369 | 4.00 |
AT5G63180.1
|
AT5G63180
|
Pectin lyase-like superfamily protein |
| arTal_v1_Chr1_+_10375599_10375599 | 3.98 |
AT1G29670.2
|
AT1G29670
|
GDSL-like Lipase/Acylhydrolase superfamily protein |
| arTal_v1_Chr1_+_28053030_28053030 | 3.91 |
AT1G74670.1
|
GASA6
|
Gibberellin-regulated family protein |
| arTal_v1_Chr3_-_21523375_21523518 | 3.89 |
AT3G58120.2
AT3G58120.1 |
BZIP61
|
Basic-leucine zipper (bZIP) transcription factor family protein |
| arTal_v1_Chr4_+_18291218_18291218 | 3.88 |
AT4G39330.1
AT4G39330.2 |
CAD9
|
cinnamyl alcohol dehydrogenase 9 |
| arTal_v1_Chr1_+_27338034_27338062 | 3.88 |
AT1G72600.2
AT1G72600.1 |
AT1G72600
|
hydroxyproline-rich glycoprotein family protein |
| arTal_v1_Chr3_-_5508414_5508414 | 3.87 |
AT3G16250.1
|
PnsB3
|
NDH-dependent cyclic electron flow 1 |
| arTal_v1_Chr1_-_10475969_10475969 | 3.85 |
AT1G29920.1
|
CAB2
|
chlorophyll A/B-binding protein 2 |
| arTal_v1_Chr3_+_17228642_17228642 | 3.82 |
AT3G46780.1
|
PTAC16
|
plastid transcriptionally active 16 |
| arTal_v1_Chr2_+_2763449_2763513 | 3.79 |
AT2G06850.1
AT2G06850.2 |
XTH4
|
xyloglucan endotransglucosylase/hydrolase 4 |
| arTal_v1_Chr1_+_10371675_10371675 | 3.79 |
AT1G29660.1
|
AT1G29660
|
GDSL-like Lipase/Acylhydrolase superfamily protein |
| arTal_v1_Chr5_+_4758921_4758921 | 3.75 |
AT5G14740.9
|
CA2
|
carbonic anhydrase 2 |
| arTal_v1_Chr5_+_17760865_17760865 | 3.75 |
AT5G44130.1
|
FLA13
|
FASCICLIN-like arabinogalactan protein 13 precursor |
| arTal_v1_Chr3_-_16448844_16448844 | 3.71 |
AT3G44990.1
|
XTH31
|
xyloglucan endo-transglycosylase-related 8 |
| arTal_v1_Chr3_+_1695156_1695156 | 3.70 |
AT3G05730.1
|
AT3G05730
|
defensin-like protein |
| arTal_v1_Chr3_-_11013451_11013451 | 3.70 |
AT3G29030.1
|
EXPA5
|
expansin A5 |
| arTal_v1_Chr2_+_9844134_9844230 | 3.70 |
AT2G23130.1
AT2G23130.2 |
AGP17
|
arabinogalactan protein 17 |
| arTal_v1_Chr4_-_7493080_7493080 | 3.69 |
AT4G12730.1
|
FLA2
|
FASCICLIN-like arabinogalactan 2 |
| arTal_v1_Chr2_-_11717432_11717437 | 3.65 |
AT2G27385.3
AT2G27385.2 AT2G27385.1 |
AT2G27385
|
Pollen Ole e 1 allergen and extensin family protein |
| arTal_v1_Chr1_+_3008910_3008910 | 3.59 |
AT1G09310.1
|
AT1G09310
|
plant/protein (Protein of unknown function, DUF538) |
| arTal_v1_Chr1_-_10473502_10473502 | 3.59 |
AT1G29910.1
|
CAB3
|
chlorophyll A/B binding protein 3 |
| arTal_v1_Chr5_+_22038165_22038165 | 3.58 |
AT5G54270.1
|
LHCB3
|
light-harvesting chlorophyll B-binding protein 3 |
| arTal_v1_Chr2_+_2199151_2199151 | 3.55 |
AT2G05790.1
|
AT2G05790
|
O-Glycosyl hydrolases family 17 protein |
| arTal_v1_Chr3_+_5681380_5681380 | 3.52 |
AT3G16670.1
|
AT3G16670
|
Pollen Ole e 1 allergen and extensin family protein |
| arTal_v1_Chr1_-_20648891_20648891 | 3.52 |
AT1G55330.1
|
AGP21
|
arabinogalactan protein 21 |
| arTal_v1_Chr4_-_5779462_5779572 | 3.47 |
AT4G09010.1
AT4G09010.2 AT4G09010.3 |
TL29
|
ascorbate peroxidase 4 |
| arTal_v1_Chr1_-_59215_59215 | 3.42 |
AT1G01120.1
|
KCS1
|
3-ketoacyl-CoA synthase 1 |
| arTal_v1_Chr3_+_18046144_18046144 | 3.41 |
AT3G48720.1
|
DCF
|
HXXXD-type acyl-transferase family protein |
| arTal_v1_Chr4_+_2449434_2449434 | 3.40 |
AT4G04840.1
|
MSRB6
|
methionine sulfoxide reductase B6 |
| arTal_v1_Chr3_-_4008018_4008018 | 3.40 |
AT3G12610.1
|
DRT100
|
Leucine-rich repeat (LRR) family protein |
| arTal_v1_Chr5_+_4087689_4087689 | 3.33 |
AT5G12940.1
|
AT5G12940
|
Leucine-rich repeat (LRR) family protein |
| arTal_v1_Chr1_+_20614573_20614610 | 3.33 |
AT1G55260.1
AT1G55260.2 |
AT1G55260
|
Bifunctional inhibitor/lipid-transfer protein/seed storage 2S albumin superfamily protein |
| arTal_v1_Chr5_+_26767599_26767599 | 3.31 |
AT5G67070.1
|
RALFL34
|
ralf-like 34 |
| arTal_v1_Chr4_+_6100714_6100714 | 3.29 |
AT4G09650.1
|
ATPD
|
F-type H+-transporting ATPase subunit delta |
| arTal_v1_Chr2_+_8940833_8940833 | 3.29 |
AT2G20750.2
AT2G20750.1 |
EXPB1
|
expansin B1 |
| arTal_v1_Chr3_+_23266227_23266227 | 3.26 |
AT3G62950.1
|
AT3G62950
|
Thioredoxin superfamily protein |
| arTal_v1_Chr3_-_19139423_19139423 | 3.25 |
AT3G51600.1
|
LTP5
|
lipid transfer protein 5 |
| arTal_v1_Chr5_-_14562863_14562863 | 3.25 |
AT5G36910.1
|
THI2.2
|
thionin 2.2 |
| arTal_v1_Chr1_-_6999839_6999839 | 3.25 |
AT1G20190.1
|
EXPA11
|
expansin 11 |
| arTal_v1_Chr5_+_18634041_18634041 | 3.25 |
AT5G45950.1
|
AT5G45950
|
GDSL-like Lipase/Acylhydrolase superfamily protein |
| arTal_v1_Chr2_-_15474717_15474828 | 3.22 |
AT2G36870.2
AT2G36870.1 |
XTH32
|
xyloglucan endotransglucosylase/hydrolase 32 |
| arTal_v1_Chr5_-_18026077_18026077 | 3.22 |
AT5G44680.1
|
AT5G44680
|
DNA glycosylase superfamily protein |
| arTal_v1_Chr1_-_7043392_7043392 | 3.21 |
AT1G20340.1
|
DRT112
|
Cupredoxin superfamily protein |
| arTal_v1_Chr1_-_1043887_1043887 | 3.20 |
AT1G04040.1
|
AT1G04040
|
HAD superfamily, subfamily IIIB acid phosphatase |
| arTal_v1_Chr1_+_16127353_16127353 | 3.20 |
AT1G42970.1
|
GAPB
|
glyceraldehyde-3-phosphate dehydrogenase B subunit |
| arTal_v1_Chr1_+_20447157_20447208 | 3.18 |
AT1G54820.1
AT1G54820.2 AT1G54820.3 AT1G54820.4 |
AT1G54820
|
Protein kinase superfamily protein |
| arTal_v1_Chr4_+_11334352_11334402 | 3.18 |
AT4G21280.1
AT4G21280.2 |
PSBQA
|
photosystem II subunit QA |
| arTal_v1_Chr5_+_5237970_5238178 | 3.17 |
AT5G16030.1
AT5G16030.4 AT5G16030.2 AT5G16030.3 |
AT5G16030
|
mental retardation GTPase activating protein |
| arTal_v1_Chr1_+_26141726_26141836 | 3.16 |
AT1G69530.2
AT1G69530.1 AT1G69530.3 AT1G69530.5 AT1G69530.4 |
EXPA1
|
expansin A1 |
| arTal_v1_Chr5_-_5801_5907 | 3.14 |
AT5G01015.2
AT5G01015.1 |
AT5G01015
|
transmembrane protein |
| arTal_v1_Chr4_+_16022269_16022368 | 3.13 |
AT4G33220.1
AT4G33220.2 |
PME44
|
pectin methylesterase 44 |
| arTal_v1_Chr4_+_12660687_12660687 | 3.13 |
AT4G24510.1
|
CER2
|
HXXXD-type acyl-transferase family protein |
| arTal_v1_Chr3_-_4744263_4744263 | 3.13 |
AT3G14240.1
|
AT3G14240
|
Subtilase family protein |
| arTal_v1_Chr5_+_5983683_5983683 | 3.11 |
AT5G18080.1
|
SAUR24
|
SAUR-like auxin-responsive protein family |
| arTal_v1_Chr5_-_25898171_25898171 | 3.10 |
AT5G64770.1
|
RGF9
|
root meristem growth factor |
| arTal_v1_Chr1_-_26711462_26711587 | 3.09 |
AT1G70830.4
AT1G70830.2 AT1G70830.1 AT1G70830.5 AT1G70830.3 |
MLP28
|
MLP-like protein 28 |
| arTal_v1_Chr1_-_8183570_8183650 | 3.08 |
AT1G23080.2
AT1G23080.3 AT1G23080.4 AT1G23080.1 |
PIN7
|
Auxin efflux carrier family protein |
| arTal_v1_Chr1_-_983544_983544 | 3.07 |
AT1G03870.1
|
FLA9
|
FASCICLIN-like arabinoogalactan 9 |
| arTal_v1_Chr2_+_18626188_18626188 | 3.07 |
AT2G45180.1
|
AT2G45180
|
Bifunctional inhibitor/lipid-transfer protein/seed storage 2S albumin superfamily protein |
| arTal_v1_Chr2_+_15059763_15059763 | 3.07 |
AT2G35860.1
|
FLA16
|
FASCICLIN-like arabinogalactan protein 16 precursor |
| arTal_v1_Chr4_-_69884_69957 | 3.07 |
AT4G00165.2
AT4G00165.1 |
AT4G00165
|
Bifunctional inhibitor/lipid-transfer protein/seed storage 2S albumin superfamily protein |
| arTal_v1_Chr3_-_1860797_1860797 | 3.06 |
AT3G06145.1
|
AT3G06145
|
RING zinc finger protein |
| arTal_v1_Chr1_+_907523_907651 | 3.06 |
AT1G03630.1
AT1G03630.2 |
POR C
|
protochlorophyllide oxidoreductase C |
| arTal_v1_Chr2_-_9428170_9428170 | 3.06 |
AT2G22170.1
|
PLAT2
|
Lipase/lipooxygenase, PLAT/LH2 family protein |
| arTal_v1_Chr5_-_22560461_22560541 | 3.04 |
AT5G55730.2
AT5G55730.1 |
FLA1
|
FASCICLIN-like arabinogalactan 1 |
| arTal_v1_Chr1_+_26687202_26687202 | 3.04 |
AT1G70760.1
|
NdhL
|
inorganic carbon transport protein-like protein |
| arTal_v1_Chr5_-_4171954_4171954 | 3.04 |
AT5G13140.1
|
AT5G13140
|
Pollen Ole e 1 allergen and extensin family protein |
| arTal_v1_Chr1_-_4530222_4530222 | 3.02 |
AT1G13250.1
|
GATL3
|
galacturonosyltransferase-like 3 |
| arTal_v1_Chr2_-_12433796_12433796 | 3.02 |
AT2G28950.1
|
EXPA6
|
expansin A6 |
| arTal_v1_Chr1_-_6999523_6999523 | 2.99 |
AT1G20190.2
|
EXPA11
|
expansin 11 |
| arTal_v1_Chr5_+_7502427_7502427 | 2.98 |
AT5G22580.1
|
AT5G22580
|
Stress responsive A/B Barrel Domain-containing protein |
| arTal_v1_Chr2_+_19243348_19243427 | 2.98 |
AT2G46820.1
AT2G46820.2 |
PSI-P
|
photosystem I P subunit |
| arTal_v1_Chr5_-_25373904_25373904 | 2.95 |
AT5G63310.1
|
NDPK2
|
nucleoside diphosphate kinase 2 |
| arTal_v1_Chr4_+_17243583_17243583 | 2.94 |
AT4G36540.2
AT4G36540.1 |
BEE2
|
BR enhanced expression 2 |
| arTal_v1_Chr5_-_8707885_8707885 | 2.91 |
AT5G25190.1
|
ESE3
|
Integrase-type DNA-binding superfamily protein |
| arTal_v1_Chr1_+_898480_898480 | 2.90 |
AT1G03600.1
|
PSB27
|
photosystem II family protein |
| arTal_v1_Chr4_+_493546_493548 | 2.90 |
AT4G01150.1
AT4G01150.2 |
AT4G01150
|
CURVATURE THYLAKOID 1A-like protein |
| arTal_v1_Chr3_+_6180621_6180621 | 2.87 |
AT3G18050.1
|
AT3G18050
|
GPI-anchored protein |
| arTal_v1_Chr5_-_8338032_8338032 | 2.87 |
AT5G24420.1
|
PGL5
|
6-phosphogluconolactonase 5 |
| arTal_v1_Chr3_+_17949416_17949416 | 2.87 |
AT3G48460.1
|
AT3G48460
|
GDSL-like Lipase/Acylhydrolase superfamily protein |
| arTal_v1_Chr2_+_14384797_14384797 | 2.85 |
AT2G34060.1
|
AT2G34060
|
Peroxidase superfamily protein |
| arTal_v1_Chr3_-_8589754_8589754 | 2.85 |
AT3G23810.1
|
SAHH2
|
S-adenosyl-l-homocysteine (SAH) hydrolase 2 |
| arTal_v1_Chr1_+_9740508_9740508 | 2.84 |
AT1G27950.1
|
LTPG1
|
glycosylphosphatidylinositol-anchored lipid protein transfer 1 |
| arTal_v1_Chr5_-_8916856_8916856 | 2.84 |
AT5G25610.1
|
RD22
|
BURP domain-containing protein |
| arTal_v1_Chr2_-_11727654_11727654 | 2.84 |
AT2G27420.1
|
AT2G27420
|
Cysteine proteinases superfamily protein |
| arTal_v1_Chr3_-_6882235_6882315 | 2.84 |
AT3G19820.3
AT3G19820.1 AT3G19820.2 |
DWF1
|
cell elongation protein / DWARF1 / DIMINUTO (DIM) |
| arTal_v1_Chr4_+_16397995_16397995 | 2.84 |
AT4G34260.1
|
FUC95A
|
1,2-alpha-L-fucosidase |
| arTal_v1_Chr3_+_23345754_23345754 | 2.80 |
AT3G63200.1
|
PLP9
|
PATATIN-like protein 9 |
| arTal_v1_Chr4_-_17606924_17607050 | 2.79 |
AT4G37450.1
AT4G37450.2 |
AGP18
|
arabinogalactan protein 18 |
| arTal_v1_Chr1_+_5058583_5058680 | 2.79 |
AT1G14700.4
AT1G14700.1 AT1G14700.3 AT1G14700.2 |
PAP3
|
purple acid phosphatase 3 |
| arTal_v1_Chr5_-_17581275_17581275 | 2.78 |
AT5G43750.1
|
PnsB5
|
NAD(P)H dehydrogenase 18 |
| arTal_v1_Chr4_-_12772438_12772479 | 2.78 |
AT4G24780.1
AT4G24780.2 |
AT4G24780
|
Pectin lyase-like superfamily protein |
| arTal_v1_Chr2_-_15137012_15137012 | 2.78 |
AT2G36050.1
|
OFP15
|
ovate family protein 15 |
| arTal_v1_Chr5_+_5238502_5238502 | 2.77 |
AT5G16030.5
|
AT5G16030
|
mental retardation GTPase activating protein |
| arTal_v1_Chr1_+_2097106_2097106 | 2.74 |
AT1G06830.1
|
AT1G06830
|
Glutaredoxin family protein |
| arTal_v1_Chr3_-_5469594_5469594 | 2.72 |
AT3G16140.1
|
PSAH-1
|
photosystem I subunit H-1 |
| arTal_v1_Chr1_+_17918207_17918207 | 2.71 |
AT1G48480.1
|
RKL1
|
receptor-like kinase 1 |
| arTal_v1_Chr4_+_14215473_14215473 | 2.70 |
AT4G28780.1
|
AT4G28780
|
GDSL-like Lipase/Acylhydrolase superfamily protein |
| arTal_v1_Chr2_-_15790139_15790139 | 2.69 |
AT2G37640.1
|
EXP3
|
Barwin-like endoglucanases superfamily protein |
| arTal_v1_Chr4_+_620691_620697 | 2.69 |
AT4G01460.1
AT4G01460.2 |
AT4G01460
|
basic helix-loop-helix (bHLH) DNA-binding superfamily protein |
| arTal_v1_Chr3_+_3479673_3479673 | 2.69 |
AT3G11110.1
|
AT3G11110
|
RING/U-box superfamily protein |
| arTal_v1_Chr5_-_23576084_23576084 | 2.68 |
AT5G58310.1
|
MES18
|
methyl esterase 18 |
| arTal_v1_Chr2_-_15483706_15483788 | 2.68 |
AT2G36885.2
AT2G36885.1 |
AT2G36885
|
translation initiation factor |
| arTal_v1_Chr1_+_3664187_3664187 | 2.67 |
AT1G10960.1
|
FD1
|
ferredoxin 1 |
| arTal_v1_Chr2_-_15789605_15789605 | 2.67 |
AT2G37640.2
|
EXP3
|
Barwin-like endoglucanases superfamily protein |
| arTal_v1_Chr1_+_4899045_4899045 | 2.66 |
AT1G14345.1
|
AT1G14345
|
NAD(P)-linked oxidoreductase superfamily protein |
| arTal_v1_Chr4_+_14149849_14149880 | 2.66 |
AT4G28660.1
AT4G28660.2 |
PSB28
|
photosystem II reaction center PSB28 protein |
| arTal_v1_Chr4_-_16583075_16583075 | 2.65 |
AT4G34760.1
|
AT4G34760
|
SAUR-like auxin-responsive protein family |
| arTal_v1_Chr4_-_12822497_12822497 | 2.65 |
AT4G24930.1
|
AT4G24930
|
thylakoid lumenal 17.9 kDa protein, chloroplast |
| arTal_v1_Chr1_-_28554810_28554930 | 2.65 |
AT1G76100.1
AT1G76100.2 |
PETE1
|
plastocyanin 1 |
| arTal_v1_Chr4_-_12768239_12768239 | 2.65 |
AT4G24770.1
|
RBP31
|
31-kDa RNA binding protein |
| arTal_v1_Chr3_-_2334185_2334185 | 2.64 |
AT3G07320.1
|
AT3G07320
|
O-Glycosyl hydrolases family 17 protein |
| arTal_v1_Chr5_+_7222179_7222226 | 2.64 |
AT5G21430.1
AT5G21430.2 |
NdhU
|
Chaperone DnaJ-domain superfamily protein |
| arTal_v1_Chr1_+_7886323_7886323 | 2.64 |
AT1G22330.1
|
AT1G22330
|
RNA-binding (RRM/RBD/RNP motifs) family protein |
| arTal_v1_Chr4_-_12769419_12769419 | 2.63 |
AT4G24770.2
|
RBP31
|
31-kDa RNA binding protein |
| arTal_v1_Chr3_+_3698658_3698658 | 2.61 |
AT3G11700.1
|
FLA18
|
FASCICLIN-like arabinogalactan protein 18 precursor |
| arTal_v1_Chr1_+_16871696_16871696 | 2.61 |
AT1G44575.2
|
NPQ4
|
Chlorophyll A-B binding family protein |
| arTal_v1_Chr3_-_19595834_19595834 | 2.60 |
AT3G52870.1
|
AT3G52870
|
IQ calmodulin-binding motif family protein |
| arTal_v1_Chr5_+_2680401_2680401 | 2.60 |
AT5G08330.1
|
TCP11
|
TCP family transcription factor |
| arTal_v1_Chr1_-_25758232_25758232 | 2.60 |
AT1G68590.2
|
PSRP3/1
|
Ribosomal protein PSRP-3/Ycf65 |
| arTal_v1_Chr1_+_16871511_16871511 | 2.60 |
AT1G44575.3
|
NPQ4
|
Chlorophyll A-B binding family protein |
| arTal_v1_Chr5_-_26453199_26453199 | 2.60 |
AT5G66190.2
AT5G66190.1 |
FNR1
|
ferredoxin-NADP[+]-oxidoreductase 1 |
| arTal_v1_Chr1_+_12267808_12267808 | 2.60 |
AT1G33811.1
|
AT1G33811
|
GDSL-like Lipase/Acylhydrolase superfamily protein |
| arTal_v1_Chr5_+_22530007_22530007 | 2.60 |
AT5G55620.1
|
AT5G55620
|
hypothetical protein |
| arTal_v1_Chr5_+_4944816_4944816 | 2.59 |
AT5G15230.1
|
GASA4
|
GAST1 protein homolog 4 |
| arTal_v1_Chr2_+_1676999_1676999 | 2.59 |
AT2G04780.2
|
FLA7
|
FASCICLIN-like arabinoogalactan 7 |
| arTal_v1_Chr3_+_17929581_17929581 | 2.59 |
AT3G48420.1
|
AT3G48420
|
Haloacid dehalogenase-like hydrolase (HAD) superfamily protein |
| arTal_v1_Chr1_-_6940832_6940832 | 2.59 |
AT1G20010.1
|
TUB5
|
tubulin beta-5 chain |
| arTal_v1_Chr1_+_22444307_22444307 | 2.59 |
AT1G60950.1
|
FED A
|
2Fe-2S ferredoxin-like superfamily protein |
| arTal_v1_Chr1_-_28603932_28603932 | 2.58 |
AT1G76240.1
|
AT1G76240
|
DUF241 domain protein (DUF241) |
| arTal_v1_Chr1_+_25401514_25401514 | 2.58 |
AT1G67750.1
|
AT1G67750
|
Pectate lyase family protein |
| arTal_v1_Chr1_-_25758411_25758411 | 2.58 |
AT1G68590.1
|
PSRP3/1
|
Ribosomal protein PSRP-3/Ycf65 |
| arTal_v1_Chr1_+_16870221_16870221 | 2.58 |
AT1G44575.1
|
NPQ4
|
Chlorophyll A-B binding family protein |
| arTal_v1_Chr1_+_7252111_7252111 | 2.58 |
AT1G20850.1
|
XCP2
|
xylem cysteine peptidase 2 |
| arTal_v1_Chr1_-_84864_84946 | 2.57 |
AT1G01190.1
AT1G01190.2 |
CYP78A8
|
cytochrome P450, family 78, subfamily A, polypeptide 8 |
| arTal_v1_Chr3_+_8586359_8586359 | 2.56 |
AT3G23805.1
|
RALFL24
|
ralf-like 24 |
| arTal_v1_Chr3_+_18262290_18262511 | 2.56 |
AT3G49260.1
AT3G49260.3 AT3G49260.2 AT3G49260.4 |
iqd21
|
IQ-domain 21 |
| arTal_v1_Chr1_-_21614169_21614169 | 2.56 |
AT1G58270.1
|
ZW9
|
TRAF-like family protein |
| arTal_v1_Chr4_-_15059846_15059846 | 2.55 |
AT4G30950.1
|
FAD6
|
fatty acid desaturase 6 |
| arTal_v1_Chr1_-_26515188_26515255 | 2.55 |
AT1G70370.2
AT1G70370.1 |
PG2
|
polygalacturonase 2 |
| arTal_v1_Chr1_-_19052582_19052582 | 2.55 |
AT1G51400.1
|
AT1G51400
|
Photosystem II 5 kD protein |
| arTal_v1_Chr1_-_4265156_4265156 | 2.55 |
AT1G12500.1
|
AT1G12500
|
Nucleotide-sugar transporter family protein |
| arTal_v1_Chr4_+_14517393_14517393 | 2.55 |
AT4G29610.1
|
AT4G29610
|
Cytidine/deoxycytidylate deaminase family protein |
| arTal_v1_Chr4_+_9556783_9556783 | 2.55 |
AT4G16980.1
|
AT4G16980
|
arabinogalactan-protein family |
| arTal_v1_Chr2_+_18286321_18286321 | 2.55 |
AT2G44230.1
|
AT2G44230
|
hypothetical protein (DUF946) |
| arTal_v1_Chr4_-_13398307_13398307 | 2.55 |
AT4G26540.1
|
AT4G26540
|
Leucine-rich repeat receptor-like protein kinase family protein |
| arTal_v1_Chr2_-_12173951_12173991 | 2.54 |
AT2G28470.2
AT2G28470.4 AT2G28470.1 AT2G28470.3 |
BGAL8
|
beta-galactosidase 8 |
| arTal_v1_Chr3_-_3277930_3277930 | 2.54 |
AT3G10520.1
|
HB2
|
hemoglobin 2 |
| arTal_v1_Chr4_-_18428412_18428578 | 2.54 |
AT4G39710.2
AT4G39710.3 AT4G39710.1 |
PnsL4
|
FK506-binding protein 16-2 |
| arTal_v1_Chr3_+_10017321_10017321 | 2.54 |
AT3G27160.1
AT3G27160.2 |
GHS1
|
Ribosomal protein S21 family protein |
| arTal_v1_Chr5_-_20712386_20712473 | 2.54 |
AT5G50915.4
AT5G50915.2 AT5G50915.1 AT5G50915.3 |
AT5G50915
|
basic helix-loop-helix (bHLH) DNA-binding superfamily protein |
| arTal_v1_Chr2_+_1676717_1676717 | 2.53 |
AT2G04780.1
|
FLA7
|
FASCICLIN-like arabinoogalactan 7 |
| arTal_v1_Chr5_+_17937622_17937622 | 2.52 |
AT5G44530.3
AT5G44530.2 AT5G44530.1 |
AT5G44530
|
Subtilase family protein |
| arTal_v1_Chr5_+_19825078_19825078 | 2.52 |
AT5G48900.1
|
AT5G48900
|
Pectin lyase-like superfamily protein |
| arTal_v1_Chr3_-_17495033_17495033 | 2.51 |
AT3G47470.1
|
LHCA4
|
light-harvesting chlorophyll-protein complex I subunit A4 |
| arTal_v1_Chr4_+_12876822_12876948 | 2.50 |
AT4G25080.6
AT4G25080.5 AT4G25080.2 AT4G25080.1 AT4G25080.3 AT4G25080.4 |
CHLM
|
magnesium-protoporphyrin IX methyltransferase |
| arTal_v1_Chr5_-_18371021_18371021 | 2.50 |
AT5G45340.2
AT5G45340.1 |
CYP707A3
|
cytochrome P450, family 707, subfamily A, polypeptide 3 |
| arTal_v1_Chr3_+_22902491_22902638 | 2.50 |
AT3G61870.1
AT3G61870.2 |
AT3G61870
|
plant/protein |
| arTal_v1_Chr3_+_188321_188384 | 2.48 |
AT3G01480.1
AT3G01480.2 |
CYP38
|
cyclophilin 38 |
| arTal_v1_Chr3_-_7796310_7796460 | 2.48 |
AT3G22120.1
AT3G22120.2 |
CWLP
|
cell wall-plasma membrane linker protein |
| arTal_v1_Chr2_+_19191247_19191247 | 2.48 |
AT2G46710.1
|
ROPGAP3
|
Rho GTPase activating protein with PAK-box/P21-Rho-binding domain-containing protein |
| arTal_v1_Chr1_+_4868346_4868346 | 2.48 |
AT1G14250.1
|
AT1G14250
|
GDA1/CD39 nucleoside phosphatase family protein |
| arTal_v1_Chr2_+_10241875_10241875 | 2.48 |
AT2G24090.1
|
PRPL35
|
Ribosomal protein L35 |
| arTal_v1_Chr1_-_15607966_15607966 | 2.47 |
AT1G41830.1
|
SKS6
|
SKU5-similar 6 |
| arTal_v1_Chr4_+_12870006_12870008 | 2.46 |
AT4G25050.2
AT4G25050.1 |
ACP4
|
acyl carrier protein 4 |
| arTal_v1_Chr4_-_7591259_7591259 | 2.46 |
AT4G12980.1
|
AT4G12980
|
Auxin-responsive family protein |
| arTal_v1_Chr5_+_152446_152446 | 2.46 |
AT5G01370.1
|
ACI1
|
ALC-interacting protein 1 |
| arTal_v1_Chr5_+_24494291_24494291 | 2.45 |
AT5G60890.1
|
MYB34
|
myb domain protein 34 |
| arTal_v1_Chr3_-_19467455_19467455 | 2.45 |
AT3G52500.1
|
AT3G52500
|
Eukaryotic aspartyl protease family protein |
| arTal_v1_Chr3_+_2563803_2563803 | 2.45 |
AT3G08030.1
|
AT3G08030
|
DNA-directed RNA polymerase subunit beta (Protein of unknown function, DUF642) |
| arTal_v1_Chr1_-_23137254_23137254 | 2.45 |
AT1G62510.1
|
AT1G62510
|
Bifunctional inhibitor/lipid-transfer protein/seed storage 2S albumin superfamily protein |
| arTal_v1_Chr1_+_19052193_19052193 | 2.43 |
AT1G51402.1
|
AT1G51402
|
hypothetical protein |
| arTal_v1_Chr1_-_464981_464981 | 2.43 |
AT1G02335.1
|
GL22
|
germin-like protein subfamily 2 member 2 precursor |
| arTal_v1_Chr1_+_23911024_23911024 | 2.43 |
AT1G64390.1
|
GH9C2
|
glycosyl hydrolase 9C2 |
| arTal_v1_Chr3_-_23165387_23165387 | 2.42 |
AT3G62630.1
|
AT3G62630
|
stress response NST1-like protein (DUF1645) |
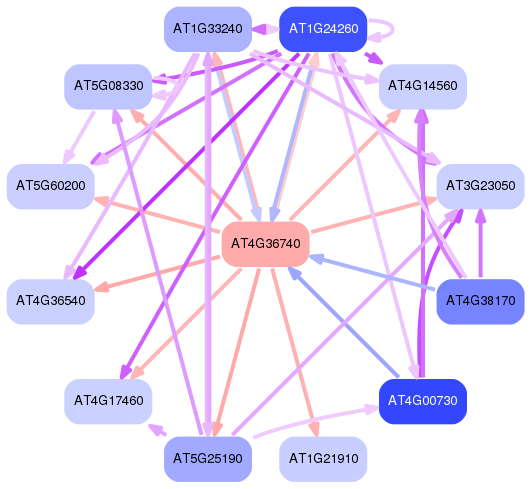
Network of associatons between targets according to the STRING database.

First level regulatory network of AT4G36740
Gene Ontology Analysis
Gene overrepresentation in biological process category:
| Log-likelihood per target | Total log-likelihood | Term | Description |
|---|---|---|---|
| 2.1 | 26.9 | GO:2000122 | negative regulation of stomatal complex development(GO:2000122) |
| 1.9 | 11.2 | GO:0009769 | photosynthesis, light harvesting in photosystem II(GO:0009769) |
| 1.6 | 4.8 | GO:0045876 | positive regulation of sister chromatid cohesion(GO:0045876) |
| 1.5 | 28.7 | GO:0006949 | syncytium formation(GO:0006949) |
| 1.4 | 4.1 | GO:0046166 | glyceraldehyde-3-phosphate biosynthetic process(GO:0046166) |
| 1.4 | 5.5 | GO:0080170 | hydrogen peroxide transmembrane transport(GO:0080170) |
| 1.3 | 6.4 | GO:1903175 | fatty alcohol biosynthetic process(GO:1903175) |
| 1.3 | 2.6 | GO:0010623 | programmed cell death involved in cell development(GO:0010623) |
| 1.3 | 2.5 | GO:0015669 | gas transport(GO:0015669) |
| 1.2 | 1.2 | GO:0010268 | brassinosteroid homeostasis(GO:0010268) |
| 1.1 | 3.3 | GO:0006436 | tryptophanyl-tRNA aminoacylation(GO:0006436) |
| 1.1 | 3.2 | GO:1900033 | regulation of trichome patterning(GO:1900032) negative regulation of trichome patterning(GO:1900033) |
| 1.1 | 1.1 | GO:0060919 | auxin influx(GO:0060919) |
| 1.0 | 3.1 | GO:0006428 | isoleucyl-tRNA aminoacylation(GO:0006428) |
| 1.0 | 3.1 | GO:0080051 | cutin transport(GO:0080051) |
| 1.0 | 7.0 | GO:0009772 | photosynthetic electron transport in photosystem II(GO:0009772) |
| 0.9 | 8.3 | GO:0043096 | adenine salvage(GO:0006168) purine nucleobase salvage(GO:0043096) |
| 0.9 | 6.5 | GO:0010067 | procambium histogenesis(GO:0010067) |
| 0.9 | 2.8 | GO:1903890 | positive regulation of trichoblast fate specification(GO:0010063) positive regulation of cell fate specification(GO:0042660) positive regulation of plant epidermal cell differentiation(GO:1903890) |
| 0.9 | 6.5 | GO:0043446 | cellular alkane metabolic process(GO:0043446) |
| 0.9 | 3.7 | GO:0090309 | regulation of methylation-dependent chromatin silencing(GO:0090308) positive regulation of methylation-dependent chromatin silencing(GO:0090309) |
| 0.9 | 2.7 | GO:0010028 | xanthophyll cycle(GO:0010028) |
| 0.9 | 2.6 | GO:0010541 | acropetal auxin transport(GO:0010541) |
| 0.9 | 5.1 | GO:0031116 | positive regulation of microtubule polymerization(GO:0031116) |
| 0.8 | 3.3 | GO:0010480 | microsporocyte differentiation(GO:0010480) |
| 0.8 | 17.6 | GO:0042044 | water transport(GO:0006833) fluid transport(GO:0042044) |
| 0.8 | 6.4 | GO:0009643 | photosynthetic acclimation(GO:0009643) |
| 0.8 | 4.8 | GO:0010258 | NADH dehydrogenase complex (plastoquinone) assembly(GO:0010258) |
| 0.8 | 2.4 | GO:0044208 | 'de novo' AMP biosynthetic process(GO:0044208) |
| 0.8 | 8.5 | GO:0045492 | xylan biosynthetic process(GO:0045492) |
| 0.8 | 12.1 | GO:0009768 | photosynthesis, light harvesting in photosystem I(GO:0009768) |
| 0.8 | 8.3 | GO:0010196 | nonphotochemical quenching(GO:0010196) energy quenching(GO:1990066) |
| 0.8 | 2.3 | GO:0009233 | menaquinone metabolic process(GO:0009233) menaquinone biosynthetic process(GO:0009234) |
| 0.8 | 5.3 | GO:0043489 | RNA stabilization(GO:0043489) |
| 0.7 | 25.4 | GO:0010025 | wax biosynthetic process(GO:0010025) |
| 0.7 | 7.4 | GO:0015976 | carbon utilization(GO:0015976) |
| 0.7 | 4.4 | GO:0070981 | L-asparagine biosynthetic process(GO:0070981) L-asparagine metabolic process(GO:0070982) |
| 0.7 | 4.4 | GO:0010047 | fruit dehiscence(GO:0010047) |
| 0.7 | 2.2 | GO:0048759 | xylem vessel member cell differentiation(GO:0048759) |
| 0.7 | 5.7 | GO:1901959 | positive regulation of cutin biosynthetic process(GO:1901959) |
| 0.7 | 2.8 | GO:0033353 | S-adenosylmethionine cycle(GO:0033353) S-adenosylhomocysteine metabolic process(GO:0046498) |
| 0.7 | 2.1 | GO:0090058 | metaxylem development(GO:0090058) |
| 0.7 | 1.4 | GO:0015959 | diadenosine polyphosphate metabolic process(GO:0015959) diadenosine tetraphosphate metabolic process(GO:0015965) |
| 0.7 | 4.1 | GO:0009650 | UV protection(GO:0009650) |
| 0.7 | 6.1 | GO:0051513 | regulation of monopolar cell growth(GO:0051513) |
| 0.7 | 2.7 | GO:0080094 | response to trehalose-6-phosphate(GO:0080094) |
| 0.7 | 8.7 | GO:0010052 | guard cell differentiation(GO:0010052) |
| 0.7 | 6.6 | GO:0019676 | ammonia assimilation cycle(GO:0019676) |
| 0.7 | 2.0 | GO:0071457 | cellular response to ozone(GO:0071457) |
| 0.7 | 1.3 | GO:0048533 | sporocyte differentiation(GO:0048533) |
| 0.6 | 1.9 | GO:2000039 | regulation of trichome morphogenesis(GO:2000039) |
| 0.6 | 4.4 | GO:0019464 | glycine decarboxylation via glycine cleavage system(GO:0019464) |
| 0.6 | 3.1 | GO:0009807 | lignan metabolic process(GO:0009806) lignan biosynthetic process(GO:0009807) |
| 0.6 | 3.7 | GO:0009800 | cinnamic acid biosynthetic process(GO:0009800) |
| 0.6 | 3.1 | GO:0006106 | fumarate metabolic process(GO:0006106) |
| 0.6 | 6.7 | GO:0010206 | photosystem II repair(GO:0010206) |
| 0.6 | 3.0 | GO:0010424 | DNA methylation on cytosine within a CG sequence(GO:0010424) |
| 0.6 | 3.0 | GO:0009759 | indole glucosinolate biosynthetic process(GO:0009759) |
| 0.6 | 8.3 | GO:1902183 | regulation of shoot apical meristem development(GO:1902183) |
| 0.6 | 1.2 | GO:0048629 | trichome patterning(GO:0048629) |
| 0.6 | 3.5 | GO:0010236 | plastoquinone biosynthetic process(GO:0010236) |
| 0.6 | 2.9 | GO:0010683 | tricyclic triterpenoid metabolic process(GO:0010683) |
| 0.6 | 3.5 | GO:0006011 | UDP-glucose metabolic process(GO:0006011) |
| 0.6 | 0.6 | GO:0009616 | virus induced gene silencing(GO:0009616) modulation by symbiont of RNA levels in host(GO:0052018) modulation of RNA levels in other organism involved in symbiotic interaction(GO:0052249) cellular response to virus(GO:0098586) |
| 0.6 | 3.5 | GO:0006228 | UTP biosynthetic process(GO:0006228) UTP metabolic process(GO:0046051) |
| 0.6 | 6.8 | GO:0032544 | plastid translation(GO:0032544) |
| 0.6 | 2.3 | GO:0006346 | methylation-dependent chromatin silencing(GO:0006346) |
| 0.6 | 9.5 | GO:0030388 | fructose 1,6-bisphosphate metabolic process(GO:0030388) |
| 0.5 | 4.4 | GO:0009786 | regulation of asymmetric cell division(GO:0009786) |
| 0.5 | 21.9 | GO:0009767 | photosynthetic electron transport chain(GO:0009767) |
| 0.5 | 2.7 | GO:0007142 | male meiosis II(GO:0007142) |
| 0.5 | 1.6 | GO:0046156 | siroheme biosynthetic process(GO:0019354) siroheme metabolic process(GO:0046156) |
| 0.5 | 1.6 | GO:1900386 | positive regulation of flavonol biosynthetic process(GO:1900386) |
| 0.5 | 3.8 | GO:0006021 | inositol biosynthetic process(GO:0006021) |
| 0.5 | 2.2 | GO:0019586 | uronic acid metabolic process(GO:0006063) galacturonate metabolic process(GO:0019586) |
| 0.5 | 1.6 | GO:0070584 | cell part morphogenesis(GO:0032990) mitochondrion morphogenesis(GO:0070584) |
| 0.5 | 12.2 | GO:0042335 | cuticle development(GO:0042335) |
| 0.5 | 2.5 | GO:0008615 | pyridoxine biosynthetic process(GO:0008615) |
| 0.5 | 2.0 | GO:0090342 | regulation of cell aging(GO:0090342) |
| 0.5 | 2.5 | GO:0006788 | heme oxidation(GO:0006788) |
| 0.5 | 1.5 | GO:0080145 | cysteine homeostasis(GO:0080145) |
| 0.5 | 1.9 | GO:0072698 | protein localization to cytoskeleton(GO:0044380) protein localization to microtubule cytoskeleton(GO:0072698) |
| 0.5 | 2.4 | GO:0010086 | embryonic root morphogenesis(GO:0010086) |
| 0.5 | 2.4 | GO:0019218 | regulation of brassinosteroid biosynthetic process(GO:0010422) regulation of steroid metabolic process(GO:0019218) regulation of steroid biosynthetic process(GO:0050810) regulation of steroid hormone biosynthetic process(GO:0090030) |
| 0.5 | 3.3 | GO:2000601 | regulation of Arp2/3 complex-mediated actin nucleation(GO:0034315) regulation of actin nucleation(GO:0051125) positive regulation of actin nucleation(GO:0051127) positive regulation of Arp2/3 complex-mediated actin nucleation(GO:2000601) |
| 0.5 | 5.2 | GO:1901348 | positive regulation of secondary cell wall biogenesis(GO:1901348) |
| 0.5 | 0.5 | GO:0010166 | wax metabolic process(GO:0010166) |
| 0.5 | 0.9 | GO:0034969 | histone arginine methylation(GO:0034969) |
| 0.5 | 1.4 | GO:0010220 | positive regulation of vernalization response(GO:0010220) |
| 0.5 | 0.5 | GO:2000014 | regulation of endosperm development(GO:2000014) |
| 0.5 | 2.3 | GO:0051016 | barbed-end actin filament capping(GO:0051016) |
| 0.5 | 2.8 | GO:0006216 | cytidine catabolic process(GO:0006216) cytidine deamination(GO:0009972) cytidine metabolic process(GO:0046087) |
| 0.5 | 6.9 | GO:0009645 | response to low light intensity stimulus(GO:0009645) |
| 0.5 | 3.2 | GO:0080148 | negative regulation of response to water deprivation(GO:0080148) |
| 0.4 | 1.8 | GO:0031507 | heterochromatin assembly(GO:0031507) |
| 0.4 | 1.8 | GO:0006426 | glycyl-tRNA aminoacylation(GO:0006426) |
| 0.4 | 12.0 | GO:0009828 | plant-type cell wall loosening(GO:0009828) |
| 0.4 | 0.9 | GO:0035864 | response to potassium ion(GO:0035864) |
| 0.4 | 1.3 | GO:0002698 | negative regulation of immune effector process(GO:0002698) negative regulation of defense response to virus(GO:0050687) |
| 0.4 | 2.1 | GO:2001295 | malonyl-CoA biosynthetic process(GO:2001295) |
| 0.4 | 30.3 | GO:0007018 | microtubule-based movement(GO:0007018) |
| 0.4 | 0.8 | GO:0043480 | pigment accumulation in response to UV light(GO:0043478) pigment accumulation in tissues in response to UV light(GO:0043479) pigment accumulation in tissues(GO:0043480) anthocyanin accumulation in tissues in response to UV light(GO:0043481) |
| 0.4 | 3.4 | GO:0010239 | chloroplast mRNA processing(GO:0010239) |
| 0.4 | 1.2 | GO:0001578 | microtubule bundle formation(GO:0001578) |
| 0.4 | 2.1 | GO:0046713 | borate transport(GO:0046713) |
| 0.4 | 2.1 | GO:0018206 | peptidyl-methionine modification(GO:0018206) |
| 0.4 | 3.7 | GO:0030497 | fatty acid elongation(GO:0030497) |
| 0.4 | 3.3 | GO:0010190 | cytochrome b6f complex assembly(GO:0010190) |
| 0.4 | 9.8 | GO:0008544 | epidermis development(GO:0008544) epidermal cell differentiation(GO:0009913) epithelial cell differentiation(GO:0030855) |
| 0.4 | 2.4 | GO:0055129 | L-proline biosynthetic process(GO:0055129) |
| 0.4 | 2.4 | GO:2000037 | regulation of stomatal complex patterning(GO:2000037) |
| 0.4 | 11.7 | GO:0006284 | base-excision repair(GO:0006284) |
| 0.4 | 1.2 | GO:0034486 | hexose transport(GO:0008645) fructose transport(GO:0015755) vacuolar transmembrane transport(GO:0034486) |
| 0.4 | 2.4 | GO:0006013 | mannose metabolic process(GO:0006013) |
| 0.4 | 2.0 | GO:0002679 | respiratory burst involved in defense response(GO:0002679) respiratory burst(GO:0045730) |
| 0.4 | 0.8 | GO:0040019 | positive regulation of embryonic development(GO:0040019) |
| 0.4 | 0.4 | GO:0010433 | bract development(GO:0010432) bract morphogenesis(GO:0010433) bract formation(GO:0010434) |
| 0.4 | 3.9 | GO:0010439 | regulation of glucosinolate biosynthetic process(GO:0010439) |
| 0.4 | 6.5 | GO:0016998 | cell wall macromolecule catabolic process(GO:0016998) |
| 0.4 | 5.0 | GO:1901141 | regulation of lignin biosynthetic process(GO:1901141) |
| 0.4 | 5.3 | GO:0010274 | hydrotropism(GO:0010274) |
| 0.4 | 1.5 | GO:0001887 | selenium compound metabolic process(GO:0001887) |
| 0.4 | 1.1 | GO:1902458 | positive regulation of stomatal opening(GO:1902458) |
| 0.4 | 1.5 | GO:0042547 | cell wall modification involved in multidimensional cell growth(GO:0042547) |
| 0.4 | 1.5 | GO:0048462 | carpel formation(GO:0048462) |
| 0.4 | 1.5 | GO:0048656 | anther wall tapetum formation(GO:0048656) anther wall tapetum cell differentiation(GO:0048657) |
| 0.4 | 6.3 | GO:0006782 | protoporphyrinogen IX biosynthetic process(GO:0006782) protoporphyrinogen IX metabolic process(GO:0046501) |
| 0.4 | 1.1 | GO:0043987 | histone-serine phosphorylation(GO:0035404) histone H3-S10 phosphorylation(GO:0043987) |
| 0.4 | 2.2 | GO:0010451 | floral meristem growth(GO:0010451) |
| 0.4 | 3.7 | GO:0016123 | xanthophyll biosynthetic process(GO:0016123) |
| 0.4 | 3.7 | GO:0010371 | regulation of gibberellin biosynthetic process(GO:0010371) |
| 0.4 | 1.1 | GO:0090322 | regulation of superoxide metabolic process(GO:0090322) |
| 0.4 | 2.2 | GO:0022403 | cell cycle phase(GO:0022403) biological phase(GO:0044848) mitotic cell cycle phase(GO:0098763) |
| 0.4 | 0.7 | GO:0090227 | regulation of red or far-red light signaling pathway(GO:0090227) |
| 0.4 | 1.4 | GO:0031297 | replication fork processing(GO:0031297) |
| 0.4 | 2.1 | GO:1904961 | quiescent center organization(GO:1904961) |
| 0.4 | 1.1 | GO:0010198 | synergid death(GO:0010198) |
| 0.3 | 2.4 | GO:0080117 | secondary growth(GO:0080117) |
| 0.3 | 0.3 | GO:0046655 | folic acid metabolic process(GO:0046655) |
| 0.3 | 1.7 | GO:0009647 | skotomorphogenesis(GO:0009647) |
| 0.3 | 3.1 | GO:0010199 | organ boundary specification between lateral organs and the meristem(GO:0010199) |
| 0.3 | 1.0 | GO:0006557 | S-adenosylmethioninamine biosynthetic process(GO:0006557) S-adenosylmethioninamine metabolic process(GO:0046499) |
| 0.3 | 1.0 | GO:0032409 | regulation of transporter activity(GO:0032409) |
| 0.3 | 1.3 | GO:0046168 | glycerol-3-phosphate catabolic process(GO:0046168) |
| 0.3 | 0.3 | GO:0048645 | organ formation(GO:0048645) |
| 0.3 | 1.7 | GO:0090506 | axillary shoot meristem initiation(GO:0090506) |
| 0.3 | 1.3 | GO:0090603 | sieve element differentiation(GO:0090603) |
| 0.3 | 1.6 | GO:0033591 | response to L-ascorbic acid(GO:0033591) |
| 0.3 | 5.9 | GO:0010207 | photosystem II assembly(GO:0010207) |
| 0.3 | 1.3 | GO:0046398 | aminoglycan biosynthetic process(GO:0006023) glycosaminoglycan biosynthetic process(GO:0006024) UDP-glucuronate biosynthetic process(GO:0006065) glycosaminoglycan metabolic process(GO:0030203) UDP-glucuronate metabolic process(GO:0046398) |
| 0.3 | 0.7 | GO:0090628 | plant epidermal cell fate specification(GO:0090628) |
| 0.3 | 28.5 | GO:0045490 | pectin catabolic process(GO:0045490) |
| 0.3 | 8.3 | GO:0016129 | phytosteroid biosynthetic process(GO:0016129) brassinosteroid biosynthetic process(GO:0016132) |
| 0.3 | 1.9 | GO:0090057 | root radial pattern formation(GO:0090057) |
| 0.3 | 3.8 | GO:0007143 | female meiotic division(GO:0007143) |
| 0.3 | 0.3 | GO:0046740 | transport of virus in host, cell to cell(GO:0046740) multi-organism intercellular transport(GO:1902586) |
| 0.3 | 0.3 | GO:0071281 | cellular response to iron ion(GO:0071281) |
| 0.3 | 1.6 | GO:0051098 | regulation of binding(GO:0051098) |
| 0.3 | 1.3 | GO:0034764 | positive regulation of transmembrane transport(GO:0034764) |
| 0.3 | 1.3 | GO:0010495 | long-distance posttranscriptional gene silencing(GO:0010495) |
| 0.3 | 2.5 | GO:0010600 | regulation of auxin biosynthetic process(GO:0010600) |
| 0.3 | 3.1 | GO:0010103 | stomatal complex morphogenesis(GO:0010103) |
| 0.3 | 5.3 | GO:0009630 | gravitropism(GO:0009630) |
| 0.3 | 3.7 | GO:0006526 | arginine biosynthetic process(GO:0006526) |
| 0.3 | 0.9 | GO:0045597 | positive regulation of cell differentiation(GO:0045597) |
| 0.3 | 0.9 | GO:0071258 | cellular response to gravity(GO:0071258) |
| 0.3 | 4.3 | GO:0010109 | regulation of photosynthesis(GO:0010109) |
| 0.3 | 0.9 | GO:0046102 | inosine catabolic process(GO:0006148) inosine metabolic process(GO:0046102) |
| 0.3 | 1.5 | GO:0006421 | asparaginyl-tRNA aminoacylation(GO:0006421) |
| 0.3 | 1.5 | GO:0019742 | pentacyclic triterpenoid metabolic process(GO:0019742) pentacyclic triterpenoid biosynthetic process(GO:0019745) |
| 0.3 | 1.2 | GO:0060148 | positive regulation of posttranscriptional gene silencing(GO:0060148) positive regulation of RNA interference(GO:1900370) |
| 0.3 | 0.9 | GO:0009102 | biotin metabolic process(GO:0006768) biotin biosynthetic process(GO:0009102) |
| 0.3 | 6.0 | GO:0006112 | glycogen metabolic process(GO:0005977) energy reserve metabolic process(GO:0006112) |
| 0.3 | 0.3 | GO:1901881 | positive regulation of protein depolymerization(GO:1901881) |
| 0.3 | 1.2 | GO:0098740 | pollen tube adhesion(GO:0009865) cell-cell adhesion(GO:0098609) multi organism cell adhesion(GO:0098740) |
| 0.3 | 1.2 | GO:2000573 | positive regulation of DNA biosynthetic process(GO:2000573) |
| 0.3 | 2.4 | GO:1902299 | pre-replicative complex assembly involved in nuclear cell cycle DNA replication(GO:0006267) pre-replicative complex assembly(GO:0036388) pre-replicative complex assembly involved in cell cycle DNA replication(GO:1902299) |
| 0.3 | 1.2 | GO:0080140 | regulation of jasmonic acid metabolic process(GO:0080140) regulation of jasmonic acid biosynthetic process(GO:0080141) |
| 0.3 | 1.2 | GO:0000023 | maltose metabolic process(GO:0000023) |
| 0.3 | 2.3 | GO:0033314 | mitotic DNA replication checkpoint(GO:0033314) |
| 0.3 | 13.9 | GO:0019759 | S-glycoside catabolic process(GO:0016145) glycosinolate catabolic process(GO:0019759) glucosinolate catabolic process(GO:0019762) |
| 0.3 | 0.9 | GO:0016572 | histone phosphorylation(GO:0016572) |
| 0.3 | 3.1 | GO:0035336 | long-chain fatty-acyl-CoA metabolic process(GO:0035336) |
| 0.3 | 4.5 | GO:0010215 | cellulose microfibril organization(GO:0010215) |
| 0.3 | 0.3 | GO:0010589 | leaf proximal/distal pattern formation(GO:0010589) |
| 0.3 | 0.8 | GO:0034982 | mitochondrial protein processing(GO:0034982) |
| 0.3 | 19.5 | GO:0009834 | plant-type secondary cell wall biogenesis(GO:0009834) |
| 0.3 | 1.4 | GO:0071323 | cellular response to chitin(GO:0071323) |
| 0.3 | 0.6 | GO:0030174 | regulation of DNA-dependent DNA replication initiation(GO:0030174) |
| 0.3 | 3.3 | GO:0048564 | photosystem I assembly(GO:0048564) |
| 0.3 | 6.8 | GO:0009959 | negative gravitropism(GO:0009959) |
| 0.3 | 1.1 | GO:0072502 | cellular phosphate ion homeostasis(GO:0030643) cellular trivalent inorganic anion homeostasis(GO:0072502) |
| 0.3 | 4.9 | GO:0048826 | cotyledon morphogenesis(GO:0048826) |
| 0.3 | 0.8 | GO:0051639 | actin filament network formation(GO:0051639) |
| 0.3 | 2.9 | GO:0010143 | cutin biosynthetic process(GO:0010143) |
| 0.3 | 1.3 | GO:0001682 | tRNA 5'-leader removal(GO:0001682) |
| 0.3 | 2.6 | GO:0015977 | carbon fixation(GO:0015977) reductive pentose-phosphate cycle(GO:0019253) |
| 0.3 | 0.8 | GO:0010501 | RNA secondary structure unwinding(GO:0010501) |
| 0.3 | 2.8 | GO:0019288 | isopentenyl diphosphate biosynthetic process, methylerythritol 4-phosphate pathway(GO:0019288) |
| 0.3 | 0.8 | GO:2001293 | malonyl-CoA metabolic process(GO:2001293) |
| 0.3 | 0.5 | GO:0009298 | GDP-mannose biosynthetic process(GO:0009298) |
| 0.3 | 1.3 | GO:0090116 | C-5 methylation of cytosine(GO:0090116) |
| 0.3 | 2.0 | GO:0010115 | regulation of abscisic acid biosynthetic process(GO:0010115) |
| 0.3 | 2.0 | GO:0010158 | abaxial cell fate specification(GO:0010158) |
| 0.2 | 0.2 | GO:0010338 | leaf formation(GO:0010338) |
| 0.2 | 5.7 | GO:0009638 | phototropism(GO:0009638) |
| 0.2 | 0.5 | GO:0045005 | DNA-dependent DNA replication maintenance of fidelity(GO:0045005) |
| 0.2 | 6.9 | GO:0009958 | positive gravitropism(GO:0009958) |
| 0.2 | 1.0 | GO:0030322 | stabilization of membrane potential(GO:0030322) |
| 0.2 | 2.0 | GO:0016045 | detection of bacterium(GO:0016045) |
| 0.2 | 0.7 | GO:0010375 | stomatal complex patterning(GO:0010375) |
| 0.2 | 2.4 | GO:1902290 | positive regulation of defense response to oomycetes(GO:1902290) |
| 0.2 | 0.7 | GO:0033321 | homomethionine metabolic process(GO:0033321) glucosinolate biosynthetic process from homomethionine(GO:0033506) |
| 0.2 | 0.7 | GO:0052746 | inositol phosphorylation(GO:0052746) |
| 0.2 | 1.9 | GO:0009554 | megasporogenesis(GO:0009554) |
| 0.2 | 1.6 | GO:0019632 | shikimate metabolic process(GO:0019632) |
| 0.2 | 2.8 | GO:0006535 | cysteine biosynthetic process from serine(GO:0006535) |
| 0.2 | 0.9 | GO:0009305 | protein biotinylation(GO:0009305) |
| 0.2 | 0.2 | GO:0032465 | regulation of cytokinesis(GO:0032465) |
| 0.2 | 0.7 | GO:0009805 | coumarin biosynthetic process(GO:0009805) |
| 0.2 | 2.3 | GO:0036065 | fucosylation(GO:0036065) |
| 0.2 | 0.9 | GO:0002943 | tRNA dihydrouridine synthesis(GO:0002943) |
| 0.2 | 4.2 | GO:0009944 | polarity specification of adaxial/abaxial axis(GO:0009944) specification of axis polarity(GO:0065001) |
| 0.2 | 1.1 | GO:0032309 | icosanoid secretion(GO:0032309) arachidonic acid secretion(GO:0050482) icosanoid transport(GO:0071715) fatty acid derivative transport(GO:1901571) arachidonate transport(GO:1903963) |
| 0.2 | 1.1 | GO:0010390 | histone monoubiquitination(GO:0010390) |
| 0.2 | 1.1 | GO:0007043 | cell-cell junction assembly(GO:0007043) |
| 0.2 | 1.1 | GO:0046500 | S-adenosylmethionine metabolic process(GO:0046500) |
| 0.2 | 1.3 | GO:1902222 | L-phenylalanine catabolic process(GO:0006559) erythrose 4-phosphate/phosphoenolpyruvate family amino acid catabolic process(GO:1902222) |
| 0.2 | 0.6 | GO:0006432 | phenylalanyl-tRNA aminoacylation(GO:0006432) |
| 0.2 | 2.1 | GO:0001709 | cell fate determination(GO:0001709) |
| 0.2 | 2.5 | GO:0042793 | transcription from plastid promoter(GO:0042793) |
| 0.2 | 3.9 | GO:0019853 | L-ascorbic acid biosynthetic process(GO:0019853) |
| 0.2 | 0.4 | GO:0046104 | deoxyribonucleoside metabolic process(GO:0009120) thymidine metabolic process(GO:0046104) pyrimidine deoxyribonucleoside metabolic process(GO:0046125) |
| 0.2 | 2.2 | GO:0042761 | very long-chain fatty acid biosynthetic process(GO:0042761) |
| 0.2 | 0.6 | GO:0042539 | hypotonic salinity response(GO:0042539) |
| 0.2 | 1.0 | GO:1905177 | tracheary element differentiation(GO:1905177) |
| 0.2 | 1.2 | GO:0009052 | pentose-phosphate shunt, non-oxidative branch(GO:0009052) |
| 0.2 | 1.0 | GO:0019408 | dolichol biosynthetic process(GO:0019408) |
| 0.2 | 1.0 | GO:0048830 | adventitious root development(GO:0048830) |
| 0.2 | 8.6 | GO:0010411 | xyloglucan metabolic process(GO:0010411) |
| 0.2 | 3.7 | GO:0010492 | maintenance of shoot apical meristem identity(GO:0010492) |
| 0.2 | 2.5 | GO:0051762 | sesquiterpene biosynthetic process(GO:0051762) |
| 0.2 | 1.2 | GO:0009263 | deoxyribonucleotide biosynthetic process(GO:0009263) |
| 0.2 | 0.4 | GO:0008295 | spermidine biosynthetic process(GO:0008295) |
| 0.2 | 0.6 | GO:1904667 | negative regulation of protein ubiquitination(GO:0031397) negative regulation of ligase activity(GO:0051352) negative regulation of ubiquitin-protein transferase activity(GO:0051444) negative regulation of ubiquitin protein ligase activity(GO:1904667) |
| 0.2 | 0.8 | GO:0015675 | nickel cation transport(GO:0015675) |
| 0.2 | 1.1 | GO:0006471 | protein ADP-ribosylation(GO:0006471) protein poly-ADP-ribosylation(GO:0070212) |
| 0.2 | 5.0 | GO:0048825 | cotyledon development(GO:0048825) |
| 0.2 | 8.4 | GO:0015979 | photosynthesis(GO:0015979) |
| 0.2 | 7.0 | GO:0015995 | chlorophyll biosynthetic process(GO:0015995) |
| 0.2 | 1.1 | GO:0009635 | response to herbicide(GO:0009635) |
| 0.2 | 0.9 | GO:0071260 | cellular response to mechanical stimulus(GO:0071260) |
| 0.2 | 1.8 | GO:0009704 | de-etiolation(GO:0009704) |
| 0.2 | 1.8 | GO:0046292 | formaldehyde metabolic process(GO:0046292) |
| 0.2 | 0.5 | GO:0034059 | response to anoxia(GO:0034059) |
| 0.2 | 2.3 | GO:0005987 | sucrose catabolic process(GO:0005987) |
| 0.2 | 3.7 | GO:0010305 | leaf vascular tissue pattern formation(GO:0010305) |
| 0.2 | 9.7 | GO:0007267 | cell-cell signaling(GO:0007267) |
| 0.2 | 0.9 | GO:0045003 | double-strand break repair via synthesis-dependent strand annealing(GO:0045003) |
| 0.2 | 1.0 | GO:0006751 | glutathione catabolic process(GO:0006751) |
| 0.2 | 0.2 | GO:0051480 | regulation of cytosolic calcium ion concentration(GO:0051480) |
| 0.2 | 0.7 | GO:0016120 | carotene biosynthetic process(GO:0016120) |
| 0.2 | 1.9 | GO:0006465 | signal peptide processing(GO:0006465) |
| 0.2 | 0.7 | GO:0010321 | regulation of vegetative phase change(GO:0010321) |
| 0.2 | 1.2 | GO:2000762 | regulation of phenylpropanoid metabolic process(GO:2000762) |
| 0.2 | 0.3 | GO:0000076 | DNA replication checkpoint(GO:0000076) |
| 0.2 | 1.0 | GO:0010023 | proanthocyanidin biosynthetic process(GO:0010023) |
| 0.2 | 0.5 | GO:0051418 | interphase microtubule nucleation by interphase microtubule organizing center(GO:0051415) microtubule nucleation by microtubule organizing center(GO:0051418) |
| 0.2 | 0.7 | GO:0010253 | UDP-rhamnose biosynthetic process(GO:0010253) UDP-rhamnose metabolic process(GO:0033478) |
| 0.2 | 4.1 | GO:0010075 | regulation of meristem growth(GO:0010075) |
| 0.2 | 6.3 | GO:0045489 | pectin biosynthetic process(GO:0045489) |
| 0.2 | 1.1 | GO:0070979 | protein K11-linked ubiquitination(GO:0070979) |
| 0.2 | 0.6 | GO:0061087 | positive regulation of histone H3-K27 methylation(GO:0061087) |
| 0.2 | 1.6 | GO:0080110 | sporopollenin biosynthetic process(GO:0080110) |
| 0.2 | 0.9 | GO:0051754 | meiotic sister chromatid cohesion, centromeric(GO:0051754) |
| 0.2 | 2.2 | GO:0010497 | plasmodesmata-mediated intercellular transport(GO:0010497) |
| 0.2 | 1.1 | GO:0072337 | modified amino acid transport(GO:0072337) |
| 0.2 | 0.8 | GO:0010449 | root meristem growth(GO:0010449) |
| 0.2 | 0.6 | GO:0046416 | D-amino acid metabolic process(GO:0046416) |
| 0.1 | 0.4 | GO:0000492 | box C/D snoRNP assembly(GO:0000492) |
| 0.1 | 4.7 | GO:0006730 | one-carbon metabolic process(GO:0006730) |
| 0.1 | 0.7 | GO:0019419 | sulfate reduction(GO:0019419) |
| 0.1 | 0.7 | GO:1902221 | L-phenylalanine metabolic process(GO:0006558) L-phenylalanine biosynthetic process(GO:0009094) erythrose 4-phosphate/phosphoenolpyruvate family amino acid metabolic process(GO:1902221) erythrose 4-phosphate/phosphoenolpyruvate family amino acid biosynthetic process(GO:1902223) |
| 0.1 | 0.4 | GO:0010981 | regulation of cell wall macromolecule metabolic process(GO:0010981) |
| 0.1 | 2.4 | GO:0010152 | pollen maturation(GO:0010152) |
| 0.1 | 13.5 | GO:0080167 | response to karrikin(GO:0080167) |
| 0.1 | 0.4 | GO:0048872 | tissue homeostasis(GO:0001894) homeostasis of number of meristem cells(GO:0007639) homeostasis of number of cells(GO:0048872) homeostasis of number of cells within a tissue(GO:0048873) |
| 0.1 | 1.1 | GO:0040001 | establishment of mitotic spindle orientation(GO:0000132) establishment of mitotic spindle localization(GO:0040001) establishment of spindle localization(GO:0051293) establishment of spindle orientation(GO:0051294) spindle localization(GO:0051653) |
| 0.1 | 0.4 | GO:1990532 | stress response to nickel ion(GO:1990532) |
| 0.1 | 0.4 | GO:0009187 | cyclic nucleotide metabolic process(GO:0009187) |
| 0.1 | 0.4 | GO:0007032 | endosome organization(GO:0007032) |
| 0.1 | 2.7 | GO:0009904 | chloroplast accumulation movement(GO:0009904) |
| 0.1 | 1.1 | GO:0051214 | RNA virus induced gene silencing(GO:0051214) |
| 0.1 | 7.6 | GO:0009736 | cytokinin-activated signaling pathway(GO:0009736) |
| 0.1 | 4.7 | GO:0009664 | plant-type cell wall organization(GO:0009664) |
| 0.1 | 2.2 | GO:0080022 | primary root development(GO:0080022) |
| 0.1 | 0.7 | GO:0015939 | pantothenate metabolic process(GO:0015939) pantothenate biosynthetic process(GO:0015940) |
| 0.1 | 0.7 | GO:0010018 | far-red light signaling pathway(GO:0010018) cellular response to far red light(GO:0071490) |
| 0.1 | 0.1 | GO:0042177 | negative regulation of protein catabolic process(GO:0042177) |
| 0.1 | 0.8 | GO:0033619 | membrane protein proteolysis(GO:0033619) |
| 0.1 | 0.5 | GO:0000256 | allantoin catabolic process(GO:0000256) |
| 0.1 | 0.5 | GO:0010606 | positive regulation of cytoplasmic mRNA processing body assembly(GO:0010606) |
| 0.1 | 0.4 | GO:0034389 | lipid particle organization(GO:0034389) |
| 0.1 | 3.1 | GO:0010027 | thylakoid membrane organization(GO:0010027) |
| 0.1 | 2.0 | GO:0046688 | response to copper ion(GO:0046688) |
| 0.1 | 0.5 | GO:0034414 | tRNA 3'-trailer cleavage, endonucleolytic(GO:0034414) |
| 0.1 | 4.4 | GO:0005991 | trehalose metabolic process(GO:0005991) |
| 0.1 | 0.7 | GO:0009090 | homoserine biosynthetic process(GO:0009090) |
| 0.1 | 0.5 | GO:0043279 | response to caffeine(GO:0031000) response to alkaloid(GO:0043279) cellular response to alkaloid(GO:0071312) cellular response to caffeine(GO:0071313) cellular response to purine-containing compound(GO:0071415) negative regulation of cellular response to caffeine(GO:1901181) |
| 0.1 | 1.0 | GO:0031222 | arabinan catabolic process(GO:0031222) |
| 0.1 | 0.4 | GO:0060145 | viral gene silencing in virus induced gene silencing(GO:0060145) |
| 0.1 | 1.6 | GO:2000012 | regulation of auxin polar transport(GO:2000012) |
| 0.1 | 2.9 | GO:0043572 | chloroplast fission(GO:0010020) plastid fission(GO:0043572) |
| 0.1 | 0.5 | GO:0048577 | negative regulation of short-day photoperiodism, flowering(GO:0048577) |
| 0.1 | 3.5 | GO:0099518 | vesicle transport along actin filament(GO:0030050) vesicle cytoskeletal trafficking(GO:0099518) |
| 0.1 | 0.6 | GO:0010155 | regulation of proton transport(GO:0010155) |
| 0.1 | 0.6 | GO:0048598 | embryonic morphogenesis(GO:0048598) |
| 0.1 | 0.2 | GO:0031054 | pre-miRNA processing(GO:0031054) |
| 0.1 | 0.3 | GO:0019594 | hexitol metabolic process(GO:0006059) hexitol biosynthetic process(GO:0019406) mannitol biosynthetic process(GO:0019593) mannitol metabolic process(GO:0019594) |
| 0.1 | 1.9 | GO:1901068 | guanosine-containing compound metabolic process(GO:1901068) |
| 0.1 | 1.6 | GO:0006268 | DNA unwinding involved in DNA replication(GO:0006268) |
| 0.1 | 0.6 | GO:2000582 | regulation of microtubule motor activity(GO:2000574) positive regulation of microtubule motor activity(GO:2000576) regulation of ATP-dependent microtubule motor activity, plus-end-directed(GO:2000580) positive regulation of ATP-dependent microtubule motor activity, plus-end-directed(GO:2000582) |
| 0.1 | 2.6 | GO:0009251 | glucan catabolic process(GO:0009251) |
| 0.1 | 1.5 | GO:0015918 | sterol transport(GO:0015918) |
| 0.1 | 0.6 | GO:0009113 | purine nucleobase biosynthetic process(GO:0009113) |
| 0.1 | 0.6 | GO:0030308 | negative regulation of cell growth(GO:0030308) |
| 0.1 | 0.6 | GO:0006189 | 'de novo' IMP biosynthetic process(GO:0006189) |
| 0.1 | 0.5 | GO:0006107 | oxaloacetate metabolic process(GO:0006107) |
| 0.1 | 0.1 | GO:0043467 | regulation of generation of precursor metabolites and energy(GO:0043467) |
| 0.1 | 4.8 | GO:0009179 | glycolytic process(GO:0006096) ATP generation from ADP(GO:0006757) purine nucleoside diphosphate metabolic process(GO:0009135) purine ribonucleoside diphosphate metabolic process(GO:0009179) ADP metabolic process(GO:0046031) |
| 0.1 | 1.6 | GO:0007008 | outer mitochondrial membrane organization(GO:0007008) protein import into mitochondrial outer membrane(GO:0045040) |
| 0.1 | 0.7 | GO:0051667 | chloroplast relocation(GO:0009902) establishment of plastid localization(GO:0051667) |
| 0.1 | 0.4 | GO:0019388 | hexose catabolic process(GO:0019320) galactose catabolic process(GO:0019388) galactose catabolic process via UDP-galactose(GO:0033499) |
| 0.1 | 0.6 | GO:1903338 | regulation of cell wall organization or biogenesis(GO:1903338) |
| 0.1 | 1.4 | GO:0044030 | regulation of DNA methylation(GO:0044030) |
| 0.1 | 0.7 | GO:0097577 | intracellular sequestering of iron ion(GO:0006880) sequestering of iron ion(GO:0097577) |
| 0.1 | 0.6 | GO:0007188 | G-protein coupled receptor signaling pathway, coupled to cyclic nucleotide second messenger(GO:0007187) adenylate cyclase-modulating G-protein coupled receptor signaling pathway(GO:0007188) |
| 0.1 | 0.5 | GO:0006048 | UDP-N-acetylglucosamine biosynthetic process(GO:0006048) |
| 0.1 | 4.3 | GO:0035825 | reciprocal meiotic recombination(GO:0007131) reciprocal DNA recombination(GO:0035825) |
| 0.1 | 0.9 | GO:1904666 | regulation of ubiquitin protein ligase activity(GO:1904666) positive regulation of ubiquitin protein ligase activity(GO:1904668) |
| 0.1 | 2.8 | GO:0019758 | S-glycoside biosynthetic process(GO:0016144) glycosinolate biosynthetic process(GO:0019758) glucosinolate biosynthetic process(GO:0019761) |
| 0.1 | 0.2 | GO:0033194 | response to hydroperoxide(GO:0033194) |
| 0.1 | 0.5 | GO:0033206 | meiotic cytokinesis(GO:0033206) |
| 0.1 | 0.3 | GO:0006883 | cellular sodium ion homeostasis(GO:0006883) |
| 0.1 | 0.2 | GO:0071486 | response to UV-A(GO:0070141) cellular response to high light intensity(GO:0071486) cellular response to UV-A(GO:0071492) |
| 0.1 | 0.4 | GO:0000727 | double-strand break repair via break-induced replication(GO:0000727) |
| 0.1 | 1.0 | GO:0008356 | asymmetric cell division(GO:0008356) |
| 0.1 | 0.9 | GO:0006349 | regulation of gene expression by genetic imprinting(GO:0006349) genetic imprinting(GO:0071514) |
| 0.1 | 0.1 | GO:0071366 | cellular response to indolebutyric acid stimulus(GO:0071366) |
| 0.1 | 0.7 | GO:0031365 | N-terminal protein amino acid modification(GO:0031365) |
| 0.1 | 0.1 | GO:0051972 | regulation of telomerase activity(GO:0051972) |
| 0.1 | 0.3 | GO:0030104 | water homeostasis(GO:0030104) |
| 0.1 | 0.5 | GO:0071586 | CAAX-box protein processing(GO:0071586) CAAX-box protein maturation(GO:0080120) |
| 0.1 | 0.4 | GO:0010264 | myo-inositol hexakisphosphate biosynthetic process(GO:0010264) myo-inositol hexakisphosphate metabolic process(GO:0033517) |
| 0.1 | 2.0 | GO:0043622 | cortical microtubule organization(GO:0043622) |
| 0.1 | 0.8 | GO:0018026 | peptidyl-lysine monomethylation(GO:0018026) |
| 0.1 | 2.5 | GO:0006891 | intra-Golgi vesicle-mediated transport(GO:0006891) |
| 0.1 | 0.9 | GO:0031425 | chloroplast RNA processing(GO:0031425) |
| 0.1 | 0.3 | GO:0030030 | cell projection organization(GO:0030030) cell projection assembly(GO:0030031) |
| 0.1 | 0.3 | GO:0097468 | cell death in response to oxidative stress(GO:0036473) programmed cell death in response to reactive oxygen species(GO:0097468) |
| 0.1 | 0.5 | GO:0072530 | purine-containing compound transmembrane transport(GO:0072530) |
| 0.1 | 0.6 | GO:0071249 | cellular response to nitrate(GO:0071249) |
| 0.1 | 0.4 | GO:0071786 | endoplasmic reticulum tubular network organization(GO:0071786) |
| 0.1 | 0.6 | GO:0010106 | cellular response to iron ion starvation(GO:0010106) |
| 0.1 | 1.1 | GO:0044070 | regulation of anion transport(GO:0044070) |
| 0.1 | 0.8 | GO:0046654 | folic acid-containing compound biosynthetic process(GO:0009396) tetrahydrofolate biosynthetic process(GO:0046654) |
| 0.1 | 0.6 | GO:0070193 | synaptonemal complex assembly(GO:0007130) synaptonemal complex organization(GO:0070193) |
| 0.1 | 0.6 | GO:0000967 | rRNA 5'-end processing(GO:0000967) ncRNA 5'-end processing(GO:0034471) |
| 0.1 | 1.0 | GO:0010584 | pollen exine formation(GO:0010584) |
| 0.1 | 1.0 | GO:0006722 | triterpenoid metabolic process(GO:0006722) |
| 0.1 | 0.2 | GO:0006666 | 3-keto-sphinganine metabolic process(GO:0006666) |
| 0.1 | 0.2 | GO:0009228 | thiamine biosynthetic process(GO:0009228) thiamine-containing compound biosynthetic process(GO:0042724) |
| 0.1 | 0.7 | GO:1901259 | chloroplast rRNA processing(GO:1901259) |
| 0.1 | 0.5 | GO:0043486 | histone exchange(GO:0043486) |
| 0.1 | 1.1 | GO:0009294 | genetic transfer(GO:0009292) DNA mediated transformation(GO:0009294) |
| 0.1 | 0.5 | GO:0000244 | spliceosomal tri-snRNP complex assembly(GO:0000244) |
| 0.1 | 0.2 | GO:0033528 | S-methylmethionine metabolic process(GO:0033477) S-methylmethionine cycle(GO:0033528) |
| 0.1 | 0.5 | GO:0032351 | negative regulation of hormone metabolic process(GO:0032351) negative regulation of auxin metabolic process(GO:0090356) |
| 0.1 | 0.2 | GO:0006651 | diacylglycerol biosynthetic process(GO:0006651) |
| 0.1 | 0.6 | GO:0009961 | response to 1-aminocyclopropane-1-carboxylic acid(GO:0009961) |
| 0.1 | 0.3 | GO:1990481 | mRNA pseudouridine synthesis(GO:1990481) |
| 0.1 | 0.5 | GO:0019287 | isopentenyl diphosphate biosynthetic process, mevalonate pathway(GO:0019287) |
| 0.1 | 0.4 | GO:0032042 | mitochondrial DNA metabolic process(GO:0032042) |
| 0.1 | 0.2 | GO:0006690 | icosanoid metabolic process(GO:0006690) fatty acid derivative metabolic process(GO:1901568) |
| 0.1 | 0.5 | GO:0016926 | protein desumoylation(GO:0016926) |
| 0.1 | 1.8 | GO:0000027 | ribosomal large subunit assembly(GO:0000027) |
| 0.1 | 5.1 | GO:0009657 | plastid organization(GO:0009657) |
| 0.1 | 0.6 | GO:0006450 | regulation of translational fidelity(GO:0006450) |
| 0.1 | 0.9 | GO:0000105 | histidine biosynthetic process(GO:0000105) histidine metabolic process(GO:0006547) imidazole-containing compound metabolic process(GO:0052803) |
| 0.1 | 0.2 | GO:0002164 | nematode larval development(GO:0002119) larval development(GO:0002164) regulation of nematode larval development(GO:0061062) |
| 0.1 | 1.5 | GO:0030422 | production of siRNA involved in RNA interference(GO:0030422) |
| 0.1 | 0.7 | GO:0043650 | dicarboxylic acid biosynthetic process(GO:0043650) |
| 0.1 | 0.6 | GO:0046520 | sphingoid biosynthetic process(GO:0046520) |
| 0.1 | 0.2 | GO:0006591 | ornithine metabolic process(GO:0006591) |
| 0.1 | 0.2 | GO:0042891 | tetracycline transport(GO:0015904) antibiotic transport(GO:0042891) toxin transport(GO:1901998) |
| 0.1 | 0.2 | GO:0019427 | acetyl-CoA biosynthetic process from acetate(GO:0019427) |
| 0.1 | 1.1 | GO:0009685 | gibberellin metabolic process(GO:0009685) gibberellin biosynthetic process(GO:0009686) |
| 0.1 | 0.3 | GO:0071244 | cellular response to carbon dioxide(GO:0071244) |
| 0.0 | 1.4 | GO:0009809 | lignin biosynthetic process(GO:0009809) |
| 0.0 | 0.3 | GO:0044211 | CTP salvage(GO:0044211) |
| 0.0 | 0.4 | GO:0010345 | suberin biosynthetic process(GO:0010345) |
| 0.0 | 0.5 | GO:0050821 | protein stabilization(GO:0050821) |
| 0.0 | 0.8 | GO:0061157 | RNA destabilization(GO:0050779) mRNA destabilization(GO:0061157) |
| 0.0 | 0.1 | GO:0034058 | endosomal vesicle fusion(GO:0034058) |
| 0.0 | 0.1 | GO:0031848 | protection from non-homologous end joining at telomere(GO:0031848) |
| 0.0 | 0.3 | GO:0051510 | regulation of unidimensional cell growth(GO:0051510) |
| 0.0 | 0.1 | GO:0046417 | chorismate metabolic process(GO:0046417) |
| 0.0 | 0.8 | GO:0010582 | floral meristem determinacy(GO:0010582) |
| 0.0 | 0.3 | GO:0006120 | mitochondrial electron transport, NADH to ubiquinone(GO:0006120) |
| 0.0 | 0.5 | GO:0030865 | cortical cytoskeleton organization(GO:0030865) |
| 0.0 | 0.3 | GO:0080165 | callose deposition in phloem sieve plate(GO:0080165) |
| 0.0 | 0.3 | GO:0000289 | nuclear-transcribed mRNA poly(A) tail shortening(GO:0000289) |
| 0.0 | 0.1 | GO:0042779 | tRNA 3'-trailer cleavage(GO:0042779) tRNA 3'-end processing(GO:0042780) |
| 0.0 | 0.1 | GO:0001173 | DNA-templated transcriptional start site selection(GO:0001173) |
| 0.0 | 0.2 | GO:0051103 | DNA ligation involved in DNA repair(GO:0051103) |
| 0.0 | 0.3 | GO:0036297 | interstrand cross-link repair(GO:0036297) |
| 0.0 | 0.2 | GO:0033540 | fatty acid beta-oxidation using acyl-CoA oxidase(GO:0033540) |
| 0.0 | 0.3 | GO:0051131 | chaperone-mediated protein complex assembly(GO:0051131) |
| 0.0 | 0.2 | GO:0072659 | protein localization to plasma membrane(GO:0072659) |
| 0.0 | 0.3 | GO:0080086 | stamen filament development(GO:0080086) |
| 0.0 | 0.6 | GO:0010928 | regulation of auxin mediated signaling pathway(GO:0010928) |
| 0.0 | 0.1 | GO:0097437 | maintenance of seed dormancy(GO:0010231) maintenance of dormancy(GO:0097437) |
| 0.0 | 0.4 | GO:0009698 | phenylpropanoid metabolic process(GO:0009698) |
| 0.0 | 0.4 | GO:0009299 | mRNA transcription(GO:0009299) |
| 0.0 | 0.2 | GO:0006488 | dolichol-linked oligosaccharide biosynthetic process(GO:0006488) |
| 0.0 | 0.1 | GO:0043266 | regulation of potassium ion transport(GO:0043266) |
| 0.0 | 0.3 | GO:0046341 | CDP-diacylglycerol biosynthetic process(GO:0016024) CDP-diacylglycerol metabolic process(GO:0046341) |
| 0.0 | 0.7 | GO:0016556 | mRNA modification(GO:0016556) |
| 0.0 | 0.2 | GO:2000071 | regulation of defense response by callose deposition(GO:2000071) |
| 0.0 | 0.4 | GO:0015740 | C4-dicarboxylate transport(GO:0015740) |
| 0.0 | 0.3 | GO:0045338 | farnesyl diphosphate metabolic process(GO:0045338) |
| 0.0 | 0.1 | GO:0010358 | leaf shaping(GO:0010358) |
| 0.0 | 0.5 | GO:0045930 | negative regulation of mitotic cell cycle(GO:0045930) |
| 0.0 | 0.4 | GO:0060284 | regulation of cell morphogenesis involved in differentiation(GO:0010769) regulation of cell development(GO:0060284) |
| 0.0 | 0.1 | GO:0097298 | regulation of nucleus size(GO:0097298) |
| 0.0 | 0.0 | GO:0010124 | phenylacetate catabolic process(GO:0010124) |
| 0.0 | 0.1 | GO:0006741 | NADP biosynthetic process(GO:0006741) |
| 0.0 | 0.0 | GO:0048451 | petal formation(GO:0048451) |
| 0.0 | 0.2 | GO:0070940 | dephosphorylation of RNA polymerase II C-terminal domain(GO:0070940) |
| 0.0 | 6.4 | GO:0006412 | translation(GO:0006412) |
| 0.0 | 0.2 | GO:0006265 | DNA topological change(GO:0006265) |
| 0.0 | 0.1 | GO:0070898 | RNA polymerase III transcriptional preinitiation complex assembly(GO:0070898) |
| 0.0 | 0.0 | GO:0072388 | FAD biosynthetic process(GO:0006747) flavin adenine dinucleotide biosynthetic process(GO:0072388) |
| 0.0 | 0.2 | GO:0044772 | mitotic cell cycle phase transition(GO:0044772) |
| 0.0 | 0.1 | GO:0030488 | tRNA methylation(GO:0030488) |
| 0.0 | 0.2 | GO:0010227 | floral organ abscission(GO:0010227) |
Gene overrepresentation in cellular component category:
| Log-likelihood per target | Total log-likelihood | Term | Description |
|---|---|---|---|
| 2.0 | 17.6 | GO:0009517 | thylakoid light-harvesting complex(GO:0009503) PSII associated light-harvesting complex II(GO:0009517) light-harvesting complex(GO:0030076) |
| 1.4 | 4.2 | GO:0043668 | pollen wall(GO:0043667) exine(GO:0043668) sexine(GO:0043673) columella(GO:0043674) |
| 1.2 | 1.2 | GO:0016328 | lateral plasma membrane(GO:0016328) |
| 1.0 | 3.0 | GO:0030093 | chloroplast photosystem I(GO:0030093) |
| 1.0 | 8.6 | GO:0009654 | photosystem II oxygen evolving complex(GO:0009654) |
| 0.9 | 4.5 | GO:0009897 | external side of plasma membrane(GO:0009897) |
| 0.9 | 40.5 | GO:0031978 | chloroplast thylakoid lumen(GO:0009543) plastid thylakoid lumen(GO:0031978) |
| 0.7 | 31.0 | GO:0010319 | stromule(GO:0010319) |
| 0.7 | 3.6 | GO:0034426 | etioplast envelope(GO:0034425) etioplast membrane(GO:0034426) |
| 0.7 | 11.4 | GO:0010598 | NAD(P)H dehydrogenase complex (plastoquinone)(GO:0010598) |
| 0.7 | 8.8 | GO:0045298 | tubulin complex(GO:0045298) |
| 0.7 | 2.7 | GO:0010330 | cellulose synthase complex(GO:0010330) |
| 0.7 | 7.2 | GO:0009522 | photosystem I(GO:0009522) |
| 0.6 | 3.2 | GO:0009533 | chloroplast stromal thylakoid(GO:0009533) |
| 0.6 | 2.5 | GO:0010316 | pyrophosphate-dependent phosphofructokinase complex(GO:0010316) |
| 0.6 | 2.5 | GO:0044420 | extracellular matrix component(GO:0044420) |
| 0.6 | 8.4 | GO:0010005 | cortical microtubule, transverse to long axis(GO:0010005) |
| 0.6 | 2.3 | GO:0016461 | unconventional myosin complex(GO:0016461) |
| 0.5 | 8.9 | GO:0009531 | secondary cell wall(GO:0009531) |
| 0.5 | 6.9 | GO:0009986 | cell surface(GO:0009986) |
| 0.5 | 3.7 | GO:0098807 | chloroplast thylakoid membrane protein complex(GO:0098807) |
| 0.5 | 2.3 | GO:0005960 | glycine cleavage complex(GO:0005960) |
| 0.5 | 0.5 | GO:0031012 | extracellular matrix(GO:0031012) |
| 0.4 | 3.0 | GO:0005854 | nascent polypeptide-associated complex(GO:0005854) |
| 0.4 | 0.8 | GO:0043235 | receptor complex(GO:0043235) |
| 0.4 | 95.9 | GO:0009535 | chloroplast thylakoid membrane(GO:0009535) |
| 0.4 | 1.6 | GO:0032133 | chromosome passenger complex(GO:0032133) |
| 0.4 | 4.0 | GO:0031209 | SCAR complex(GO:0031209) |
| 0.4 | 2.4 | GO:0000427 | plastid-encoded plastid RNA polymerase complex(GO:0000427) |
| 0.4 | 3.6 | GO:0010369 | chromocenter(GO:0010369) |
| 0.4 | 16.7 | GO:0009706 | chloroplast inner membrane(GO:0009706) |
| 0.4 | 8.5 | GO:0005871 | kinesin complex(GO:0005871) |
| 0.3 | 62.5 | GO:0009505 | plant-type cell wall(GO:0009505) |
| 0.3 | 1.3 | GO:0031314 | extrinsic component of mitochondrial inner membrane(GO:0031314) |
| 0.3 | 1.8 | GO:0009360 | DNA polymerase III complex(GO:0009360) |
| 0.3 | 0.9 | GO:0031390 | Ctf18 RFC-like complex(GO:0031390) |
| 0.3 | 1.5 | GO:0005828 | kinetochore microtubule(GO:0005828) |
| 0.3 | 37.5 | GO:0009579 | thylakoid(GO:0009579) |
| 0.3 | 0.8 | GO:0032432 | actin filament bundle(GO:0032432) |
| 0.3 | 1.1 | GO:0032044 | DSIF complex(GO:0032044) |
| 0.3 | 0.8 | GO:0009501 | amyloplast(GO:0009501) |
| 0.3 | 1.0 | GO:0009317 | acetyl-CoA carboxylase complex(GO:0009317) |
| 0.2 | 35.9 | GO:0046658 | anchored component of plasma membrane(GO:0046658) |
| 0.2 | 5.4 | GO:0016324 | apical plasma membrane(GO:0016324) |
| 0.2 | 6.5 | GO:0005875 | microtubule associated complex(GO:0005875) |
| 0.2 | 1.1 | GO:0000812 | Swr1 complex(GO:0000812) |
| 0.2 | 15.8 | GO:0005874 | microtubule(GO:0005874) |
| 0.2 | 0.7 | GO:0008622 | epsilon DNA polymerase complex(GO:0008622) |
| 0.2 | 0.6 | GO:0005658 | alpha DNA polymerase:primase complex(GO:0005658) |
| 0.2 | 45.4 | GO:0048046 | apoplast(GO:0048046) |
| 0.2 | 2.0 | GO:0005720 | nuclear heterochromatin(GO:0005720) |
| 0.2 | 0.8 | GO:0042645 | mitochondrial nucleoid(GO:0042645) |
| 0.2 | 1.2 | GO:0009346 | citrate lyase complex(GO:0009346) |
| 0.2 | 0.6 | GO:0043186 | P granule(GO:0043186) pole plasm(GO:0045495) germ plasm(GO:0060293) |
| 0.2 | 1.2 | GO:0000778 | condensed chromosome kinetochore(GO:0000777) condensed nuclear chromosome kinetochore(GO:0000778) |
| 0.2 | 0.6 | GO:0043240 | Fanconi anaemia nuclear complex(GO:0043240) |
| 0.2 | 2.2 | GO:0009574 | preprophase band(GO:0009574) |
| 0.2 | 0.9 | GO:0090397 | stigma papilla(GO:0090397) |
| 0.2 | 0.7 | GO:0033597 | mitotic checkpoint complex(GO:0033597) |
| 0.2 | 1.2 | GO:0005787 | signal peptidase complex(GO:0005787) |
| 0.2 | 1.6 | GO:0016272 | prefoldin complex(GO:0016272) |
| 0.2 | 18.7 | GO:0031225 | anchored component of membrane(GO:0031225) |
| 0.2 | 0.8 | GO:0043036 | chloroplast starch grain(GO:0009569) starch grain(GO:0043036) |
| 0.1 | 1.5 | GO:0042555 | MCM complex(GO:0042555) |
| 0.1 | 0.4 | GO:0097361 | CIA complex(GO:0097361) |
| 0.1 | 1.4 | GO:0001401 | mitochondrial sorting and assembly machinery complex(GO:0001401) |
| 0.1 | 0.8 | GO:0010168 | ER body(GO:0010168) |
| 0.1 | 1.3 | GO:0009508 | plastid chromosome(GO:0009508) |
| 0.1 | 1.1 | GO:0031464 | Cul4A-RING E3 ubiquitin ligase complex(GO:0031464) |
| 0.1 | 0.9 | GO:0000779 | condensed chromosome, centromeric region(GO:0000779) |
| 0.1 | 0.8 | GO:0071556 | integral component of lumenal side of endoplasmic reticulum membrane(GO:0071556) lumenal side of endoplasmic reticulum membrane(GO:0098553) lumenal side of membrane(GO:0098576) |
| 0.1 | 0.3 | GO:0030896 | checkpoint clamp complex(GO:0030896) |
| 0.1 | 0.3 | GO:0030015 | CCR4-NOT core complex(GO:0030015) |
| 0.1 | 0.3 | GO:0000795 | synaptonemal complex(GO:0000795) |
| 0.1 | 1.2 | GO:0016459 | myosin complex(GO:0016459) |
| 0.1 | 39.6 | GO:0009570 | chloroplast stroma(GO:0009570) |
| 0.1 | 0.5 | GO:1990124 | messenger ribonucleoprotein complex(GO:1990124) |
| 0.1 | 1.1 | GO:0019897 | extrinsic component of plasma membrane(GO:0019897) |
| 0.1 | 2.0 | GO:0000307 | cyclin-dependent protein kinase holoenzyme complex(GO:0000307) |
| 0.1 | 0.4 | GO:0098554 | integral component of cytoplasmic side of endoplasmic reticulum membrane(GO:0071458) cytoplasmic side of endoplasmic reticulum membrane(GO:0098554) |
| 0.1 | 0.2 | GO:0032299 | ribonuclease H2 complex(GO:0032299) |
| 0.1 | 0.2 | GO:0016323 | basal plasma membrane(GO:0009925) basolateral plasma membrane(GO:0016323) basal part of cell(GO:0045178) |
| 0.1 | 11.8 | GO:0015934 | large ribosomal subunit(GO:0015934) |
| 0.1 | 0.9 | GO:0015030 | Cajal body(GO:0015030) |
| 0.1 | 0.3 | GO:0030863 | cortical cytoskeleton(GO:0030863) |
| 0.1 | 168.8 | GO:0005576 | extracellular region(GO:0005576) |
| 0.1 | 0.3 | GO:0031907 | peroxisomal matrix(GO:0005782) microbody lumen(GO:0031907) |
| 0.1 | 1.5 | GO:0000419 | DNA-directed RNA polymerase V complex(GO:0000419) |
| 0.1 | 0.5 | GO:0000313 | organellar ribosome(GO:0000313) organellar small ribosomal subunit(GO:0000314) mitochondrial ribosome(GO:0005761) mitochondrial small ribosomal subunit(GO:0005763) |
| 0.1 | 0.2 | GO:0036387 | nuclear pre-replicative complex(GO:0005656) pre-replicative complex(GO:0036387) |
| 0.1 | 0.4 | GO:0033061 | DNA recombinase mediator complex(GO:0033061) |
| 0.1 | 0.5 | GO:0005801 | cis-Golgi network(GO:0005801) |
| 0.1 | 0.3 | GO:0034388 | Pwp2p-containing subcomplex of 90S preribosome(GO:0034388) |
| 0.1 | 0.5 | GO:0005815 | microtubule organizing center(GO:0005815) |
| 0.1 | 0.4 | GO:0031380 | RNA-directed RNA polymerase complex(GO:0031379) nuclear RNA-directed RNA polymerase complex(GO:0031380) |
| 0.1 | 0.8 | GO:0031902 | late endosome membrane(GO:0031902) |
| 0.0 | 0.1 | GO:0009513 | etioplast(GO:0009513) |
| 0.0 | 1.5 | GO:0005811 | lipid particle(GO:0005811) |
| 0.0 | 1.0 | GO:0000159 | protein phosphatase type 2A complex(GO:0000159) |
| 0.0 | 0.3 | GO:0098827 | endoplasmic reticulum tubular network(GO:0071782) endoplasmic reticulum subcompartment(GO:0098827) |
| 0.0 | 0.2 | GO:0044613 | nuclear pore central transport channel(GO:0044613) |
| 0.0 | 1.4 | GO:0000152 | nuclear ubiquitin ligase complex(GO:0000152) |
| 0.0 | 8.4 | GO:0044434 | chloroplast part(GO:0044434) |
| 0.0 | 0.5 | GO:0000784 | nuclear chromosome, telomeric region(GO:0000784) |
| 0.0 | 0.1 | GO:0005846 | nuclear cap binding complex(GO:0005846) |
| 0.0 | 0.7 | GO:0090406 | pollen tube(GO:0090406) |
| 0.0 | 0.1 | GO:0030663 | COPI vesicle coat(GO:0030126) COPI-coated vesicle membrane(GO:0030663) |
| 0.0 | 0.1 | GO:0000126 | transcription factor TFIIIB complex(GO:0000126) |
| 0.0 | 0.1 | GO:0032807 | DNA ligase IV complex(GO:0032807) |
| 0.0 | 1.0 | GO:0022627 | cytosolic small ribosomal subunit(GO:0022627) |
Gene overrepresentation in molecular function category:
| Log-likelihood per target | Total log-likelihood | Term | Description |
|---|---|---|---|
| 2.6 | 7.8 | GO:0051738 | xanthophyll binding(GO:0051738) |
| 1.6 | 4.9 | GO:1990465 | octadecanal decarbonylase activity(GO:0009924) aldehyde decarbonylase activity(GO:0071771) aldehyde oxygenase (deformylating) activity(GO:1990465) |
| 1.6 | 9.3 | GO:0045156 | electron transporter, transferring electrons within the cyclic electron transport pathway of photosynthesis activity(GO:0045156) |
| 1.5 | 4.4 | GO:0016630 | protochlorophyllide reductase activity(GO:0016630) |
| 1.5 | 4.4 | GO:0004071 | aspartate-ammonia ligase activity(GO:0004071) |
| 1.4 | 4.1 | GO:0004807 | triose-phosphate isomerase activity(GO:0004807) |
| 1.4 | 10.9 | GO:0019137 | thioglucosidase activity(GO:0019137) |
| 1.2 | 5.0 | GO:0045548 | phenylalanine ammonia-lyase activity(GO:0045548) |
| 1.2 | 9.2 | GO:0033946 | xyloglucan-specific endo-beta-1,4-glucanase activity(GO:0033946) |
| 1.1 | 36.6 | GO:0004089 | carbonate dehydratase activity(GO:0004089) |
| 1.1 | 3.4 | GO:0046422 | violaxanthin de-epoxidase activity(GO:0046422) |
| 1.1 | 3.4 | GO:0015204 | urea transmembrane transporter activity(GO:0015204) |
| 1.1 | 25.2 | GO:0102336 | 3-oxo-arachidoyl-CoA synthase activity(GO:0102336) 3-oxo-cerotoyl-CoA synthase activity(GO:0102337) 3-oxo-lignoceronyl-CoA synthase activity(GO:0102338) |
| 1.1 | 3.3 | GO:0004830 | tryptophan-tRNA ligase activity(GO:0004830) |
| 1.1 | 5.4 | GO:0042084 | 5-methyltetrahydropteroyltriglutamate-homocysteine S-methyltransferase activity(GO:0003871) methionine synthase activity(GO:0008705) 5-methyltetrahydrofolate-dependent methyltransferase activity(GO:0042084) 5-methyltetrahydropteroyltri-L-glutamate-dependent methyltransferase activity(GO:0042085) |
| 1.1 | 3.2 | GO:0047100 | glyceraldehyde-3-phosphate dehydrogenase (NADP+) (phosphorylating) activity(GO:0047100) |
| 1.0 | 8.3 | GO:0003999 | adenine phosphoribosyltransferase activity(GO:0003999) |
| 1.0 | 3.1 | GO:0004822 | isoleucine-tRNA ligase activity(GO:0004822) |
| 1.0 | 3.1 | GO:0005344 | oxygen transporter activity(GO:0005344) |
| 0.9 | 2.8 | GO:0004013 | adenosylhomocysteinase activity(GO:0004013) trialkylsulfonium hydrolase activity(GO:0016802) |
| 0.9 | 2.8 | GO:0015928 | alpha-L-fucosidase activity(GO:0004560) fucosidase activity(GO:0015928) |
| 0.9 | 3.8 | GO:0004512 | inositol-3-phosphate synthase activity(GO:0004512) |
| 0.9 | 19.9 | GO:0016168 | chlorophyll binding(GO:0016168) |
| 0.9 | 3.4 | GO:0050734 | hydroxycinnamoyltransferase activity(GO:0050734) |
| 0.9 | 2.6 | GO:0045485 | omega-6 fatty acid desaturase activity(GO:0045485) |
| 0.8 | 15.7 | GO:0015250 | water transmembrane transporter activity(GO:0005372) water channel activity(GO:0015250) |
| 0.8 | 4.9 | GO:0003825 | alpha,alpha-trehalose-phosphate synthase (UDP-forming) activity(GO:0003825) |
| 0.8 | 2.4 | GO:0000170 | sphingosine hydroxylase activity(GO:0000170) |
| 0.8 | 9.7 | GO:0047259 | glucomannan 4-beta-mannosyltransferase activity(GO:0047259) |
| 0.8 | 20.0 | GO:0016837 | carbon-oxygen lyase activity, acting on polysaccharides(GO:0016837) pectate lyase activity(GO:0030570) |
| 0.8 | 2.4 | GO:0036381 | pyridoxal 5'-phosphate synthase (glutamine hydrolysing) activity(GO:0036381) |
| 0.8 | 2.4 | GO:0016842 | amidine-lyase activity(GO:0016842) |
| 0.8 | 2.3 | GO:0016642 | glycine dehydrogenase (decarboxylating) activity(GO:0004375) oxidoreductase activity, acting on the CH-NH2 group of donors, disulfide as acceptor(GO:0016642) |
| 0.8 | 5.4 | GO:1990538 | xylan O-acetyltransferase activity(GO:1990538) |
| 0.8 | 2.3 | GO:0010291 | carotene beta-ring hydroxylase activity(GO:0010291) |
| 0.7 | 2.2 | GO:0008883 | glutamyl-tRNA reductase activity(GO:0008883) |
| 0.7 | 2.1 | GO:0003844 | 1,4-alpha-glucan branching enzyme activity(GO:0003844) |
| 0.7 | 0.7 | GO:0046409 | p-coumarate 3-hydroxylase activity(GO:0046409) |
| 0.7 | 2.0 | GO:0080104 | 3-methylthiopropyl glucosinolate S-oxygenase activity(GO:0080102) 5-methylthiopropyl glucosinolate S-oxygenase activity(GO:0080104) 7-methylthiopropyl glucosinolate S-oxygenase activity(GO:0080106) |
| 0.7 | 2.0 | GO:0008311 | phosphodiesterase I activity(GO:0004528) double-stranded DNA 3'-5' exodeoxyribonuclease activity(GO:0008311) |
| 0.7 | 2.0 | GO:0080132 | fatty acid alpha-hydroxylase activity(GO:0080132) |
| 0.7 | 7.3 | GO:0003905 | alkylbase DNA N-glycosylase activity(GO:0003905) DNA-3-methyladenine glycosylase activity(GO:0008725) DNA-3-methylbase glycosylase activity(GO:0043733) |
| 0.7 | 2.0 | GO:0050567 | glutaminyl-tRNA synthase (glutamine-hydrolyzing) activity(GO:0050567) |
| 0.7 | 2.6 | GO:0019156 | isoamylase activity(GO:0019156) |
| 0.6 | 2.5 | GO:0047334 | diphosphate-fructose-6-phosphate 1-phosphotransferase activity(GO:0047334) |
| 0.6 | 3.8 | GO:0018708 | thiol S-methyltransferase activity(GO:0018708) |
| 0.6 | 1.9 | GO:0010283 | pinoresinol reductase activity(GO:0010283) |
| 0.6 | 3.1 | GO:0004333 | fumarate hydratase activity(GO:0004333) |
| 0.6 | 8.5 | GO:0004332 | fructose-bisphosphate aldolase activity(GO:0004332) |
| 0.6 | 2.4 | GO:0004350 | glutamate 5-kinase activity(GO:0004349) glutamate-5-semialdehyde dehydrogenase activity(GO:0004350) |
| 0.6 | 7.3 | GO:0103075 | indole-3-pyruvate monooxygenase activity(GO:0103075) |
| 0.6 | 2.4 | GO:0009784 | transmembrane receptor histidine kinase activity(GO:0009784) transmembrane histidine kinase cytokinin receptor activity(GO:0009885) |
| 0.6 | 12.0 | GO:0005089 | Rho guanyl-nucleotide exchange factor activity(GO:0005089) |
| 0.6 | 6.6 | GO:0008574 | ATP-dependent microtubule motor activity, plus-end-directed(GO:0008574) |
| 0.6 | 3.6 | GO:0022829 | porin activity(GO:0015288) wide pore channel activity(GO:0022829) |
| 0.6 | 2.9 | GO:0034432 | bis(5'-adenosyl)-pentaphosphatase activity(GO:0034432) |
| 0.6 | 3.5 | GO:0003983 | UTP:glucose-1-phosphate uridylyltransferase activity(GO:0003983) |
| 0.6 | 2.3 | GO:0008395 | steroid hydroxylase activity(GO:0008395) |
| 0.6 | 7.2 | GO:0042389 | omega-3 fatty acid desaturase activity(GO:0042389) |
| 0.5 | 2.7 | GO:0035197 | siRNA binding(GO:0035197) |
| 0.5 | 2.7 | GO:0004001 | adenosine kinase activity(GO:0004001) |
| 0.5 | 1.6 | GO:0005034 | osmosensor activity(GO:0005034) |
| 0.5 | 2.7 | GO:0016463 | cadmium-transporting ATPase activity(GO:0015434) zinc-exporting ATPase activity(GO:0016463) |
| 0.5 | 2.1 | GO:0046593 | mandelonitrile lyase activity(GO:0046593) |
| 0.5 | 2.1 | GO:0004075 | biotin carboxylase activity(GO:0004075) |
| 0.5 | 4.7 | GO:0010428 | methyl-CpNpG binding(GO:0010428) methyl-CpNpN binding(GO:0010429) |
| 0.5 | 2.6 | GO:0045544 | gibberellin 20-oxidase activity(GO:0045544) |
| 0.5 | 2.5 | GO:0031957 | very long-chain fatty acid-CoA ligase activity(GO:0031957) |
| 0.5 | 2.0 | GO:0004729 | oxygen-dependent protoporphyrinogen oxidase activity(GO:0004729) protoporphyrinogen oxidase activity(GO:0070818) |
| 0.5 | 1.5 | GO:0004133 | glycogen debranching enzyme activity(GO:0004133) 4-alpha-glucanotransferase activity(GO:0004134) |
| 0.5 | 1.5 | GO:0044540 | L-cystine L-cysteine-lyase (deaminating)(GO:0044540) |
| 0.5 | 2.9 | GO:0047769 | prephenate dehydratase activity(GO:0004664) arogenate dehydratase activity(GO:0047769) |
| 0.5 | 10.4 | GO:0080161 | auxin transmembrane transporter activity(GO:0080161) |
| 0.5 | 3.3 | GO:0071933 | protein kinase A regulatory subunit binding(GO:0034237) protein kinase A binding(GO:0051018) Arp2/3 complex binding(GO:0071933) |
| 0.5 | 2.8 | GO:0050017 | L-3-cyanoalanine synthase activity(GO:0050017) |
| 0.5 | 2.3 | GO:0005544 | calcium-dependent phospholipid binding(GO:0005544) |
| 0.5 | 2.8 | GO:0004126 | cytidine deaminase activity(GO:0004126) |
| 0.4 | 1.8 | GO:0080116 | glucuronoxylan glucuronosyltransferase activity(GO:0080116) |
| 0.4 | 1.8 | GO:0070402 | NADPH binding(GO:0070402) |
| 0.4 | 11.2 | GO:0004565 | beta-galactosidase activity(GO:0004565) |
| 0.4 | 1.8 | GO:0004820 | glycine-tRNA ligase activity(GO:0004820) |
| 0.4 | 3.6 | GO:0004392 | heme oxygenase (decyclizing) activity(GO:0004392) |
| 0.4 | 4.9 | GO:0016723 | ferric-chelate reductase activity(GO:0000293) oxidoreductase activity, oxidizing metal ions, NAD or NADP as acceptor(GO:0016723) |
| 0.4 | 2.2 | GO:0008964 | phosphoenolpyruvate carboxylase activity(GO:0008964) |
| 0.4 | 4.4 | GO:0004312 | fatty acid synthase activity(GO:0004312) |
| 0.4 | 2.1 | GO:0046715 | borate transmembrane transporter activity(GO:0046715) borate efflux transmembrane transporter activity(GO:0080139) |
| 0.4 | 2.5 | GO:0005230 | ionotropic glutamate receptor activity(GO:0004970) extracellular ligand-gated ion channel activity(GO:0005230) transmitter-gated ion channel activity(GO:0022824) transmitter-gated channel activity(GO:0022835) neurotransmitter receptor activity(GO:0030594) |
| 0.4 | 0.4 | GO:0070180 | large ribosomal subunit rRNA binding(GO:0070180) |
| 0.4 | 1.6 | GO:0035174 | histone serine kinase activity(GO:0035174) histone kinase activity (H3-S10 specific)(GO:0035175) |
| 0.4 | 1.6 | GO:0035241 | protein-arginine omega-N monomethyltransferase activity(GO:0035241) |
| 0.4 | 3.2 | GO:0008083 | growth factor activity(GO:0008083) |
| 0.4 | 9.8 | GO:0016762 | xyloglucan:xyloglucosyl transferase activity(GO:0016762) |
| 0.4 | 1.2 | GO:0016728 | ribonucleoside-diphosphate reductase activity, thioredoxin disulfide as acceptor(GO:0004748) oxidoreductase activity, acting on CH or CH2 groups, disulfide as acceptor(GO:0016728) ribonucleoside-diphosphate reductase activity(GO:0061731) |
| 0.4 | 1.5 | GO:0016707 | gibberellin 3-beta-dioxygenase activity(GO:0016707) |
| 0.4 | 3.5 | GO:0004550 | nucleoside diphosphate kinase activity(GO:0004550) |
| 0.4 | 1.5 | GO:0042299 | lupeol synthase activity(GO:0042299) |
| 0.4 | 1.5 | GO:0004831 | tyrosine-tRNA ligase activity(GO:0004831) |
| 0.4 | 4.2 | GO:0004784 | superoxide dismutase activity(GO:0004784) oxidoreductase activity, acting on superoxide radicals as acceptor(GO:0016721) |
| 0.4 | 23.8 | GO:0003777 | microtubule motor activity(GO:0003777) |
| 0.4 | 1.1 | GO:1990404 | protein ADP-ribosylase activity(GO:1990404) |
| 0.4 | 1.9 | GO:0010277 | chlorophyllide a oxygenase [overall] activity(GO:0010277) |
| 0.4 | 2.2 | GO:0017057 | 6-phosphogluconolactonase activity(GO:0017057) |
| 0.4 | 1.1 | GO:0047912 | galacturonokinase activity(GO:0047912) |
| 0.4 | 1.4 | GO:0047498 | calcium-dependent phospholipase A2 activity(GO:0047498) |
| 0.3 | 2.4 | GO:0003906 | DNA-(apurinic or apyrimidinic site) lyase activity(GO:0003906) |
| 0.3 | 1.4 | GO:0052739 | phosphatidylserine 1-acylhydrolase activity(GO:0052739) 1-acyl-2-lysophosphatidylserine acylhydrolase activity(GO:0052740) |
| 0.3 | 1.0 | GO:0009374 | biotin binding(GO:0009374) |
| 0.3 | 7.5 | GO:0052716 | hydroquinone:oxygen oxidoreductase activity(GO:0052716) |
| 0.3 | 1.0 | GO:0004014 | adenosylmethionine decarboxylase activity(GO:0004014) |
| 0.3 | 1.0 | GO:0004563 | beta-N-acetylhexosaminidase activity(GO:0004563) |
| 0.3 | 1.3 | GO:0004367 | glycerol-3-phosphate dehydrogenase [NAD+] activity(GO:0004367) |
| 0.3 | 1.7 | GO:0016752 | sinapoyltransferase activity(GO:0016752) O-sinapoyltransferase activity(GO:0016753) |
| 0.3 | 2.0 | GO:0050105 | L-gulonolactone oxidase activity(GO:0050105) |
| 0.3 | 0.3 | GO:0035173 | histone kinase activity(GO:0035173) |
| 0.3 | 1.6 | GO:0004765 | shikimate kinase activity(GO:0004765) |
| 0.3 | 2.6 | GO:0052623 | ATP dimethylallyltransferase activity(GO:0052622) ADP dimethylallyltransferase activity(GO:0052623) |
| 0.3 | 2.5 | GO:0070696 | transmembrane receptor protein serine/threonine kinase binding(GO:0070696) |
| 0.3 | 0.9 | GO:0080045 | quercetin 3'-O-glucosyltransferase activity(GO:0080045) |
| 0.3 | 1.5 | GO:0004816 | asparagine-tRNA ligase activity(GO:0004816) |
| 0.3 | 1.5 | GO:0004148 | dihydrolipoyl dehydrogenase activity(GO:0004148) |
| 0.3 | 3.0 | GO:0003886 | DNA (cytosine-5-)-methyltransferase activity(GO:0003886) |
| 0.3 | 1.2 | GO:0004751 | ribose-5-phosphate isomerase activity(GO:0004751) |
| 0.3 | 2.4 | GO:0004559 | alpha-mannosidase activity(GO:0004559) |
| 0.3 | 0.9 | GO:0036310 | annealing helicase activity(GO:0036310) |
| 0.3 | 9.7 | GO:0005200 | structural constituent of cytoskeleton(GO:0005200) |
| 0.3 | 1.8 | GO:0050062 | long-chain-fatty-acyl-CoA reductase activity(GO:0050062) |
| 0.3 | 2.6 | GO:0016423 | tRNA (guanine) methyltransferase activity(GO:0016423) |
| 0.3 | 0.9 | GO:0015173 | aromatic amino acid transmembrane transporter activity(GO:0015173) |
| 0.3 | 4.0 | GO:0008889 | glycerophosphodiester phosphodiesterase activity(GO:0008889) |
| 0.3 | 1.4 | GO:0019104 | DNA N-glycosylase activity(GO:0019104) |
| 0.3 | 7.6 | GO:0008810 | cellulase activity(GO:0008810) |
| 0.3 | 2.5 | GO:0016464 | chloroplast protein-transporting ATPase activity(GO:0016464) |
| 0.3 | 0.8 | GO:0019904 | protein domain specific binding(GO:0019904) |
| 0.3 | 1.4 | GO:0030267 | glyoxylate reductase (NADP) activity(GO:0030267) |
| 0.3 | 2.2 | GO:0000095 | S-adenosyl-L-methionine transmembrane transporter activity(GO:0000095) coenzyme transporter activity(GO:0051185) |
| 0.3 | 8.0 | GO:0008266 | poly(U) RNA binding(GO:0008266) |
| 0.3 | 1.9 | GO:0080019 | fatty-acyl-CoA reductase (alcohol-forming) activity(GO:0080019) |
| 0.3 | 1.3 | GO:0004365 | glyceraldehyde-3-phosphate dehydrogenase (NAD+) (phosphorylating) activity(GO:0004365) glyceraldehyde-3-phosphate dehydrogenase (NAD(P)+) (phosphorylating) activity(GO:0043891) |
| 0.3 | 7.7 | GO:0047262 | polygalacturonate 4-alpha-galacturonosyltransferase activity(GO:0047262) |
| 0.3 | 1.3 | GO:0003979 | UDP-glucose 6-dehydrogenase activity(GO:0003979) |
| 0.3 | 0.8 | GO:0010521 | telomerase inhibitor activity(GO:0010521) |
| 0.3 | 1.0 | GO:0070330 | oxidoreductase activity, acting on paired donors, with incorporation or reduction of molecular oxygen, reduced flavin or flavoprotein as one donor, and incorporation of one atom of oxygen(GO:0016712) aromatase activity(GO:0070330) |
| 0.3 | 0.5 | GO:0019789 | SUMO transferase activity(GO:0019789) |
| 0.3 | 2.5 | GO:0016688 | L-ascorbate peroxidase activity(GO:0016688) |
| 0.3 | 0.8 | GO:0004347 | glucose-6-phosphate isomerase activity(GO:0004347) |
| 0.3 | 0.5 | GO:0003977 | UDP-N-acetylglucosamine diphosphorylase activity(GO:0003977) |
| 0.3 | 16.3 | GO:0004650 | polygalacturonase activity(GO:0004650) |
| 0.3 | 1.3 | GO:0015367 | oxoglutarate:malate antiporter activity(GO:0015367) |
| 0.2 | 27.9 | GO:0004252 | serine-type endopeptidase activity(GO:0004252) |
| 0.2 | 0.7 | GO:0004412 | homoserine dehydrogenase activity(GO:0004412) |
| 0.2 | 2.0 | GO:0004566 | beta-glucuronidase activity(GO:0004566) |
| 0.2 | 2.5 | GO:0008169 | C-methyltransferase activity(GO:0008169) |
| 0.2 | 1.0 | GO:0042132 | fructose 1,6-bisphosphate 1-phosphatase activity(GO:0042132) |
| 0.2 | 2.0 | GO:0004864 | protein phosphatase inhibitor activity(GO:0004864) |
| 0.2 | 1.2 | GO:0016768 | spermine synthase activity(GO:0016768) |
| 0.2 | 0.7 | GO:0004150 | dihydroneopterin aldolase activity(GO:0004150) |
| 0.2 | 2.4 | GO:0004602 | glutathione peroxidase activity(GO:0004602) |
| 0.2 | 2.1 | GO:0009378 | four-way junction helicase activity(GO:0009378) |
| 0.2 | 0.9 | GO:0004077 | biotin-[acetyl-CoA-carboxylase] ligase activity(GO:0004077) biotin-protein ligase activity(GO:0018271) |
| 0.2 | 11.3 | GO:0070008 | serine-type carboxypeptidase activity(GO:0004185) serine-type exopeptidase activity(GO:0070008) |
| 0.2 | 4.5 | GO:0005199 | structural constituent of cell wall(GO:0005199) |
| 0.2 | 2.5 | GO:0044620 | ACP phosphopantetheine attachment site binding involved in fatty acid biosynthetic process(GO:0000036) ACP phosphopantetheine attachment site binding(GO:0044620) prosthetic group binding(GO:0051192) |
| 0.2 | 0.7 | GO:0003864 | 3-methyl-2-oxobutanoate hydroxymethyltransferase activity(GO:0003864) |
| 0.2 | 3.4 | GO:0047196 | long-chain-alcohol O-fatty-acyltransferase activity(GO:0047196) |
| 0.2 | 1.1 | GO:0004478 | methionine adenosyltransferase activity(GO:0004478) |
| 0.2 | 1.9 | GO:0043495 | protein anchor(GO:0043495) |
| 0.2 | 0.9 | GO:0004400 | histidinol-phosphate transaminase activity(GO:0004400) |
| 0.2 | 0.6 | GO:0004826 | phenylalanine-tRNA ligase activity(GO:0004826) |
| 0.2 | 1.0 | GO:0004594 | pantothenate kinase activity(GO:0004594) |
| 0.2 | 2.5 | GO:0000774 | adenyl-nucleotide exchange factor activity(GO:0000774) |
| 0.2 | 1.7 | GO:0050307 | sucrose-phosphate phosphatase activity(GO:0050307) |
| 0.2 | 0.6 | GO:0004450 | isocitrate dehydrogenase (NADP+) activity(GO:0004450) |
| 0.2 | 2.7 | GO:0016833 | oxo-acid-lyase activity(GO:0016833) |
| 0.2 | 1.0 | GO:0008430 | selenium binding(GO:0008430) |
| 0.2 | 1.0 | GO:0000048 | peptidyltransferase activity(GO:0000048) glutathione hydrolase activity(GO:0036374) |
| 0.2 | 1.6 | GO:0046933 | proton-transporting ATP synthase activity, rotational mechanism(GO:0046933) |
| 0.2 | 1.4 | GO:0004645 | phosphorylase activity(GO:0004645) |
| 0.2 | 2.2 | GO:0016161 | beta-amylase activity(GO:0016161) |
| 0.2 | 4.0 | GO:0003688 | DNA replication origin binding(GO:0003688) |
| 0.2 | 1.0 | GO:0043682 | copper-transporting ATPase activity(GO:0043682) |
| 0.2 | 0.8 | GO:0003862 | 3-isopropylmalate dehydrogenase activity(GO:0003862) |
| 0.2 | 1.8 | GO:0051903 | S-(hydroxymethyl)glutathione dehydrogenase activity(GO:0051903) |
| 0.2 | 1.6 | GO:0051011 | microtubule minus-end binding(GO:0051011) |
| 0.2 | 0.8 | GO:0001227 | transcriptional repressor activity, RNA polymerase II transcription regulatory region sequence-specific binding(GO:0001227) |
| 0.2 | 1.2 | GO:0003878 | ATP citrate synthase activity(GO:0003878) |
| 0.2 | 0.8 | GO:0008905 | mannose-1-phosphate guanylyltransferase activity(GO:0004475) mannose-phosphate guanylyltransferase activity(GO:0008905) |
| 0.2 | 0.4 | GO:0004766 | spermidine synthase activity(GO:0004766) |
| 0.2 | 1.8 | GO:0010340 | carboxyl-O-methyltransferase activity(GO:0010340) |
| 0.2 | 0.6 | GO:0004044 | amidophosphoribosyltransferase activity(GO:0004044) |
| 0.2 | 1.8 | GO:0002094 | polyprenyltransferase activity(GO:0002094) |
| 0.2 | 1.6 | GO:0004020 | adenylylsulfate kinase activity(GO:0004020) |
| 0.2 | 11.9 | GO:0046910 | pectinesterase inhibitor activity(GO:0046910) |
| 0.2 | 2.1 | GO:0033926 | glycopeptide alpha-N-acetylgalactosaminidase activity(GO:0033926) |
| 0.2 | 9.2 | GO:0004190 | aspartic-type endopeptidase activity(GO:0004190) |
| 0.2 | 0.7 | GO:0080118 | brassinosteroid sulfotransferase activity(GO:0080118) |
| 0.2 | 4.0 | GO:0016868 | intramolecular transferase activity, phosphotransferases(GO:0016868) |
| 0.2 | 0.9 | GO:0010313 | phytochrome binding(GO:0010313) |
| 0.2 | 0.3 | GO:0003959 | NADPH dehydrogenase activity(GO:0003959) |
| 0.2 | 0.7 | GO:0005353 | fructose transmembrane transporter activity(GO:0005353) |
| 0.2 | 0.7 | GO:0070182 | DNA polymerase binding(GO:0070182) |
| 0.2 | 2.7 | GO:0008146 | sulfotransferase activity(GO:0008146) |
| 0.2 | 1.5 | GO:0071617 | lysophospholipid acyltransferase activity(GO:0071617) |
| 0.2 | 0.7 | GO:0047724 | inosine nucleosidase activity(GO:0047724) |
| 0.2 | 0.8 | GO:0046577 | long-chain-alcohol oxidase activity(GO:0046577) |
| 0.2 | 0.5 | GO:0003861 | 3-isopropylmalate dehydratase activity(GO:0003861) |
| 0.2 | 1.1 | GO:0016621 | cinnamoyl-CoA reductase activity(GO:0016621) |
| 0.2 | 0.6 | GO:0004640 | phosphoribosylanthranilate isomerase activity(GO:0004640) |
| 0.2 | 1.1 | GO:0046030 | inositol trisphosphate phosphatase activity(GO:0046030) |
| 0.2 | 0.6 | GO:0080097 | L-tryptophan:pyruvate aminotransferase activity(GO:0080097) |
| 0.2 | 1.7 | GO:0008199 | ferric iron binding(GO:0008199) |
| 0.2 | 1.4 | GO:0015271 | outward rectifier potassium channel activity(GO:0015271) |
| 0.2 | 1.2 | GO:0004180 | carboxypeptidase activity(GO:0004180) |
| 0.2 | 0.9 | GO:0017150 | tRNA dihydrouridine synthase activity(GO:0017150) |
| 0.1 | 1.8 | GO:0031176 | endo-1,4-beta-xylanase activity(GO:0031176) |
| 0.1 | 0.4 | GO:0050412 | cinnamate beta-D-glucosyltransferase activity(GO:0050412) |
| 0.1 | 1.3 | GO:0004526 | ribonuclease P activity(GO:0004526) |
| 0.1 | 2.9 | GO:0080031 | methyl salicylate esterase activity(GO:0080031) methyl jasmonate esterase activity(GO:0080032) |
| 0.1 | 0.4 | GO:0015026 | coreceptor activity(GO:0015026) |
| 0.1 | 4.4 | GO:0016655 | oxidoreductase activity, acting on NAD(P)H, quinone or similar compound as acceptor(GO:0016655) |
| 0.1 | 0.4 | GO:0004034 | aldose 1-epimerase activity(GO:0004034) |
| 0.1 | 0.4 | GO:0001130 | bacterial-type RNA polymerase transcription factor activity, sequence-specific DNA binding(GO:0001130) bacterial-type RNA polymerase transcriptional activator activity, sequence-specific DNA binding(GO:0001216) |
| 0.1 | 1.0 | GO:0047274 | galactinol-sucrose galactosyltransferase activity(GO:0047274) |
| 0.1 | 0.4 | GO:0019136 | deoxynucleoside kinase activity(GO:0019136) |
| 0.1 | 0.4 | GO:0003848 | 2-amino-4-hydroxy-6-hydroxymethyldihydropteridine diphosphokinase activity(GO:0003848) dihydropteroate synthase activity(GO:0004156) |
| 0.1 | 2.5 | GO:0000822 | inositol hexakisphosphate binding(GO:0000822) |
| 0.1 | 0.8 | GO:0045431 | flavonol synthase activity(GO:0045431) |
| 0.1 | 0.5 | GO:0046423 | allene-oxide cyclase activity(GO:0046423) |
| 0.1 | 1.2 | GO:0016646 | oxidoreductase activity, acting on the CH-NH group of donors, NAD or NADP as acceptor(GO:0016646) |
| 0.1 | 0.9 | GO:0005452 | inorganic anion exchanger activity(GO:0005452) |
| 0.1 | 0.9 | GO:0008121 | ubiquinol-cytochrome-c reductase activity(GO:0008121) oxidoreductase activity, acting on diphenols and related substances as donors, cytochrome as acceptor(GO:0016681) |
| 0.1 | 0.8 | GO:0003913 | DNA photolyase activity(GO:0003913) |
| 0.1 | 0.5 | GO:0042781 | 3'-tRNA processing endoribonuclease activity(GO:0042781) |
| 0.1 | 9.1 | GO:0008017 | microtubule binding(GO:0008017) |
| 0.1 | 1.0 | GO:0043539 | protein serine/threonine kinase activator activity(GO:0043539) |
| 0.1 | 0.9 | GO:0008878 | glucose-1-phosphate adenylyltransferase activity(GO:0008878) |
| 0.1 | 0.9 | GO:0022833 | mechanically-gated ion channel activity(GO:0008381) mechanically gated channel activity(GO:0022833) |
| 0.1 | 0.9 | GO:0032977 | membrane insertase activity(GO:0032977) |
| 0.1 | 0.5 | GO:0030742 | GTP-dependent protein binding(GO:0030742) |
| 0.1 | 15.3 | GO:0009055 | electron carrier activity(GO:0009055) |
| 0.1 | 1.7 | GO:0016308 | 1-phosphatidylinositol-4-phosphate 5-kinase activity(GO:0016308) |
| 0.1 | 3.5 | GO:0000146 | microfilament motor activity(GO:0000146) actin-dependent ATPase activity(GO:0030898) |
| 0.1 | 0.5 | GO:0070140 | ubiquitin-like protein-specific isopeptidase activity(GO:0070138) SUMO-specific isopeptidase activity(GO:0070140) |
| 0.1 | 0.8 | GO:0051184 | cofactor transporter activity(GO:0051184) |
| 0.1 | 1.2 | GO:0002161 | aminoacyl-tRNA editing activity(GO:0002161) |
| 0.1 | 0.6 | GO:0016819 | hydrolase activity, acting on acid anhydrides, in sulfonyl-containing anhydrides(GO:0016819) adenylylsulfatase activity(GO:0047627) |
| 0.1 | 1.2 | GO:0016884 | carbon-nitrogen ligase activity, with glutamine as amido-N-donor(GO:0016884) |
| 0.1 | 0.6 | GO:0045502 | dynein binding(GO:0045502) dynein intermediate chain binding(GO:0045505) dynein light intermediate chain binding(GO:0051959) |
| 0.1 | 0.6 | GO:0043765 | T/G mismatch-specific endonuclease activity(GO:0043765) |
| 0.1 | 0.8 | GO:0003830 | beta-1,4-mannosylglycoprotein 4-beta-N-acetylglucosaminyltransferase activity(GO:0003830) |
| 0.1 | 2.8 | GO:0009975 | cyclase activity(GO:0009975) |
| 0.1 | 0.4 | GO:0016034 | maleylacetoacetate isomerase activity(GO:0016034) |
| 0.1 | 2.1 | GO:0022839 | calcium activated cation channel activity(GO:0005227) ion gated channel activity(GO:0022839) |
| 0.1 | 0.4 | GO:0019825 | oxygen binding(GO:0019825) |
| 0.1 | 1.1 | GO:0004351 | glutamate decarboxylase activity(GO:0004351) |
| 0.1 | 1.4 | GO:0003689 | DNA clamp loader activity(GO:0003689) protein-DNA loading ATPase activity(GO:0033170) |
| 0.1 | 1.7 | GO:0030983 | mismatched DNA binding(GO:0030983) |
| 0.1 | 0.4 | GO:0008297 | single-stranded DNA exodeoxyribonuclease activity(GO:0008297) |
| 0.1 | 0.4 | GO:0019534 | tetracycline transporter activity(GO:0008493) toxin transporter activity(GO:0019534) antibiotic transporter activity(GO:0042895) |
| 0.1 | 0.4 | GO:0004112 | cyclic-nucleotide phosphodiesterase activity(GO:0004112) 2',3'-cyclic-nucleotide 3'-phosphodiesterase activity(GO:0004113) |
| 0.1 | 0.3 | GO:0004514 | nicotinate-nucleotide diphosphorylase (carboxylating) activity(GO:0004514) |
| 0.1 | 0.3 | GO:0046920 | alpha-(1->3)-fucosyltransferase activity(GO:0046920) |
| 0.1 | 1.4 | GO:0031559 | lanosterol synthase activity(GO:0000250) oxidosqualene cyclase activity(GO:0031559) |
| 0.1 | 0.6 | GO:0050378 | UDP-glucuronate 4-epimerase activity(GO:0050378) |
| 0.1 | 0.9 | GO:0017048 | Rho GTPase binding(GO:0017048) |
| 0.1 | 3.5 | GO:0033612 | receptor serine/threonine kinase binding(GO:0033612) |
| 0.1 | 4.6 | GO:0004523 | RNA-DNA hybrid ribonuclease activity(GO:0004523) |
| 0.1 | 1.4 | GO:0045551 | cinnamyl-alcohol dehydrogenase activity(GO:0045551) |
| 0.1 | 1.4 | GO:0004176 | ATP-dependent peptidase activity(GO:0004176) |
| 0.1 | 18.5 | GO:0043531 | ADP binding(GO:0043531) |
| 0.1 | 0.6 | GO:0015181 | arginine transmembrane transporter activity(GO:0015181) L-lysine transmembrane transporter activity(GO:0015189) |
| 0.1 | 0.5 | GO:0033744 | L-methionine:thioredoxin-disulfide S-oxidoreductase activity(GO:0033744) L-methionine-(S)-S-oxide reductase activity(GO:0036456) |
| 0.1 | 24.2 | GO:0003735 | structural constituent of ribosome(GO:0003735) |
| 0.1 | 0.7 | GO:0019158 | glucokinase activity(GO:0004340) glucose binding(GO:0005536) mannokinase activity(GO:0019158) |
| 0.1 | 0.4 | GO:0050347 | trans-octaprenyltranstransferase activity(GO:0050347) all-trans-nonaprenyl-diphosphate synthase (geranylgeranyl-diphosphate specific) activity(GO:0052924) |
| 0.1 | 0.9 | GO:1990757 | ubiquitin ligase activator activity(GO:1990757) |
| 0.1 | 0.3 | GO:0004042 | acetyl-CoA:L-glutamate N-acetyltransferase activity(GO:0004042) |
| 0.1 | 0.3 | GO:0000225 | N-acetylglucosaminylphosphatidylinositol deacetylase activity(GO:0000225) |
| 0.1 | 0.2 | GO:0047517 | 1,4-beta-D-xylan synthase activity(GO:0047517) |
| 0.1 | 0.7 | GO:0000254 | C-4 methylsterol oxidase activity(GO:0000254) |
| 0.1 | 0.8 | GO:0019843 | rRNA binding(GO:0019843) |
| 0.1 | 0.4 | GO:0070042 | rRNA (uridine) methyltransferase activity(GO:0016436) rRNA (uridine-N3-)-methyltransferase activity(GO:0070042) |
| 0.1 | 0.5 | GO:0051996 | farnesyl-diphosphate farnesyltransferase activity(GO:0004310) squalene synthase activity(GO:0051996) |
| 0.1 | 0.5 | GO:0050308 | sugar-phosphatase activity(GO:0050308) |
| 0.1 | 0.3 | GO:0042409 | caffeoyl-CoA O-methyltransferase activity(GO:0042409) |
| 0.1 | 1.9 | GO:0008171 | O-methyltransferase activity(GO:0008171) |
| 0.1 | 0.2 | GO:0047560 | 3-dehydrosphinganine reductase activity(GO:0047560) |
| 0.1 | 0.2 | GO:0004353 | glutamate dehydrogenase [NAD(P)+] activity(GO:0004353) |
| 0.1 | 0.1 | GO:0048027 | mRNA 5'-UTR binding(GO:0048027) |
| 0.1 | 0.4 | GO:0000400 | four-way junction DNA binding(GO:0000400) |
| 0.1 | 0.4 | GO:0019144 | ADP-sugar diphosphatase activity(GO:0019144) ADP-ribose pyrophosphohydrolase activity(GO:0080041) |
| 0.1 | 0.5 | GO:0019206 | uridine kinase activity(GO:0004849) nucleoside kinase activity(GO:0019206) |
| 0.1 | 0.9 | GO:0032440 | 2-alkenal reductase [NAD(P)] activity(GO:0032440) |
| 0.1 | 0.2 | GO:0008172 | S-methyltransferase activity(GO:0008172) |
| 0.1 | 0.8 | GO:0034485 | phosphatidylinositol-3,4,5-trisphosphate 5-phosphatase activity(GO:0034485) |
| 0.1 | 0.1 | GO:0071917 | triose-phosphate transmembrane transporter activity(GO:0071917) |
| 0.1 | 0.2 | GO:0005078 | MAP-kinase scaffold activity(GO:0005078) protein kinase C binding(GO:0005080) protein complex scaffold(GO:0032947) signaling adaptor activity(GO:0035591) |
| 0.1 | 1.7 | GO:0004805 | trehalose-phosphatase activity(GO:0004805) |
| 0.1 | 0.6 | GO:0004930 | G-protein coupled receptor activity(GO:0004930) |
| 0.1 | 0.5 | GO:0017108 | 5'-flap endonuclease activity(GO:0017108) |
| 0.1 | 0.7 | GO:0003918 | DNA topoisomerase type II (ATP-hydrolyzing) activity(GO:0003918) DNA topoisomerase II activity(GO:0061505) |
| 0.1 | 0.3 | GO:0008198 | ferrous iron binding(GO:0008198) |
| 0.1 | 0.6 | GO:0000210 | NAD+ diphosphatase activity(GO:0000210) |
| 0.1 | 0.2 | GO:0047874 | dolichyldiphosphatase activity(GO:0047874) |
| 0.1 | 0.8 | GO:0046556 | alpha-L-arabinofuranosidase activity(GO:0046556) |
| 0.1 | 0.7 | GO:0030060 | L-malate dehydrogenase activity(GO:0030060) |
| 0.1 | 0.1 | GO:0004106 | chorismate mutase activity(GO:0004106) |
| 0.1 | 0.2 | GO:0010280 | UDP-L-rhamnose synthase activity(GO:0010280) UDP-glucose 4,6-dehydratase activity(GO:0050377) |
| 0.1 | 0.4 | GO:0003968 | RNA-directed RNA polymerase activity(GO:0003968) |
| 0.1 | 0.3 | GO:1990841 | promoter-specific chromatin binding(GO:1990841) |
| 0.1 | 0.3 | GO:0052691 | UDP-arabinopyranose mutase activity(GO:0052691) |
| 0.1 | 0.2 | GO:0050291 | sphingosine N-acyltransferase activity(GO:0050291) |
| 0.1 | 0.8 | GO:0016207 | 4-coumarate-CoA ligase activity(GO:0016207) |
| 0.1 | 0.3 | GO:0009881 | photoreceptor activity(GO:0009881) blue light photoreceptor activity(GO:0009882) |
| 0.0 | 0.7 | GO:0030955 | pyruvate kinase activity(GO:0004743) potassium ion binding(GO:0030955) alkali metal ion binding(GO:0031420) |
| 0.0 | 0.2 | GO:0003680 | AT DNA binding(GO:0003680) |
| 0.0 | 14.0 | GO:0000981 | RNA polymerase II transcription factor activity, sequence-specific DNA binding(GO:0000981) |
| 0.0 | 0.8 | GO:0008106 | aldo-keto reductase (NADP) activity(GO:0004033) alcohol dehydrogenase (NADP+) activity(GO:0008106) |
| 0.0 | 6.3 | GO:0008168 | methyltransferase activity(GO:0008168) |
| 0.0 | 0.3 | GO:0036080 | purine nucleotide-sugar transmembrane transporter activity(GO:0036080) |
| 0.0 | 0.2 | GO:0016653 | oxidoreductase activity, acting on NAD(P)H, heme protein as acceptor(GO:0016653) |
| 0.0 | 0.1 | GO:0046027 | phospholipid:diacylglycerol acyltransferase activity(GO:0046027) |
| 0.0 | 0.2 | GO:0003987 | acetate-CoA ligase activity(GO:0003987) |
| 0.0 | 0.3 | GO:0016730 | oxidoreductase activity, acting on iron-sulfur proteins as donors(GO:0016730) |
| 0.0 | 0.2 | GO:0030942 | endoplasmic reticulum signal peptide binding(GO:0030942) |
| 0.0 | 0.1 | GO:0004609 | phosphatidylserine decarboxylase activity(GO:0004609) |
| 0.0 | 0.5 | GO:0000990 | transcription factor activity, core RNA polymerase binding(GO:0000990) |
| 0.0 | 0.1 | GO:0035312 | 5'-3' exodeoxyribonuclease activity(GO:0035312) |
| 0.0 | 0.6 | GO:0032296 | ribonuclease III activity(GO:0004525) double-stranded RNA-specific ribonuclease activity(GO:0032296) |
| 0.0 | 0.2 | GO:0004535 | poly(A)-specific ribonuclease activity(GO:0004535) |
| 0.0 | 0.1 | GO:0008481 | sphinganine kinase activity(GO:0008481) |
| 0.0 | 0.1 | GO:0016165 | linoleate 13S-lipoxygenase activity(GO:0016165) |
| 0.0 | 0.2 | GO:0003909 | DNA ligase activity(GO:0003909) DNA ligase (ATP) activity(GO:0003910) ligase activity, forming phosphoric ester bonds(GO:0016886) |
| 0.0 | 0.1 | GO:0008253 | 5'-nucleotidase activity(GO:0008253) |
| 0.0 | 0.2 | GO:0003997 | acyl-CoA oxidase activity(GO:0003997) |
| 0.0 | 0.2 | GO:0004096 | catalase activity(GO:0004096) |
| 0.0 | 0.3 | GO:0016847 | 1-aminocyclopropane-1-carboxylate synthase activity(GO:0016847) |
| 0.0 | 0.1 | GO:0016453 | acetyl-CoA C-acetyltransferase activity(GO:0003985) C-acetyltransferase activity(GO:0016453) |
| 0.0 | 1.1 | GO:0005484 | SNAP receptor activity(GO:0005484) |
| 0.0 | 0.9 | GO:0003993 | acid phosphatase activity(GO:0003993) |
| 0.0 | 8.9 | GO:0046983 | protein dimerization activity(GO:0046983) |
| 0.0 | 0.1 | GO:0008443 | phosphofructokinase activity(GO:0008443) |
| 0.0 | 0.7 | GO:0000156 | phosphorelay response regulator activity(GO:0000156) |
| 0.0 | 1.1 | GO:0051015 | actin filament binding(GO:0051015) |
| 0.0 | 0.1 | GO:0004605 | phosphatidate cytidylyltransferase activity(GO:0004605) |
| 0.0 | 0.3 | GO:0042973 | glucan endo-1,3-beta-D-glucosidase activity(GO:0042973) |
| 0.0 | 0.1 | GO:0016880 | ammonia ligase activity(GO:0016211) acid-ammonia (or amide) ligase activity(GO:0016880) |
| 0.0 | 0.2 | GO:0015386 | potassium:proton antiporter activity(GO:0015386) |
| 0.0 | 0.5 | GO:0008320 | protein transmembrane transporter activity(GO:0008320) macromolecule transmembrane transporter activity(GO:0022884) |
| 0.0 | 0.1 | GO:0035673 | oligopeptide transmembrane transporter activity(GO:0035673) peptide transmembrane transporter activity(GO:1904680) |
Gene overrepresentation in curated gene sets: canonical pathways category:
| Log-likelihood per target | Total log-likelihood | Term | Description |
|---|---|---|---|
| 2.4 | 18.8 | PID CMYB PATHWAY | C-MYB transcription factor network |
| 1.3 | 5.3 | ST WNT BETA CATENIN PATHWAY | Wnt/beta-catenin Pathway |
| 0.5 | 1.4 | PID IL12 2PATHWAY | IL12-mediated signaling events |
| 0.4 | 1.7 | PID SMAD2 3NUCLEAR PATHWAY | Regulation of nuclear SMAD2/3 signaling |
| 0.4 | 4.3 | PID E2F PATHWAY | E2F transcription factor network |
| 0.4 | 2.5 | PID HES HEY PATHWAY | Notch-mediated HES/HEY network |
| 0.4 | 0.4 | PID IL8 CXCR2 PATHWAY | IL8- and CXCR2-mediated signaling events |
| 0.3 | 3.1 | PID HIF1 TFPATHWAY | HIF-1-alpha transcription factor network |
| 0.3 | 1.7 | NABA MATRISOME ASSOCIATED | Ensemble of genes encoding ECM-associated proteins including ECM-affilaited proteins, ECM regulators and secreted factors |
| 0.3 | 0.6 | PID TELOMERASE PATHWAY | Regulation of Telomerase |
| 0.3 | 0.3 | PID NFAT TFPATHWAY | Calcineurin-regulated NFAT-dependent transcription in lymphocytes |
| 0.2 | 0.4 | PID P53 REGULATION PATHWAY | p53 pathway |
| 0.2 | 0.7 | PID CASPASE PATHWAY | Caspase cascade in apoptosis |
| 0.2 | 0.2 | PID ARF 3PATHWAY | Arf1 pathway |
| 0.2 | 0.6 | PID ATM PATHWAY | ATM pathway |
| 0.1 | 0.4 | ST FAS SIGNALING PATHWAY | Fas Signaling Pathway |
| 0.1 | 1.1 | PID FANCONI PATHWAY | Fanconi anemia pathway |
| 0.1 | 0.4 | PID REELIN PATHWAY | Reelin signaling pathway |
| 0.1 | 0.8 | PID P53 DOWNSTREAM PATHWAY | Direct p53 effectors |
| 0.1 | 0.3 | PID AJDISS 2PATHWAY | Posttranslational regulation of adherens junction stability and dissassembly |
| 0.0 | 0.1 | PID FCER1 PATHWAY | Fc-epsilon receptor I signaling in mast cells |
Gene overrepresentation in curated gene sets: REACTOME pathways category:
| Log-likelihood per target | Total log-likelihood | Term | Description |
|---|---|---|---|
| 4.5 | 27.1 | REACTOME REVERSIBLE HYDRATION OF CARBON DIOXIDE | Genes involved in Reversible Hydration of Carbon Dioxide |
| 1.2 | 3.6 | REACTOME GABA SYNTHESIS RELEASE REUPTAKE AND DEGRADATION | Genes involved in GABA synthesis, release, reuptake and degradation |
| 0.7 | 2.1 | REACTOME SIGNALING BY TGF BETA RECEPTOR COMPLEX | Genes involved in Signaling by TGF-beta Receptor Complex |
| 0.7 | 3.4 | REACTOME PHASE II CONJUGATION | Genes involved in Phase II conjugation |
| 0.6 | 1.9 | REACTOME PURINE METABOLISM | Genes involved in Purine metabolism |
| 0.4 | 2.1 | REACTOME G0 AND EARLY G1 | Genes involved in G0 and Early G1 |
| 0.4 | 0.8 | REACTOME PRE NOTCH EXPRESSION AND PROCESSING | Genes involved in Pre-NOTCH Expression and Processing |
| 0.4 | 0.4 | REACTOME SEMAPHORIN INTERACTIONS | Genes involved in Semaphorin interactions |
| 0.3 | 1.4 | REACTOME FANCONI ANEMIA PATHWAY | Genes involved in Fanconi Anemia pathway |
| 0.3 | 1.6 | REACTOME GLUCOSE TRANSPORT | Genes involved in Glucose transport |
| 0.3 | 2.2 | REACTOME UNWINDING OF DNA | Genes involved in Unwinding of DNA |
| 0.3 | 0.8 | REACTOME FORMATION OF TUBULIN FOLDING INTERMEDIATES BY CCT TRIC | Genes involved in Formation of tubulin folding intermediates by CCT/TriC |
| 0.3 | 1.3 | REACTOME DOPAMINE NEUROTRANSMITTER RELEASE CYCLE | Genes involved in Dopamine Neurotransmitter Release Cycle |
| 0.2 | 0.6 | REACTOME NUCLEOTIDE BINDING DOMAIN LEUCINE RICH REPEAT CONTAINING RECEPTOR NLR SIGNALING PATHWAYS | Genes involved in Nucleotide-binding domain, leucine rich repeat containing receptor (NLR) signaling pathways |
| 0.2 | 0.6 | REACTOME GLYCOSPHINGOLIPID METABOLISM | Genes involved in Glycosphingolipid metabolism |
| 0.2 | 0.8 | REACTOME LOSS OF NLP FROM MITOTIC CENTROSOMES | Genes involved in Loss of Nlp from mitotic centrosomes |
| 0.2 | 0.8 | REACTOME MITOTIC PROMETAPHASE | Genes involved in Mitotic Prometaphase |
| 0.2 | 1.0 | REACTOME INNATE IMMUNE SYSTEM | Genes involved in Innate Immune System |
| 0.2 | 0.6 | REACTOME GOLGI ASSOCIATED VESICLE BIOGENESIS | Genes involved in Golgi Associated Vesicle Biogenesis |
| 0.2 | 1.0 | REACTOME MHC CLASS II ANTIGEN PRESENTATION | Genes involved in MHC class II antigen presentation |
| 0.2 | 0.6 | REACTOME GENERIC TRANSCRIPTION PATHWAY | Genes involved in Generic Transcription Pathway |
| 0.2 | 0.7 | REACTOME VEGF LIGAND RECEPTOR INTERACTIONS | Genes involved in VEGF ligand-receptor interactions |
| 0.2 | 0.2 | REACTOME TRANS GOLGI NETWORK VESICLE BUDDING | Genes involved in trans-Golgi Network Vesicle Budding |
| 0.2 | 1.3 | REACTOME POST TRANSLATIONAL PROTEIN MODIFICATION | Genes involved in Post-translational protein modification |
| 0.2 | 0.6 | REACTOME PEROXISOMAL LIPID METABOLISM | Genes involved in Peroxisomal lipid metabolism |
| 0.1 | 0.3 | REACTOME APOPTOTIC EXECUTION PHASE | Genes involved in Apoptotic execution phase |
| 0.1 | 0.3 | REACTOME ABACAVIR TRANSPORT AND METABOLISM | Genes involved in Abacavir transport and metabolism |
| 0.1 | 1.0 | REACTOME GPCR LIGAND BINDING | Genes involved in GPCR ligand binding |
| 0.1 | 1.1 | REACTOME DEVELOPMENTAL BIOLOGY | Genes involved in Developmental Biology |
| 0.1 | 1.2 | REACTOME FACTORS INVOLVED IN MEGAKARYOCYTE DEVELOPMENT AND PLATELET PRODUCTION | Genes involved in Factors involved in megakaryocyte development and platelet production |
| 0.0 | 0.2 | REACTOME E2F ENABLED INHIBITION OF PRE REPLICATION COMPLEX FORMATION | Genes involved in E2F-enabled inhibition of pre-replication complex formation |
| 0.0 | 0.9 | REACTOME SRP DEPENDENT COTRANSLATIONAL PROTEIN TARGETING TO MEMBRANE | Genes involved in SRP-dependent cotranslational protein targeting to membrane |
| 0.0 | 0.1 | REACTOME SPHINGOLIPID METABOLISM | Genes involved in Sphingolipid metabolism |