Project
GSE43616: Time-course of wild-type Arabidopsis leaf
Navigation
Downloads
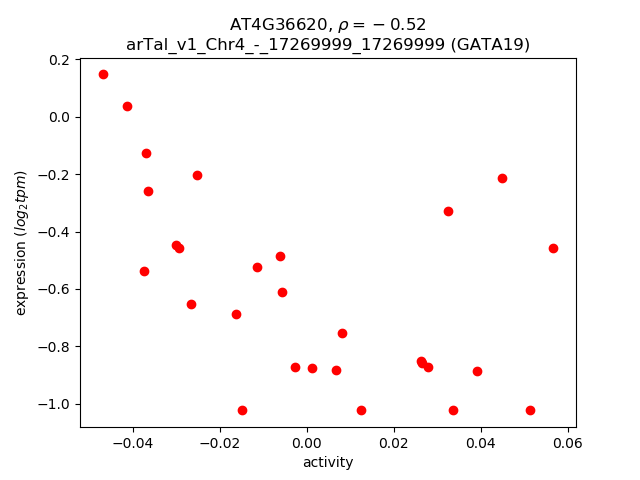
Results for AT4G36620
Z-value: 1.31
Transcription factors associated with AT4G36620
| Gene Symbol | Gene ID | Gene Info |
|---|---|---|
|
AT4G36620
|
AT4G36620 | GATA transcription factor 19 |
Activity-expression correlation:
| Gene | Promoter | Pearson corr. coef. | P-value | Plot |
|---|---|---|---|---|
| GATA19 | arTal_v1_Chr4_-_17269999_17269999 | -0.52 | 4.2e-03 | Click! |
Activity profile of AT4G36620 motif
Sorted Z-values of AT4G36620 motif
| Promoter | Log-likelihood | Transcript | Gene | Gene Info |
|---|---|---|---|---|
| arTal_v1_Chr1_-_24362054_24362054 | 5.73 |
AT1G65520.1
|
ECI1
|
delta(3), delta(2)-enoyl CoA isomerase 1 |
| arTal_v1_Chr5_-_24317935_24317935 | 4.52 |
AT5G60460.2
|
AT5G60460
|
Preprotein translocase Sec, Sec61-beta subunit protein |
| arTal_v1_Chr1_-_19690589_19690589 | 4.47 |
AT1G52880.1
|
NAM
|
NAC (No Apical Meristem) domain transcriptional regulator superfamily protein |
| arTal_v1_Chr5_-_24318241_24318241 | 4.46 |
AT5G60460.1
|
AT5G60460
|
Preprotein translocase Sec, Sec61-beta subunit protein |
| arTal_v1_Chr4_-_10404393_10404393 | 3.78 |
AT4G18990.1
AT4G18990.2 |
XTH29
|
xyloglucan endotransglucosylase/hydrolase 29 |
| arTal_v1_Chr2_+_15158561_15158561 | 3.45 |
AT2G36090.1
|
AT2G36090
|
F-box family protein |
| arTal_v1_Chr2_+_1515828_1515828 | 3.32 |
AT2G04350.2
|
LACS8
|
AMP-dependent synthetase and ligase family protein |
| arTal_v1_Chr2_+_1515634_1515634 | 3.30 |
AT2G04350.1
|
LACS8
|
AMP-dependent synthetase and ligase family protein |
| arTal_v1_Chr4_+_12564945_12564945 | 3.09 |
AT4G24220.1
AT4G24220.2 |
VEP1
|
NAD(P)-binding Rossmann-fold superfamily protein |
| arTal_v1_Chr5_-_19733025_19733156 | 3.08 |
AT5G48655.3
AT5G48655.4 AT5G48655.6 AT5G48655.5 AT5G48655.1 AT5G48655.2 |
AT5G48655
|
RING/U-box superfamily protein |
| arTal_v1_Chr5_+_16826542_16826542 | 3.02 |
AT5G42090.1
|
AT5G42090
|
Lung seven transmembrane receptor family protein |
| arTal_v1_Chr5_+_4370692_4370692 | 2.94 |
AT5G13580.1
|
ABCG6
|
ABC-2 type transporter family protein |
| arTal_v1_Chr3_+_10061009_10061043 | 2.92 |
AT3G27250.1
AT3G27250.2 |
AT3G27250
|
hypothetical protein |
| arTal_v1_Chr3_+_23051544_23051631 | 2.89 |
AT3G62290.2
AT3G62290.3 AT3G62290.1 |
ARFA1E
|
ADP-ribosylation factor A1E |
| arTal_v1_Chr1_+_9215770_9215770 | 2.83 |
AT1G26670.1
|
VTI1B
|
Vesicle transport v-SNARE family protein |
| arTal_v1_Chr1_-_2621545_2621545 | 2.82 |
AT1G08315.1
|
AT1G08315
|
ARM repeat superfamily protein |
| arTal_v1_Chr1_-_7830275_7830424 | 2.81 |
AT1G22180.1
AT1G22180.3 AT1G22180.2 AT1G22180.4 |
AT1G22180
|
Sec14p-like phosphatidylinositol transfer family protein |
| arTal_v1_Chr1_-_4855287_4855287 | 2.80 |
AT1G14200.1
|
AT1G14200
|
RING/U-box superfamily protein |
| arTal_v1_Chr5_-_19388562_19388587 | 2.80 |
AT5G47880.2
AT5G47880.1 |
ERF1-1
|
eukaryotic release factor 1-1 |
| arTal_v1_Chr1_+_19987117_19987191 | 2.76 |
AT1G53570.6
AT1G53570.2 AT1G53570.1 AT1G53570.7 AT1G53570.5 AT1G53570.4 AT1G53570.3 |
MAP3KA
|
mitogen-activated protein kinase kinase kinase 3 |
| arTal_v1_Chr5_-_5262840_5262840 | 2.71 |
AT5G16110.1
|
AT5G16110
|
hypothetical protein |
| arTal_v1_Chr3_+_6664044_6664044 | 2.63 |
AT3G19240.1
|
AT3G19240
|
Vacuolar import/degradation, Vid27-related protein |
| arTal_v1_Chr3_+_16789780_16789780 | 2.59 |
AT3G45730.1
|
AT3G45730
|
hypothetical protein |
| arTal_v1_Chr1_+_8863768_8863919 | 2.59 |
AT1G25280.1
AT1G25280.3 AT1G25280.2 |
TLP10
|
tubby like protein 10 |
| arTal_v1_Chr1_+_4748831_4748873 | 2.57 |
AT1G13880.1
AT1G13880.3 AT1G13880.2 |
AT1G13880
|
ELM2 domain-containing protein |
| arTal_v1_Chr3_-_5038114_5038114 | 2.52 |
AT3G14960.1
|
AT3G14960
|
Galactosyltransferase family protein |
| arTal_v1_Chr1_+_27361146_27361146 | 2.41 |
AT1G72690.1
|
AT1G72690
|
neurofilament heavy protein |
| arTal_v1_Chr2_-_17090556_17090556 | 2.40 |
AT2G40950.1
|
BZIP17
|
Basic-leucine zipper (bZIP) transcription factor family protein |
| arTal_v1_Chr3_+_1221422_1221422 | 2.36 |
AT3G04530.1
|
PPCK2
|
phosphoenolpyruvate carboxylase kinase 2 |
| arTal_v1_Chr3_+_22134951_22134951 | 2.27 |
AT3G59920.1
|
GDI2
|
RAB GDP dissociation inhibitor 2 |
| arTal_v1_Chr2_-_4317862_4317882 | 2.22 |
AT2G10950.1
AT2G10950.2 AT2G10950.3 |
AT2G10950
|
BSD domain-containing protein |
| arTal_v1_Chr2_-_9767_9767 | 2.21 |
AT2G01023.1
|
AT2G01023
|
hypothetical protein |
| arTal_v1_Chr1_+_24019490_24019490 | 2.13 |
AT1G64630.1
|
WNK10
|
with no lysine (K) kinase 10 |
| arTal_v1_Chr1_+_6913001_6913100 | 2.13 |
AT1G19910.1
AT1G19910.2 |
AVA-P2
|
ATPase, F0/V0 complex, subunit C protein |
| arTal_v1_Chr3_-_17832759_17832759 | 2.06 |
AT3G48195.1
|
AT3G48195
|
Phox (PX) domain-containing protein |
| arTal_v1_Chr1_-_2475013_2475128 | 2.02 |
AT1G07980.2
AT1G07980.1 |
NF-YC10
|
nuclear factor Y, subunit C10 |
| arTal_v1_Chr1_+_8079287_8079287 | 2.02 |
AT1G22840.1
AT1G22840.2 |
CYTC-1
|
CYTOCHROME C-1 |
| arTal_v1_Chr2_-_14568799_14568799 | 2.01 |
AT2G34585.1
|
AT2G34585
|
transmembrane protein |
| arTal_v1_Chr4_+_5375714_5375714 | 1.93 |
AT4G08455.1
|
AT4G08455
|
BTB/POZ domain-containing protein |
| arTal_v1_Chr4_+_15528425_15528425 | 1.91 |
AT4G32160.1
|
AT4G32160
|
Phox (PX) domain-containing protein |
| arTal_v1_Chr1_+_25693449_25693449 | 1.88 |
AT1G68490.1
|
AT1G68490
|
translocase subunit seca |
| arTal_v1_Chr5_-_17856740_17856740 | 1.87 |
AT5G44320.1
|
AT5G44320
|
Eukaryotic translation initiation factor 3 subunit 7 (eIF-3) |
| arTal_v1_Chr5_-_7366799_7366799 | 1.73 |
AT5G22250.1
|
CAF1b
|
Polynucleotidyl transferase, ribonuclease H-like superfamily protein |
| arTal_v1_Chr3_+_360921_360921 | 1.71 |
AT3G02070.2
AT3G02070.1 |
AT3G02070
|
Cysteine proteinases superfamily protein |
| arTal_v1_Chr2_+_9545283_9545283 | 1.69 |
AT2G22480.1
|
PFK5
|
phosphofructokinase 5 |
| arTal_v1_Chr1_+_30188364_30188364 | 1.69 |
AT1G80290.2
|
AT1G80290
|
Nucleotide-diphospho-sugar transferases superfamily protein |
| arTal_v1_Chr2_+_10797353_10797511 | 1.68 |
AT2G25350.1
AT2G25350.4 AT2G25350.2 AT2G25350.3 AT2G25350.5 |
AT2G25350
|
Phox (PX) domain-containing protein |
| arTal_v1_Chr3_+_22340859_22340891 | 1.67 |
AT3G60450.2
AT3G60450.1 |
AT3G60450
|
Phosphoglycerate mutase family protein |
| arTal_v1_Chr1_+_6971424_6971424 | 1.63 |
AT1G20110.1
|
AT1G20110
|
RING/FYVE/PHD zinc finger superfamily protein |
| arTal_v1_Chr2_-_13642060_13642060 | 1.57 |
AT2G32070.1
|
AT2G32070
|
Polynucleotidyl transferase, ribonuclease H-like superfamily protein |
| arTal_v1_Chr2_-_18438565_18438565 | 1.56 |
AT2G44730.1
|
AT2G44730
|
Alcohol dehydrogenase transcription factor Myb/SANT-like family protein |
| arTal_v1_Chr1_+_30187920_30187920 | 1.56 |
AT1G80290.1
|
AT1G80290
|
Nucleotide-diphospho-sugar transferases superfamily protein |
| arTal_v1_Chr5_-_10039286_10039286 | 1.55 |
AT5G28040.2
|
AT5G28040
|
DNA-binding storekeeper protein-related transcriptional regulator |
| arTal_v1_Chr3_+_21492145_21492167 | 1.54 |
AT3G58050.1
AT3G58050.2 |
AT3G58050
|
hypothetical protein |
| arTal_v1_Chr5_+_19257027_19257027 | 1.54 |
AT5G47480.1
AT5G47480.2 |
AT5G47480
|
RGPR-like protein |
| arTal_v1_Chr1_+_97412_97412 | 1.51 |
AT1G01230.1
|
AT1G01230
|
ORMDL family protein |
| arTal_v1_Chr5_+_16441808_16441808 | 1.45 |
AT5G41080.2
|
GDPD2
|
PLC-like phosphodiesterases superfamily protein |
| arTal_v1_Chr5_-_20891007_20891007 | 1.42 |
AT5G51430.1
|
EYE
|
conserved oligomeric Golgi complex component-related / COG complex component-like protein |
| arTal_v1_Chr5_-_10039001_10039001 | 1.38 |
AT5G28040.1
|
AT5G28040
|
DNA-binding storekeeper protein-related transcriptional regulator |
| arTal_v1_Chr5_+_16441655_16441655 | 1.37 |
AT5G41080.1
|
GDPD2
|
PLC-like phosphodiesterases superfamily protein |
| arTal_v1_Chr5_+_871204_871204 | 1.33 |
AT5G03490.1
|
AT5G03490
|
UDP-Glycosyltransferase superfamily protein |
| arTal_v1_Chr3_-_16908642_16908642 | 1.32 |
AT3G46000.2
|
ADF2
|
actin depolymerizing factor 2 |
| arTal_v1_Chr2_-_7109089_7109089 | 1.32 |
AT2G16405.1
|
AT2G16405
|
Transducin/WD40 repeat-like superfamily protein |
| arTal_v1_Chr3_-_16908819_16908819 | 1.31 |
AT3G46000.3
|
ADF2
|
actin depolymerizing factor 2 |
| arTal_v1_Chr4_+_10809843_10809843 | 1.31 |
AT4G19950.1
|
AT4G19950
|
polyadenylate-binding protein 1-B-binding protein |
| arTal_v1_Chr1_+_29842587_29842587 | 1.29 |
AT1G79340.1
|
MC4
|
metacaspase 4 |
| arTal_v1_Chr5_+_21548397_21548433 | 1.24 |
AT5G53140.1
AT5G53140.2 |
AT5G53140
|
Protein phosphatase 2C family protein |
| arTal_v1_Chr3_-_16909119_16909119 | 1.22 |
AT3G46000.1
|
ADF2
|
actin depolymerizing factor 2 |
| arTal_v1_Chr5_-_22534155_22534155 | 1.21 |
AT5G55640.1
|
AT5G55640
|
Na-translocating NADH-quinone reductase subunit A |
| arTal_v1_Chr5_+_25677072_25677080 | 1.15 |
AT5G64180.1
AT5G64180.2 |
AT5G64180
|
tropomyosin |
| arTal_v1_Chr1_-_27169754_27169754 | 1.13 |
AT1G72190.1
|
AT1G72190
|
D-isomer specific 2-hydroxyacid dehydrogenase family protein |
| arTal_v1_Chr4_-_507626_507626 | 1.12 |
AT4G01200.1
|
AT4G01200
|
Calcium-dependent lipid-binding (CaLB domain) family protein |
| arTal_v1_Chr3_-_16913350_16913350 | 1.11 |
AT3G46020.1
|
AT3G46020
|
RNA-binding (RRM/RBD/RNP motifs) family protein |
| arTal_v1_Chr4_-_18275017_18275216 | 1.09 |
AT4G39260.4
AT4G39260.3 AT4G39260.2 AT4G39260.1 |
CCR1
|
cold, circadian rhythm, and RNA binding 1 |
| arTal_v1_Chr1_+_19074328_19074328 | 1.02 |
AT1G51450.1
|
TRO
|
TRAUCO |
| arTal_v1_Chr5_-_22702200_22702200 | 1.01 |
AT5G56050.1
|
AT5G56050
|
late embryogenesis abundant (LEA) hydroxyproline-rich glycoprotein family protein |
| arTal_v1_Chr1_+_10010124_10010124 | 1.01 |
AT1G28470.1
|
NAC010
|
NAC domain containing protein 10 |
| arTal_v1_Chr3_-_138731_138799 | 1.00 |
AT3G01360.1
AT3G01360.2 |
AT3G01360
|
plant viral-response family protein (DUF716) |
| arTal_v1_Chr5_-_19304737_19304950 | 0.93 |
AT5G47620.3
AT5G47620.1 AT5G47620.4 AT5G47620.5 AT5G47620.2 |
AT5G47620
|
RNA-binding (RRM/RBD/RNP motifs) family protein |
| arTal_v1_Chr3_+_9182616_9182616 | 0.91 |
AT3G25220.1
|
FKBP15-1
|
FK506-binding protein 15 kD-1 |
| arTal_v1_Chr2_-_18588141_18588259 | 0.90 |
AT2G45070.2
AT2G45070.1 |
SEC61 BETA
|
Preprotein translocase Sec, Sec61-beta subunit protein |
| arTal_v1_Chr1_+_3938422_3938422 | 0.86 |
AT1G11680.1
|
CYP51G1
|
CYTOCHROME P450 51G1 |
| arTal_v1_Chr2_-_14359901_14360058 | 0.84 |
AT2G33980.1
AT2G33980.4 AT2G33980.2 AT2G33980.3 |
NUDT22
|
nudix hydrolase homolog 22 |
| arTal_v1_Chr2_-_18588452_18588452 | 0.83 |
AT2G45070.3
AT2G45070.4 |
SEC61 BETA
|
Preprotein translocase Sec, Sec61-beta subunit protein |
| arTal_v1_Chr2_+_18408579_18408579 | 0.83 |
AT2G44600.1
|
AT2G44600
|
hypothetical protein |
| arTal_v1_Chr2_-_19138725_19138762 | 0.83 |
AT2G46610.2
AT2G46610.1 AT2G46610.3 |
RS31a
|
RNA-binding (RRM/RBD/RNP motifs) family protein |
| arTal_v1_Chr1_+_21042951_21042977 | 0.73 |
AT1G56220.4
AT1G56220.5 AT1G56220.3 |
AT1G56220
|
Dormancy/auxin associated family protein |
| arTal_v1_Chr1_+_21043348_21043348 | 0.73 |
AT1G56220.2
AT1G56220.1 |
AT1G56220
|
Dormancy/auxin associated family protein |
| arTal_v1_Chr2_+_7872201_7872201 | 0.72 |
AT2G18110.1
|
AT2G18110
|
Translation elongation factor EF1B/ribosomal protein S6 family protein |
| arTal_v1_Chr1_-_13031375_13031375 | 0.70 |
AT1G35430.1
|
AT1G35430
|
transmembrane protein |
| arTal_v1_Chr3_-_1071438_1071438 | 0.70 |
AT3G04080.1
|
APY1
|
apyrase 1 |
| arTal_v1_Chr3_-_18469962_18469962 | 0.68 |
AT3G49790.1
|
AT3G49790
|
Carbohydrate-binding protein |
| arTal_v1_Chr3_-_17393699_17393699 | 0.65 |
AT3G47230.1
|
AT3G47230
|
|
| arTal_v1_Chr3_+_22400395_22400395 | 0.64 |
AT3G60600.3
AT3G60600.2 |
VAP27-1
|
vesicle associated protein |
| arTal_v1_Chr5_+_6652306_6652454 | 0.64 |
AT5G19690.1
AT5G19690.2 |
STT3A
|
staurosporin and temperature sensitive 3-like A |
| arTal_v1_Chr2_-_14078744_14078772 | 0.64 |
AT2G33210.2
AT2G33210.1 |
HSP60-2
|
heat shock protein 60-2 |
| arTal_v1_Chr1_+_8219808_8219808 | 0.63 |
AT1G23190.1
|
PGM3
|
Phosphoglucomutase/phosphomannomutase family protein |
| arTal_v1_Chr4_-_12471261_12471261 | 0.61 |
AT4G24015.1
|
AT4G24015
|
RING/U-box superfamily protein |
| arTal_v1_Chr3_+_20964643_20964656 | 0.59 |
AT3G56590.2
AT3G56590.1 |
AT3G56590
|
hydroxyproline-rich glycoprotein family protein |
| arTal_v1_Chr5_+_22392063_22392063 | 0.58 |
AT5G55190.1
|
RAN3
|
RAN GTPase 3 |
| arTal_v1_Chr3_+_22400110_22400110 | 0.56 |
AT3G60600.1
|
VAP27-1
|
vesicle associated protein |
| arTal_v1_Chr3_-_22426369_22426369 | 0.56 |
AT3G60670.1
|
AT3G60670
|
PLATZ transcription factor family protein |
| arTal_v1_Chr3_+_2455239_2455239 | 0.56 |
AT3G07680.1
|
p24beta2
|
emp24/gp25L/p24 family/GOLD family protein |
| arTal_v1_Chr1_+_27959527_27959527 | 0.55 |
AT1G74380.1
|
XXT5
|
xyloglucan xylosyltransferase 5 |
| arTal_v1_Chr3_+_5831136_5831136 | 0.55 |
AT3G17100.2
AT3G17100.1 |
AT3G17100
|
sequence-specific DNA binding transcription factor |
| arTal_v1_Chr2_+_10753602_10753602 | 0.54 |
AT2G25250.1
|
AT2G25250
|
serine/arginine repetitive matrix-like protein |
| arTal_v1_Chr4_+_14449888_14449888 | 0.54 |
AT4G29350.1
|
PFN2
|
profilin 2 |
| arTal_v1_Chr1_+_2856162_2856162 | 0.50 |
AT1G08910.1
|
AT1G08910
|
zinc ion binding protein |
| arTal_v1_Chr3_-_20229214_20229214 | 0.49 |
AT3G54650.1
|
FBL17
|
RNI-like superfamily protein |
| arTal_v1_Chr5_-_26699426_26699426 | 0.44 |
AT5G66850.2
AT5G66850.1 |
MAPKKK5
|
mitogen-activated protein kinase kinase kinase 5 |
| arTal_v1_Chr5_-_556442_556442 | 0.43 |
AT5G02500.2
|
HSC70-1
|
heat shock cognate protein 70-1 |
| arTal_v1_Chr5_-_556623_556623 | 0.43 |
AT5G02500.1
|
HSC70-1
|
heat shock cognate protein 70-1 |
| arTal_v1_Chr3_+_9154508_9154508 | 0.42 |
AT3G25140.1
|
QUA1
|
Nucleotide-diphospho-sugar transferases superfamily protein |
| arTal_v1_Chr5_-_8643516_8643516 | 0.41 |
AT5G25070.1
|
AT5G25070
|
neurofilament light protein |
| arTal_v1_Chr2_-_19137765_19137765 | 0.40 |
AT2G46610.4
|
RS31a
|
RNA-binding (RRM/RBD/RNP motifs) family protein |
| arTal_v1_Chr5_-_5030245_5030245 | 0.39 |
AT5G15490.1
|
UGD3
|
UDP-glucose 6-dehydrogenase family protein |
| arTal_v1_Chr2_-_12861910_12861971 | 0.39 |
AT2G30120.2
AT2G30120.6 AT2G30120.5 AT2G30120.1 AT2G30120.3 AT2G30120.4 |
AT2G30120
|
protein FLC EXPRESSOR |
| arTal_v1_Chr5_+_24821203_24821203 | 0.34 |
AT5G61780.1
|
Tudor2
|
TUDOR-SN protein 2 |
| arTal_v1_Chr5_-_5298169_5298169 | 0.33 |
AT5G16210.1
|
AT5G16210
|
HEAT repeat-containing protein |
| arTal_v1_Chr3_+_5592491_5592491 | 0.33 |
AT3G16460.1
|
JAL34
|
Mannose-binding lectin superfamily protein |
| arTal_v1_Chr3_+_5592644_5592644 | 0.32 |
AT3G16460.2
|
JAL34
|
Mannose-binding lectin superfamily protein |
| arTal_v1_Chr4_-_7470737_7470737 | 0.27 |
AT4G12650.1
|
AT4G12650
|
Endomembrane protein 70 protein family |
| arTal_v1_Chr2_+_5096038_5096038 | 0.17 |
AT2G12505.1
|
AT2G12505
|
|
| arTal_v1_Chr2_+_14165125_14165125 | 0.17 |
AT2G33435.1
|
AT2G33435
|
RNA-binding (RRM/RBD/RNP motifs) family protein |
| arTal_v1_Chr5_+_19226769_19226769 | 0.13 |
AT5G47390.1
|
AT5G47390
|
myb-like transcription factor family protein |
| arTal_v1_Chr2_-_9932319_9932319 | 0.13 |
AT2G23330.1
|
AT2G23330
|
|
| arTal_v1_Chr5_-_5024750_5024750 | 0.07 |
AT5G15470.1
|
GAUT14
|
galacturonosyltransferase 14 |
| arTal_v1_Chr3_-_2607895_2607895 | 0.04 |
AT3G08580.2
|
AAC1
|
ADP/ATP carrier 1 |
| arTal_v1_Chr3_-_2607573_2607573 | 0.01 |
AT3G08580.1
|
AAC1
|
ADP/ATP carrier 1 |
| arTal_v1_Chr2_+_8527175_8527175 | 0.01 |
AT2G19790.1
|
AT2G19790
|
SNARE-like superfamily protein |
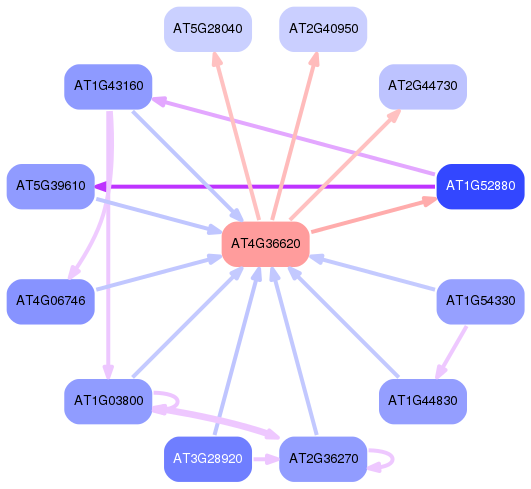
Network of associatons between targets according to the STRING database.

First level regulatory network of AT4G36620
Gene Ontology Analysis
Gene overrepresentation in biological process category:
| Log-likelihood per target | Total log-likelihood | Term | Description |
|---|---|---|---|
| 1.1 | 10.7 | GO:0031204 | posttranslational protein targeting to membrane, translocation(GO:0031204) |
| 0.8 | 2.4 | GO:0006990 | positive regulation of transcription from RNA polymerase II promoter involved in unfolded protein response(GO:0006990) positive regulation of transcription from RNA polymerase II promoter involved in cellular response to chemical stimulus(GO:1901522) |
| 0.7 | 2.8 | GO:0046475 | glycerophospholipid catabolic process(GO:0046475) |
| 0.7 | 2.8 | GO:0002184 | cytoplasmic translational termination(GO:0002184) |
| 0.5 | 1.4 | GO:0034067 | protein localization to Golgi apparatus(GO:0034067) |
| 0.4 | 1.3 | GO:0016540 | protein autoprocessing(GO:0016540) |
| 0.4 | 2.0 | GO:0010336 | gibberellic acid homeostasis(GO:0010336) |
| 0.3 | 4.5 | GO:0048317 | seed morphogenesis(GO:0048317) |
| 0.3 | 1.0 | GO:0080182 | simple leaf morphogenesis(GO:0060776) histone H3-K4 trimethylation(GO:0080182) |
| 0.3 | 3.2 | GO:0002221 | pattern recognition receptor signaling pathway(GO:0002221) |
| 0.2 | 1.7 | GO:0000289 | nuclear-transcribed mRNA poly(A) tail shortening(GO:0000289) |
| 0.2 | 0.8 | GO:0034034 | purine ribonucleotide catabolic process(GO:0009154) ribonucleotide catabolic process(GO:0009261) coenzyme A catabolic process(GO:0015938) nucleoside bisphosphate catabolic process(GO:0033869) ribonucleoside bisphosphate catabolic process(GO:0034031) purine nucleoside bisphosphate catabolic process(GO:0034034) |
| 0.2 | 0.5 | GO:0055047 | generative cell mitosis(GO:0055047) |
| 0.1 | 0.4 | GO:0010289 | homogalacturonan biosynthetic process(GO:0010289) |
| 0.1 | 3.8 | GO:0030042 | actin filament depolymerization(GO:0030042) |
| 0.1 | 5.7 | GO:0006635 | fatty acid beta-oxidation(GO:0006635) |
| 0.1 | 1.2 | GO:0090158 | endoplasmic reticulum membrane organization(GO:0090158) |
| 0.1 | 1.7 | GO:0006002 | fructose 6-phosphate metabolic process(GO:0006002) |
| 0.1 | 2.9 | GO:0010345 | suberin biosynthetic process(GO:0010345) |
| 0.1 | 2.3 | GO:0007264 | small GTPase mediated signal transduction(GO:0007264) |
| 0.1 | 1.1 | GO:0072329 | monocarboxylic acid catabolic process(GO:0072329) |
| 0.0 | 1.5 | GO:0042026 | protein refolding(GO:0042026) |
| 0.0 | 3.1 | GO:0010051 | xylem and phloem pattern formation(GO:0010051) |
| 0.0 | 6.4 | GO:0006486 | protein glycosylation(GO:0006486) macromolecule glycosylation(GO:0043413) |
| 0.0 | 2.1 | GO:0010411 | xyloglucan metabolic process(GO:0010411) |
| 0.0 | 0.6 | GO:0000054 | ribosomal subunit export from nucleus(GO:0000054) ribosome localization(GO:0033750) establishment of ribosome localization(GO:0033753) rRNA-containing ribonucleoprotein complex export from nucleus(GO:0071428) |
| 0.0 | 6.6 | GO:0006631 | fatty acid metabolic process(GO:0006631) |
| 0.0 | 1.9 | GO:0006413 | translational initiation(GO:0006413) |
| 0.0 | 0.3 | GO:0032366 | intracellular sterol transport(GO:0032366) |
| 0.0 | 1.0 | GO:2000652 | regulation of secondary cell wall biogenesis(GO:2000652) |
| 0.0 | 1.9 | GO:0030162 | regulation of proteolysis(GO:0030162) |
| 0.0 | 1.2 | GO:0045292 | mRNA cis splicing, via spliceosome(GO:0045292) |
| 0.0 | 2.1 | GO:1902600 | hydrogen ion transmembrane transport(GO:1902600) |
| 0.0 | 2.4 | GO:0018105 | peptidyl-serine phosphorylation(GO:0018105) peptidyl-serine modification(GO:0018209) |
| 0.0 | 0.9 | GO:0016126 | sterol biosynthetic process(GO:0016126) |
| 0.0 | 1.7 | GO:0016579 | protein deubiquitination(GO:0016579) |
| 0.0 | 0.6 | GO:0007030 | Golgi organization(GO:0007030) |
| 0.0 | 3.1 | GO:0010200 | response to chitin(GO:0010200) |
| 0.0 | 1.1 | GO:0009809 | lignin biosynthetic process(GO:0009809) |
| 0.0 | 0.1 | GO:0042989 | negative regulation of actin filament polymerization(GO:0030837) sequestering of actin monomers(GO:0042989) |
| 0.0 | 0.7 | GO:0006414 | translational elongation(GO:0006414) |
| 0.0 | 0.1 | GO:0048358 | mucilage pectin biosynthetic process(GO:0048358) |
| 0.0 | 0.7 | GO:0009846 | pollen germination(GO:0009846) |
| 0.0 | 1.6 | GO:0019757 | S-glycoside metabolic process(GO:0016143) glycosinolate metabolic process(GO:0019757) glucosinolate metabolic process(GO:0019760) |
Gene overrepresentation in cellular component category:
| Log-likelihood per target | Total log-likelihood | Term | Description |
|---|---|---|---|
| 1.8 | 10.7 | GO:0031205 | endoplasmic reticulum Sec complex(GO:0031205) |
| 0.7 | 2.8 | GO:0018444 | translation release factor complex(GO:0018444) |
| 0.6 | 1.7 | GO:0030015 | CCR4-NOT core complex(GO:0030015) |
| 0.5 | 2.1 | GO:0000220 | vacuolar proton-transporting V-type ATPase, V0 domain(GO:0000220) |
| 0.2 | 1.0 | GO:0048188 | Set1C/COMPASS complex(GO:0048188) |
| 0.2 | 0.7 | GO:0005853 | eukaryotic translation elongation factor 1 complex(GO:0005853) |
| 0.2 | 1.4 | GO:0017119 | Golgi transport complex(GO:0017119) |
| 0.1 | 2.0 | GO:0005758 | mitochondrial intermembrane space(GO:0005758) |
| 0.1 | 1.2 | GO:0000326 | storage vacuole(GO:0000322) protein storage vacuole(GO:0000326) |
| 0.1 | 0.5 | GO:0001673 | male germ cell nucleus(GO:0001673) |
| 0.1 | 1.9 | GO:0005852 | eukaryotic translation initiation factor 3 complex(GO:0005852) |
| 0.0 | 3.8 | GO:0015629 | actin cytoskeleton(GO:0015629) |
| 0.0 | 3.0 | GO:0010008 | endosome membrane(GO:0010008) |
| 0.0 | 0.6 | GO:0005793 | endoplasmic reticulum-Golgi intermediate compartment(GO:0005793) |
| 0.0 | 1.4 | GO:0016607 | nuclear speck(GO:0016607) |
| 0.0 | 16.3 | GO:0005794 | Golgi apparatus(GO:0005794) |
| 0.0 | 4.0 | GO:0005777 | peroxisome(GO:0005777) microbody(GO:0042579) |
| 0.0 | 2.4 | GO:0005789 | endoplasmic reticulum membrane(GO:0005789) |
| 0.0 | 3.0 | GO:0016021 | integral component of membrane(GO:0016021) |
Gene overrepresentation in molecular function category:
| Log-likelihood per target | Total log-likelihood | Term | Description |
|---|---|---|---|
| 1.4 | 5.7 | GO:0016856 | racemase and epimerase activity, acting on hydroxy acids and derivatives(GO:0016856) |
| 1.1 | 10.7 | GO:0005086 | ARF guanyl-nucleotide exchange factor activity(GO:0005086) |
| 1.0 | 3.1 | GO:0035671 | enone reductase activity(GO:0035671) |
| 0.6 | 2.3 | GO:0005093 | Rab GDP-dissociation inhibitor activity(GO:0005093) |
| 0.6 | 2.8 | GO:1990825 | sequence-specific mRNA binding(GO:1990825) |
| 0.6 | 6.6 | GO:0102391 | decanoate--CoA ligase activity(GO:0102391) |
| 0.5 | 2.8 | GO:0005483 | soluble NSF attachment protein activity(GO:0005483) |
| 0.4 | 2.9 | GO:0060229 | phospholipase activator activity(GO:0016004) lipase activator activity(GO:0060229) |
| 0.3 | 1.7 | GO:0004535 | poly(A)-specific ribonuclease activity(GO:0004535) |
| 0.3 | 0.8 | GO:0003986 | acetyl-CoA hydrolase activity(GO:0003986) |
| 0.3 | 2.8 | GO:0008526 | phosphatidylinositol transporter activity(GO:0008526) |
| 0.2 | 1.7 | GO:0003872 | 6-phosphofructokinase activity(GO:0003872) |
| 0.2 | 3.2 | GO:0004709 | MAP kinase kinase kinase activity(GO:0004709) |
| 0.2 | 1.0 | GO:0042800 | histone methyltransferase activity (H3-K4 specific)(GO:0042800) |
| 0.2 | 2.8 | GO:0008889 | glycerophosphodiester phosphodiesterase activity(GO:0008889) |
| 0.2 | 1.1 | GO:0016621 | cinnamoyl-CoA reductase activity(GO:0016621) |
| 0.1 | 0.6 | GO:0004614 | phosphoglucomutase activity(GO:0004614) |
| 0.1 | 3.8 | GO:0016762 | xyloglucan:xyloglucosyl transferase activity(GO:0016762) |
| 0.1 | 2.1 | GO:0046961 | proton-transporting ATPase activity, rotational mechanism(GO:0046961) |
| 0.1 | 0.7 | GO:0017110 | nucleoside-diphosphatase activity(GO:0017110) |
| 0.1 | 0.9 | GO:0002020 | protease binding(GO:0002020) |
| 0.1 | 3.6 | GO:0035091 | phosphatidylinositol binding(GO:0035091) |
| 0.0 | 3.8 | GO:0051015 | actin filament binding(GO:0051015) |
| 0.0 | 2.4 | GO:0004683 | calmodulin-dependent protein kinase activity(GO:0004683) calcium-dependent protein serine/threonine kinase activity(GO:0009931) calcium-dependent protein kinase activity(GO:0010857) |
| 0.0 | 1.2 | GO:0004724 | magnesium-dependent protein serine/threonine phosphatase activity(GO:0004724) |
| 0.0 | 1.9 | GO:0031625 | ubiquitin protein ligase binding(GO:0031625) |
| 0.0 | 0.9 | GO:0032451 | demethylase activity(GO:0032451) |
| 0.0 | 1.3 | GO:0004197 | cysteine-type endopeptidase activity(GO:0004197) |
| 0.0 | 1.7 | GO:0036459 | thiol-dependent ubiquitin-specific protease activity(GO:0004843) thiol-dependent ubiquitinyl hydrolase activity(GO:0036459) |
| 0.0 | 1.9 | GO:0003743 | translation initiation factor activity(GO:0003743) |
| 0.0 | 0.7 | GO:0005085 | guanyl-nucleotide exchange factor activity(GO:0005085) |
| 0.0 | 1.1 | GO:0016620 | oxidoreductase activity, acting on the aldehyde or oxo group of donors, NAD or NADP as acceptor(GO:0016620) |
| 0.0 | 0.1 | GO:0003785 | actin monomer binding(GO:0003785) |
| 0.0 | 0.5 | GO:0047262 | polygalacturonate 4-alpha-galacturonosyltransferase activity(GO:0047262) |
| 0.0 | 2.0 | GO:0046982 | protein heterodimerization activity(GO:0046982) |
| 0.0 | 0.9 | GO:0003755 | peptidyl-prolyl cis-trans isomerase activity(GO:0003755) |
| 0.0 | 2.0 | GO:0009055 | electron carrier activity(GO:0009055) |
| 0.0 | 0.2 | GO:0030628 | pre-mRNA 3'-splice site binding(GO:0030628) |
| 0.0 | 2.9 | GO:0043492 | hydrolase activity, acting on acid anhydrides, catalyzing transmembrane movement of substances(GO:0016820) ATPase activity, coupled to transmembrane movement of substances(GO:0042626) ATPase activity, coupled to movement of substances(GO:0043492) |
Gene overrepresentation in curated gene sets: canonical pathways category:
| Log-likelihood per target | Total log-likelihood | Term | Description |
|---|---|---|---|
| 0.8 | 2.3 | SIG CHEMOTAXIS | Genes related to chemotaxis |
| 0.5 | 0.5 | SIG REGULATION OF THE ACTIN CYTOSKELETON BY RHO GTPASES | Genes related to regulation of the actin cytoskeleton |
Gene overrepresentation in curated gene sets: REACTOME pathways category:
| Log-likelihood per target | Total log-likelihood | Term | Description |
|---|---|---|---|
| 0.4 | 5.7 | REACTOME FATTY ACID TRIACYLGLYCEROL AND KETONE BODY METABOLISM | Genes involved in Fatty acid, triacylglycerol, and ketone body metabolism |
| 0.3 | 0.5 | REACTOME SIGNALING BY ROBO RECEPTOR | Genes involved in Signaling by Robo receptor |
| 0.3 | 2.3 | REACTOME SIGNALING BY RHO GTPASES | Genes involved in Signaling by Rho GTPases |
| 0.2 | 0.6 | REACTOME BIOSYNTHESIS OF THE N GLYCAN PRECURSOR DOLICHOL LIPID LINKED OLIGOSACCHARIDE LLO AND TRANSFER TO A NASCENT PROTEIN | Genes involved in Biosynthesis of the N-glycan precursor (dolichol lipid-linked oligosaccharide, LLO) and transfer to a nascent protein |
| 0.1 | 0.6 | REACTOME ASPARAGINE N LINKED GLYCOSYLATION | Genes involved in Asparagine N-linked glycosylation |
| 0.1 | 1.1 | REACTOME CHEMOKINE RECEPTORS BIND CHEMOKINES | Genes involved in Chemokine receptors bind chemokines |