Project
GSE43616: Time-course of wild-type Arabidopsis leaf
Navigation
Downloads
Results for AT4G36160
Z-value: 0.93
Transcription factors associated with AT4G36160
| Gene Symbol | Gene ID | Gene Info |
|---|---|---|
|
AT4G36160
|
AT4G36160 | NAC domain containing protein 76 |
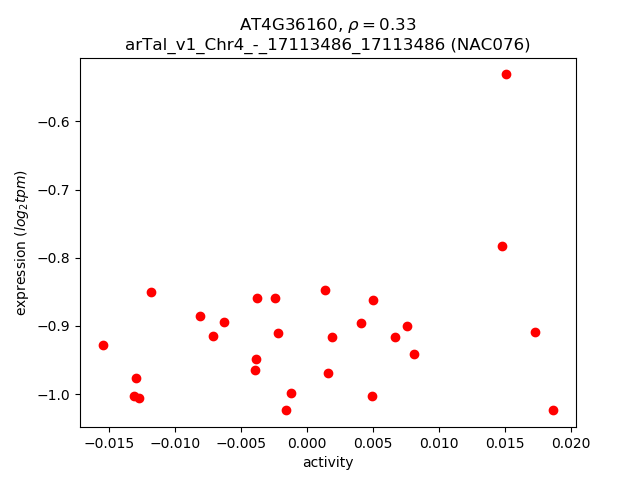
Activity-expression correlation:
| Gene | Promoter | Pearson corr. coef. | P-value | Plot |
|---|---|---|---|---|
| NAC076 | arTal_v1_Chr4_-_17113486_17113486 | 0.33 | 9.1e-02 | Click! |
Activity profile of AT4G36160 motif
Sorted Z-values of AT4G36160 motif
| Promoter | Log-likelihood | Transcript | Gene | Gene Info |
|---|---|---|---|---|
| arTal_v1_Chr1_-_23238644_23238644 | 2.01 |
AT1G62760.1
|
AT1G62760
|
Plant invertase/pectin methylesterase inhibitor superfamily protein |
| arTal_v1_Chr1_-_20385380_20385380 | 1.74 |
AT1G54570.1
|
PES1
|
Esterase/lipase/thioesterase family protein |
| arTal_v1_Chr3_+_22935510_22935510 | 1.71 |
AT3G61930.1
|
AT3G61930
|
hypothetical protein |
| arTal_v1_Chr3_-_162905_162905 | 1.70 |
AT3G01420.1
|
DOX1
|
Peroxidase superfamily protein |
| arTal_v1_Chr5_+_1153740_1153740 | 1.68 |
AT5G04200.1
|
MC9
|
metacaspase 9 |
| arTal_v1_Chr1_+_10892445_10892445 | 1.65 |
AT1G30700.1
|
AT1G30700
|
FAD-binding Berberine family protein |
| arTal_v1_Chr2_-_18781973_18781973 | 1.59 |
AT2G45570.1
|
CYP76C2
|
cytochrome P450, family 76, subfamily C, polypeptide 2 |
| arTal_v1_Chr5_+_4488476_4488476 | 1.55 |
AT5G13930.1
|
TT4
|
Chalcone and stilbene synthase family protein |
| arTal_v1_Chr4_-_9368852_9368852 | 1.53 |
AT4G16640.1
|
AT4G16640
|
Matrixin family protein |
| arTal_v1_Chr3_-_19643276_19643282 | 1.52 |
AT3G52970.1
AT3G52970.2 |
CYP76G1
|
cytochrome P450, family 76, subfamily G, polypeptide 1 |
| arTal_v1_Chr1_+_27538190_27538190 | 1.52 |
AT1G73220.1
|
OCT1
|
organic cation/carnitine transporter1 |
| arTal_v1_Chr3_+_15983199_15983199 | 1.51 |
AT3G44300.1
|
NIT2
|
nitrilase 2 |
| arTal_v1_Chr4_+_15828228_15828228 | 1.47 |
AT4G32810.1
AT4G32810.2 |
CCD8
|
carotenoid cleavage dioxygenase 8 |
| arTal_v1_Chr5_-_6976036_6976036 | 1.44 |
AT5G20630.1
|
GER3
|
germin 3 |
| arTal_v1_Chr2_-_19291632_19291632 | 1.43 |
AT2G46950.2
AT2G46950.1 |
CYP709B2
|
cytochrome P450, family 709, subfamily B, polypeptide 2 |
| arTal_v1_Chr3_+_4036945_4037070 | 1.43 |
AT3G12700.1
AT3G12700.3 AT3G12700.2 |
NANA
|
Eukaryotic aspartyl protease family protein |
| arTal_v1_Chr1_+_21652988_21652988 | 1.43 |
AT1G58340.1
|
ZF14
|
MATE efflux family protein |
| arTal_v1_Chr2_+_15830870_15830870 | 1.41 |
AT2G37750.1
|
AT2G37750
|
hypothetical protein |
| arTal_v1_Chr2_-_17464242_17464242 | 1.38 |
AT2G41850.1
|
PGAZAT
|
polygalacturonase ADPG2-like protein |
| arTal_v1_Chr1_-_25662276_25662276 | 1.38 |
AT1G68450.1
|
PDE337
|
VQ motif-containing protein |
| arTal_v1_Chr5_-_17166032_17166032 | 1.37 |
AT5G42800.1
|
DFR
|
dihydroflavonol 4-reductase |
| arTal_v1_Chr1_+_1469541_1469541 | 1.34 |
AT1G05100.1
|
MAPKKK18
|
mitogen-activated protein kinase kinase kinase 18 |
| arTal_v1_Chr5_+_16290386_16290386 | 1.34 |
AT5G40690.1
|
AT5G40690
|
histone-lysine N-methyltransferase trithorax-like protein |
| arTal_v1_Chr4_+_14065992_14065992 | 1.33 |
AT4G28460.1
|
AT4G28460
|
transmembrane protein |
| arTal_v1_Chr5_-_26531176_26531176 | 1.32 |
AT5G66440.1
|
AT5G66440
|
tRNA-methyltransferase non-catalytic subunit trm6MTase subunit |
| arTal_v1_Chr1_-_27834207_27834207 | 1.32 |
AT1G74010.1
|
AT1G74010
|
Calcium-dependent phosphotriesterase superfamily protein |
| arTal_v1_Chr2_+_18577500_18577500 | 1.31 |
AT2G45040.1
|
AT2G45040
|
Matrixin family protein |
| arTal_v1_Chr1_+_175706_175706 | 1.29 |
AT1G01480.1
|
ACS2
|
1-amino-cyclopropane-1-carboxylate synthase 2 |
| arTal_v1_Chr1_-_460696_460831 | 1.28 |
AT1G02310.1
AT1G02310.2 |
MAN1
|
Glycosyl hydrolase superfamily protein |
| arTal_v1_Chr1_+_176141_176141 | 1.27 |
AT1G01480.2
|
ACS2
|
1-amino-cyclopropane-1-carboxylate synthase 2 |
| arTal_v1_Chr4_-_10182264_10182264 | 1.26 |
AT4G18425.1
|
AT4G18425
|
transmembrane protein, putative (DUF679) |
| arTal_v1_Chr3_-_7576623_7576721 | 1.26 |
AT3G21500.1
AT3G21500.3 AT3G21500.2 |
DXPS1
|
1-deoxy-D-xylulose 5-phosphate synthase 1 |
| arTal_v1_Chr2_+_15706285_15706285 | 1.25 |
AT2G37430.1
|
ZAT11
|
C2H2 and C2HC zinc fingers superfamily protein |
| arTal_v1_Chr4_+_2224422_2224427 | 1.23 |
AT4G04460.2
AT4G04460.1 |
AT4G04460
|
Saposin-like aspartyl protease family protein |
| arTal_v1_Chr3_+_2923518_2923518 | 1.22 |
AT3G09520.1
|
EXO70H4
|
exocyst subunit exo70 family protein H4 |
| arTal_v1_Chr4_+_13653579_13653579 | 1.21 |
AT4G27260.1
|
WES1
|
Auxin-responsive GH3 family protein |
| arTal_v1_Chr1_-_7906969_7906969 | 1.20 |
AT1G22400.1
|
UGT85A1
|
UDP-Glycosyltransferase superfamily protein |
| arTal_v1_Chr1_+_5820080_5820080 | 1.20 |
AT1G17020.1
|
SRG1
|
senescence-related gene 1 |
| arTal_v1_Chr5_-_21938396_21938396 | 1.19 |
AT5G54060.1
|
UF3GT
|
UDP-glucose:flavonoid 3-o-glucosyltransferase |
| arTal_v1_Chr3_-_1136397_1136397 | 1.19 |
AT3G04290.1
|
LTL1
|
Li-tolerant lipase 1 |
| arTal_v1_Chr4_+_12461907_12461907 | 1.18 |
AT4G24000.1
|
CSLG2
|
cellulose synthase like G2 |
| arTal_v1_Chr5_-_24702761_24702787 | 1.18 |
AT5G61430.2
AT5G61430.1 |
NAC100
|
NAC domain containing protein 100 |
| arTal_v1_Chr5_+_5658416_5658416 | 1.18 |
AT5G17220.1
|
GSTF12
|
glutathione S-transferase phi 12 |
| arTal_v1_Chr2_+_18558885_18558938 | 1.18 |
AT2G44990.2
AT2G44990.3 AT2G44990.1 |
CCD7
|
carotenoid cleavage dioxygenase 7 |
| arTal_v1_Chr3_+_5249112_5249112 | 1.18 |
AT3G15518.1
|
AT3G15518
|
hypothetical protein |
| arTal_v1_Chr1_-_13365172_13365172 | 1.17 |
AT1G35910.1
|
TPPD
|
Haloacid dehalogenase-like hydrolase (HAD) superfamily protein |
| arTal_v1_Chr3_-_3197457_3197457 | 1.17 |
AT3G10320.1
|
AT3G10320
|
Glycosyltransferase family 61 protein |
| arTal_v1_Chr2_+_6244772_6244772 | 1.17 |
AT2G14620.2
AT2G14620.3 AT2G14620.1 |
XTH10
|
xyloglucan endotransglucosylase/hydrolase 10 |
| arTal_v1_Chr5_-_21439133_21439133 | 1.17 |
AT5G52882.1
|
AT5G52882
|
P-loop containing nucleoside triphosphate hydrolases superfamily protein |
| arTal_v1_Chr4_-_10765781_10765795 | 1.17 |
AT4G19810.1
AT4G19810.2 |
ChiC
|
Glycosyl hydrolase family protein with chitinase insertion domain-containing protein |
| arTal_v1_Chr1_-_1996355_1996355 | 1.16 |
AT1G06520.1
|
GPAT1
|
glycerol-3-phosphate acyltransferase 1 |
| arTal_v1_Chr1_+_9825914_9825914 | 1.15 |
AT1G28130.2
|
GH3.17
|
Auxin-responsive GH3 family protein |
| arTal_v1_Chr5_+_579744_579852 | 1.14 |
AT5G02580.1
AT5G02580.3 AT5G02580.2 |
AT5G02580
|
argininosuccinate lyase |
| arTal_v1_Chr1_+_9825169_9825169 | 1.14 |
AT1G28130.1
|
GH3.17
|
Auxin-responsive GH3 family protein |
| arTal_v1_Chr5_+_22460550_22460550 | 1.14 |
AT5G55410.2
AT5G55410.1 |
AT5G55410
|
Bifunctional inhibitor/lipid-transfer protein/seed storage 2S albumin superfamily protein |
| arTal_v1_Chr5_+_16441808_16441808 | 1.13 |
AT5G41080.2
|
GDPD2
|
PLC-like phosphodiesterases superfamily protein |
| arTal_v1_Chr5_-_17994584_17994722 | 1.13 |
AT5G44610.3
AT5G44610.2 AT5G44610.1 |
MAP18
|
microtubule-associated protein 18 |
| arTal_v1_Chr5_-_26096114_26096114 | 1.12 |
AT5G65300.1
|
AT5G65300
|
hypothetical protein |
| arTal_v1_Chr4_-_13975919_13975919 | 1.11 |
AT4G28140.1
|
AT4G28140
|
Integrase-type DNA-binding superfamily protein |
| arTal_v1_Chr5_+_16441655_16441655 | 1.10 |
AT5G41080.1
|
GDPD2
|
PLC-like phosphodiesterases superfamily protein |
| arTal_v1_Chr5_-_15825566_15825566 | 1.10 |
AT5G39520.1
|
AT5G39520
|
hypothetical protein (DUF1997) |
| arTal_v1_Chr1_+_6568002_6568002 | 1.10 |
AT1G19020.1
|
AT1G19020
|
CDP-diacylglycerol-glycerol-3-phosphate 3-phosphatidyltransferase |
| arTal_v1_Chr2_-_399208_399338 | 1.10 |
AT2G01890.2
AT2G01890.1 |
PAP8
|
purple acid phosphatase 8 |
| arTal_v1_Chr1_-_10356482_10356482 | 1.09 |
AT1G29640.1
|
AT1G29640
|
senescence regulator (Protein of unknown function, DUF584) |
| arTal_v1_Chr4_+_12463312_12463312 | 1.09 |
AT4G24000.2
|
CSLG2
|
cellulose synthase like G2 |
| arTal_v1_Chr1_-_10184512_10184512 | 1.09 |
AT1G29160.1
|
AT1G29160
|
Dof-type zinc finger DNA-binding family protein |
| arTal_v1_Chr5_+_20455317_20455317 | 1.08 |
AT5G50260.1
|
CEP1
|
Cysteine proteinases superfamily protein |
| arTal_v1_Chr1_-_10720843_10720843 | 1.07 |
AT1G30370.1
|
DLAH
|
alpha/beta-Hydrolases superfamily protein |
| arTal_v1_Chr1_-_4633299_4633299 | 1.06 |
AT1G13520.1
|
AT1G13520
|
hypothetical protein (DUF1262) |
| arTal_v1_Chr4_+_14215473_14215473 | 1.05 |
AT4G28780.1
|
AT4G28780
|
GDSL-like Lipase/Acylhydrolase superfamily protein |
| arTal_v1_Chr5_+_25721733_25721733 | 1.05 |
AT5G64310.1
|
AGP1
|
arabinogalactan protein 1 |
| arTal_v1_Chr3_+_4408925_4408925 | 1.05 |
AT3G13520.1
|
AGP12
|
arabinogalactan protein 12 |
| arTal_v1_Chr3_-_21285941_21285941 | 1.04 |
AT3G57510.1
|
ADPG1
|
Pectin lyase-like superfamily protein |
| arTal_v1_Chr4_+_10142255_10142255 | 1.04 |
AT4G18350.1
|
NCED2
|
nine-cis-epoxycarotenoid dioxygenase 2 |
| arTal_v1_Chr3_+_10520443_10520502 | 1.04 |
AT3G28210.1
AT3G28210.2 |
PMZ
|
zinc finger (AN1-like) family protein |
| arTal_v1_Chr2_-_9538963_9538963 | 1.04 |
AT2G22470.1
|
AGP2
|
arabinogalactan protein 2 |
| arTal_v1_Chr2_-_10835483_10835483 | 1.04 |
AT2G25460.1
|
AT2G25460
|
EEIG1/EHBP1 protein amino-terminal domain protein |
| arTal_v1_Chr5_-_216773_216773 | 1.03 |
AT5G01550.1
|
LECRKA4.2
|
lectin receptor kinase a4.1 |
| arTal_v1_Chr5_-_26857086_26857086 | 1.03 |
AT5G67310.1
|
CYP81G1
|
cytochrome P450, family 81, subfamily G, polypeptide 1 |
| arTal_v1_Chr2_-_18463533_18463533 | 1.03 |
AT2G44790.1
|
UCC2
|
uclacyanin 2 |
| arTal_v1_Chr3_-_20769324_20769410 | 1.03 |
AT3G55970.2
AT3G55970.1 |
JRG21
|
jasmonate-regulated gene 21 |
| arTal_v1_Chr3_-_1063103_1063234 | 1.02 |
AT3G04070.2
AT3G04070.1 |
NAC047
|
NAC domain containing protein 47 |
| arTal_v1_Chr1_-_1257893_1257893 | 1.02 |
AT1G04580.1
|
AO4
|
aldehyde oxidase 4 |
| arTal_v1_Chr2_-_10835660_10835660 | 1.01 |
AT2G25460.2
|
AT2G25460
|
EEIG1/EHBP1 protein amino-terminal domain protein |
| arTal_v1_Chr4_+_13275200_13275200 | 1.00 |
AT4G26200.1
|
ACS7
|
1-amino-cyclopropane-1-carboxylate synthase 7 |
| arTal_v1_Chr1_+_2867203_2867271 | 0.99 |
AT1G08920.1
AT1G08920.2 AT1G08920.3 |
ESL1
|
ERD (early response to dehydration) six-like 1 |
| arTal_v1_Chr2_-_15419391_15419391 | 0.99 |
AT2G36780.1
|
AT2G36780
|
UDP-Glycosyltransferase superfamily protein |
| arTal_v1_Chr1_+_27308513_27308513 | 0.99 |
AT1G72520.1
|
LOX4
|
PLAT/LH2 domain-containing lipoxygenase family protein |
| arTal_v1_Chr3_-_845096_845096 | 0.99 |
AT3G03530.1
|
NPC4
|
non-specific phospholipase C4 |
| arTal_v1_Chr1_-_22317070_22317070 | 0.98 |
AT1G60590.1
|
AT1G60590
|
Pectin lyase-like superfamily protein |
| arTal_v1_Chr5_-_4151201_4151201 | 0.98 |
AT5G13080.1
|
WRKY75
|
WRKY DNA-binding protein 75 |
| arTal_v1_Chr1_-_27837443_27837443 | 0.98 |
AT1G74020.1
|
SS2
|
strictosidine synthase 2 |
| arTal_v1_Chr4_-_15991536_15991633 | 0.98 |
AT4G33150.1
AT4G33150.2 |
AT4G33150
|
lysine-ketoglutarate reductase/saccharopine dehydrogenase bifunctional enzyme |
| arTal_v1_Chr1_+_5795879_5795879 | 0.97 |
AT1G16950.1
|
AT1G16950
|
transmembrane protein |
| arTal_v1_Chr2_+_15514923_15514923 | 0.97 |
AT2G36950.1
|
AT2G36950
|
Heavy metal transport/detoxification superfamily protein |
| arTal_v1_Chr5_+_16431304_16431391 | 0.96 |
AT5G41040.1
AT5G41040.2 |
RWP1
|
HXXXD-type acyl-transferase family protein |
| arTal_v1_Chr3_-_387051_387051 | 0.96 |
AT3G02140.1
|
TMAC2
|
AFP2 (ABI five-binding protein 2) family protein |
| arTal_v1_Chr4_+_11663186_11663186 | 0.96 |
AT4G22010.1
|
sks4
|
SKU5 similar 4 |
| arTal_v1_Chr3_-_10590685_10590685 | 0.96 |
AT3G28340.1
|
GATL10
|
galacturonosyltransferase-like 10 |
| arTal_v1_Chr4_-_15991202_15991202 | 0.96 |
AT4G33150.4
|
AT4G33150
|
lysine-ketoglutarate reductase/saccharopine dehydrogenase bifunctional enzyme |
| arTal_v1_Chr2_-_13101371_13101371 | 0.95 |
AT2G30750.1
|
CYP71A12
|
cytochrome P450 family 71 polypeptide |
| arTal_v1_Chr4_+_14579563_14579563 | 0.95 |
AT4G29780.1
|
AT4G29780
|
nuclease |
| arTal_v1_Chr1_-_9293862_9293862 | 0.94 |
AT1G26820.1
|
RNS3
|
ribonuclease 3 |
| arTal_v1_Chr2_-_398566_398566 | 0.94 |
AT2G01890.3
|
PAP8
|
purple acid phosphatase 8 |
| arTal_v1_Chr4_+_14304921_14304921 | 0.94 |
AT4G29020.2
AT4G29020.1 |
AT4G29020
|
glycine-rich protein |
| arTal_v1_Chr4_+_1464467_1464467 | 0.94 |
AT4G03320.1
|
Tic20-IV
|
translocon at the inner envelope membrane of chloroplasts 20-IV |
| arTal_v1_Chr4_-_7686873_7687006 | 0.93 |
AT4G13250.2
AT4G13250.1 |
NYC1
|
NAD(P)-binding Rossmann-fold superfamily protein |
| arTal_v1_Chr4_+_7156150_7156150 | 0.93 |
AT4G11910.1
|
AT4G11910
|
STAY-GREEN-like protein |
| arTal_v1_Chr3_+_22716238_22716349 | 0.93 |
AT3G61390.1
AT3G61390.2 AT3G61390.3 AT3G61390.4 AT3G61390.5 |
AT3G61390
|
RING/U-box superfamily protein |
| arTal_v1_Chr1_-_8912642_8912642 | 0.93 |
AT1G25400.2
|
AT1G25400
|
transmembrane protein |
| arTal_v1_Chr4_+_5811115_5811115 | 0.92 |
AT4G09100.1
|
AT4G09100
|
RING/U-box superfamily protein |
| arTal_v1_Chr1_-_6625856_6625856 | 0.92 |
AT1G19200.1
|
AT1G19200
|
cyclin-dependent kinase, putative (DUF581) |
| arTal_v1_Chr2_-_14541617_14541617 | 0.92 |
AT2G34500.1
|
CYP710A1
|
cytochrome P450, family 710, subfamily A, polypeptide 1 |
| arTal_v1_Chr1_+_22824414_22824414 | 0.92 |
AT1G61800.2
AT1G61800.1 |
GPT2
|
glucose-6-phosphate/phosphate translocator 2 |
| arTal_v1_Chr2_-_275002_275002 | 0.91 |
AT2G01610.1
|
AT2G01610
|
Plant invertase/pectin methylesterase inhibitor superfamily protein |
| arTal_v1_Chr2_-_14322082_14322082 | 0.91 |
AT2G33850.1
|
AT2G33850
|
E6-like protein |
| arTal_v1_Chr3_-_84901_84901 | 0.91 |
AT3G01270.1
|
AT3G01270
|
Pectate lyase family protein |
| arTal_v1_Chr3_-_1956397_1956397 | 0.91 |
AT3G06420.1
|
ATG8H
|
Ubiquitin-like superfamily protein |
| arTal_v1_Chr1_-_8912822_8912822 | 0.91 |
AT1G25400.1
|
AT1G25400
|
transmembrane protein |
| arTal_v1_Chr4_-_12143833_12143858 | 0.91 |
AT4G23190.1
AT4G23190.2 AT4G23190.3 |
CRK11
|
cysteine-rich RLK (RECEPTOR-like protein kinase) 11 |
| arTal_v1_Chr3_+_18007098_18007181 | 0.91 |
AT3G48580.1
AT3G48580.2 AT3G48580.3 |
XTH11
|
xyloglucan endotransglucosylase/hydrolase 11 |
| arTal_v1_Chr5_-_10213598_10213598 | 0.90 |
AT5G28237.1
AT5G28237.2 |
AT5G28237
|
Pyridoxal-5'-phosphate-dependent enzyme family protein |
| arTal_v1_Chr1_-_6626217_6626217 | 0.90 |
AT1G19200.2
|
AT1G19200
|
cyclin-dependent kinase, putative (DUF581) |
| arTal_v1_Chr1_+_29292075_29292190 | 0.90 |
AT1G77890.1
AT1G77890.4 AT1G77890.2 AT1G77890.3 |
AT1G77890
|
DNA-directed RNA polymerase II protein |
| arTal_v1_Chr2_-_13856297_13856297 | 0.90 |
AT2G32660.2
|
RLP22
|
receptor like protein 22 |
| arTal_v1_Chr4_-_15988441_15988441 | 0.90 |
AT4G33150.3
|
AT4G33150
|
lysine-ketoglutarate reductase/saccharopine dehydrogenase bifunctional enzyme |
| arTal_v1_Chr4_+_8392825_8392825 | 0.90 |
AT4G14630.1
|
GLP9
|
germin-like protein 9 |
| arTal_v1_Chr3_+_5234457_5234457 | 0.90 |
AT3G15500.1
|
NAC3
|
NAC domain containing protein 3 |
| arTal_v1_Chr3_-_4269691_4269691 | 0.89 |
AT3G13229.1
|
AT3G13229
|
kinesin-like protein (DUF868) |
| arTal_v1_Chr4_+_8908763_8908879 | 0.89 |
AT4G15610.1
AT4G15610.2 |
AT4G15610
|
Uncharacterized protein family (UPF0497) |
| arTal_v1_Chr3_+_3667205_3667205 | 0.89 |
AT3G11600.1
|
AT3G11600
|
E3 ubiquitin-protein ligase |
| arTal_v1_Chr4_-_18179183_18179266 | 0.89 |
AT4G39010.2
AT4G39010.1 |
GH9B18
|
glycosyl hydrolase 9B18 |
| arTal_v1_Chr3_-_23298534_23298534 | 0.89 |
AT3G63050.1
|
AT3G63050
|
hypothetical protein |
| arTal_v1_Chr1_-_17438357_17438490 | 0.89 |
AT1G47510.2
AT1G47510.3 AT1G47510.1 |
5PTASE11
|
inositol polyphosphate 5-phosphatase 11 |
| arTal_v1_Chr2_-_8533779_8533779 | 0.88 |
AT2G19800.1
|
MIOX2
|
myo-inositol oxygenase 2 |
| arTal_v1_Chr2_-_18784347_18784369 | 0.88 |
AT2G45580.3
AT2G45580.2 |
CYP76C3
|
cytochrome P450, family 76, subfamily C, polypeptide 3 |
| arTal_v1_Chr3_-_20895634_20895634 | 0.88 |
AT3G56350.1
|
AT3G56350
|
Iron/manganese superoxide dismutase family protein |
| arTal_v1_Chr2_-_16780368_16780368 | 0.88 |
AT2G40170.1
|
GEA6
|
Stress induced protein |
| arTal_v1_Chr1_+_23527570_23527570 | 0.88 |
AT1G63440.1
|
HMA5
|
heavy metal atpase 5 |
| arTal_v1_Chr3_-_2498095_2498095 | 0.88 |
AT3G07820.1
|
AT3G07820
|
Pectin lyase-like superfamily protein |
| arTal_v1_Chr3_+_2003393_2003393 | 0.88 |
AT3G06490.1
|
MYB108
|
myb domain protein 108 |
| arTal_v1_Chr4_+_17444315_17444315 | 0.87 |
AT4G37010.1
|
CEN2
|
centrin 2 |
| arTal_v1_Chr4_-_17494279_17494279 | 0.87 |
AT4G37150.1
|
MES9
|
methyl esterase 9 |
| arTal_v1_Chr2_-_9173490_9173490 | 0.87 |
AT2G21430.1
|
AT2G21430
|
Papain family cysteine protease |
| arTal_v1_Chr1_-_5293338_5293338 | 0.87 |
AT1G15385.1
|
AT1G15385
|
cotton fiber protein |
| arTal_v1_Chr1_+_23082036_23082036 | 0.86 |
AT1G62380.1
|
ACO2
|
ACC oxidase 2 |
| arTal_v1_Chr1_+_6508797_6508797 | 0.86 |
AT1G18860.1
|
WRKY61
|
WRKY DNA-binding protein 61 |
| arTal_v1_Chr5_+_21984569_21984569 | 0.86 |
AT5G54165.1
|
AT5G54165
|
Avr9/Cf-9 rapidly elicited protein |
| arTal_v1_Chr4_-_17571743_17571743 | 0.86 |
AT4G37370.1
|
CYP81D8
|
cytochrome P450, family 81, subfamily D, polypeptide 8 |
| arTal_v1_Chr4_+_17444129_17444129 | 0.86 |
AT4G37010.2
|
CEN2
|
centrin 2 |
| arTal_v1_Chr4_-_1046993_1047105 | 0.86 |
AT4G02380.2
AT4G02380.1 AT4G02380.3 |
SAG21
|
senescence-associated gene 21 |
| arTal_v1_Chr4_+_17553310_17553310 | 0.86 |
AT4G37295.1
|
AT4G37295
|
hypothetical protein |
| arTal_v1_Chr3_+_21306609_21306723 | 0.85 |
AT3G57550.1
AT3G57550.2 |
AGK2
|
guanylate kinase |
| arTal_v1_Chr4_+_17592996_17592996 | 0.85 |
AT4G37420.1
|
AT4G37420
|
glycosyltransferase family protein (DUF23) |
| arTal_v1_Chr3_+_9892791_9892791 | 0.85 |
AT3G26840.1
|
PES2
|
Esterase/lipase/thioesterase family protein |
| arTal_v1_Chr3_-_11400332_11400332 | 0.85 |
AT3G29590.1
|
AT5MAT
|
HXXXD-type acyl-transferase family protein |
| arTal_v1_Chr2_-_13856112_13856112 | 0.85 |
AT2G32660.1
|
RLP22
|
receptor like protein 22 |
| arTal_v1_Chr4_+_994726_994726 | 0.84 |
AT4G02280.1
|
SUS3
|
sucrose synthase 3 |
| arTal_v1_Chr1_+_23168767_23168767 | 0.84 |
AT1G62570.1
|
FMO GS-OX4
|
flavin-monooxygenase glucosinolate S-oxygenase 4 |
| arTal_v1_Chr3_+_19243902_19243902 | 0.84 |
AT3G51870.1
|
AT3G51870
|
Mitochondrial substrate carrier family protein |
| arTal_v1_Chr1_+_6996354_6996354 | 0.83 |
AT1G20180.2
|
AT1G20180
|
transmembrane protein (DUF677) |
| arTal_v1_Chr5_-_1293723_1293723 | 0.83 |
AT5G04530.1
|
KCS19
|
3-ketoacyl-CoA synthase 19 |
| arTal_v1_Chr5_-_17881483_17881495 | 0.83 |
AT5G44380.1
AT5G44380.2 |
AT5G44380
|
FAD-binding Berberine family protein |
| arTal_v1_Chr3_+_21307021_21307021 | 0.82 |
AT3G57550.3
|
AGK2
|
guanylate kinase |
| arTal_v1_Chr5_-_4423095_4423095 | 0.82 |
AT5G13700.1
|
PAO1
|
polyamine oxidase 1 |
| arTal_v1_Chr1_-_9131779_9131779 | 0.82 |
AT1G26390.1
|
AT1G26390
|
FAD-binding Berberine family protein |
| arTal_v1_Chr3_-_18980004_18980053 | 0.82 |
AT3G51090.2
AT3G51090.1 |
AT3G51090
|
coiled-coil 90B-like protein (DUF1640) |
| arTal_v1_Chr3_+_21261046_21261046 | 0.81 |
AT3G57450.1
|
AT3G57450
|
hypothetical protein |
| arTal_v1_Chr1_+_25765718_25765718 | 0.81 |
AT1G68620.1
|
AT1G68620
|
alpha/beta-Hydrolases superfamily protein |
| arTal_v1_Chr5_-_15461459_15461459 | 0.81 |
AT5G38610.1
|
AT5G38610
|
Plant invertase/pectin methylesterase inhibitor superfamily protein |
| arTal_v1_Chr1_+_6996176_6996176 | 0.81 |
AT1G20180.1
|
AT1G20180
|
transmembrane protein (DUF677) |
| arTal_v1_Chr2_-_17992047_17992047 | 0.81 |
AT2G43290.1
|
MSS3
|
Calcium-binding EF-hand family protein |
| arTal_v1_Chr1_-_10071108_10071108 | 0.81 |
AT1G28650.1
|
AT1G28650
|
GDSL-like Lipase/Acylhydrolase superfamily protein |
| arTal_v1_Chr3_-_6815403_6815403 | 0.81 |
AT3G19615.1
|
AT3G19615
|
beta-1,4-xylosidase |
| arTal_v1_Chr1_+_10010124_10010124 | 0.81 |
AT1G28470.1
|
NAC010
|
NAC domain containing protein 10 |
| arTal_v1_Chr1_-_29248150_29248150 | 0.81 |
AT1G77770.1
AT1G77770.2 AT1G77770.3 |
AT1G77770
|
forkhead box protein, putative (DUF1644) |
| arTal_v1_Chr3_+_22048557_22048557 | 0.80 |
AT3G59690.2
AT3G59690.1 |
IQD13
|
IQ-domain 13 |
| arTal_v1_Chr4_-_14776058_14776058 | 0.80 |
AT4G30190.2
|
HA2
|
H[+]-ATPase 2 |
| arTal_v1_Chr4_-_14776247_14776247 | 0.80 |
AT4G30190.1
|
HA2
|
H[+]-ATPase 2 |
| arTal_v1_Chr2_-_13800099_13800099 | 0.80 |
AT2G32510.1
|
MAPKKK17
|
mitogen-activated protein kinase kinase kinase 17 |
| arTal_v1_Chr5_-_5356353_5356353 | 0.80 |
AT5G16360.1
|
AT5G16360
|
NC domain-containing protein-like protein |
| arTal_v1_Chr1_-_30129649_30129649 | 0.80 |
AT1G80080.1
|
TMM
|
Leucine-rich repeat (LRR) family protein |
| arTal_v1_Chr3_-_829926_829926 | 0.79 |
AT3G03480.1
|
CHAT
|
acetyl CoA:(Z)-3-hexen-1-ol acetyltransferase |
| arTal_v1_Chr4_-_10612135_10612135 | 0.79 |
AT4G19460.1
|
AT4G19460
|
UDP-Glycosyltransferase superfamily protein |
| arTal_v1_Chr5_+_4461554_4461554 | 0.79 |
AT5G13820.2
|
TBP1
|
telomeric DNA binding protein 1 |
| arTal_v1_Chr3_+_512220_512220 | 0.79 |
AT3G02480.1
|
AT3G02480
|
Late embryogenesis abundant protein (LEA) family protein |
| arTal_v1_Chr2_+_8647721_8647721 | 0.79 |
AT2G20030.1
|
AT2G20030
|
RING/U-box superfamily protein |
| arTal_v1_Chr4_-_12345652_12345652 | 0.78 |
AT4G23700.2
|
CHX17
|
cation/H+ exchanger 17 |
| arTal_v1_Chr5_+_24958125_24958125 | 0.78 |
AT5G62150.1
|
AT5G62150
|
peptidoglycan-binding LysM domain-containing protein |
| arTal_v1_Chr3_+_21621994_21622002 | 0.78 |
AT3G58450.2
AT3G58450.1 |
AT3G58450
|
Adenine nucleotide alpha hydrolases-like superfamily protein |
| arTal_v1_Chr4_-_12346051_12346051 | 0.78 |
AT4G23700.1
|
CHX17
|
cation/H+ exchanger 17 |
| arTal_v1_Chr3_-_4657723_4657723 | 0.78 |
AT3G14060.1
|
AT3G14060
|
hypothetical protein |
| arTal_v1_Chr5_-_23289635_23289635 | 0.78 |
AT5G57510.1
|
AT5G57510
|
cotton fiber protein |
| arTal_v1_Chr3_+_19417372_19417401 | 0.78 |
AT3G52370.2
AT3G52370.1 |
FLA15
|
FASCICLIN-like arabinogalactan protein 15 precursor |
| arTal_v1_Chr5_+_4460840_4460840 | 0.77 |
AT5G13820.1
|
TBP1
|
telomeric DNA binding protein 1 |
| arTal_v1_Chr1_-_24558322_24558322 | 0.77 |
AT1G65970.1
|
TPX2
|
thioredoxin-dependent peroxidase 2 |
| arTal_v1_Chr4_+_13128394_13128394 | 0.77 |
AT4G25810.1
|
XTR6
|
xyloglucan endotransglycosylase 6 |
| arTal_v1_Chr5_-_19542760_19542760 | 0.77 |
AT5G48180.1
|
NSP5
|
nitrile specifier protein 5 |
| arTal_v1_Chr5_+_3545211_3545211 | 0.77 |
AT5G11140.1
|
AT5G11140
|
phospholipase-like protein (PEARLI 4) family protein |
| arTal_v1_Chr5_-_6042938_6043014 | 0.77 |
AT5G18270.2
AT5G18270.1 |
ANAC087
|
NAC domain containing protein 87 |
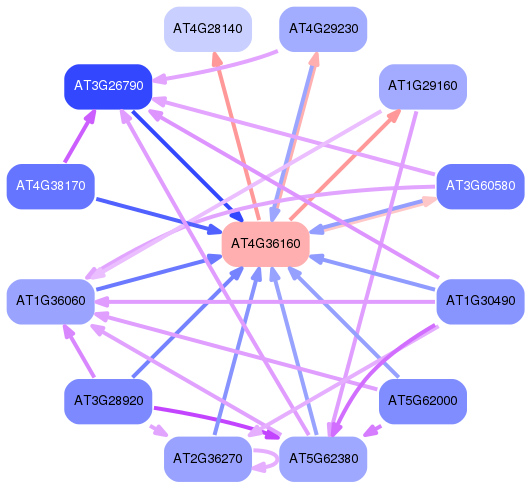
Network of associatons between targets according to the STRING database.

First level regulatory network of AT4G36160
Gene Ontology Analysis
Gene overrepresentation in biological process category:
| Log-likelihood per target | Total log-likelihood | Term | Description |
|---|---|---|---|
| 0.9 | 2.6 | GO:0016124 | tetraterpenoid catabolic process(GO:0016110) carotenoid catabolic process(GO:0016118) xanthophyll catabolic process(GO:0016124) |
| 0.9 | 2.6 | GO:0031115 | negative regulation of microtubule polymerization(GO:0031115) |
| 0.8 | 2.4 | GO:0044277 | cell wall modification involved in abscission(GO:0009830) cell wall disassembly(GO:0044277) |
| 0.7 | 2.0 | GO:0044236 | collagen metabolic process(GO:0032963) multicellular organism metabolic process(GO:0044236) multicellular organismal macromolecule metabolic process(GO:0044259) |
| 0.6 | 2.6 | GO:0033306 | phytol metabolic process(GO:0033306) |
| 0.6 | 1.8 | GO:0072708 | response to sorbitol(GO:0072708) |
| 0.6 | 1.7 | GO:0007098 | centrosome cycle(GO:0007098) centriole replication(GO:0007099) centrosome organization(GO:0051297) centrosome duplication(GO:0051298) centriole assembly(GO:0098534) |
| 0.6 | 2.2 | GO:0046475 | glycerophospholipid catabolic process(GO:0046475) |
| 0.5 | 1.6 | GO:0015696 | ammonium transport(GO:0015696) |
| 0.5 | 2.4 | GO:0042218 | 1-aminocyclopropane-1-carboxylate biosynthetic process(GO:0042218) |
| 0.4 | 2.7 | GO:0071732 | cellular response to nitric oxide(GO:0071732) |
| 0.4 | 1.3 | GO:0031506 | cell wall mannoprotein biosynthetic process(GO:0000032) mannoprotein metabolic process(GO:0006056) mannoprotein biosynthetic process(GO:0006057) cell wall glycoprotein biosynthetic process(GO:0031506) |
| 0.4 | 1.3 | GO:0010045 | response to nickel cation(GO:0010045) |
| 0.4 | 1.2 | GO:0006148 | inosine catabolic process(GO:0006148) inosine metabolic process(GO:0046102) |
| 0.4 | 1.5 | GO:0009270 | response to humidity(GO:0009270) |
| 0.4 | 2.6 | GO:0090548 | response to nitrate starvation(GO:0090548) |
| 0.4 | 1.8 | GO:0010226 | response to lithium ion(GO:0010226) |
| 0.4 | 1.1 | GO:0009413 | response to flooding(GO:0009413) |
| 0.3 | 0.3 | GO:0019322 | pentose biosynthetic process(GO:0019322) arabinose biosynthetic process(GO:0019567) |
| 0.3 | 1.0 | GO:0010055 | atrichoblast differentiation(GO:0010055) |
| 0.3 | 1.6 | GO:0016137 | glycoside metabolic process(GO:0016137) |
| 0.3 | 1.3 | GO:0006065 | aminoglycan biosynthetic process(GO:0006023) glycosaminoglycan biosynthetic process(GO:0006024) UDP-glucuronate biosynthetic process(GO:0006065) glycosaminoglycan metabolic process(GO:0030203) |
| 0.3 | 1.2 | GO:1902457 | negative regulation of stomatal opening(GO:1902457) |
| 0.3 | 0.9 | GO:0015717 | triose phosphate transport(GO:0015717) triose phosphate transmembrane transport(GO:0035436) |
| 0.3 | 1.5 | GO:0019310 | inositol catabolic process(GO:0019310) |
| 0.3 | 2.5 | GO:0051410 | detoxification of nitrogen compound(GO:0051410) |
| 0.3 | 0.5 | GO:0002697 | regulation of immune effector process(GO:0002697) regulation of defense response to virus(GO:0050688) |
| 0.3 | 0.8 | GO:0010597 | green leaf volatile biosynthetic process(GO:0010597) |
| 0.3 | 0.8 | GO:0060236 | regulation of mitotic spindle organization(GO:0060236) regulation of spindle organization(GO:0090224) |
| 0.2 | 0.7 | GO:1903889 | negative regulation of cell fate specification(GO:0009996) negative regulation of trichoblast fate specification(GO:0010062) negative regulation of plant epidermal cell differentiation(GO:1903889) |
| 0.2 | 1.2 | GO:1902418 | (+)-abscisic acid D-glucopyranosyl ester transmembrane transport(GO:1902418) |
| 0.2 | 1.6 | GO:0090059 | protoxylem development(GO:0090059) |
| 0.2 | 0.9 | GO:0034720 | histone H3-K4 demethylation(GO:0034720) |
| 0.2 | 1.6 | GO:0009745 | sucrose mediated signaling(GO:0009745) |
| 0.2 | 1.6 | GO:0080148 | negative regulation of response to water deprivation(GO:0080148) |
| 0.2 | 1.1 | GO:0002679 | respiratory burst involved in defense response(GO:0002679) respiratory burst(GO:0045730) |
| 0.2 | 0.4 | GO:0032196 | transposition(GO:0032196) |
| 0.2 | 0.6 | GO:0006369 | termination of RNA polymerase II transcription(GO:0006369) |
| 0.2 | 1.5 | GO:0071244 | cellular response to carbon dioxide(GO:0071244) |
| 0.2 | 1.1 | GO:1900384 | regulation of flavonol biosynthetic process(GO:1900384) |
| 0.2 | 1.9 | GO:0033319 | UDP-D-xylose metabolic process(GO:0033319) UDP-D-xylose biosynthetic process(GO:0033320) |
| 0.2 | 1.2 | GO:0043290 | sesquiterpenoid catabolic process(GO:0016107) apocarotenoid catabolic process(GO:0043290) abscisic acid catabolic process(GO:0046345) |
| 0.2 | 0.6 | GO:0015802 | basic amino acid transport(GO:0015802) |
| 0.2 | 1.4 | GO:0010019 | chloroplast-nucleus signaling pathway(GO:0010019) |
| 0.2 | 0.6 | GO:0055047 | generative cell mitosis(GO:0055047) |
| 0.2 | 0.8 | GO:1900378 | positive regulation of secondary metabolite biosynthetic process(GO:1900378) |
| 0.2 | 1.7 | GO:0010304 | PSII associated light-harvesting complex II catabolic process(GO:0010304) |
| 0.2 | 0.9 | GO:0009957 | epidermal cell fate specification(GO:0009957) |
| 0.2 | 0.9 | GO:0034497 | protein localization to pre-autophagosomal structure(GO:0034497) |
| 0.2 | 1.2 | GO:0033540 | fatty acid beta-oxidation using acyl-CoA oxidase(GO:0033540) |
| 0.2 | 0.5 | GO:1900459 | positive regulation of brassinosteroid mediated signaling pathway(GO:1900459) |
| 0.2 | 1.1 | GO:0010581 | regulation of starch biosynthetic process(GO:0010581) |
| 0.2 | 0.9 | GO:0010142 | farnesyl diphosphate biosynthetic process, mevalonate pathway(GO:0010142) isoprenoid biosynthetic process via mevalonate(GO:1902767) |
| 0.2 | 0.7 | GO:0046477 | glycosylceramide metabolic process(GO:0006677) glucosylceramide metabolic process(GO:0006678) glucosylceramide catabolic process(GO:0006680) glycosphingolipid metabolic process(GO:0006687) glycolipid catabolic process(GO:0019377) glycosylceramide catabolic process(GO:0046477) glycosphingolipid catabolic process(GO:0046479) ceramide catabolic process(GO:0046514) |
| 0.2 | 1.0 | GO:0010273 | detoxification of copper ion(GO:0010273) stress response to copper ion(GO:1990169) |
| 0.2 | 1.0 | GO:0006654 | phosphatidic acid biosynthetic process(GO:0006654) |
| 0.2 | 0.5 | GO:1901656 | glycoside transport(GO:1901656) |
| 0.2 | 0.5 | GO:0051938 | L-amino acid import(GO:0043092) L-glutamate import(GO:0051938) |
| 0.2 | 0.2 | GO:0010192 | mucilage biosynthetic process(GO:0010192) |
| 0.2 | 0.7 | GO:0019427 | acetyl-CoA biosynthetic process from acetate(GO:0019427) |
| 0.2 | 1.1 | GO:0046482 | para-aminobenzoic acid metabolic process(GO:0046482) |
| 0.2 | 1.0 | GO:0006567 | threonine catabolic process(GO:0006567) |
| 0.2 | 0.5 | GO:0040030 | regulation of molecular function, epigenetic(GO:0040030) negative regulation of molecular function, epigenetic(GO:0045857) |
| 0.2 | 0.8 | GO:0010376 | stomatal complex formation(GO:0010376) |
| 0.2 | 0.3 | GO:0009963 | positive regulation of flavonoid biosynthetic process(GO:0009963) |
| 0.2 | 0.6 | GO:1900409 | positive regulation of cellular response to oxidative stress(GO:1900409) |
| 0.2 | 0.9 | GO:0046339 | diacylglycerol metabolic process(GO:0046339) |
| 0.2 | 0.5 | GO:0006430 | lysyl-tRNA aminoacylation(GO:0006430) |
| 0.2 | 0.5 | GO:0002215 | defense response to nematode(GO:0002215) |
| 0.1 | 1.5 | GO:0051365 | cellular response to potassium ion starvation(GO:0051365) |
| 0.1 | 0.3 | GO:1901379 | regulation of potassium ion transmembrane transport(GO:1901379) regulation of cation transmembrane transport(GO:1904062) |
| 0.1 | 1.5 | GO:0009554 | megasporogenesis(GO:0009554) |
| 0.1 | 0.7 | GO:0010395 | rhamnogalacturonan I metabolic process(GO:0010395) |
| 0.1 | 0.3 | GO:1902884 | positive regulation of response to oxidative stress(GO:1902884) |
| 0.1 | 0.4 | GO:0009265 | nucleoside triphosphate catabolic process(GO:0009143) pyrimidine deoxyribonucleoside triphosphate metabolic process(GO:0009211) pyrimidine deoxyribonucleotide metabolic process(GO:0009219) pyrimidine deoxyribonucleotide biosynthetic process(GO:0009221) deoxyribonucleotide catabolic process(GO:0009264) 2'-deoxyribonucleotide biosynthetic process(GO:0009265) deoxyribose phosphate biosynthetic process(GO:0046385) |
| 0.1 | 1.7 | GO:0045226 | UDP-L-arabinose biosynthetic process(GO:0033358) extracellular polysaccharide biosynthetic process(GO:0045226) capsule polysaccharide biosynthetic process(GO:0045227) capsule organization(GO:0045230) extracellular polysaccharide metabolic process(GO:0046379) |
| 0.1 | 0.4 | GO:0071457 | cellular response to ozone(GO:0071457) |
| 0.1 | 0.4 | GO:1904580 | regulation of intracellular mRNA localization(GO:1904580) |
| 0.1 | 0.3 | GO:0046104 | deoxyribonucleoside metabolic process(GO:0009120) thymidine metabolic process(GO:0046104) pyrimidine deoxyribonucleoside metabolic process(GO:0046125) |
| 0.1 | 0.5 | GO:0046741 | transport of virus in host, tissue to tissue(GO:0046741) |
| 0.1 | 0.9 | GO:0006552 | leucine catabolic process(GO:0006552) |
| 0.1 | 0.1 | GO:0006499 | N-terminal protein lipidation(GO:0006498) N-terminal protein myristoylation(GO:0006499) protein myristoylation(GO:0018377) |
| 0.1 | 4.0 | GO:0009718 | anthocyanin-containing compound biosynthetic process(GO:0009718) |
| 0.1 | 1.5 | GO:0080086 | stamen filament development(GO:0080086) |
| 0.1 | 0.5 | GO:0080094 | response to trehalose-6-phosphate(GO:0080094) |
| 0.1 | 1.2 | GO:0009942 | longitudinal axis specification(GO:0009942) |
| 0.1 | 0.6 | GO:1903313 | positive regulation of mRNA metabolic process(GO:1903313) |
| 0.1 | 0.5 | GO:0010480 | microsporocyte differentiation(GO:0010480) |
| 0.1 | 3.6 | GO:0046856 | phosphatidylinositol dephosphorylation(GO:0046856) |
| 0.1 | 2.2 | GO:0046341 | CDP-diacylglycerol biosynthetic process(GO:0016024) CDP-diacylglycerol metabolic process(GO:0046341) |
| 0.1 | 1.8 | GO:0006022 | aminoglycan metabolic process(GO:0006022) |
| 0.1 | 0.7 | GO:0042981 | apoptotic process(GO:0006915) regulation of apoptotic process(GO:0042981) negative regulation of apoptotic process(GO:0043066) |
| 0.1 | 2.2 | GO:0001933 | negative regulation of protein phosphorylation(GO:0001933) negative regulation of phosphorylation(GO:0042326) |
| 0.1 | 0.6 | GO:0046208 | spermine catabolic process(GO:0046208) |
| 0.1 | 0.3 | GO:0033477 | S-methylmethionine metabolic process(GO:0033477) S-methylmethionine cycle(GO:0033528) |
| 0.1 | 0.9 | GO:0010047 | fruit dehiscence(GO:0010047) |
| 0.1 | 0.3 | GO:0098532 | histone H3-K27 trimethylation(GO:0098532) regulation of histone H3-K27 trimethylation(GO:1902464) |
| 0.1 | 0.3 | GO:0090213 | regulation of radial pattern formation(GO:0090213) |
| 0.1 | 0.3 | GO:1902289 | negative regulation of defense response to oomycetes(GO:1902289) |
| 0.1 | 0.4 | GO:0048657 | anther wall tapetum formation(GO:0048656) anther wall tapetum cell differentiation(GO:0048657) |
| 0.1 | 0.6 | GO:0042447 | cytokinin catabolic process(GO:0009823) hormone catabolic process(GO:0042447) |
| 0.1 | 0.5 | GO:0051289 | sulfur amino acid catabolic process(GO:0000098) aspartate family amino acid catabolic process(GO:0009068) protein homotetramerization(GO:0051289) |
| 0.1 | 1.3 | GO:0017157 | regulation of exocytosis(GO:0017157) |
| 0.1 | 0.5 | GO:0080024 | indolebutyric acid metabolic process(GO:0080024) |
| 0.1 | 0.6 | GO:0009643 | photosynthetic acclimation(GO:0009643) |
| 0.1 | 0.8 | GO:0042360 | vitamin E biosynthetic process(GO:0010189) vitamin E metabolic process(GO:0042360) |
| 0.1 | 0.5 | GO:0000056 | ribosomal small subunit export from nucleus(GO:0000056) regulation of protein export from nucleus(GO:0046825) |
| 0.1 | 0.3 | GO:1901404 | regulation of chlorophyll catabolic process(GO:0010271) regulation of tetrapyrrole catabolic process(GO:1901404) |
| 0.1 | 0.3 | GO:0006434 | seryl-tRNA aminoacylation(GO:0006434) selenocysteinyl-tRNA(Sec) biosynthetic process(GO:0097056) |
| 0.1 | 0.6 | GO:0033356 | UDP-L-arabinose metabolic process(GO:0033356) |
| 0.1 | 2.0 | GO:0006826 | iron ion transport(GO:0006826) |
| 0.1 | 0.5 | GO:0060151 | peroxisome localization(GO:0060151) |
| 0.1 | 0.3 | GO:0071421 | response to manganese ion(GO:0010042) manganese ion transmembrane transport(GO:0071421) |
| 0.1 | 0.6 | GO:1990019 | protein storage vacuole organization(GO:1990019) |
| 0.1 | 1.5 | GO:0010497 | plasmodesmata-mediated intercellular transport(GO:0010497) |
| 0.1 | 0.3 | GO:0006059 | hexitol metabolic process(GO:0006059) hexitol biosynthetic process(GO:0019406) mannitol biosynthetic process(GO:0019593) mannitol metabolic process(GO:0019594) |
| 0.1 | 0.3 | GO:0044805 | lysosomal microautophagy(GO:0016237) piecemeal microautophagy of nucleus(GO:0034727) late nucleophagy(GO:0044805) single-organism membrane invagination(GO:1902534) |
| 0.1 | 0.4 | GO:0006527 | arginine catabolic process(GO:0006527) |
| 0.1 | 0.5 | GO:0006116 | NADH oxidation(GO:0006116) |
| 0.1 | 0.5 | GO:0071492 | response to UV-A(GO:0070141) cellular response to UV-A(GO:0071492) |
| 0.1 | 1.0 | GO:0000304 | response to singlet oxygen(GO:0000304) |
| 0.1 | 0.2 | GO:0048280 | vesicle fusion with Golgi apparatus(GO:0048280) |
| 0.1 | 0.6 | GO:0030007 | cellular potassium ion homeostasis(GO:0030007) |
| 0.1 | 0.4 | GO:0009660 | amyloplast organization(GO:0009660) |
| 0.1 | 0.3 | GO:0019367 | fatty acid elongation, saturated fatty acid(GO:0019367) fatty acid elongation, unsaturated fatty acid(GO:0019368) fatty acid elongation, monounsaturated fatty acid(GO:0034625) fatty acid elongation, polyunsaturated fatty acid(GO:0034626) |
| 0.1 | 2.1 | GO:0002213 | defense response to insect(GO:0002213) |
| 0.1 | 0.3 | GO:0009647 | skotomorphogenesis(GO:0009647) |
| 0.1 | 0.2 | GO:0035247 | peptidyl-arginine methylation, to asymmetrical-dimethyl arginine(GO:0019919) peptidyl-arginine N-methylation(GO:0035246) peptidyl-arginine omega-N-methylation(GO:0035247) |
| 0.1 | 0.4 | GO:0033386 | geranylgeranyl diphosphate metabolic process(GO:0033385) geranylgeranyl diphosphate biosynthetic process(GO:0033386) |
| 0.1 | 0.3 | GO:0007019 | microtubule depolymerization(GO:0007019) |
| 0.1 | 0.3 | GO:0048358 | mucilage pectin biosynthetic process(GO:0048358) |
| 0.1 | 0.3 | GO:0010325 | raffinose family oligosaccharide biosynthetic process(GO:0010325) |
| 0.1 | 0.8 | GO:1902290 | positive regulation of defense response to oomycetes(GO:1902290) |
| 0.1 | 2.5 | GO:0010252 | auxin homeostasis(GO:0010252) |
| 0.1 | 1.3 | GO:0015770 | sucrose transport(GO:0015770) |
| 0.1 | 0.2 | GO:0006493 | protein O-linked glycosylation(GO:0006493) |
| 0.1 | 0.4 | GO:0001578 | microtubule bundle formation(GO:0001578) |
| 0.1 | 1.9 | GO:0000162 | tryptophan biosynthetic process(GO:0000162) indolalkylamine biosynthetic process(GO:0046219) |
| 0.1 | 1.4 | GO:0023014 | signal transduction by protein phosphorylation(GO:0023014) |
| 0.1 | 0.5 | GO:0010310 | regulation of hydrogen peroxide metabolic process(GO:0010310) |
| 0.1 | 0.5 | GO:0060866 | leaf abscission(GO:0060866) |
| 0.1 | 0.2 | GO:0031054 | pre-miRNA processing(GO:0031054) |
| 0.1 | 0.2 | GO:0048832 | specification of organ number(GO:0048832) specification of floral organ number(GO:0048833) |
| 0.1 | 0.3 | GO:0010413 | glucuronoxylan metabolic process(GO:0010413) glucuronoxylan biosynthetic process(GO:0010417) |
| 0.1 | 0.7 | GO:0035725 | sodium ion transmembrane transport(GO:0035725) sodium ion import(GO:0097369) sodium ion import across plasma membrane(GO:0098719) sodium ion import into cell(GO:1990118) |
| 0.1 | 0.3 | GO:0019482 | beta-alanine metabolic process(GO:0019482) |
| 0.1 | 0.2 | GO:1900111 | positive regulation of histone H3-K9 dimethylation(GO:1900111) |
| 0.1 | 0.5 | GO:0008215 | spermine metabolic process(GO:0008215) |
| 0.1 | 0.5 | GO:0010067 | procambium histogenesis(GO:0010067) |
| 0.1 | 0.3 | GO:0071431 | tRNA export from nucleus(GO:0006409) tRNA transport(GO:0051031) tRNA-containing ribonucleoprotein complex export from nucleus(GO:0071431) |
| 0.1 | 1.6 | GO:0009083 | branched-chain amino acid catabolic process(GO:0009083) |
| 0.1 | 0.4 | GO:0006521 | regulation of cellular amino acid metabolic process(GO:0006521) regulation of cellular amine metabolic process(GO:0033238) |
| 0.1 | 0.3 | GO:0016320 | endoplasmic reticulum membrane fusion(GO:0016320) |
| 0.1 | 0.6 | GO:0009786 | regulation of asymmetric cell division(GO:0009786) |
| 0.1 | 0.7 | GO:0010603 | regulation of cytoplasmic mRNA processing body assembly(GO:0010603) |
| 0.1 | 0.2 | GO:0006474 | N-terminal protein amino acid acetylation(GO:0006474) N-terminal peptidyl-methionine acetylation(GO:0017196) |
| 0.1 | 0.7 | GO:0010088 | phloem development(GO:0010088) |
| 0.1 | 0.4 | GO:0016998 | cell wall macromolecule catabolic process(GO:0016998) |
| 0.1 | 0.5 | GO:0009268 | response to pH(GO:0009268) |
| 0.1 | 0.2 | GO:0010069 | zygote asymmetric cytokinesis in embryo sac(GO:0010069) |
| 0.1 | 0.3 | GO:0071836 | nectar secretion(GO:0071836) |
| 0.1 | 0.3 | GO:0009652 | thigmotropism(GO:0009652) |
| 0.1 | 0.5 | GO:0045492 | xylan biosynthetic process(GO:0045492) |
| 0.1 | 0.4 | GO:1902074 | response to salt(GO:1902074) |
| 0.1 | 0.9 | GO:1900426 | positive regulation of defense response to bacterium(GO:1900426) |
| 0.1 | 0.8 | GO:0010098 | suspensor development(GO:0010098) |
| 0.1 | 1.7 | GO:0043449 | ethylene metabolic process(GO:0009692) ethylene biosynthetic process(GO:0009693) cellular alkene metabolic process(GO:0043449) alkene biosynthetic process(GO:0043450) olefin metabolic process(GO:1900673) olefin biosynthetic process(GO:1900674) |
| 0.1 | 0.5 | GO:0051014 | actin filament severing(GO:0051014) |
| 0.1 | 0.2 | GO:0044090 | positive regulation of vacuole organization(GO:0044090) |
| 0.1 | 0.4 | GO:0031507 | heterochromatin assembly(GO:0031507) |
| 0.1 | 0.5 | GO:0050691 | regulation of defense response to virus by host(GO:0050691) |
| 0.1 | 0.9 | GO:0031408 | oxylipin biosynthetic process(GO:0031408) |
| 0.1 | 2.9 | GO:2000022 | regulation of jasmonic acid mediated signaling pathway(GO:2000022) |
| 0.1 | 1.3 | GO:0006012 | galactose metabolic process(GO:0006012) |
| 0.1 | 0.3 | GO:0050482 | icosanoid secretion(GO:0032309) arachidonic acid secretion(GO:0050482) icosanoid transport(GO:0071715) fatty acid derivative transport(GO:1901571) arachidonate transport(GO:1903963) |
| 0.1 | 0.3 | GO:1901004 | ubiquinone-6 metabolic process(GO:1901004) ubiquinone-6 biosynthetic process(GO:1901006) |
| 0.1 | 0.2 | GO:0006501 | C-terminal protein lipidation(GO:0006501) |
| 0.1 | 0.3 | GO:0031086 | nuclear-transcribed mRNA catabolic process, deadenylation-independent decay(GO:0031086) deadenylation-independent decapping of nuclear-transcribed mRNA(GO:0031087) |
| 0.1 | 0.1 | GO:0007032 | endosome organization(GO:0007032) |
| 0.1 | 0.4 | GO:0006896 | Golgi to vacuole transport(GO:0006896) |
| 0.1 | 0.4 | GO:0071585 | detoxification of cadmium ion(GO:0071585) |
| 0.1 | 0.8 | GO:0051438 | regulation of ubiquitin-protein transferase activity(GO:0051438) positive regulation of ubiquitin-protein transferase activity(GO:0051443) |
| 0.1 | 0.4 | GO:0044211 | CTP salvage(GO:0044211) |
| 0.1 | 0.2 | GO:1901465 | positive regulation of tetrapyrrole biosynthetic process(GO:1901465) |
| 0.1 | 1.2 | GO:0010227 | floral organ abscission(GO:0010227) |
| 0.1 | 1.2 | GO:2000652 | regulation of secondary cell wall biogenesis(GO:2000652) |
| 0.1 | 0.2 | GO:0010495 | long-distance posttranscriptional gene silencing(GO:0010495) |
| 0.1 | 0.8 | GO:0006949 | syncytium formation(GO:0006949) |
| 0.1 | 0.8 | GO:0010440 | stomatal lineage progression(GO:0010440) |
| 0.1 | 0.4 | GO:0051569 | regulation of histone H3-K4 methylation(GO:0051569) |
| 0.1 | 0.3 | GO:0009800 | cinnamic acid biosynthetic process(GO:0009800) |
| 0.1 | 0.3 | GO:0006272 | leading strand elongation(GO:0006272) |
| 0.1 | 0.2 | GO:1901527 | abscisic acid-activated signaling pathway involved in stomatal movement(GO:1901527) |
| 0.1 | 0.2 | GO:0006427 | histidyl-tRNA aminoacylation(GO:0006427) |
| 0.1 | 0.5 | GO:0009954 | proximal/distal pattern formation(GO:0009954) |
| 0.1 | 0.4 | GO:0006529 | asparagine biosynthetic process(GO:0006529) |
| 0.1 | 0.9 | GO:0098754 | detoxification(GO:0098754) |
| 0.1 | 0.6 | GO:0006801 | superoxide metabolic process(GO:0006801) |
| 0.1 | 0.2 | GO:0019320 | hexose catabolic process(GO:0019320) |
| 0.1 | 0.2 | GO:0040031 | snRNA modification(GO:0040031) |
| 0.1 | 0.5 | GO:1905037 | autophagosome assembly(GO:0000045) autophagosome organization(GO:1905037) |
| 0.1 | 0.3 | GO:0006449 | regulation of translational termination(GO:0006449) |
| 0.1 | 0.3 | GO:0019079 | viral genome replication(GO:0019079) |
| 0.1 | 0.1 | GO:0009866 | induced systemic resistance, ethylene mediated signaling pathway(GO:0009866) |
| 0.1 | 2.9 | GO:0009809 | lignin biosynthetic process(GO:0009809) |
| 0.1 | 0.2 | GO:0006015 | 5-phosphoribose 1-diphosphate biosynthetic process(GO:0006015) 5-phosphoribose 1-diphosphate metabolic process(GO:0046391) |
| 0.1 | 0.3 | GO:0043447 | alkane biosynthetic process(GO:0043447) |
| 0.1 | 0.4 | GO:0060149 | negative regulation of posttranscriptional gene silencing(GO:0060149) |
| 0.0 | 0.5 | GO:0080028 | nitrile metabolic process(GO:0050898) nitrile biosynthetic process(GO:0080028) |
| 0.0 | 0.2 | GO:0030149 | sphingolipid catabolic process(GO:0030149) |
| 0.0 | 0.4 | GO:0001676 | long-chain fatty acid metabolic process(GO:0001676) |
| 0.0 | 0.1 | GO:2000693 | positive regulation of seed maturation(GO:2000693) |
| 0.0 | 0.6 | GO:1901000 | regulation of response to salt stress(GO:1901000) |
| 0.0 | 2.3 | GO:0009834 | plant-type secondary cell wall biogenesis(GO:0009834) |
| 0.0 | 0.6 | GO:0006560 | proline metabolic process(GO:0006560) |
| 0.0 | 1.1 | GO:0048768 | root hair cell tip growth(GO:0048768) |
| 0.0 | 0.2 | GO:0000212 | meiotic spindle organization(GO:0000212) |
| 0.0 | 0.2 | GO:0070509 | calcium ion import(GO:0070509) |
| 0.0 | 0.3 | GO:0043570 | maintenance of DNA repeat elements(GO:0043570) |
| 0.0 | 0.4 | GO:0045836 | positive regulation of meiotic nuclear division(GO:0045836) |
| 0.0 | 0.4 | GO:0034311 | sphingosine metabolic process(GO:0006670) diol metabolic process(GO:0034311) diol biosynthetic process(GO:0034312) sphingosine biosynthetic process(GO:0046512) |
| 0.0 | 0.1 | GO:0051601 | exocyst localization(GO:0051601) |
| 0.0 | 0.1 | GO:0061726 | mitophagy(GO:0000422) mitochondrion disassembly(GO:0061726) |
| 0.0 | 1.8 | GO:0009694 | jasmonic acid metabolic process(GO:0009694) |
| 0.0 | 2.4 | GO:0010411 | xyloglucan metabolic process(GO:0010411) |
| 0.0 | 0.6 | GO:0019374 | galactolipid metabolic process(GO:0019374) |
| 0.0 | 0.2 | GO:0052652 | cyclic nucleotide biosynthetic process(GO:0009190) cyclic purine nucleotide metabolic process(GO:0052652) |
| 0.0 | 0.2 | GO:0046487 | glyoxylate metabolic process(GO:0046487) |
| 0.0 | 0.2 | GO:0080175 | phragmoplast microtubule organization(GO:0080175) |
| 0.0 | 0.4 | GO:0043068 | positive regulation of programmed cell death(GO:0043068) |
| 0.0 | 0.5 | GO:0015749 | monosaccharide transport(GO:0015749) |
| 0.0 | 0.3 | GO:0007205 | protein kinase C-activating G-protein coupled receptor signaling pathway(GO:0007205) |
| 0.0 | 0.6 | GO:0052325 | cell wall pectin biosynthetic process(GO:0052325) |
| 0.0 | 0.3 | GO:0090579 | establishment of mitotic sister chromatid cohesion(GO:0034087) establishment of protein localization to chromosome(GO:0070199) rDNA condensation(GO:0070550) establishment of protein localization to chromatin(GO:0071169) transcriptional activation by promoter-enhancer looping(GO:0071733) gene looping(GO:0090202) dsDNA loop formation(GO:0090579) |
| 0.0 | 0.2 | GO:1902626 | assembly of large subunit precursor of preribosome(GO:1902626) |
| 0.0 | 8.4 | GO:0071456 | cellular response to hypoxia(GO:0071456) |
| 0.0 | 0.3 | GO:0009961 | response to 1-aminocyclopropane-1-carboxylic acid(GO:0009961) |
| 0.0 | 1.7 | GO:0009788 | negative regulation of abscisic acid-activated signaling pathway(GO:0009788) |
| 0.0 | 0.5 | GO:0016925 | protein sumoylation(GO:0016925) |
| 0.0 | 1.3 | GO:0009816 | defense response to bacterium, incompatible interaction(GO:0009816) |
| 0.0 | 0.2 | GO:0006370 | 7-methylguanosine mRNA capping(GO:0006370) |
| 0.0 | 0.1 | GO:0006990 | positive regulation of transcription from RNA polymerase II promoter involved in unfolded protein response(GO:0006990) positive regulation of transcription from RNA polymerase II promoter involved in cellular response to chemical stimulus(GO:1901522) |
| 0.0 | 0.2 | GO:0015854 | adenine transport(GO:0015853) guanine transport(GO:0015854) |
| 0.0 | 0.1 | GO:0047484 | regulation of response to osmotic stress(GO:0047484) |
| 0.0 | 0.3 | GO:0080165 | callose deposition in phloem sieve plate(GO:0080165) |
| 0.0 | 0.3 | GO:0015691 | cadmium ion transport(GO:0015691) |
| 0.0 | 0.5 | GO:0006621 | protein retention in ER lumen(GO:0006621) |
| 0.0 | 0.1 | GO:0080178 | 5-carbamoylmethyl uridine residue modification(GO:0080178) |
| 0.0 | 0.2 | GO:0008216 | spermidine metabolic process(GO:0008216) |
| 0.0 | 0.4 | GO:0045962 | positive regulation of development, heterochronic(GO:0045962) |
| 0.0 | 1.0 | GO:0010214 | seed coat development(GO:0010214) |
| 0.0 | 0.2 | GO:0080151 | positive regulation of salicylic acid mediated signaling pathway(GO:0080151) |
| 0.0 | 0.1 | GO:0007112 | male meiosis cytokinesis(GO:0007112) |
| 0.0 | 0.1 | GO:0008334 | histone mRNA metabolic process(GO:0008334) |
| 0.0 | 0.1 | GO:0002943 | tRNA dihydrouridine synthesis(GO:0002943) |
| 0.0 | 0.2 | GO:0010222 | stem vascular tissue pattern formation(GO:0010222) |
| 0.0 | 0.2 | GO:0010112 | regulation of systemic acquired resistance(GO:0010112) |
| 0.0 | 0.1 | GO:1900457 | regulation of brassinosteroid mediated signaling pathway(GO:1900457) |
| 0.0 | 0.4 | GO:0010077 | maintenance of inflorescence meristem identity(GO:0010077) |
| 0.0 | 0.3 | GO:0016554 | cytidine to uridine editing(GO:0016554) |
| 0.0 | 0.1 | GO:0042344 | indole glucosinolate catabolic process(GO:0042344) |
| 0.0 | 1.9 | GO:0000380 | alternative mRNA splicing, via spliceosome(GO:0000380) |
| 0.0 | 0.8 | GO:0045037 | protein import into chloroplast stroma(GO:0045037) |
| 0.0 | 0.5 | GO:0010048 | vernalization response(GO:0010048) |
| 0.0 | 0.1 | GO:0051455 | attachment of spindle microtubules to kinetochore involved in meiotic chromosome segregation(GO:0051316) attachment of spindle microtubules to kinetochore involved in homologous chromosome segregation(GO:0051455) microtubule cytoskeleton organization involved in homologous chromosome segregation(GO:0090172) |
| 0.0 | 1.4 | GO:0006623 | protein targeting to vacuole(GO:0006623) protein localization to vacuole(GO:0072665) establishment of protein localization to vacuole(GO:0072666) |
| 0.0 | 0.1 | GO:2000001 | regulation of DNA damage checkpoint(GO:2000001) |
| 0.0 | 0.8 | GO:0031348 | negative regulation of defense response(GO:0031348) |
| 0.0 | 0.1 | GO:0043987 | histone-serine phosphorylation(GO:0035404) histone H3-S10 phosphorylation(GO:0043987) |
| 0.0 | 0.1 | GO:0070828 | heterochromatin organization(GO:0070828) |
| 0.0 | 0.9 | GO:0000027 | ribosomal large subunit assembly(GO:0000027) |
| 0.0 | 0.3 | GO:0007064 | mitotic sister chromatid cohesion(GO:0007064) |
| 0.0 | 0.5 | GO:0009395 | phospholipid catabolic process(GO:0009395) |
| 0.0 | 0.2 | GO:0007187 | G-protein coupled receptor signaling pathway, coupled to cyclic nucleotide second messenger(GO:0007187) adenylate cyclase-modulating G-protein coupled receptor signaling pathway(GO:0007188) |
| 0.0 | 0.2 | GO:0031057 | negative regulation of histone modification(GO:0031057) |
| 0.0 | 0.2 | GO:0015969 | guanosine tetraphosphate metabolic process(GO:0015969) purine ribonucleoside bisphosphate metabolic process(GO:0034035) |
| 0.0 | 0.1 | GO:0010184 | cytokinin transport(GO:0010184) |
| 0.0 | 0.1 | GO:0052746 | carbohydrate phosphorylation(GO:0046835) inositol phosphorylation(GO:0052746) |
| 0.0 | 0.6 | GO:0045493 | xylan catabolic process(GO:0045493) |
| 0.0 | 0.1 | GO:0071163 | DNA replication preinitiation complex assembly(GO:0071163) |
| 0.0 | 0.3 | GO:0006914 | autophagy(GO:0006914) |
| 0.0 | 0.3 | GO:0070973 | protein localization to endoplasmic reticulum exit site(GO:0070973) |
| 0.0 | 0.1 | GO:1900424 | regulation of defense response to bacterium(GO:1900424) |
| 0.0 | 0.4 | GO:0006265 | DNA topological change(GO:0006265) |
| 0.0 | 0.3 | GO:0010082 | regulation of root meristem growth(GO:0010082) |
| 0.0 | 1.0 | GO:0000741 | karyogamy(GO:0000741) polar nucleus fusion(GO:0010197) |
| 0.0 | 0.1 | GO:0048451 | petal formation(GO:0048451) |
| 0.0 | 0.1 | GO:0070734 | histone H3-K27 methylation(GO:0070734) |
| 0.0 | 0.1 | GO:0009304 | tRNA transcription(GO:0009304) |
| 0.0 | 0.1 | GO:0080168 | isoprenoid transport(GO:0046864) terpenoid transport(GO:0046865) abscisic acid transport(GO:0080168) |
| 0.0 | 0.3 | GO:0051785 | positive regulation of nuclear division(GO:0051785) |
| 0.0 | 0.2 | GO:0080187 | floral organ senescence(GO:0080187) |
| 0.0 | 0.2 | GO:0090057 | root radial pattern formation(GO:0090057) |
| 0.0 | 0.2 | GO:0051131 | chaperone-mediated protein complex assembly(GO:0051131) |
| 0.0 | 0.2 | GO:1900056 | negative regulation of leaf senescence(GO:1900056) |
| 0.0 | 2.6 | GO:0010200 | response to chitin(GO:0010200) |
| 0.0 | 0.5 | GO:0010345 | suberin biosynthetic process(GO:0010345) |
| 0.0 | 0.2 | GO:0051952 | amine transport(GO:0015837) regulation of organic acid transport(GO:0032890) regulation of amine transport(GO:0051952) regulation of amino acid transport(GO:0051955) regulation of amino acid export(GO:0080143) |
| 0.0 | 0.1 | GO:1990116 | ribosome-associated ubiquitin-dependent protein catabolic process(GO:1990116) |
| 0.0 | 0.6 | GO:0030150 | protein import into mitochondrial matrix(GO:0030150) |
| 0.0 | 1.5 | GO:0071368 | cellular response to cytokinin stimulus(GO:0071368) |
| 0.0 | 0.0 | GO:0048281 | inflorescence morphogenesis(GO:0048281) |
| 0.0 | 0.5 | GO:0006743 | ubiquinone metabolic process(GO:0006743) ubiquinone biosynthetic process(GO:0006744) |
| 0.0 | 0.6 | GO:0009833 | plant-type primary cell wall biogenesis(GO:0009833) |
| 0.0 | 0.2 | GO:0006122 | mitochondrial electron transport, ubiquinol to cytochrome c(GO:0006122) |
| 0.0 | 0.2 | GO:1901880 | negative regulation of actin filament depolymerization(GO:0030835) negative regulation of protein complex disassembly(GO:0043242) actin filament capping(GO:0051693) negative regulation of protein depolymerization(GO:1901880) |
| 0.0 | 0.8 | GO:0005991 | trehalose metabolic process(GO:0005991) |
| 0.0 | 0.1 | GO:0046506 | sulfolipid metabolic process(GO:0046505) sulfolipid biosynthetic process(GO:0046506) |
| 0.0 | 0.1 | GO:0044843 | cell cycle G1/S phase transition(GO:0044843) |
| 0.0 | 1.1 | GO:0006887 | exocytosis(GO:0006887) |
| 0.0 | 0.7 | GO:0000028 | ribosomal small subunit assembly(GO:0000028) |
| 0.0 | 0.2 | GO:0000469 | cleavage involved in rRNA processing(GO:0000469) |
| 0.0 | 0.2 | GO:0070072 | vacuolar proton-transporting V-type ATPase complex assembly(GO:0070072) |
| 0.0 | 0.1 | GO:0001682 | tRNA 5'-leader removal(GO:0001682) |
| 0.0 | 0.2 | GO:0016074 | snoRNA metabolic process(GO:0016074) |
| 0.0 | 0.8 | GO:0032200 | telomere maintenance(GO:0000723) telomere organization(GO:0032200) |
| 0.0 | 0.3 | GO:0000463 | maturation of LSU-rRNA from tricistronic rRNA transcript (SSU-rRNA, 5.8S rRNA, LSU-rRNA)(GO:0000463) |
| 0.0 | 0.6 | GO:0009910 | negative regulation of flower development(GO:0009910) |
| 0.0 | 0.4 | GO:0015850 | organic hydroxy compound transport(GO:0015850) |
| 0.0 | 0.2 | GO:0071428 | ribosomal subunit export from nucleus(GO:0000054) ribosome localization(GO:0033750) establishment of ribosome localization(GO:0033753) rRNA-containing ribonucleoprotein complex export from nucleus(GO:0071428) |
| 0.0 | 0.1 | GO:0009807 | lignan metabolic process(GO:0009806) lignan biosynthetic process(GO:0009807) |
| 0.0 | 0.1 | GO:0080003 | thalianol metabolic process(GO:0080003) |
| 0.0 | 1.5 | GO:0010150 | leaf senescence(GO:0010150) |
| 0.0 | 0.1 | GO:0006349 | regulation of gene expression by genetic imprinting(GO:0006349) genetic imprinting(GO:0071514) |
| 0.0 | 0.9 | GO:0006401 | RNA catabolic process(GO:0006401) |
| 0.0 | 0.0 | GO:0048024 | regulation of mRNA splicing, via spliceosome(GO:0048024) |
| 0.0 | 0.1 | GO:2000762 | regulation of phenylpropanoid metabolic process(GO:2000762) |
| 0.0 | 0.2 | GO:0016073 | snRNA metabolic process(GO:0016073) |
| 0.0 | 0.1 | GO:0001732 | formation of cytoplasmic translation initiation complex(GO:0001732) |
| 0.0 | 0.1 | GO:0006751 | glutathione catabolic process(GO:0006751) cellular modified amino acid catabolic process(GO:0042219) |
| 0.0 | 0.3 | GO:0018230 | peptidyl-L-cysteine S-palmitoylation(GO:0018230) peptidyl-S-diacylglycerol-L-cysteine biosynthetic process from peptidyl-cysteine(GO:0018231) |
| 0.0 | 0.3 | GO:0000079 | regulation of cyclin-dependent protein serine/threonine kinase activity(GO:0000079) regulation of cyclin-dependent protein kinase activity(GO:1904029) |
| 0.0 | 0.6 | GO:0085029 | pollen wall assembly(GO:0010208) cellular component assembly involved in morphogenesis(GO:0010927) extracellular matrix assembly(GO:0085029) |
| 0.0 | 0.1 | GO:0048578 | positive regulation of long-day photoperiodism, flowering(GO:0048578) |
| 0.0 | 0.6 | GO:0009846 | pollen germination(GO:0009846) |
| 0.0 | 1.4 | GO:0043086 | negative regulation of catalytic activity(GO:0043086) |
| 0.0 | 1.6 | GO:0045490 | pectin catabolic process(GO:0045490) |
| 0.0 | 0.1 | GO:0097501 | stress response to metal ion(GO:0097501) |
| 0.0 | 0.1 | GO:0019287 | isopentenyl diphosphate biosynthetic process, mevalonate pathway(GO:0019287) |
| 0.0 | 0.2 | GO:0071712 | ER-associated misfolded protein catabolic process(GO:0071712) |
| 0.0 | 0.2 | GO:0043248 | proteasome assembly(GO:0043248) |
| 0.0 | 0.3 | GO:0030042 | actin filament depolymerization(GO:0030042) |
| 0.0 | 0.1 | GO:0010375 | stomatal complex patterning(GO:0010375) |
| 0.0 | 0.2 | GO:0000338 | protein deneddylation(GO:0000338) |
| 0.0 | 0.2 | GO:0080027 | response to herbivore(GO:0080027) |
| 0.0 | 0.1 | GO:0043903 | regulation of symbiosis, encompassing mutualism through parasitism(GO:0043903) regulation of viral process(GO:0050792) |
| 0.0 | 0.1 | GO:2001022 | positive regulation of response to DNA damage stimulus(GO:2001022) |
| 0.0 | 0.0 | GO:0019048 | modulation by virus of host morphology or physiology(GO:0019048) |
| 0.0 | 0.6 | GO:0051085 | 'de novo' posttranslational protein folding(GO:0051084) chaperone mediated protein folding requiring cofactor(GO:0051085) |
| 0.0 | 0.1 | GO:0015739 | sialic acid transport(GO:0015739) |
| 0.0 | 0.2 | GO:0046513 | ceramide biosynthetic process(GO:0046513) |
| 0.0 | 0.6 | GO:0042273 | ribosomal large subunit biogenesis(GO:0042273) |
| 0.0 | 0.5 | GO:0048235 | pollen sperm cell differentiation(GO:0048235) |
| 0.0 | 0.1 | GO:0006517 | protein deglycosylation(GO:0006517) |
| 0.0 | 0.7 | GO:0009407 | toxin catabolic process(GO:0009407) secondary metabolite catabolic process(GO:0090487) |
| 0.0 | 0.0 | GO:0006432 | phenylalanyl-tRNA aminoacylation(GO:0006432) |
| 0.0 | 0.1 | GO:0010623 | programmed cell death involved in cell development(GO:0010623) |
| 0.0 | 0.1 | GO:0006662 | glycerol ether metabolic process(GO:0006662) |
| 0.0 | 0.3 | GO:0043572 | chloroplast fission(GO:0010020) plastid fission(GO:0043572) |
| 0.0 | 0.1 | GO:2000779 | regulation of double-strand break repair(GO:2000779) |
| 0.0 | 0.2 | GO:0080188 | RNA-directed DNA methylation(GO:0080188) |
| 0.0 | 0.1 | GO:0036388 | pre-replicative complex assembly involved in nuclear cell cycle DNA replication(GO:0006267) pre-replicative complex assembly(GO:0036388) pre-replicative complex assembly involved in cell cycle DNA replication(GO:1902299) |
| 0.0 | 0.2 | GO:0009423 | chorismate biosynthetic process(GO:0009423) |
| 0.0 | 0.1 | GO:0006307 | DNA dealkylation involved in DNA repair(GO:0006307) |
| 0.0 | 0.2 | GO:0046501 | protoporphyrinogen IX biosynthetic process(GO:0006782) protoporphyrinogen IX metabolic process(GO:0046501) |
| 0.0 | 0.1 | GO:0072529 | pyrimidine-containing compound catabolic process(GO:0072529) |
| 0.0 | 0.4 | GO:0006613 | cotranslational protein targeting to membrane(GO:0006613) SRP-dependent cotranslational protein targeting to membrane(GO:0006614) |
| 0.0 | 0.2 | GO:0010103 | stomatal complex morphogenesis(GO:0010103) |
| 0.0 | 0.3 | GO:0007163 | establishment or maintenance of cell polarity(GO:0007163) |
| 0.0 | 0.3 | GO:0034314 | Arp2/3 complex-mediated actin nucleation(GO:0034314) |
| 0.0 | 0.2 | GO:0009292 | genetic transfer(GO:0009292) DNA mediated transformation(GO:0009294) |
| 0.0 | 0.3 | GO:0043067 | regulation of programmed cell death(GO:0043067) |
| 0.0 | 0.1 | GO:0010344 | seed oilbody biogenesis(GO:0010344) |
| 0.0 | 0.1 | GO:0046688 | response to copper ion(GO:0046688) |
| 0.0 | 0.0 | GO:0015812 | gamma-aminobutyric acid transport(GO:0015812) |
| 0.0 | 0.1 | GO:0006490 | oligosaccharide-lipid intermediate biosynthetic process(GO:0006490) |
| 0.0 | 0.9 | GO:0016579 | protein deubiquitination(GO:0016579) |
| 0.0 | 0.0 | GO:0010018 | far-red light signaling pathway(GO:0010018) |
| 0.0 | 0.4 | GO:0018393 | internal protein amino acid acetylation(GO:0006475) histone acetylation(GO:0016573) internal peptidyl-lysine acetylation(GO:0018393) peptidyl-lysine acetylation(GO:0018394) |
| 0.0 | 0.1 | GO:0043484 | regulation of RNA splicing(GO:0043484) |
| 0.0 | 0.1 | GO:0045338 | farnesyl diphosphate metabolic process(GO:0045338) |
| 0.0 | 0.0 | GO:0071494 | cellular response to UV-C(GO:0071494) |
Gene overrepresentation in cellular component category:
| Log-likelihood per target | Total log-likelihood | Term | Description |
|---|---|---|---|
| 0.6 | 1.7 | GO:0005813 | centrosome(GO:0005813) centriole(GO:0005814) |
| 0.3 | 1.7 | GO:0030062 | mitochondrial alpha-ketoglutarate dehydrogenase complex(GO:0005947) mitochondrial tricarboxylic acid cycle enzyme complex(GO:0030062) |
| 0.2 | 0.4 | GO:0009897 | external side of plasma membrane(GO:0009897) |
| 0.2 | 4.5 | GO:0031012 | extracellular matrix(GO:0031012) |
| 0.2 | 1.3 | GO:0042406 | extrinsic component of endoplasmic reticulum membrane(GO:0042406) |
| 0.2 | 0.9 | GO:0035061 | interchromatin granule(GO:0035061) |
| 0.2 | 1.0 | GO:0005776 | autophagosome(GO:0005776) |
| 0.1 | 1.3 | GO:0017119 | Golgi transport complex(GO:0017119) |
| 0.1 | 0.8 | GO:0005687 | U4 snRNP(GO:0005687) |
| 0.1 | 0.4 | GO:0030689 | Noc complex(GO:0030689) |
| 0.1 | 0.5 | GO:0009317 | acetyl-CoA carboxylase complex(GO:0009317) |
| 0.1 | 0.3 | GO:0005785 | signal recognition particle receptor complex(GO:0005785) |
| 0.1 | 0.3 | GO:0009514 | glyoxysome(GO:0009514) |
| 0.1 | 1.6 | GO:0005801 | cis-Golgi network(GO:0005801) |
| 0.1 | 1.3 | GO:0000407 | pre-autophagosomal structure(GO:0000407) |
| 0.1 | 1.7 | GO:0072686 | mitotic spindle(GO:0072686) |
| 0.1 | 0.2 | GO:0044463 | cell projection part(GO:0044463) |
| 0.1 | 1.1 | GO:0031519 | PcG protein complex(GO:0031519) |
| 0.1 | 0.3 | GO:0035371 | microtubule plus-end(GO:0035371) |
| 0.1 | 1.7 | GO:0031965 | nuclear membrane(GO:0031965) |
| 0.1 | 0.5 | GO:0009331 | glycerol-3-phosphate dehydrogenase complex(GO:0009331) |
| 0.1 | 0.2 | GO:0030981 | cortical microtubule cytoskeleton(GO:0030981) |
| 0.1 | 0.1 | GO:0030906 | retromer, cargo-selective complex(GO:0030906) |
| 0.1 | 0.6 | GO:0071006 | U2-type catalytic step 1 spliceosome(GO:0071006) catalytic step 1 spliceosome(GO:0071012) |
| 0.1 | 0.4 | GO:0005905 | clathrin-coated pit(GO:0005905) |
| 0.1 | 0.7 | GO:0035618 | root hair(GO:0035618) |
| 0.1 | 0.2 | GO:0031390 | Ctf18 RFC-like complex(GO:0031390) |
| 0.1 | 0.3 | GO:0034663 | endoplasmic reticulum chaperone complex(GO:0034663) |
| 0.1 | 0.2 | GO:0002178 | palmitoyltransferase complex(GO:0002178) serine C-palmitoyltransferase complex(GO:0017059) endoplasmic reticulum palmitoyltransferase complex(GO:0031211) |
| 0.1 | 1.8 | GO:0012511 | monolayer-surrounded lipid storage body(GO:0012511) |
| 0.1 | 0.2 | GO:0031417 | N-terminal protein acetyltransferase complex(GO:0031414) NatC complex(GO:0031417) |
| 0.1 | 0.4 | GO:0032153 | cell division site(GO:0032153) |
| 0.1 | 0.5 | GO:0016593 | Cdc73/Paf1 complex(GO:0016593) |
| 0.1 | 0.8 | GO:0005849 | mRNA cleavage factor complex(GO:0005849) |
| 0.1 | 0.3 | GO:0010330 | cellulose synthase complex(GO:0010330) |
| 0.1 | 0.3 | GO:0044613 | nuclear pore central transport channel(GO:0044613) |
| 0.1 | 0.4 | GO:0005854 | nascent polypeptide-associated complex(GO:0005854) |
| 0.1 | 0.4 | GO:0017053 | transcriptional repressor complex(GO:0017053) |
| 0.1 | 4.3 | GO:0090406 | pollen tube(GO:0090406) |
| 0.1 | 1.3 | GO:0031306 | intrinsic component of mitochondrial outer membrane(GO:0031306) integral component of mitochondrial outer membrane(GO:0031307) |
| 0.1 | 0.2 | GO:0044614 | nuclear pore cytoplasmic filaments(GO:0044614) |
| 0.1 | 0.5 | GO:0005697 | telomerase holoenzyme complex(GO:0005697) |
| 0.1 | 0.3 | GO:0033597 | mitotic checkpoint complex(GO:0033597) |
| 0.1 | 1.6 | GO:0005881 | cytoplasmic microtubule(GO:0005881) |
| 0.1 | 0.2 | GO:0002189 | ribose phosphate diphosphokinase complex(GO:0002189) |
| 0.1 | 0.7 | GO:0030687 | preribosome, large subunit precursor(GO:0030687) |
| 0.1 | 0.6 | GO:0008180 | COP9 signalosome(GO:0008180) |
| 0.0 | 1.9 | GO:0005764 | lysosome(GO:0005764) |
| 0.0 | 0.6 | GO:0071011 | precatalytic spliceosome(GO:0071011) |
| 0.0 | 0.6 | GO:0008541 | proteasome regulatory particle, lid subcomplex(GO:0008541) |
| 0.0 | 1.1 | GO:0010494 | cytoplasmic stress granule(GO:0010494) |
| 0.0 | 0.3 | GO:0030014 | CCR4-NOT complex(GO:0030014) |
| 0.0 | 0.3 | GO:0055038 | recycling endosome membrane(GO:0055038) |
| 0.0 | 1.1 | GO:0000145 | exocyst(GO:0000145) |
| 0.0 | 0.6 | GO:0005885 | Arp2/3 protein complex(GO:0005885) |
| 0.0 | 0.3 | GO:0033180 | proton-transporting V-type ATPase, V1 domain(GO:0033180) |
| 0.0 | 1.0 | GO:0000781 | chromosome, telomeric region(GO:0000781) |
| 0.0 | 2.1 | GO:0005797 | Golgi medial cisterna(GO:0005797) |
| 0.0 | 0.2 | GO:0031298 | replication fork protection complex(GO:0031298) |
| 0.0 | 1.3 | GO:0000932 | cytoplasmic mRNA processing body(GO:0000932) |
| 0.0 | 0.1 | GO:0034457 | Mpp10 complex(GO:0034457) |
| 0.0 | 0.2 | GO:0034098 | VCP-NPL4-UFD1 AAA ATPase complex(GO:0034098) |
| 0.0 | 0.4 | GO:0045298 | tubulin complex(GO:0045298) |
| 0.0 | 0.5 | GO:0005750 | mitochondrial respiratory chain complex III(GO:0005750) respiratory chain complex III(GO:0045275) |
| 0.0 | 1.7 | GO:0005770 | late endosome(GO:0005770) |
| 0.0 | 0.6 | GO:0000148 | 1,3-beta-D-glucan synthase complex(GO:0000148) |
| 0.0 | 0.3 | GO:0016514 | SWI/SNF complex(GO:0016514) BAF-type complex(GO:0090544) |
| 0.0 | 3.1 | GO:0022627 | cytosolic small ribosomal subunit(GO:0022627) |
| 0.0 | 0.5 | GO:0048471 | perinuclear region of cytoplasm(GO:0048471) |
| 0.0 | 0.3 | GO:0042555 | MCM complex(GO:0042555) |
| 0.0 | 0.4 | GO:0030686 | 90S preribosome(GO:0030686) |
| 0.0 | 0.1 | GO:0005845 | mRNA cap binding complex(GO:0005845) |
| 0.0 | 0.1 | GO:0097196 | Shu complex(GO:0097196) |
| 0.0 | 0.4 | GO:0046540 | U4/U6 x U5 tri-snRNP complex(GO:0046540) |
| 0.0 | 0.9 | GO:0099568 | cell cortex(GO:0005938) cytoplasmic region(GO:0099568) |
| 0.0 | 0.1 | GO:1990112 | RQC complex(GO:1990112) |
| 0.0 | 0.1 | GO:0031897 | Tic complex(GO:0031897) |
| 0.0 | 0.1 | GO:0005853 | eukaryotic translation elongation factor 1 complex(GO:0005853) |
| 0.0 | 0.4 | GO:0005689 | U12-type spliceosomal complex(GO:0005689) |
| 0.0 | 6.5 | GO:0031225 | anchored component of membrane(GO:0031225) |
| 0.0 | 0.1 | GO:0005674 | transcription factor TFIIF complex(GO:0005674) |
| 0.0 | 0.6 | GO:0005643 | nuclear pore(GO:0005643) |
| 0.0 | 3.8 | GO:0000325 | plant-type vacuole(GO:0000325) |
| 0.0 | 0.2 | GO:0031261 | DNA replication preinitiation complex(GO:0031261) |
| 0.0 | 0.4 | GO:0035097 | histone methyltransferase complex(GO:0035097) |
| 0.0 | 0.1 | GO:0051233 | spindle midzone(GO:0051233) |
| 0.0 | 0.1 | GO:0010316 | pyrophosphate-dependent phosphofructokinase complex(GO:0010316) |
| 0.0 | 0.9 | GO:0000123 | histone acetyltransferase complex(GO:0000123) |
| 0.0 | 2.6 | GO:0022625 | cytosolic large ribosomal subunit(GO:0022625) |
| 0.0 | 0.1 | GO:0005782 | peroxisomal matrix(GO:0005782) microbody lumen(GO:0031907) |
| 0.0 | 0.2 | GO:0005834 | heterotrimeric G-protein complex(GO:0005834) |
| 0.0 | 0.2 | GO:0008278 | cohesin complex(GO:0008278) |
| 0.0 | 0.7 | GO:0010008 | endosome membrane(GO:0010008) |
| 0.0 | 0.1 | GO:0034515 | proteasome storage granule(GO:0034515) |
| 0.0 | 0.1 | GO:0030141 | secretory granule(GO:0030141) |
| 0.0 | 0.1 | GO:0012507 | ER to Golgi transport vesicle membrane(GO:0012507) |
| 0.0 | 0.1 | GO:0009346 | citrate lyase complex(GO:0009346) |
| 0.0 | 0.1 | GO:0001673 | male germ cell nucleus(GO:0001673) |
| 0.0 | 0.1 | GO:0000974 | Prp19 complex(GO:0000974) |
| 0.0 | 0.1 | GO:0005832 | chaperonin-containing T-complex(GO:0005832) |
| 0.0 | 5.5 | GO:0005774 | vacuolar membrane(GO:0005774) |
| 0.0 | 0.1 | GO:0034426 | etioplast envelope(GO:0034425) etioplast membrane(GO:0034426) |
| 0.0 | 0.4 | GO:0005666 | DNA-directed RNA polymerase III complex(GO:0005666) |
| 0.0 | 0.3 | GO:0032040 | small-subunit processome(GO:0032040) |
| 0.0 | 0.7 | GO:0015629 | actin cytoskeleton(GO:0015629) |
| 0.0 | 0.3 | GO:0005680 | anaphase-promoting complex(GO:0005680) |
| 0.0 | 0.1 | GO:0019773 | proteasome core complex, alpha-subunit complex(GO:0019773) |
| 0.0 | 0.5 | GO:0005875 | microtubule associated complex(GO:0005875) |
| 0.0 | 0.0 | GO:0098553 | integral component of lumenal side of endoplasmic reticulum membrane(GO:0071556) lumenal side of endoplasmic reticulum membrane(GO:0098553) lumenal side of membrane(GO:0098576) |
| 0.0 | 0.4 | GO:0030173 | integral component of Golgi membrane(GO:0030173) intrinsic component of Golgi membrane(GO:0031228) |
| 0.0 | 4.2 | GO:0005618 | cell wall(GO:0005618) external encapsulating structure(GO:0030312) |
| 0.0 | 0.1 | GO:0033588 | Elongator holoenzyme complex(GO:0033588) |
Gene overrepresentation in molecular function category:
| Log-likelihood per target | Total log-likelihood | Term | Description |
|---|---|---|---|
| 0.6 | 2.2 | GO:0004048 | anthranilate phosphoribosyltransferase activity(GO:0004048) |
| 0.5 | 3.5 | GO:0010279 | indole-3-acetic acid amido synthetase activity(GO:0010279) |
| 0.5 | 1.5 | GO:0050263 | uridine nucleosidase activity(GO:0045437) ribosylpyrimidine nucleosidase activity(GO:0050263) |
| 0.5 | 1.5 | GO:0043325 | phosphatidylinositol-3,4-bisphosphate binding(GO:0043325) |
| 0.5 | 1.4 | GO:0050502 | trans-zeatin O-beta-D-glucosyltransferase activity(GO:0050403) cis-zeatin O-beta-D-glucosyltransferase activity(GO:0050502) |
| 0.5 | 2.7 | GO:0050302 | aryl-aldehyde oxidase activity(GO:0018488) indole-3-acetaldehyde oxidase activity(GO:0050302) |
| 0.4 | 1.3 | GO:0004476 | mannose-6-phosphate isomerase activity(GO:0004476) |
| 0.4 | 1.3 | GO:0008661 | 1-deoxy-D-xylulose-5-phosphate synthase activity(GO:0008661) |
| 0.4 | 2.5 | GO:0080109 | indole-3-acetonitrile nitrile hydratase activity(GO:0080109) |
| 0.4 | 1.2 | GO:0008519 | ammonium transmembrane transporter activity(GO:0008519) |
| 0.4 | 4.0 | GO:0016847 | 1-aminocyclopropane-1-carboxylate synthase activity(GO:0016847) |
| 0.4 | 1.5 | GO:0004385 | guanylate kinase activity(GO:0004385) |
| 0.3 | 1.7 | GO:0003863 | 3-methyl-2-oxobutanoate dehydrogenase (2-methylpropanoyl-transferring) activity(GO:0003863) |
| 0.3 | 1.3 | GO:0016985 | mannan endo-1,4-beta-mannosidase activity(GO:0016985) |
| 0.3 | 0.9 | GO:0015119 | hexose phosphate transmembrane transporter activity(GO:0015119) glucose-6-phosphate transmembrane transporter activity(GO:0015152) |
| 0.3 | 0.9 | GO:0080132 | fatty acid alpha-hydroxylase activity(GO:0080132) |
| 0.3 | 1.5 | GO:0033897 | ribonuclease T2 activity(GO:0033897) |
| 0.3 | 2.1 | GO:0045549 | 9-cis-epoxycarotenoid dioxygenase activity(GO:0045549) |
| 0.3 | 1.5 | GO:0050113 | inositol oxygenase activity(GO:0050113) |
| 0.3 | 0.9 | GO:0004421 | hydroxymethylglutaryl-CoA synthase activity(GO:0004421) |
| 0.3 | 1.1 | GO:0080002 | UDP-glucose:4-aminobenzoate acylglucosyltransferase activity(GO:0080002) |
| 0.3 | 0.8 | GO:0052901 | spermine:oxygen oxidoreductase (spermidine-forming) activity(GO:0052901) |
| 0.3 | 1.3 | GO:0016629 | 12-oxophytodienoate reductase activity(GO:0016629) |
| 0.3 | 0.8 | GO:0051669 | levanase activity(GO:0031219) fructan beta-fructosidase activity(GO:0051669) |
| 0.3 | 1.1 | GO:0016165 | linoleate 13S-lipoxygenase activity(GO:0016165) |
| 0.3 | 2.1 | GO:0090447 | glycerol-3-phosphate 2-O-acyltransferase activity(GO:0090447) |
| 0.3 | 1.3 | GO:0003979 | UDP-glucose 6-dehydrogenase activity(GO:0003979) |
| 0.3 | 1.0 | GO:0047782 | coniferin beta-glucosidase activity(GO:0047782) |
| 0.2 | 1.2 | GO:0010295 | (+)-abscisic acid 8'-hydroxylase activity(GO:0010295) |
| 0.2 | 1.2 | GO:1902417 | (+)-abscisic acid D-glucopyranosyl ester transmembrane transporter activity(GO:1902417) |
| 0.2 | 1.0 | GO:0050734 | hydroxycinnamoyltransferase activity(GO:0050734) |
| 0.2 | 2.6 | GO:0008199 | ferric iron binding(GO:0008199) |
| 0.2 | 0.7 | GO:0045430 | chalcone isomerase activity(GO:0045430) |
| 0.2 | 1.1 | GO:0047780 | citrate dehydratase activity(GO:0047780) |
| 0.2 | 1.6 | GO:0003691 | double-stranded telomeric DNA binding(GO:0003691) |
| 0.2 | 0.9 | GO:0050162 | oxalate oxidase activity(GO:0050162) |
| 0.2 | 0.6 | GO:0016504 | peptidase activator activity(GO:0016504) |
| 0.2 | 2.3 | GO:0008970 | phosphatidylcholine 1-acylhydrolase activity(GO:0008970) |
| 0.2 | 0.6 | GO:0052629 | phosphatidylinositol-3-phosphatase activity(GO:0004438) phosphatidylinositol-3,5-bisphosphate 3-phosphatase activity(GO:0052629) |
| 0.2 | 3.0 | GO:0003978 | UDP-glucose 4-epimerase activity(GO:0003978) |
| 0.2 | 1.0 | GO:0004793 | threonine aldolase activity(GO:0004793) L-allo-threonine aldolase activity(GO:0008732) |
| 0.2 | 0.6 | GO:0015180 | L-alanine transmembrane transporter activity(GO:0015180) alanine transmembrane transporter activity(GO:0022858) |
| 0.2 | 3.1 | GO:0016157 | sucrose synthase activity(GO:0016157) |
| 0.2 | 0.5 | GO:0016726 | oxidoreductase activity, acting on CH or CH2 groups, NAD or NADP as acceptor(GO:0016726) |
| 0.2 | 0.7 | GO:0004348 | glucosylceramidase activity(GO:0004348) |
| 0.2 | 0.9 | GO:0046577 | long-chain-alcohol oxidase activity(GO:0046577) |
| 0.2 | 1.4 | GO:0004715 | non-membrane spanning protein tyrosine kinase activity(GO:0004715) |
| 0.2 | 2.2 | GO:0016702 | oxidoreductase activity, acting on single donors with incorporation of molecular oxygen, incorporation of two atoms of oxygen(GO:0016702) |
| 0.2 | 2.3 | GO:0004709 | MAP kinase kinase kinase activity(GO:0004709) |
| 0.2 | 1.8 | GO:0048040 | UDP-glucuronate decarboxylase activity(GO:0048040) |
| 0.2 | 1.0 | GO:0004766 | spermidine synthase activity(GO:0004766) |
| 0.2 | 0.5 | GO:0009374 | biotin binding(GO:0009374) |
| 0.2 | 0.3 | GO:0015204 | urea transmembrane transporter activity(GO:0015204) |
| 0.2 | 0.9 | GO:0052691 | UDP-arabinopyranose mutase activity(GO:0052691) |
| 0.2 | 1.2 | GO:0003997 | acyl-CoA oxidase activity(GO:0003997) |
| 0.2 | 0.5 | GO:0004824 | lysine-tRNA ligase activity(GO:0004824) |
| 0.1 | 2.5 | GO:0034485 | phosphatidylinositol-3,4,5-trisphosphate 5-phosphatase activity(GO:0034485) |
| 0.1 | 0.9 | GO:0052654 | L-leucine transaminase activity(GO:0052654) L-valine transaminase activity(GO:0052655) L-isoleucine transaminase activity(GO:0052656) |
| 0.1 | 2.0 | GO:0004144 | diacylglycerol O-acyltransferase activity(GO:0004144) |
| 0.1 | 0.6 | GO:0036218 | dTTP diphosphatase activity(GO:0036218) |
| 0.1 | 1.9 | GO:0008889 | glycerophosphodiester phosphodiesterase activity(GO:0008889) |
| 0.1 | 0.7 | GO:0003987 | acetate-CoA ligase activity(GO:0003987) |
| 0.1 | 2.5 | GO:1901981 | phosphatidylinositol phosphate binding(GO:1901981) |
| 0.1 | 0.6 | GO:0030371 | translation repressor activity(GO:0030371) |
| 0.1 | 1.4 | GO:0008526 | phosphatidylinositol transporter activity(GO:0008526) |
| 0.1 | 0.8 | GO:0042171 | 1-acylglycerol-3-phosphate O-acyltransferase activity(GO:0003841) lysophosphatidic acid acyltransferase activity(GO:0042171) |
| 0.1 | 0.4 | GO:0052744 | phosphatidylinositol monophosphate phosphatase activity(GO:0052744) |
| 0.1 | 1.3 | GO:0102360 | daphnetin 3-O-glucosyltransferase activity(GO:0102360) |
| 0.1 | 0.1 | GO:0003994 | aconitate hydratase activity(GO:0003994) |
| 0.1 | 1.3 | GO:0004784 | superoxide dismutase activity(GO:0004784) oxidoreductase activity, acting on superoxide radicals as acceptor(GO:0016721) |
| 0.1 | 1.2 | GO:0035252 | UDP-xylosyltransferase activity(GO:0035252) |
| 0.1 | 0.8 | GO:1990538 | xylan O-acetyltransferase activity(GO:1990538) |
| 0.1 | 0.3 | GO:0050736 | O-malonyltransferase activity(GO:0050736) |
| 0.1 | 0.3 | GO:0010331 | gibberellin binding(GO:0010331) |
| 0.1 | 0.3 | GO:0047150 | S-adenosylmethionine-homocysteine S-methyltransferase activity(GO:0008898) betaine-homocysteine S-methyltransferase activity(GO:0047150) |
| 0.1 | 0.3 | GO:0070678 | preprotein binding(GO:0070678) |
| 0.1 | 0.3 | GO:0019779 | Atg8 ligase activity(GO:0019776) Atg8 activating enzyme activity(GO:0019779) |
| 0.1 | 0.3 | GO:0015446 | arsenite secondary active transmembrane transporter activity(GO:0008490) arsenite-transmembrane transporting ATPase activity(GO:0015446) anion transmembrane-transporting ATPase activity(GO:0043225) |
| 0.1 | 0.3 | GO:0004071 | aspartate-ammonia ligase activity(GO:0004071) |
| 0.1 | 0.3 | GO:0008883 | glutamyl-tRNA reductase activity(GO:0008883) |
| 0.1 | 1.0 | GO:0008506 | sucrose:proton symporter activity(GO:0008506) |
| 0.1 | 0.3 | GO:0004828 | serine-tRNA ligase activity(GO:0004828) |
| 0.1 | 0.5 | GO:0004001 | adenosine kinase activity(GO:0004001) |
| 0.1 | 1.1 | GO:0004860 | protein kinase inhibitor activity(GO:0004860) |
| 0.1 | 0.5 | GO:0010179 | IAA-Ala conjugate hydrolase activity(GO:0010179) |
| 0.1 | 1.9 | GO:1900750 | glutathione binding(GO:0043295) oligopeptide binding(GO:1900750) |
| 0.1 | 0.5 | GO:0005544 | calcium-dependent phospholipid binding(GO:0005544) |
| 0.1 | 0.3 | GO:0051010 | microtubule plus-end binding(GO:0051010) |
| 0.1 | 0.3 | GO:0008481 | sphinganine kinase activity(GO:0008481) |
| 0.1 | 3.1 | GO:0016762 | xyloglucan:xyloglucosyl transferase activity(GO:0016762) |
| 0.1 | 1.4 | GO:0008195 | phosphatidate phosphatase activity(GO:0008195) |
| 0.1 | 0.6 | GO:0070547 | L-tyrosine:2-oxoglutarate aminotransferase activity(GO:0004838) L-tyrosine aminotransferase activity(GO:0070547) |
| 0.1 | 0.6 | GO:0019139 | cytokinin dehydrogenase activity(GO:0019139) |
| 0.1 | 1.1 | GO:0008061 | chitin binding(GO:0008061) |
| 0.1 | 0.4 | GO:0004108 | citrate (Si)-synthase activity(GO:0004108) citrate synthase activity(GO:0036440) |
| 0.1 | 0.6 | GO:0017070 | U6 snRNA binding(GO:0017070) |
| 0.1 | 0.3 | GO:0019136 | deoxynucleoside kinase activity(GO:0019136) |
| 0.1 | 1.7 | GO:0005381 | iron ion transmembrane transporter activity(GO:0005381) |
| 0.1 | 0.3 | GO:0045548 | phenylalanine ammonia-lyase activity(GO:0045548) |
| 0.1 | 0.3 | GO:0009924 | octadecanal decarbonylase activity(GO:0009924) aldehyde decarbonylase activity(GO:0071771) aldehyde oxygenase (deformylating) activity(GO:1990465) |
| 0.1 | 0.3 | GO:0019172 | glyoxalase III activity(GO:0019172) |
| 0.1 | 0.6 | GO:0047274 | galactinol-sucrose galactosyltransferase activity(GO:0047274) |
| 0.1 | 0.3 | GO:0047498 | calcium-dependent phospholipase A2 activity(GO:0047498) |
| 0.1 | 1.1 | GO:0004630 | phospholipase D activity(GO:0004630) N-acylphosphatidylethanolamine-specific phospholipase D activity(GO:0070290) |
| 0.1 | 1.8 | GO:0052716 | hydroquinone:oxygen oxidoreductase activity(GO:0052716) |
| 0.1 | 0.9 | GO:0047617 | acyl-CoA hydrolase activity(GO:0047617) |
| 0.1 | 0.9 | GO:0005504 | fatty acid binding(GO:0005504) |
| 0.1 | 0.8 | GO:0008113 | peptide-methionine (S)-S-oxide reductase activity(GO:0008113) |
| 0.1 | 0.2 | GO:0005046 | KDEL sequence binding(GO:0005046) |
| 0.1 | 1.1 | GO:0000993 | RNA polymerase II core binding(GO:0000993) |
| 0.1 | 0.5 | GO:0005049 | nuclear export signal receptor activity(GO:0005049) |
| 0.1 | 0.2 | GO:0034513 | box H/ACA snoRNA binding(GO:0034513) |
| 0.1 | 0.4 | GO:0005366 | myo-inositol:proton symporter activity(GO:0005366) |
| 0.1 | 0.5 | GO:0033549 | MAP kinase phosphatase activity(GO:0033549) |
| 0.1 | 0.6 | GO:0009011 | starch synthase activity(GO:0009011) alpha-1,4-glucan synthase activity(GO:0033201) |
| 0.1 | 0.7 | GO:0004602 | glutathione peroxidase activity(GO:0004602) |
| 0.1 | 0.7 | GO:0009922 | fatty acid elongase activity(GO:0009922) |
| 0.1 | 0.3 | GO:0015018 | galactosylgalactosylxylosylprotein 3-beta-glucuronosyltransferase activity(GO:0015018) |
| 0.1 | 0.8 | GO:0008453 | alanine-glyoxylate transaminase activity(GO:0008453) |
| 0.1 | 0.5 | GO:0018685 | alkane 1-monooxygenase activity(GO:0018685) |
| 0.1 | 0.7 | GO:0051920 | thioredoxin peroxidase activity(GO:0008379) peroxiredoxin activity(GO:0051920) |
| 0.1 | 0.4 | GO:0004449 | isocitrate dehydrogenase (NAD+) activity(GO:0004449) |
| 0.1 | 0.3 | GO:0004534 | 5'-3' exoribonuclease activity(GO:0004534) |
| 0.1 | 4.3 | GO:0004650 | polygalacturonase activity(GO:0004650) |
| 0.1 | 0.6 | GO:0008865 | fructokinase activity(GO:0008865) |
| 0.1 | 0.2 | GO:0045140 | inositol phosphoceramide synthase activity(GO:0045140) |
| 0.1 | 0.2 | GO:0017077 | oxidative phosphorylation uncoupler activity(GO:0017077) |
| 0.1 | 0.2 | GO:0001054 | RNA polymerase I activity(GO:0001054) RNA polymerase III activity(GO:0001056) |
| 0.1 | 0.4 | GO:0047429 | nucleoside-triphosphate diphosphatase activity(GO:0047429) |
| 0.1 | 0.2 | GO:0004556 | alpha-amylase activity(GO:0004556) |
| 0.1 | 0.3 | GO:0004781 | sulfate adenylyltransferase (ATP) activity(GO:0004781) |
| 0.1 | 0.1 | GO:0046524 | sucrose-phosphate synthase activity(GO:0046524) |
| 0.1 | 0.2 | GO:0016661 | oxidoreductase activity, acting on other nitrogenous compounds as donors(GO:0016661) |
| 0.1 | 0.2 | GO:0097363 | protein O-GlcNAc transferase activity(GO:0097363) |
| 0.1 | 0.5 | GO:0022833 | mechanically-gated ion channel activity(GO:0008381) mechanically gated channel activity(GO:0022833) |
| 0.1 | 0.2 | GO:0046976 | histone methyltransferase activity (H3-K27 specific)(GO:0046976) |
| 0.1 | 2.1 | GO:0019187 | beta-1,4-mannosyltransferase activity(GO:0019187) mannan synthase activity(GO:0051753) |
| 0.1 | 0.2 | GO:0004647 | phosphoserine phosphatase activity(GO:0004647) |
| 0.1 | 0.2 | GO:0070034 | telomerase RNA binding(GO:0070034) |
| 0.1 | 0.2 | GO:0015928 | fucosidase activity(GO:0015928) |
| 0.1 | 0.3 | GO:0004758 | serine C-palmitoyltransferase activity(GO:0004758) C-palmitoyltransferase activity(GO:0016454) |
| 0.1 | 0.2 | GO:0016277 | [myelin basic protein]-arginine N-methyltransferase activity(GO:0016277) |
| 0.1 | 0.4 | GO:0003917 | DNA topoisomerase type I activity(GO:0003917) |
| 0.1 | 2.5 | GO:0004222 | metalloendopeptidase activity(GO:0004222) |
| 0.1 | 0.2 | GO:0004821 | histidine-tRNA ligase activity(GO:0004821) |
| 0.1 | 0.1 | GO:0030619 | U1 snRNA binding(GO:0030619) |
| 0.1 | 0.2 | GO:0008395 | steroid hydroxylase activity(GO:0008395) |
| 0.1 | 0.2 | GO:0050291 | sphingosine N-acyltransferase activity(GO:0050291) |
| 0.1 | 0.3 | GO:0004614 | phosphoglucomutase activity(GO:0004614) |
| 0.1 | 0.4 | GO:0004849 | uridine kinase activity(GO:0004849) |
| 0.1 | 0.2 | GO:0004749 | ribose phosphate diphosphokinase activity(GO:0004749) |
| 0.1 | 0.3 | GO:0004028 | 3-chloroallyl aldehyde dehydrogenase activity(GO:0004028) |
| 0.1 | 0.5 | GO:0004806 | triglyceride lipase activity(GO:0004806) |
| 0.1 | 1.2 | GO:0097602 | cullin family protein binding(GO:0097602) |
| 0.1 | 0.1 | GO:0004779 | sulfate adenylyltransferase activity(GO:0004779) |
| 0.0 | 0.2 | GO:0004751 | ribose-5-phosphate isomerase activity(GO:0004751) |
| 0.0 | 0.3 | GO:0005047 | signal recognition particle binding(GO:0005047) |
| 0.0 | 0.1 | GO:0010178 | IAA-amino acid conjugate hydrolase activity(GO:0010178) |
| 0.0 | 1.2 | GO:0016837 | carbon-oxygen lyase activity, acting on polysaccharides(GO:0016837) pectate lyase activity(GO:0030570) |
| 0.0 | 1.6 | GO:0005179 | hormone activity(GO:0005179) |
| 0.0 | 0.1 | GO:0001216 | bacterial-type RNA polymerase transcription factor activity, sequence-specific DNA binding(GO:0001130) bacterial-type RNA polymerase transcriptional activator activity, sequence-specific DNA binding(GO:0001216) |
| 0.0 | 0.4 | GO:0004161 | dimethylallyltranstransferase activity(GO:0004161) |
| 0.0 | 0.6 | GO:0042389 | omega-3 fatty acid desaturase activity(GO:0042389) |
| 0.0 | 1.9 | GO:0030145 | manganese ion binding(GO:0030145) |
| 0.0 | 1.7 | GO:0015385 | sodium:proton antiporter activity(GO:0015385) |
| 0.0 | 0.3 | GO:0001872 | (1->3)-beta-D-glucan binding(GO:0001872) |
| 0.0 | 0.1 | GO:0019789 | SUMO transferase activity(GO:0019789) |
| 0.0 | 0.3 | GO:0004143 | diacylglycerol kinase activity(GO:0004143) |
| 0.0 | 0.3 | GO:0004834 | tryptophan synthase activity(GO:0004834) |
| 0.0 | 0.2 | GO:0003977 | UDP-N-acetylglucosamine diphosphorylase activity(GO:0003977) |
| 0.0 | 1.5 | GO:0035091 | phosphatidylinositol binding(GO:0035091) |
| 0.0 | 0.8 | GO:0001085 | RNA polymerase II transcription factor binding(GO:0001085) |
| 0.0 | 0.4 | GO:1990757 | ubiquitin ligase activator activity(GO:1990757) |
| 0.0 | 0.6 | GO:0016844 | strictosidine synthase activity(GO:0016844) |
| 0.0 | 0.1 | GO:0016453 | acetyl-CoA C-acetyltransferase activity(GO:0003985) C-acetyltransferase activity(GO:0016453) |
| 0.0 | 0.6 | GO:0016308 | 1-phosphatidylinositol-4-phosphate 5-kinase activity(GO:0016308) |
| 0.0 | 1.5 | GO:0008553 | hydrogen-exporting ATPase activity, phosphorylative mechanism(GO:0008553) |
| 0.0 | 0.2 | GO:0016464 | chloroplast protein-transporting ATPase activity(GO:0016464) |
| 0.0 | 0.3 | GO:0004791 | thioredoxin-disulfide reductase activity(GO:0004791) |
| 0.0 | 0.2 | GO:0005093 | Rab GDP-dissociation inhibitor activity(GO:0005093) |
| 0.0 | 0.3 | GO:0015271 | outward rectifier potassium channel activity(GO:0015271) |
| 0.0 | 0.4 | GO:0034647 | histone demethylase activity (H3-K4 specific)(GO:0032453) histone demethylase activity (H3-trimethyl-K4 specific)(GO:0034647) |
| 0.0 | 0.1 | GO:0070401 | NADP+ binding(GO:0070401) |
| 0.0 | 0.3 | GO:0005384 | manganese ion transmembrane transporter activity(GO:0005384) |
| 0.0 | 0.1 | GO:0051752 | phosphoglucan, water dikinase activity(GO:0051752) |
| 0.0 | 0.5 | GO:0004714 | transmembrane receptor protein tyrosine kinase activity(GO:0004714) |
| 0.0 | 0.5 | GO:0030955 | pyruvate kinase activity(GO:0004743) potassium ion binding(GO:0030955) alkali metal ion binding(GO:0031420) |
| 0.0 | 0.4 | GO:0031176 | endo-1,4-beta-xylanase activity(GO:0031176) |
| 0.0 | 0.1 | GO:0008174 | mRNA methyltransferase activity(GO:0008174) |
| 0.0 | 0.1 | GO:0001099 | basal transcription machinery binding(GO:0001098) basal RNA polymerase II transcription machinery binding(GO:0001099) |
| 0.0 | 0.7 | GO:0080032 | methyl salicylate esterase activity(GO:0080031) methyl jasmonate esterase activity(GO:0080032) |
| 0.0 | 0.5 | GO:0035064 | methylated histone binding(GO:0035064) |
| 0.0 | 0.5 | GO:0008536 | Ran GTPase binding(GO:0008536) |
| 0.0 | 4.1 | GO:0003779 | actin binding(GO:0003779) |
| 0.0 | 0.3 | GO:0010428 | methyl-CpNpG binding(GO:0010428) methyl-CpNpN binding(GO:0010429) |
| 0.0 | 0.2 | GO:0046933 | proton-transporting ATP synthase activity, rotational mechanism(GO:0046933) |
| 0.0 | 0.8 | GO:0004805 | trehalose-phosphatase activity(GO:0004805) |
| 0.0 | 0.2 | GO:0031957 | very long-chain fatty acid-CoA ligase activity(GO:0031957) |
| 0.0 | 0.2 | GO:0001664 | G-protein coupled receptor binding(GO:0001664) G-protein beta/gamma-subunit complex binding(GO:0031683) |
| 0.0 | 0.6 | GO:0003843 | 1,3-beta-D-glucan synthase activity(GO:0003843) |
| 0.0 | 0.2 | GO:0008728 | GTP diphosphokinase activity(GO:0008728) |
| 0.0 | 0.1 | GO:0016653 | oxidoreductase activity, acting on NAD(P)H, heme protein as acceptor(GO:0016653) |
| 0.0 | 0.2 | GO:0070122 | isopeptidase activity(GO:0070122) |
| 0.0 | 0.1 | GO:0016801 | hydrolase activity, acting on ether bonds(GO:0016801) |
| 0.0 | 0.3 | GO:0043495 | protein anchor(GO:0043495) |
| 0.0 | 0.9 | GO:0004724 | magnesium-dependent protein serine/threonine phosphatase activity(GO:0004724) |
| 0.0 | 0.2 | GO:0030544 | Hsp70 protein binding(GO:0030544) |
| 0.0 | 0.3 | GO:0052747 | sinapyl alcohol dehydrogenase activity(GO:0052747) |
| 0.0 | 0.5 | GO:0080030 | methyl indole-3-acetate esterase activity(GO:0080030) |
| 0.0 | 0.1 | GO:0070704 | sterol desaturase activity(GO:0070704) |
| 0.0 | 0.2 | GO:0004376 | glycolipid mannosyltransferase activity(GO:0004376) |
| 0.0 | 0.1 | GO:0008198 | ferrous iron binding(GO:0008198) |
| 0.0 | 0.4 | GO:0004427 | inorganic diphosphatase activity(GO:0004427) |
| 0.0 | 0.3 | GO:0016682 | oxidoreductase activity, acting on diphenols and related substances as donors, oxygen as acceptor(GO:0016682) |
| 0.0 | 0.2 | GO:0008515 | sucrose transmembrane transporter activity(GO:0008515) |
| 0.0 | 0.2 | GO:0030527 | structural constituent of chromatin(GO:0030527) |
| 0.0 | 0.3 | GO:0016538 | cyclin-dependent protein serine/threonine kinase regulator activity(GO:0016538) |
| 0.0 | 0.2 | GO:0008083 | growth factor activity(GO:0008083) |
| 0.0 | 0.7 | GO:0004725 | protein tyrosine phosphatase activity(GO:0004725) |
| 0.0 | 0.1 | GO:0008534 | oxidized purine nucleobase lesion DNA N-glycosylase activity(GO:0008534) |
| 0.0 | 0.2 | GO:0043995 | histone acetyltransferase activity (H4-K5 specific)(GO:0043995) |
| 0.0 | 2.0 | GO:0004722 | protein serine/threonine phosphatase activity(GO:0004722) |
| 0.0 | 0.3 | GO:0008097 | 5S rRNA binding(GO:0008097) |
| 0.0 | 0.1 | GO:0016656 | monodehydroascorbate reductase (NADH) activity(GO:0016656) |
| 0.0 | 0.1 | GO:0003680 | AT DNA binding(GO:0003680) |
| 0.0 | 0.2 | GO:0003886 | DNA (cytosine-5-)-methyltransferase activity(GO:0003886) |
| 0.0 | 1.8 | GO:0030599 | pectinesterase activity(GO:0030599) |
| 0.0 | 0.1 | GO:0008517 | folic acid transporter activity(GO:0008517) |
| 0.0 | 0.5 | GO:0008237 | metallopeptidase activity(GO:0008237) |
| 0.0 | 0.9 | GO:0003713 | transcription coactivator activity(GO:0003713) |
| 0.0 | 0.3 | GO:0008641 | small protein activating enzyme activity(GO:0008641) |
| 0.0 | 0.1 | GO:0035175 | histone serine kinase activity(GO:0035174) histone kinase activity (H3-S10 specific)(GO:0035175) |
| 0.0 | 0.1 | GO:0032131 | alkylated DNA binding(GO:0032131) |
| 0.0 | 0.1 | GO:0047334 | diphosphate-fructose-6-phosphate 1-phosphotransferase activity(GO:0047334) |
| 0.0 | 0.2 | GO:0003830 | beta-1,4-mannosylglycoprotein 4-beta-N-acetylglucosaminyltransferase activity(GO:0003830) |
| 0.0 | 0.3 | GO:0070181 | small ribosomal subunit rRNA binding(GO:0070181) |
| 0.0 | 0.1 | GO:0016634 | oxidoreductase activity, acting on the CH-CH group of donors, oxygen as acceptor(GO:0016634) |
| 0.0 | 0.3 | GO:0005452 | inorganic anion exchanger activity(GO:0005452) |
| 0.0 | 0.1 | GO:0070182 | DNA polymerase binding(GO:0070182) |
| 0.0 | 2.5 | GO:0008234 | cysteine-type peptidase activity(GO:0008234) |
| 0.0 | 0.1 | GO:0004619 | phosphoglycerate mutase activity(GO:0004619) |
| 0.0 | 0.3 | GO:0009044 | xylan 1,4-beta-xylosidase activity(GO:0009044) xylanase activity(GO:0097599) |
| 0.0 | 0.1 | GO:0004473 | malate dehydrogenase (decarboxylating) (NADP+) activity(GO:0004473) |
| 0.0 | 0.1 | GO:0050062 | long-chain-fatty-acyl-CoA reductase activity(GO:0050062) |
| 0.0 | 0.4 | GO:0004525 | ribonuclease III activity(GO:0004525) double-stranded RNA-specific ribonuclease activity(GO:0032296) |
| 0.0 | 0.1 | GO:0016621 | cinnamoyl-CoA reductase activity(GO:0016621) |
| 0.0 | 0.1 | GO:0004066 | asparagine synthase (glutamine-hydrolyzing) activity(GO:0004066) |
| 0.0 | 0.1 | GO:0051765 | inositol tetrakisphosphate kinase activity(GO:0051765) |
| 0.0 | 0.1 | GO:0043682 | copper-transporting ATPase activity(GO:0043682) |
| 0.0 | 0.2 | GO:0017069 | snRNA binding(GO:0017069) |
| 0.0 | 0.3 | GO:0016409 | palmitoyltransferase activity(GO:0016409) |
| 0.0 | 0.1 | GO:0051740 | ethylene receptor activity(GO:0038199) ethylene binding(GO:0051740) alkene binding(GO:0072328) |
| 0.0 | 0.2 | GO:0047216 | inositol 3-alpha-galactosyltransferase activity(GO:0047216) |
| 0.0 | 0.2 | GO:0004713 | protein tyrosine kinase activity(GO:0004713) |
| 0.0 | 0.1 | GO:0000268 | peroxisome targeting sequence binding(GO:0000268) |
| 0.0 | 0.3 | GO:0004568 | chitinase activity(GO:0004568) |
| 0.0 | 0.3 | GO:0004564 | beta-fructofuranosidase activity(GO:0004564) |
| 0.0 | 0.1 | GO:0080116 | glucuronoxylan glucuronosyltransferase activity(GO:0080116) |
| 0.0 | 0.1 | GO:0015136 | sialic acid transmembrane transporter activity(GO:0015136) |
| 0.0 | 0.3 | GO:0031369 | translation initiation factor binding(GO:0031369) |
| 0.0 | 0.3 | GO:0016645 | oxidoreductase activity, acting on the CH-NH group of donors(GO:0016645) |
| 0.0 | 1.0 | GO:0042277 | peptide binding(GO:0042277) |
| 0.0 | 0.0 | GO:0004826 | phenylalanine-tRNA ligase activity(GO:0004826) |
| 0.0 | 0.5 | GO:0008081 | phosphoric diester hydrolase activity(GO:0008081) |
| 0.0 | 0.1 | GO:0101005 | ubiquitinyl hydrolase activity(GO:0101005) |
| 0.0 | 0.8 | GO:0005096 | GTPase activator activity(GO:0005096) |
| 0.0 | 0.1 | GO:0003878 | ATP citrate synthase activity(GO:0003878) |
| 0.0 | 0.0 | GO:0004571 | mannosyl-oligosaccharide 1,2-alpha-mannosidase activity(GO:0004571) |
| 0.0 | 0.2 | GO:0032440 | 2-alkenal reductase [NAD(P)] activity(GO:0032440) |
| 0.0 | 0.6 | GO:0004721 | phosphoprotein phosphatase activity(GO:0004721) |
| 0.0 | 0.5 | GO:0005200 | structural constituent of cytoskeleton(GO:0005200) |
| 0.0 | 0.4 | GO:0005345 | purine nucleobase transmembrane transporter activity(GO:0005345) |
| 0.0 | 0.2 | GO:0008106 | alcohol dehydrogenase (NADP+) activity(GO:0008106) |
| 0.0 | 0.1 | GO:0004312 | fatty acid synthase activity(GO:0004312) |
| 0.0 | 0.1 | GO:0004310 | farnesyl-diphosphate farnesyltransferase activity(GO:0004310) squalene synthase activity(GO:0051996) |
| 0.0 | 0.1 | GO:0004817 | cysteine-tRNA ligase activity(GO:0004817) |
| 0.0 | 0.0 | GO:0000309 | nicotinamide-nucleotide adenylyltransferase activity(GO:0000309) |
| 0.0 | 0.3 | GO:0051787 | misfolded protein binding(GO:0051787) |
| 0.0 | 0.8 | GO:0019901 | protein kinase binding(GO:0019901) |
| 0.0 | 1.6 | GO:0046982 | protein heterodimerization activity(GO:0046982) |
| 0.0 | 0.6 | GO:0080043 | quercetin 3-O-glucosyltransferase activity(GO:0080043) |
| 0.0 | 0.1 | GO:0017116 | ATP-dependent DNA helicase activity(GO:0004003) ATP-dependent helicase activity(GO:0008026) single-stranded DNA-dependent ATP-dependent DNA helicase activity(GO:0017116) single-stranded DNA-dependent ATPase activity(GO:0043142) purine NTP-dependent helicase activity(GO:0070035) |
| 0.0 | 0.2 | GO:0003746 | translation elongation factor activity(GO:0003746) |
| 0.0 | 0.0 | GO:0051723 | prenylcysteine methylesterase activity(GO:0010296) protein methylesterase activity(GO:0051723) |
| 0.0 | 0.4 | GO:0018024 | histone-lysine N-methyltransferase activity(GO:0018024) |
| 0.0 | 0.1 | GO:0022829 | porin activity(GO:0015288) wide pore channel activity(GO:0022829) |
| 0.0 | 1.0 | GO:0051082 | unfolded protein binding(GO:0051082) |
| 0.0 | 0.6 | GO:0042393 | histone binding(GO:0042393) |
| 0.0 | 0.4 | GO:0003993 | acid phosphatase activity(GO:0003993) |
| 0.0 | 0.5 | GO:0005347 | ATP transmembrane transporter activity(GO:0005347) |
| 0.0 | 0.1 | GO:0001046 | core promoter sequence-specific DNA binding(GO:0001046) core promoter binding(GO:0001047) |
Gene overrepresentation in curated gene sets: canonical pathways category:
| Log-likelihood per target | Total log-likelihood | Term | Description |
|---|---|---|---|
| 0.3 | 0.8 | PID AURORA A PATHWAY | Aurora A signaling |
| 0.2 | 0.7 | PID IL12 2PATHWAY | IL12-mediated signaling events |
| 0.2 | 0.2 | PID EPHA2 FWD PATHWAY | EPHA2 forward signaling |
| 0.2 | 0.7 | PID S1P META PATHWAY | Sphingosine 1-phosphate (S1P) pathway |
| 0.1 | 0.4 | PID TAP63 PATHWAY | Validated transcriptional targets of TAp63 isoforms |
| 0.1 | 0.5 | PID HIF2PATHWAY | HIF-2-alpha transcription factor network |
| 0.1 | 0.5 | PID HDAC CLASSII PATHWAY | Signaling events mediated by HDAC Class II |
| 0.1 | 0.3 | ST WNT BETA CATENIN PATHWAY | Wnt/beta-catenin Pathway |
| 0.1 | 0.5 | PID IL2 PI3K PATHWAY | IL2 signaling events mediated by PI3K |
| 0.1 | 0.5 | PID MTOR 4PATHWAY | mTOR signaling pathway |
| 0.1 | 0.1 | PID P38 ALPHA BETA DOWNSTREAM PATHWAY | Signaling mediated by p38-alpha and p38-beta |
| 0.1 | 0.1 | PID ATF2 PATHWAY | ATF-2 transcription factor network |
| 0.1 | 0.2 | PID MYC REPRESS PATHWAY | Validated targets of C-MYC transcriptional repression |
| 0.0 | 0.5 | PID RAC1 PATHWAY | RAC1 signaling pathway |
| 0.0 | 0.0 | ST INTEGRIN SIGNALING PATHWAY | Integrin Signaling Pathway |
| 0.0 | 0.2 | PID ATR PATHWAY | ATR signaling pathway |
Gene overrepresentation in curated gene sets: REACTOME pathways category:
| Log-likelihood per target | Total log-likelihood | Term | Description |
|---|---|---|---|
| 0.3 | 0.9 | REACTOME AMINO ACID SYNTHESIS AND INTERCONVERSION TRANSAMINATION | Genes involved in Amino acid synthesis and interconversion (transamination) |
| 0.3 | 1.2 | REACTOME SYNTHESIS OF BILE ACIDS AND BILE SALTS | Genes involved in Synthesis of bile acids and bile salts |
| 0.3 | 1.1 | REACTOME MITOCHONDRIAL PROTEIN IMPORT | Genes involved in Mitochondrial Protein Import |
| 0.2 | 0.5 | REACTOME PKB MEDIATED EVENTS | Genes involved in PKB-mediated events |
| 0.1 | 0.4 | REACTOME HDL MEDIATED LIPID TRANSPORT | Genes involved in HDL-mediated lipid transport |
| 0.1 | 0.4 | REACTOME PYRUVATE METABOLISM AND CITRIC ACID TCA CYCLE | Genes involved in Pyruvate metabolism and Citric Acid (TCA) cycle |
| 0.1 | 0.8 | REACTOME GLYCEROPHOSPHOLIPID BIOSYNTHESIS | Genes involved in Glycerophospholipid biosynthesis |
| 0.1 | 0.3 | REACTOME PI METABOLISM | Genes involved in PI Metabolism |
| 0.1 | 0.3 | REACTOME SPHINGOLIPID DE NOVO BIOSYNTHESIS | Genes involved in Sphingolipid de novo biosynthesis |
| 0.1 | 0.3 | REACTOME INTRINSIC PATHWAY FOR APOPTOSIS | Genes involved in Intrinsic Pathway for Apoptosis |
| 0.1 | 0.2 | REACTOME PEROXISOMAL LIPID METABOLISM | Genes involved in Peroxisomal lipid metabolism |
| 0.1 | 0.3 | REACTOME SIGNALING BY ROBO RECEPTOR | Genes involved in Signaling by Robo receptor |
| 0.1 | 0.3 | REACTOME BIOSYNTHESIS OF THE N GLYCAN PRECURSOR DOLICHOL LIPID LINKED OLIGOSACCHARIDE LLO AND TRANSFER TO A NASCENT PROTEIN | Genes involved in Biosynthesis of the N-glycan precursor (dolichol lipid-linked oligosaccharide, LLO) and transfer to a nascent protein |
| 0.1 | 0.1 | REACTOME DEADENYLATION OF MRNA | Genes involved in Deadenylation of mRNA |
| 0.1 | 0.3 | REACTOME MHC CLASS II ANTIGEN PRESENTATION | Genes involved in MHC class II antigen presentation |
| 0.1 | 0.2 | REACTOME SIGNALING BY TGF BETA RECEPTOR COMPLEX | Genes involved in Signaling by TGF-beta Receptor Complex |
| 0.0 | 0.1 | REACTOME ABACAVIR TRANSPORT AND METABOLISM | Genes involved in Abacavir transport and metabolism |
| 0.0 | 0.3 | REACTOME NONSENSE MEDIATED DECAY ENHANCED BY THE EXON JUNCTION COMPLEX | Genes involved in Nonsense Mediated Decay Enhanced by the Exon Junction Complex |
| 0.0 | 0.9 | REACTOME ABC FAMILY PROTEINS MEDIATED TRANSPORT | Genes involved in ABC-family proteins mediated transport |
| 0.0 | 0.1 | REACTOME METABOLISM OF AMINO ACIDS AND DERIVATIVES | Genes involved in Metabolism of amino acids and derivatives |
| 0.0 | 0.2 | REACTOME ANTIGEN PROCESSING UBIQUITINATION PROTEASOME DEGRADATION | Genes involved in Antigen processing: Ubiquitination & Proteasome degradation |
| 0.0 | 0.4 | REACTOME ACTIVATION OF THE MRNA UPON BINDING OF THE CAP BINDING COMPLEX AND EIFS AND SUBSEQUENT BINDING TO 43S | Genes involved in Activation of the mRNA upon binding of the cap-binding complex and eIFs, and subsequent binding to 43S |
| 0.0 | 0.3 | REACTOME DEVELOPMENTAL BIOLOGY | Genes involved in Developmental Biology |
| 0.0 | 0.2 | REACTOME POL SWITCHING | Genes involved in Polymerase switching |
| 0.0 | 0.2 | REACTOME CHEMOKINE RECEPTORS BIND CHEMOKINES | Genes involved in Chemokine receptors bind chemokines |
| 0.0 | 0.1 | REACTOME SIGNALING BY RHO GTPASES | Genes involved in Signaling by Rho GTPases |
| 0.0 | 0.1 | REACTOME INNATE IMMUNE SYSTEM | Genes involved in Innate Immune System |
| 0.0 | 0.1 | REACTOME UNWINDING OF DNA | Genes involved in Unwinding of DNA |
| 0.0 | 0.1 | REACTOME DOPAMINE NEUROTRANSMITTER RELEASE CYCLE | Genes involved in Dopamine Neurotransmitter Release Cycle |