Project
GSE43616: Time-course of wild-type Arabidopsis leaf
Navigation
Downloads
Results for AT4G32890
Z-value: 0.04
Transcription factors associated with AT4G32890
| Gene Symbol | Gene ID | Gene Info |
|---|---|---|
|
AT4G32890
|
AT4G32890 | GATA transcription factor 9 |
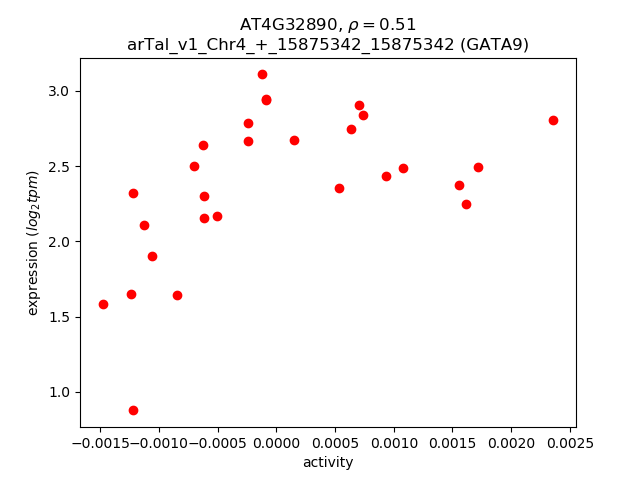
Activity-expression correlation:
| Gene | Promoter | Pearson corr. coef. | P-value | Plot |
|---|---|---|---|---|
| GATA9 | arTal_v1_Chr4_+_15875342_15875342 | 0.51 | 5.4e-03 | Click! |
Activity profile of AT4G32890 motif
Sorted Z-values of AT4G32890 motif
| Promoter | Log-likelihood | Transcript | Gene | Gene Info |
|---|---|---|---|---|
| arTal_v1_Chr3_-_6421983_6422141 | 0.09 |
AT3G18660.1
AT3G18660.3 AT3G18660.2 |
PGSIP1
|
plant glycogenin-like starch initiation protein 1 |
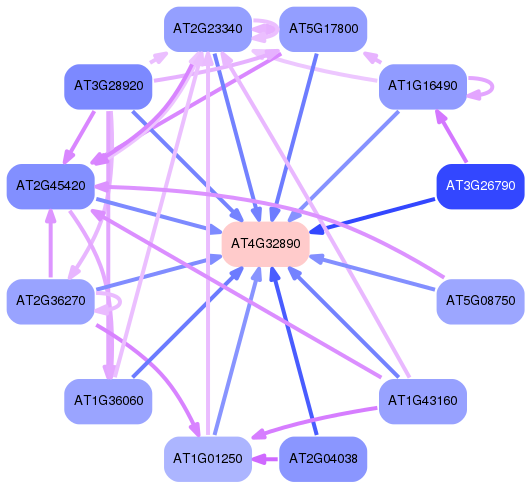
Network of associatons between targets according to the STRING database.

First level regulatory network of AT4G32890
Gene Ontology Analysis
Gene overrepresentation in molecular function category:
| Log-likelihood per target | Total log-likelihood | Term | Description |
|---|---|---|---|
| 0.0 | 0.1 | GO:0080116 | glucuronoxylan glucuronosyltransferase activity(GO:0080116) |