Project
GSE43616: Time-course of wild-type Arabidopsis leaf
Navigation
Downloads
Results for AT4G26150
Z-value: 0.08
Transcription factors associated with AT4G26150
| Gene Symbol | Gene ID | Gene Info |
|---|---|---|
|
AT4G26150
|
AT4G26150 | cytokinin-responsive gata factor 1 |
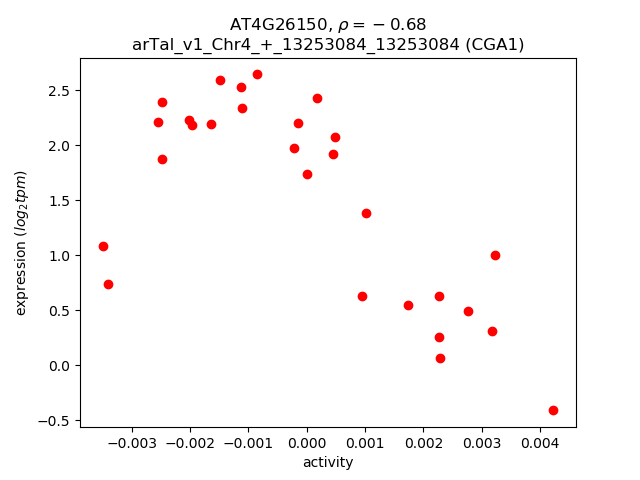
Activity-expression correlation:
| Gene | Promoter | Pearson corr. coef. | P-value | Plot |
|---|---|---|---|---|
| CGA1 | arTal_v1_Chr4_+_13253084_13253084 | -0.68 | 7.2e-05 | Click! |
Activity profile of AT4G26150 motif
Sorted Z-values of AT4G26150 motif
| Promoter | Log-likelihood | Transcript | Gene | Gene Info |
|---|---|---|---|---|
| arTal_v1_Chr5_+_17714390_17714390 | 0.24 |
AT5G44030.2
AT5G44030.1 |
CESA4
|
cellulose synthase A4 |
| arTal_v1_Chr5_+_17715687_17715687 | 0.16 |
AT5G44030.3
|
CESA4
|
cellulose synthase A4 |
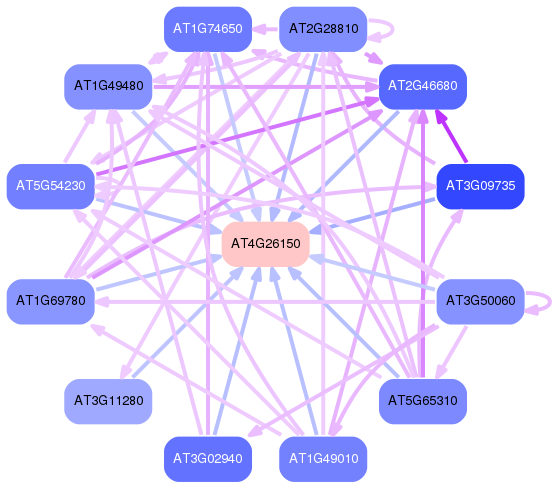
Network of associatons between targets according to the STRING database.

First level regulatory network of AT4G26150
Gene Ontology Analysis
Gene overrepresentation in biological process category:
| Log-likelihood per target | Total log-likelihood | Term | Description |
|---|---|---|---|
| 0.0 | 0.4 | GO:0009833 | plant-type primary cell wall biogenesis(GO:0009833) |
Gene overrepresentation in molecular function category:
| Log-likelihood per target | Total log-likelihood | Term | Description |
|---|---|---|---|
| 0.0 | 0.4 | GO:0016760 | cellulose synthase (UDP-forming) activity(GO:0016760) |