Project
GSE43616: Time-course of wild-type Arabidopsis leaf
Navigation
Downloads
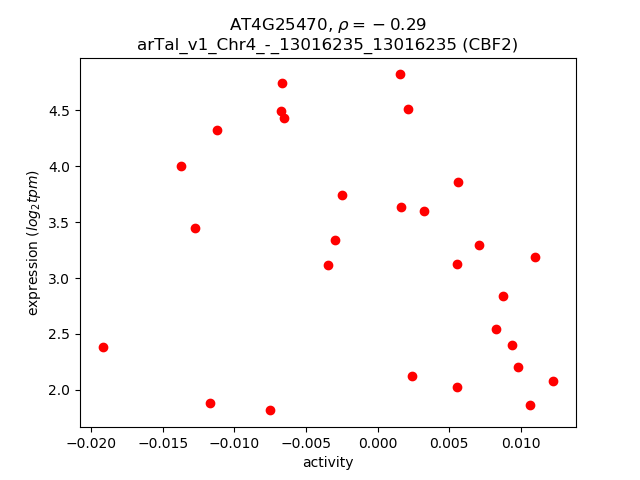
Results for AT4G25470
Z-value: 0.74
Transcription factors associated with AT4G25470
| Gene Symbol | Gene ID | Gene Info |
|---|---|---|
|
AT4G25470
|
AT4G25470 | C-repeat/DRE binding factor 2 |
Activity-expression correlation:
| Gene | Promoter | Pearson corr. coef. | P-value | Plot |
|---|---|---|---|---|
| CBF2 | arTal_v1_Chr4_-_13016235_13016235 | -0.29 | 1.4e-01 | Click! |
Activity profile of AT4G25470 motif
Sorted Z-values of AT4G25470 motif
| Promoter | Log-likelihood | Transcript | Gene | Gene Info |
|---|---|---|---|---|
| arTal_v1_Chr2_-_17648945_17649062 | 1.08 |
AT2G42380.1
AT2G42380.4 AT2G42380.3 AT2G42380.2 AT2G42380.5 |
BZIP34
|
Basic-leucine zipper (bZIP) transcription factor family protein |
| arTal_v1_Chr2_+_17854557_17854557 | 0.86 |
AT2G42900.1
|
AT2G42900
|
Plant basic secretory protein (BSP) family protein |
| arTal_v1_Chr5_+_4087689_4087689 | 0.84 |
AT5G12940.1
|
AT5G12940
|
Leucine-rich repeat (LRR) family protein |
| arTal_v1_Chr1_-_16917053_16917053 | 0.79 |
AT1G44800.1
|
SIAR1
|
nodulin MtN21 /EamA-like transporter family protein |
| arTal_v1_Chr2_-_15474717_15474828 | 0.76 |
AT2G36870.2
AT2G36870.1 |
XTH32
|
xyloglucan endotransglucosylase/hydrolase 32 |
| arTal_v1_Chr4_+_5244865_5244865 | 0.75 |
AT4G08300.1
|
UMAMIT17
|
nodulin MtN21 /EamA-like transporter family protein |
| arTal_v1_Chr2_-_15490347_15490449 | 0.70 |
AT2G36895.2
AT2G36895.3 AT2G36895.1 |
AT2G36895
|
D-tagatose-1,6-bisphosphate aldolase subunit |
| arTal_v1_Chr4_+_5238773_5238917 | 0.67 |
AT4G08290.1
AT4G08290.2 |
UMAMIT20
|
nodulin MtN21 /EamA-like transporter family protein |
| arTal_v1_Chr3_-_7557969_7557969 | 0.67 |
AT3G21460.1
|
AT3G21460
|
Glutaredoxin family protein |
| arTal_v1_Chr4_-_16806830_16806830 | 0.65 |
AT4G35320.1
|
AT4G35320
|
hypothetical protein |
| arTal_v1_Chr1_+_10371675_10371675 | 0.63 |
AT1G29660.1
|
AT1G29660
|
GDSL-like Lipase/Acylhydrolase superfamily protein |
| arTal_v1_Chr1_-_29635931_29635931 | 0.63 |
AT1G78820.1
|
AT1G78820
|
D-mannose binding lectin protein with Apple-like carbohydrate-binding domain-containing protein |
| arTal_v1_Chr3_+_5556710_5556710 | 0.63 |
AT3G16370.1
|
AT3G16370
|
GDSL-like Lipase/Acylhydrolase superfamily protein |
| arTal_v1_Chr3_+_1727151_1727151 | 0.62 |
AT3G05800.1
|
AIF1
|
AtBS1(activation-tagged BRI1 suppressor 1)-interacting factor 1 |
| arTal_v1_Chr2_+_2763449_2763513 | 0.59 |
AT2G06850.1
AT2G06850.2 |
XTH4
|
xyloglucan endotransglucosylase/hydrolase 4 |
| arTal_v1_Chr5_+_3889906_3889906 | 0.59 |
AT5G12050.1
|
AT5G12050
|
rho GTPase-activating protein |
| arTal_v1_Chr4_-_12772438_12772479 | 0.58 |
AT4G24780.1
AT4G24780.2 |
AT4G24780
|
Pectin lyase-like superfamily protein |
| arTal_v1_Chr1_-_15607966_15607966 | 0.58 |
AT1G41830.1
|
SKS6
|
SKU5-similar 6 |
| arTal_v1_Chr1_-_11719988_11719988 | 0.58 |
AT1G32450.1
|
NRT1.5
|
nitrate transporter 1.5 |
| arTal_v1_Chr4_+_11907355_11907355 | 0.57 |
AT4G22620.1
|
AT4G22620
|
SAUR-like auxin-responsive protein family |
| arTal_v1_Chr1_-_23487091_23487091 | 0.55 |
AT1G63310.1
|
AT1G63310
|
hypothetical protein |
| arTal_v1_Chr3_-_22984566_22984566 | 0.55 |
AT3G62070.1
|
AT3G62070
|
hypothetical protein |
| arTal_v1_Chr3_-_2216483_2216483 | 0.54 |
AT3G07010.1
AT3G07010.2 |
AT3G07010
|
Pectin lyase-like superfamily protein |
| arTal_v1_Chr3_+_18262290_18262511 | 0.51 |
AT3G49260.1
AT3G49260.3 AT3G49260.2 AT3G49260.4 |
iqd21
|
IQ-domain 21 |
| arTal_v1_Chr2_+_8985959_8985959 | 0.51 |
AT2G20880.1
|
ERF53
|
Integrase-type DNA-binding superfamily protein |
| arTal_v1_Chr4_+_15583332_15583363 | 0.51 |
AT4G32280.1
AT4G32280.2 AT4G32280.3 |
IAA29
|
indole-3-acetic acid inducible 29 |
| arTal_v1_Chr5_+_6670275_6670275 | 0.51 |
AT5G19730.1
|
AT5G19730
|
Pectin lyase-like superfamily protein |
| arTal_v1_Chr5_+_26298728_26298728 | 0.49 |
AT5G65730.1
|
XTH6
|
xyloglucan endotransglucosylase/hydrolase 6 |
| arTal_v1_Chr2_-_15729170_15729170 | 0.49 |
AT2G37460.1
|
UMAMIT12
|
nodulin MtN21 /EamA-like transporter family protein |
| arTal_v1_Chr3_-_1643174_1643253 | 0.49 |
AT3G05640.2
AT3G05640.1 AT3G05640.3 |
AT3G05640
|
Protein phosphatase 2C family protein |
| arTal_v1_Chr1_-_8967562_8967562 | 0.49 |
AT1G25530.1
|
AT1G25530
|
Transmembrane amino acid transporter family protein |
| arTal_v1_Chr1_+_23911024_23911024 | 0.48 |
AT1G64390.1
|
GH9C2
|
glycosyl hydrolase 9C2 |
| arTal_v1_Chr1_+_20614573_20614610 | 0.48 |
AT1G55260.1
AT1G55260.2 |
AT1G55260
|
Bifunctional inhibitor/lipid-transfer protein/seed storage 2S albumin superfamily protein |
| arTal_v1_Chr4_+_12660687_12660687 | 0.48 |
AT4G24510.1
|
CER2
|
HXXXD-type acyl-transferase family protein |
| arTal_v1_Chr5_+_26767599_26767599 | 0.47 |
AT5G67070.1
|
RALFL34
|
ralf-like 34 |
| arTal_v1_Chr3_-_8393467_8393467 | 0.46 |
AT3G23430.1
|
PHO1
|
phosphate 1 |
| arTal_v1_Chr2_-_11350993_11350993 | 0.46 |
AT2G26690.1
|
AT2G26690
|
Major facilitator superfamily protein |
| arTal_v1_Chr3_-_4834015_4834015 | 0.46 |
AT3G14440.1
|
NCED3
|
nine-cis-epoxycarotenoid dioxygenase 3 |
| arTal_v1_Chr2_-_11349548_11349548 | 0.46 |
AT2G26690.3
|
AT2G26690
|
Major facilitator superfamily protein |
| arTal_v1_Chr1_+_9825169_9825169 | 0.45 |
AT1G28130.1
|
GH3.17
|
Auxin-responsive GH3 family protein |
| arTal_v1_Chr2_-_11350045_11350045 | 0.45 |
AT2G26690.2
|
AT2G26690
|
Major facilitator superfamily protein |
| arTal_v1_Chr3_+_9496102_9496102 | 0.45 |
AT3G25950.1
|
AT3G25950
|
TRAM, LAG1 and CLN8 (TLC) lipid-sensing domain containing protein |
| arTal_v1_Chr4_-_7493080_7493080 | 0.45 |
AT4G12730.1
|
FLA2
|
FASCICLIN-like arabinogalactan 2 |
| arTal_v1_Chr2_+_14003128_14003128 | 0.45 |
AT2G32990.1
|
GH9B8
|
glycosyl hydrolase 9B8 |
| arTal_v1_Chr1_-_84864_84946 | 0.44 |
AT1G01190.1
AT1G01190.2 |
CYP78A8
|
cytochrome P450, family 78, subfamily A, polypeptide 8 |
| arTal_v1_Chr2_-_14818211_14818211 | 0.44 |
AT2G35150.1
|
EXL7
|
EXORDIUM like 7 |
| arTal_v1_Chr3_+_5681380_5681380 | 0.44 |
AT3G16670.1
|
AT3G16670
|
Pollen Ole e 1 allergen and extensin family protein |
| arTal_v1_Chr5_-_24990331_24990331 | 0.44 |
AT5G62220.1
|
GT18
|
glycosyltransferase 18 |
| arTal_v1_Chr4_+_11561123_11561201 | 0.43 |
AT4G21760.2
AT4G21760.1 |
BGLU47
|
beta-glucosidase 47 |
| arTal_v1_Chr1_-_5366497_5366497 | 0.43 |
AT1G15580.1
|
IAA5
|
indole-3-acetic acid inducible 5 |
| arTal_v1_Chr1_+_20462940_20462940 | 0.43 |
AT1G54890.1
|
AT1G54890
|
Late embryogenesis abundant (LEA) protein-like protein |
| arTal_v1_Chr2_-_18934044_18934138 | 0.43 |
AT2G46030.1
AT2G46030.2 AT2G46030.3 |
UBC6
|
ubiquitin-conjugating enzyme 6 |
| arTal_v1_Chr2_+_12821569_12821569 | 0.42 |
AT2G30040.1
|
MAPKKK14
|
mitogen-activated protein kinase kinase kinase 14 |
| arTal_v1_Chr1_+_9825914_9825914 | 0.42 |
AT1G28130.2
|
GH3.17
|
Auxin-responsive GH3 family protein |
| arTal_v1_Chr2_-_18933544_18933544 | 0.42 |
AT2G46030.5
AT2G46030.4 |
UBC6
|
ubiquitin-conjugating enzyme 6 |
| arTal_v1_Chr2_-_19617681_19617681 | 0.42 |
AT2G47930.1
|
AGP26
|
arabinogalactan protein 26 |
| arTal_v1_Chr4_+_6869863_6869863 | 0.41 |
AT4G11290.1
|
AT4G11290
|
Peroxidase superfamily protein |
| arTal_v1_Chr2_-_8525238_8525238 | 0.41 |
AT2G19780.1
|
AT2G19780
|
Leucine-rich repeat (LRR) family protein |
| arTal_v1_Chr5_-_22560461_22560541 | 0.41 |
AT5G55730.2
AT5G55730.1 |
FLA1
|
FASCICLIN-like arabinogalactan 1 |
| arTal_v1_Chr4_+_8538586_8538586 | 0.41 |
AT4G14930.2
AT4G14930.1 |
AT4G14930
|
Survival protein SurE-like phosphatase/nucleotidase |
| arTal_v1_Chr1_+_23082036_23082036 | 0.41 |
AT1G62380.1
|
ACO2
|
ACC oxidase 2 |
| arTal_v1_Chr2_-_11968712_11968712 | 0.40 |
AT2G28085.1
|
AT2G28085
|
SAUR-like auxin-responsive protein family |
| arTal_v1_Chr1_-_1647147_1647147 | 0.40 |
AT1G05560.1
|
UGT75B1
|
UDP-glucosyltransferase 75B1 |
| arTal_v1_Chr5_-_19939797_19939797 | 0.40 |
AT5G49170.1
|
AT5G49170
|
hypothetical protein |
| arTal_v1_Chr1_-_4259300_4259300 | 0.40 |
AT1G12480.1
|
OZS1
|
C4-dicarboxylate transporter/malic acid transport protein |
| arTal_v1_Chr4_+_6100714_6100714 | 0.40 |
AT4G09650.1
|
ATPD
|
F-type H+-transporting ATPase subunit delta |
| arTal_v1_Chr4_+_8470179_8470300 | 0.40 |
AT4G14750.2
AT4G14750.3 AT4G14750.1 |
IQD19
|
IQ-domain 19 |
| arTal_v1_Chr1_-_1647435_1647435 | 0.40 |
AT1G05560.2
|
UGT75B1
|
UDP-glucosyltransferase 75B1 |
| arTal_v1_Chr1_+_9067039_9067039 | 0.39 |
AT1G26210.1
|
SOFL1
|
SOB five-like 1 |
| arTal_v1_Chr1_+_21241579_21241580 | 0.39 |
AT1G56670.1
AT1G56670.2 |
AT1G56670
|
GDSL-like Lipase/Acylhydrolase superfamily protein |
| arTal_v1_Chr5_+_23734273_23734273 | 0.39 |
AT5G58770.1
|
cPT4
|
Undecaprenyl pyrophosphate synthetase family protein |
| arTal_v1_Chr1_-_30352208_30352208 | 0.39 |
AT1G80760.1
|
NIP6%3B1
|
NOD26-like intrinsic protein 6;1 |
| arTal_v1_Chr3_+_5426987_5426987 | 0.39 |
AT3G15990.1
|
SULTR3%3B4
|
sulfate transporter 3;4 |
| arTal_v1_Chr3_+_17520958_17521029 | 0.39 |
AT3G47540.1
AT3G47540.2 |
AT3G47540
|
Chitinase family protein |
| arTal_v1_Chr1_+_23144385_23144385 | 0.39 |
AT1G62520.1
|
AT1G62520
|
sulfated surface-like glycoprotein |
| arTal_v1_Chr2_-_8447355_8447355 | 0.38 |
AT2G19500.1
|
CKX2
|
cytokinin oxidase 2 |
| arTal_v1_Chr5_+_25016860_25016860 | 0.38 |
AT5G62280.1
|
AT5G62280
|
DUF1442 family protein (DUF1442) |
| arTal_v1_Chr2_+_15106940_15106940 | 0.38 |
AT2G35960.1
|
NHL12
|
NDR1/HIN1-like 12 |
| arTal_v1_Chr5_+_24667873_24667873 | 0.38 |
AT5G61350.1
|
AT5G61350
|
Protein kinase superfamily protein |
| arTal_v1_Chr2_+_17507343_17507343 | 0.38 |
AT2G41940.1
|
ZFP8
|
zinc finger protein 8 |
| arTal_v1_Chr3_-_8085669_8085669 | 0.38 |
AT3G22840.1
|
ELIP1
|
Chlorophyll A-B binding family protein |
| arTal_v1_Chr1_+_19070798_19070798 | 0.38 |
AT1G51440.1
|
AT1G51440
|
alpha/beta-Hydrolases superfamily protein |
| arTal_v1_Chr5_-_990630_990630 | 0.37 |
AT5G03760.1
|
ATCSLA09
|
Nucleotide-diphospho-sugar transferases superfamily protein |
| arTal_v1_Chr3_+_5471735_5471735 | 0.37 |
AT3G16150.1
|
ASPGB1
|
N-terminal nucleophile aminohydrolases (Ntn hydrolases) superfamily protein |
| arTal_v1_Chr5_-_1348857_1348895 | 0.37 |
AT5G04680.3
AT5G04680.2 AT5G04680.1 AT5G04680.4 |
AT5G04680
|
Ankyrin repeat family protein |
| arTal_v1_Chr1_+_17766738_17766738 | 0.37 |
AT1G48100.1
|
AT1G48100
|
Pectin lyase-like superfamily protein |
| arTal_v1_Chr5_+_735867_735867 | 0.37 |
AT5G03130.1
|
AT5G03130
|
hypothetical protein |
| arTal_v1_Chr3_+_12104312_12104340 | 0.37 |
AT3G30460.2
AT3G30460.1 |
AT3G30460
|
RING/U-box superfamily protein |
| arTal_v1_Chr5_+_4805846_4805846 | 0.36 |
AT5G14860.1
|
AT5G14860
|
UDP-Glycosyltransferase superfamily protein |
| arTal_v1_Chr3_-_19595834_19595834 | 0.36 |
AT3G52870.1
|
AT3G52870
|
IQ calmodulin-binding motif family protein |
| arTal_v1_Chr5_+_4315759_4315759 | 0.36 |
AT5G13460.1
|
IQD11
|
IQ-domain 11 |
| arTal_v1_Chr5_-_17185032_17185032 | 0.36 |
AT5G42860.1
|
AT5G42860
|
late embryogenesis abundant protein, group 2 |
| arTal_v1_Chr4_-_8870801_8870979 | 0.36 |
AT4G15530.7
AT4G15530.6 AT4G15530.5 AT4G15530.3 AT4G15530.4 AT4G15530.1 |
PPDK
|
pyruvate orthophosphate dikinase |
| arTal_v1_Chr3_-_5845220_5845220 | 0.36 |
AT3G17130.1
|
AT3G17130
|
Plant invertase/pectin methylesterase inhibitor superfamily protein |
| arTal_v1_Chr5_-_25898171_25898171 | 0.35 |
AT5G64770.1
|
RGF9
|
root meristem growth factor |
| arTal_v1_Chr1_-_28533624_28533694 | 0.35 |
AT1G76020.2
AT1G76020.3 AT1G76020.1 |
AT1G76020
|
Thioredoxin superfamily protein |
| arTal_v1_Chr1_+_6927736_6927736 | 0.34 |
AT1G19960.1
|
AT1G19960
|
transcription factor |
| arTal_v1_Chr3_-_193537_193537 | 0.34 |
AT3G01490.2
|
AT3G01490
|
Protein kinase superfamily protein |
| arTal_v1_Chr3_-_193721_193721 | 0.34 |
AT3G01490.1
|
AT3G01490
|
Protein kinase superfamily protein |
| arTal_v1_Chr1_-_6319427_6319427 | 0.33 |
AT1G18360.1
|
AT1G18360
|
alpha/beta-Hydrolases superfamily protein |
| arTal_v1_Chr5_+_25891449_25891449 | 0.33 |
AT5G64750.1
|
ABR1
|
Integrase-type DNA-binding superfamily protein |
| arTal_v1_Chr5_-_6842946_6842946 | 0.33 |
AT5G20270.1
|
HHP1
|
heptahelical transmembrane protein1 |
| arTal_v1_Chr4_-_17606924_17607050 | 0.33 |
AT4G37450.1
AT4G37450.2 |
AGP18
|
arabinogalactan protein 18 |
| arTal_v1_Chr2_+_16869189_16869334 | 0.33 |
AT2G40400.1
AT2G40400.2 AT2G40400.3 |
AT2G40400
|
DUF399 family protein, putative (DUF399 and DUF3411) |
| arTal_v1_Chr1_-_27646743_27646743 | 0.33 |
AT1G73540.1
|
NUDT21
|
nudix hydrolase homolog 21 |
| arTal_v1_Chr2_+_15335284_15335284 | 0.33 |
AT2G36570.1
|
AT2G36570
|
Leucine-rich repeat protein kinase family protein |
| arTal_v1_Chr1_-_2143977_2143977 | 0.32 |
AT1G06980.1
|
AT1G06980
|
6,7-dimethyl-8-ribityllumazine synthase |
| arTal_v1_Chr3_+_4810888_4810888 | 0.32 |
AT3G14395.1
|
AT3G14395
|
hypothetical protein |
| arTal_v1_Chr3_+_14905230_14905230 | 0.31 |
AT3G42800.1
|
AT3G42800
|
AF-like protein |
| arTal_v1_Chr2_-_18744322_18744322 | 0.31 |
AT2G45470.1
|
FLA8
|
FASCICLIN-like arabinogalactan protein 8 |
| arTal_v1_Chr5_+_20371798_20371798 | 0.31 |
AT5G50100.1
|
AT5G50100
|
Putative thiol-disulfide oxidoreductase DCC |
| arTal_v1_Chr4_-_9497313_9497313 | 0.31 |
AT4G16880.1
|
AT4G16880
|
Leucine-rich repeat (LRR) family protein |
| arTal_v1_Chr5_+_309374_309434 | 0.31 |
AT5G01810.1
AT5G01810.2 AT5G01810.3 |
CIPK15
|
CBL-interacting protein kinase 15 |
| arTal_v1_Chr1_+_29214220_29214220 | 0.30 |
AT1G77730.1
|
AT1G77730
|
Pleckstrin homology (PH) domain superfamily protein |
| arTal_v1_Chr4_+_8937358_8937358 | 0.30 |
AT4G15700.1
|
AT4G15700
|
Thioredoxin superfamily protein |
| arTal_v1_Chr2_-_9360664_9360664 | 0.30 |
AT2G21990.1
|
AT2G21990
|
MIZU-KUSSEI-like protein (Protein of unknown function, DUF617) |
| arTal_v1_Chr3_-_19442427_19442427 | 0.30 |
AT3G52450.1
|
PUB22
|
plant U-box 22 |
| arTal_v1_Chr2_-_15725022_15725062 | 0.30 |
AT2G37450.2
AT2G37450.3 AT2G37450.1 |
UMAMIT13
|
nodulin MtN21 /EamA-like transporter family protein |
| arTal_v1_Chr1_+_29782273_29782273 | 0.30 |
AT1G79170.1
|
AT1G79170
|
transmembrane protein |
| arTal_v1_Chr1_+_28472357_28472357 | 0.29 |
AT1G75830.1
|
LCR67
|
low-molecular-weight cysteine-rich 67 |
| arTal_v1_Chr3_+_10831162_10831162 | 0.29 |
AT3G28830.1
|
AT3G28830
|
mucin-like protein, putative (DUF1216) |
| arTal_v1_Chr1_-_28549586_28549586 | 0.29 |
AT1G76080.1
|
CDSP32
|
chloroplastic drought-induced stress protein of 32 kD |
| arTal_v1_Chr1_+_20098522_20098522 | 0.29 |
AT1G53830.1
|
PME2
|
pectin methylesterase 2 |
| arTal_v1_Chr1_+_25746697_25746697 | 0.29 |
AT1G68570.1
|
AT1G68570
|
Major facilitator superfamily protein |
| arTal_v1_Chr3_-_18834834_18834834 | 0.29 |
AT3G50685.1
|
AT3G50685
|
anti-muellerian hormone type-2 receptor |
| arTal_v1_Chr5_+_16893849_16893849 | 0.29 |
AT5G42250.1
|
AT5G42250
|
Zinc-binding alcohol dehydrogenase family protein |
| arTal_v1_Chr1_-_8082875_8082882 | 0.29 |
AT1G22850.2
AT1G22850.1 |
AT1G22850
|
SNARE associated Golgi protein family |
| arTal_v1_Chr4_-_14002069_14002124 | 0.29 |
AT4G28250.2
AT4G28250.3 AT4G28250.4 AT4G28250.1 |
EXPB3
|
expansin B3 |
| arTal_v1_Chr1_+_28032562_28032562 | 0.29 |
AT1G74640.1
|
AT1G74640
|
alpha/beta-Hydrolases superfamily protein |
| arTal_v1_Chr4_-_12992585_12992585 | 0.29 |
AT4G25420.2
AT4G25420.1 |
GA20OX1
|
2-oxoglutarate (2OG) and Fe(II)-dependent oxygenase superfamily protein |
| arTal_v1_Chr4_+_11309879_11309879 | 0.29 |
AT4G21213.1
|
AT4G21213
|
hypothetical protein |
| arTal_v1_Chr4_-_13917500_13917500 | 0.29 |
AT4G27960.2
AT4G27960.1 |
UBC9
|
ubiquitin conjugating enzyme 9 |
| arTal_v1_Chr1_-_17015497_17015520 | 0.29 |
AT1G45010.2
AT1G45010.3 AT1G45010.4 AT1G45010.1 |
AT1G45010
|
TRAM, LAG1 and CLN8 (TLC) lipid-sensing domain containing protein |
| arTal_v1_Chr4_+_14026577_14026577 | 0.28 |
AT4G28350.1
|
AT4G28350
|
Concanavalin A-like lectin protein kinase family protein |
| arTal_v1_Chr1_+_2032338_2032338 | 0.28 |
AT1G06640.3
AT1G06640.2 |
AT1G06640
|
2-oxoglutarate (2OG) and Fe(II)-dependent oxygenase superfamily protein |
| arTal_v1_Chr5_+_16468327_16468344 | 0.28 |
AT5G41140.1
AT5G41140.2 |
AT5G41140
|
Myosin heavy chain-related protein |
| arTal_v1_Chr2_-_11095542_11095542 | 0.28 |
AT2G26040.1
|
PYL2
|
PYR1-like 2 |
| arTal_v1_Chr3_-_3108266_3108385 | 0.28 |
AT3G10080.1
AT3G10080.2 |
AT3G10080
|
RmlC-like cupins superfamily protein |
| arTal_v1_Chr2_+_14288323_14288323 | 0.28 |
AT2G33775.1
|
RALFL19
|
ralf-like 19 |
| arTal_v1_Chr1_+_25746994_25746994 | 0.28 |
AT1G68570.2
|
AT1G68570
|
Major facilitator superfamily protein |
| arTal_v1_Chr4_-_16703486_16703504 | 0.28 |
AT4G35090.3
AT4G35090.1 |
CAT2
|
catalase 2 |
| arTal_v1_Chr4_-_16703286_16703286 | 0.28 |
AT4G35090.2
|
CAT2
|
catalase 2 |
| arTal_v1_Chr5_+_4488476_4488476 | 0.28 |
AT5G13930.1
|
TT4
|
Chalcone and stilbene synthase family protein |
| arTal_v1_Chr4_+_160643_160643 | 0.28 |
AT4G00360.1
|
CYP86A2
|
cytochrome P450, family 86, subfamily A, polypeptide 2 |
| arTal_v1_Chr5_+_20993424_20993493 | 0.28 |
AT5G51670.1
AT5G51670.2 |
AT5G51670
|
hypothetical protein (DUF668) |
| arTal_v1_Chr3_+_22786022_22786022 | 0.28 |
AT3G61580.1
|
SLD1
|
Fatty acid/sphingolipid desaturase |
| arTal_v1_Chr5_+_4817997_4817997 | 0.28 |
AT5G14890.1
|
AT5G14890
|
potassium transporter |
| arTal_v1_Chr5_-_671687_671687 | 0.27 |
AT5G02890.1
|
AT5G02890
|
HXXXD-type acyl-transferase family protein |
| arTal_v1_Chr1_-_29518028_29518028 | 0.27 |
AT1G78450.1
|
AT1G78450
|
SOUL heme-binding family protein |
| arTal_v1_Chr3_-_21285941_21285941 | 0.27 |
AT3G57510.1
|
ADPG1
|
Pectin lyase-like superfamily protein |
| arTal_v1_Chr1_+_3063936_3063936 | 0.27 |
AT1G09490.1
AT1G09490.2 |
AT1G09490
|
NAD(P)-binding Rossmann-fold superfamily protein |
| arTal_v1_Chr1_-_983544_983544 | 0.27 |
AT1G03870.1
|
FLA9
|
FASCICLIN-like arabinoogalactan 9 |
| arTal_v1_Chr2_+_15445294_15445294 | 0.27 |
AT2G36830.1
|
GAMMA-TIP
|
gamma tonoplast intrinsic protein |
| arTal_v1_Chr3_+_10465260_10465317 | 0.27 |
AT3G28130.3
AT3G28130.2 AT3G28130.6 AT3G28130.4 AT3G28130.5 |
UMAMIT44
|
nodulin MtN21 /EamA-like transporter family protein |
| arTal_v1_Chr5_+_2446669_2446669 | 0.26 |
AT5G07690.1
|
MYB29
|
myb domain protein 29 |
| arTal_v1_Chr1_-_24657638_24657703 | 0.26 |
AT1G66200.2
AT1G66200.3 AT1G66200.1 |
GSR2
|
hypothetical protein |
| arTal_v1_Chr2_+_9592956_9592956 | 0.26 |
AT2G22590.1
|
AT2G22590
|
UDP-Glycosyltransferase superfamily protein |
| arTal_v1_Chr2_+_7513128_7513130 | 0.26 |
AT2G17280.2
AT2G17280.1 |
AT2G17280
|
Phosphoglycerate mutase family protein |
| arTal_v1_Chr4_-_8869319_8869319 | 0.26 |
AT4G15530.2
|
PPDK
|
pyruvate orthophosphate dikinase |
| arTal_v1_Chr5_+_1919080_1919179 | 0.26 |
AT5G06290.1
AT5G06290.2 |
2-Cys Prx B
|
2-cysteine peroxiredoxin B |
| arTal_v1_Chr4_+_12362166_12362282 | 0.26 |
AT4G23730.1
AT4G23730.2 |
AT4G23730
|
Galactose mutarotase-like superfamily protein |
| arTal_v1_Chr1_+_12267808_12267808 | 0.26 |
AT1G33811.1
|
AT1G33811
|
GDSL-like Lipase/Acylhydrolase superfamily protein |
| arTal_v1_Chr4_-_9305763_9305845 | 0.26 |
AT4G16515.1
AT4G16515.2 |
RGF6
|
root meristem growth factor |
| arTal_v1_Chr4_+_8984787_8984787 | 0.26 |
AT4G15800.1
|
RALFL33
|
ralf-like 33 |
| arTal_v1_Chr4_-_13398307_13398307 | 0.26 |
AT4G26540.1
|
AT4G26540
|
Leucine-rich repeat receptor-like protein kinase family protein |
| arTal_v1_Chr1_+_5828915_5828915 | 0.26 |
AT1G17050.1
|
SPS2
|
solanesyl diphosphate synthase 2 |
| arTal_v1_Chr5_-_20169923_20169923 | 0.26 |
AT5G49665.1
|
AT5G49665
|
Zinc finger (C3HC4-type RING finger) family protein |
| arTal_v1_Chr1_+_27678313_27678313 | 0.26 |
AT1G73610.1
|
AT1G73610
|
GDSL-like Lipase/Acylhydrolase superfamily protein |
| arTal_v1_Chr1_-_10399873_10399873 | 0.26 |
AT1G29720.1
|
AT1G29720
|
Leucine-rich repeat transmembrane protein kinase |
| arTal_v1_Chr3_-_4698141_4698153 | 0.26 |
AT3G14170.2
AT3G14170.1 |
AT3G14170
|
hypothetical protein (DUF936) |
| arTal_v1_Chr1_+_2031626_2031626 | 0.26 |
AT1G06640.1
|
AT1G06640
|
2-oxoglutarate (2OG) and Fe(II)-dependent oxygenase superfamily protein |
| arTal_v1_Chr3_+_2347186_2347186 | 0.26 |
AT3G07350.1
|
AT3G07350
|
sulfate/thiosulfate import ATP-binding protein, putative (DUF506) |
| arTal_v1_Chr4_+_14010685_14010685 | 0.25 |
AT4G28280.1
AT4G28280.3 AT4G28280.2 |
LLG3
|
LORELEI-LIKE-GPI ANCHORED PROTEIN 3 |
| arTal_v1_Chr1_+_12026936_12026936 | 0.25 |
AT1G33170.1
|
AT1G33170
|
S-adenosyl-L-methionine-dependent methyltransferases superfamily protein |
| arTal_v1_Chr2_-_14175965_14175965 | 0.25 |
AT2G33460.1
|
RIC1
|
ROP-interactive CRIB motif-containing protein 1 |
| arTal_v1_Chr4_+_15819489_15819489 | 0.25 |
AT4G32800.1
|
AT4G32800
|
Integrase-type DNA-binding superfamily protein |
| arTal_v1_Chr2_-_12621231_12621231 | 0.25 |
AT2G29440.1
|
GSTU6
|
glutathione S-transferase tau 6 |
| arTal_v1_Chr3_+_4995426_4995426 | 0.25 |
AT3G14850.2
|
TBL41
|
TRICHOME BIREFRINGENCE-LIKE 41 |
| arTal_v1_Chr4_+_12362484_12362484 | 0.25 |
AT4G23730.3
|
AT4G23730
|
Galactose mutarotase-like superfamily protein |
| arTal_v1_Chr5_+_435168_435168 | 0.25 |
AT5G02190.1
|
PCS1
|
Eukaryotic aspartyl protease family protein |
| arTal_v1_Chr4_-_9920511_9920511 | 0.25 |
AT4G17840.1
|
AT4G17840
|
CAAX protease self-immunity protein |
| arTal_v1_Chr3_+_21948851_21948851 | 0.25 |
AT3G59410.3
|
GCN2
|
protein kinase family protein |
| arTal_v1_Chr2_+_11595076_11595076 | 0.25 |
AT2G27130.1
|
AT2G27130
|
Bifunctional inhibitor/lipid-transfer protein/seed storage 2S albumin superfamily protein |
| arTal_v1_Chr1_+_7588414_7588414 | 0.25 |
AT1G21640.2
|
NADK2
|
NAD kinase 2 |
| arTal_v1_Chr1_+_7588589_7588589 | 0.25 |
AT1G21640.1
|
NADK2
|
NAD kinase 2 |
| arTal_v1_Chr3_-_21100459_21100519 | 0.25 |
AT3G57020.2
AT3G57020.1 |
AT3G57020
|
Calcium-dependent phosphotriesterase superfamily protein |
| arTal_v1_Chr2_+_15053483_15053483 | 0.25 |
AT2G35840.4
AT2G35840.2 AT2G35840.1 |
AT2G35840
|
Sucrose-6F-phosphate phosphohydrolase family protein |
| arTal_v1_Chr2_-_14677398_14677398 | 0.25 |
AT2G34790.1
|
MEE23
|
FAD-binding Berberine family protein |
| arTal_v1_Chr5_+_7778017_7778095 | 0.25 |
AT5G23120.2
AT5G23120.1 |
HCF136
|
photosystem II stability/assembly factor, chloroplast (HCF136) |
| arTal_v1_Chr1_-_26711462_26711587 | 0.25 |
AT1G70830.4
AT1G70830.2 AT1G70830.1 AT1G70830.5 AT1G70830.3 |
MLP28
|
MLP-like protein 28 |
| arTal_v1_Chr3_+_765420_765420 | 0.25 |
AT3G03280.1
|
AT3G03280
|
hypothetical protein |
| arTal_v1_Chr3_-_3275551_3275551 | 0.25 |
AT3G10510.1
|
AT3G10510
|
Galactose oxidase/kelch repeat superfamily protein |
| arTal_v1_Chr1_-_11909049_11909049 | 0.24 |
AT1G32860.1
|
AT1G32860
|
Glycosyl hydrolase superfamily protein |
| arTal_v1_Chr2_+_12776208_12776208 | 0.24 |
AT2G29970.1
|
AT2G29970
|
Double Clp-N motif-containing P-loop nucleoside triphosphate hydrolases superfamily protein |
| arTal_v1_Chr1_+_5058583_5058680 | 0.24 |
AT1G14700.4
AT1G14700.1 AT1G14700.3 AT1G14700.2 |
PAP3
|
purple acid phosphatase 3 |
| arTal_v1_Chr4_-_3065294_3065294 | 0.24 |
AT4G06477.1
|
AT4G06477
|
|
| arTal_v1_Chr1_-_16866787_16866787 | 0.24 |
AT1G44542.1
|
AT1G44542
|
Cyclase family protein |
| arTal_v1_Chr1_+_2642072_2642212 | 0.24 |
AT1G08390.1
AT1G08390.2 |
AT1G08390
|
recQ-mediated instability-like protein |
| arTal_v1_Chr3_-_8589754_8589754 | 0.24 |
AT3G23810.1
|
SAHH2
|
S-adenosyl-l-homocysteine (SAH) hydrolase 2 |
| arTal_v1_Chr5_-_25258704_25258704 | 0.24 |
AT5G62940.1
|
HCA2
|
Dof-type zinc finger DNA-binding family protein |
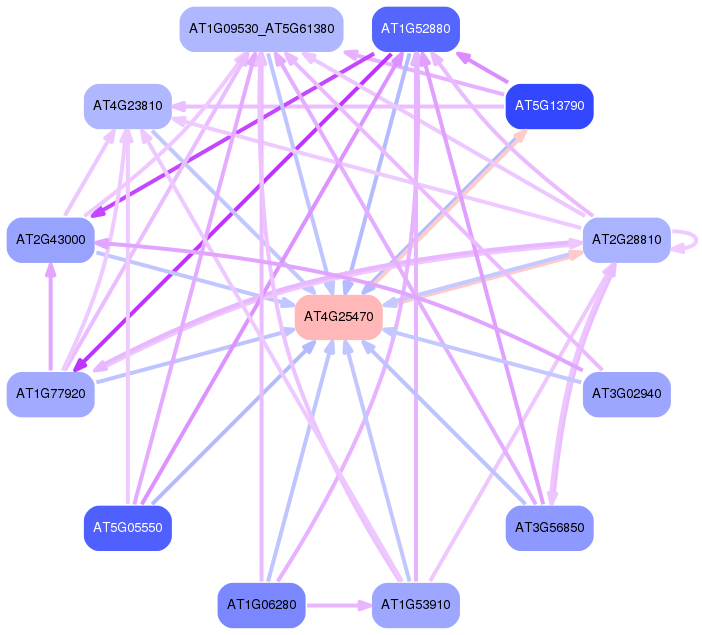
Network of associatons between targets according to the STRING database.

First level regulatory network of AT4G25470
Gene Ontology Analysis
Gene overrepresentation in biological process category:
| Log-likelihood per target | Total log-likelihood | Term | Description |
|---|---|---|---|
| 0.1 | 1.6 | GO:0080144 | amino acid homeostasis(GO:0080144) |
| 0.1 | 0.5 | GO:0006741 | NADP biosynthetic process(GO:0006741) |
| 0.1 | 0.4 | GO:0016540 | protein autoprocessing(GO:0016540) |
| 0.1 | 0.8 | GO:0046482 | para-aminobenzoic acid metabolic process(GO:0046482) |
| 0.1 | 0.4 | GO:0009727 | detection of ethylene stimulus(GO:0009727) |
| 0.1 | 0.4 | GO:0050878 | response to humidity(GO:0009270) regulation of body fluid levels(GO:0050878) multicellular organismal water homeostasis(GO:0050891) |
| 0.1 | 0.3 | GO:0044277 | cell wall modification involved in abscission(GO:0009830) cell wall disassembly(GO:0044277) |
| 0.1 | 0.3 | GO:0015840 | urea transport(GO:0015840) |
| 0.1 | 0.3 | GO:0015965 | diadenosine polyphosphate metabolic process(GO:0015959) diadenosine tetraphosphate metabolic process(GO:0015965) |
| 0.1 | 0.2 | GO:0051639 | actin filament network formation(GO:0051639) |
| 0.1 | 0.3 | GO:2000692 | negative regulation of seed maturation(GO:2000692) |
| 0.1 | 0.4 | GO:0072708 | response to sorbitol(GO:0072708) |
| 0.1 | 0.2 | GO:0045002 | DNA double-strand break processing involved in repair via single-strand annealing(GO:0010792) double-strand break repair via single-strand annealing(GO:0045002) |
| 0.1 | 0.5 | GO:0042447 | cytokinin catabolic process(GO:0009823) hormone catabolic process(GO:0042447) |
| 0.1 | 0.4 | GO:0019408 | dolichol biosynthetic process(GO:0019408) |
| 0.1 | 0.3 | GO:0098740 | pollen tube adhesion(GO:0009865) cell-cell adhesion(GO:0098609) multi organism cell adhesion(GO:0098740) |
| 0.1 | 0.2 | GO:0010269 | response to selenium ion(GO:0010269) |
| 0.1 | 0.4 | GO:0070141 | response to UV-A(GO:0070141) cellular response to UV-A(GO:0071492) |
| 0.1 | 0.4 | GO:0009772 | photosynthetic electron transport in photosystem II(GO:0009772) |
| 0.1 | 1.0 | GO:0016998 | cell wall macromolecule catabolic process(GO:0016998) |
| 0.1 | 0.3 | GO:0010236 | plastoquinone biosynthetic process(GO:0010236) |
| 0.1 | 0.2 | GO:0006097 | glyoxylate cycle(GO:0006097) |
| 0.1 | 0.2 | GO:0006023 | aminoglycan biosynthetic process(GO:0006023) glycosaminoglycan biosynthetic process(GO:0006024) UDP-glucuronate biosynthetic process(GO:0006065) glycosaminoglycan metabolic process(GO:0030203) |
| 0.1 | 0.5 | GO:0016121 | carotene catabolic process(GO:0016121) terpene catabolic process(GO:0046247) |
| 0.1 | 0.1 | GO:0071836 | nectar secretion(GO:0071836) |
| 0.1 | 0.2 | GO:0099636 | cytoplasmic streaming(GO:0099636) |
| 0.0 | 0.2 | GO:0019586 | uronic acid metabolic process(GO:0006063) galacturonate metabolic process(GO:0019586) |
| 0.0 | 0.3 | GO:1900036 | positive regulation of cellular response to heat(GO:1900036) |
| 0.0 | 0.3 | GO:0010067 | procambium histogenesis(GO:0010067) |
| 0.0 | 0.2 | GO:0015714 | phosphoenolpyruvate transport(GO:0015714) |
| 0.0 | 0.4 | GO:0031930 | mitochondria-nucleus signaling pathway(GO:0031930) |
| 0.0 | 0.1 | GO:0010447 | response to acidic pH(GO:0010447) |
| 0.0 | 0.1 | GO:0042817 | pyridoxal metabolic process(GO:0042817) |
| 0.0 | 0.2 | GO:0030322 | stabilization of membrane potential(GO:0030322) |
| 0.0 | 0.2 | GO:0010606 | positive regulation of cytoplasmic mRNA processing body assembly(GO:0010606) |
| 0.0 | 0.4 | GO:0009554 | megasporogenesis(GO:0009554) |
| 0.0 | 0.2 | GO:0006809 | nitric oxide biosynthetic process(GO:0006809) |
| 0.0 | 0.1 | GO:0046203 | spermidine catabolic process(GO:0046203) |
| 0.0 | 0.1 | GO:0009805 | coumarin biosynthetic process(GO:0009805) |
| 0.0 | 0.2 | GO:0010581 | regulation of starch biosynthetic process(GO:0010581) |
| 0.0 | 0.2 | GO:0042759 | long-chain fatty acid biosynthetic process(GO:0042759) |
| 0.0 | 0.2 | GO:0006013 | mannose metabolic process(GO:0006013) |
| 0.0 | 0.2 | GO:0010086 | embryonic root morphogenesis(GO:0010086) |
| 0.0 | 0.2 | GO:0010253 | UDP-rhamnose biosynthetic process(GO:0010253) UDP-rhamnose metabolic process(GO:0033478) |
| 0.0 | 0.3 | GO:0006542 | glutamine biosynthetic process(GO:0006542) |
| 0.0 | 0.2 | GO:0006228 | UTP biosynthetic process(GO:0006228) UTP metabolic process(GO:0046051) |
| 0.0 | 0.2 | GO:0019323 | pentose catabolic process(GO:0019323) |
| 0.0 | 0.1 | GO:0046102 | inosine catabolic process(GO:0006148) inosine metabolic process(GO:0046102) |
| 0.0 | 0.1 | GO:0010433 | nectary development(GO:0010254) bract morphogenesis(GO:0010433) bract formation(GO:0010434) |
| 0.0 | 0.2 | GO:0045038 | protein import into chloroplast thylakoid membrane(GO:0045038) |
| 0.0 | 0.1 | GO:0035864 | response to potassium ion(GO:0035864) |
| 0.0 | 0.9 | GO:0008284 | positive regulation of cell proliferation(GO:0008284) |
| 0.0 | 0.3 | GO:0046294 | formaldehyde catabolic process(GO:0046294) |
| 0.0 | 0.1 | GO:0080003 | thalianol metabolic process(GO:0080003) |
| 0.0 | 0.1 | GO:0071569 | protein ufmylation(GO:0071569) |
| 0.0 | 0.2 | GO:0002679 | respiratory burst involved in defense response(GO:0002679) respiratory burst(GO:0045730) |
| 0.0 | 0.1 | GO:0006651 | diacylglycerol biosynthetic process(GO:0006651) |
| 0.0 | 1.1 | GO:0010025 | wax biosynthetic process(GO:0010025) |
| 0.0 | 0.1 | GO:0019336 | phenol-containing compound catabolic process(GO:0019336) |
| 0.0 | 1.8 | GO:0010411 | xyloglucan metabolic process(GO:0010411) |
| 0.0 | 0.4 | GO:0006538 | glutamate catabolic process(GO:0006538) |
| 0.0 | 0.3 | GO:0043155 | photoinhibition(GO:0010205) negative regulation of photosynthesis, light reaction(GO:0043155) |
| 0.0 | 0.1 | GO:0015802 | basic amino acid transport(GO:0015802) |
| 0.0 | 0.4 | GO:0010274 | hydrotropism(GO:0010274) |
| 0.0 | 0.4 | GO:0035999 | tetrahydrofolate interconversion(GO:0035999) |
| 0.0 | 1.4 | GO:0009788 | negative regulation of abscisic acid-activated signaling pathway(GO:0009788) |
| 0.0 | 0.2 | GO:0009954 | proximal/distal pattern formation(GO:0009954) |
| 0.0 | 0.1 | GO:0015824 | proline transport(GO:0015824) |
| 0.0 | 0.1 | GO:0035494 | SNARE complex disassembly(GO:0035494) |
| 0.0 | 0.2 | GO:0080187 | floral organ senescence(GO:0080187) |
| 0.0 | 0.2 | GO:0010206 | photosystem II repair(GO:0010206) |
| 0.0 | 0.2 | GO:0046466 | membrane lipid catabolic process(GO:0046466) |
| 0.0 | 0.2 | GO:0009961 | response to 1-aminocyclopropane-1-carboxylic acid(GO:0009961) |
| 0.0 | 0.1 | GO:0000256 | allantoin catabolic process(GO:0000256) |
| 0.0 | 0.5 | GO:0048015 | phosphatidylinositol-mediated signaling(GO:0048015) |
| 0.0 | 0.1 | GO:0055073 | cadmium ion homeostasis(GO:0055073) |
| 0.0 | 0.4 | GO:0005986 | sucrose biosynthetic process(GO:0005986) |
| 0.0 | 0.1 | GO:0031506 | cell wall mannoprotein biosynthetic process(GO:0000032) mannoprotein metabolic process(GO:0006056) mannoprotein biosynthetic process(GO:0006057) cell wall glycoprotein biosynthetic process(GO:0031506) response to cobalt ion(GO:0032025) |
| 0.0 | 0.3 | GO:0016925 | protein sumoylation(GO:0016925) |
| 0.0 | 0.2 | GO:0030104 | water homeostasis(GO:0030104) |
| 0.0 | 0.2 | GO:0045116 | protein neddylation(GO:0045116) |
| 0.0 | 0.8 | GO:0010252 | auxin homeostasis(GO:0010252) |
| 0.0 | 0.3 | GO:0048572 | short-day photoperiodism(GO:0048572) short-day photoperiodism, flowering(GO:0048575) |
| 0.0 | 1.9 | GO:0045490 | pectin catabolic process(GO:0045490) |
| 0.0 | 0.3 | GO:0005987 | sucrose catabolic process(GO:0005987) |
| 0.0 | 0.5 | GO:0006826 | iron ion transport(GO:0006826) |
| 0.0 | 0.2 | GO:0070814 | hydrogen sulfide biosynthetic process(GO:0070814) |
| 0.0 | 1.3 | GO:0007267 | cell-cell signaling(GO:0007267) |
| 0.0 | 0.1 | GO:0010500 | transmitting tissue development(GO:0010500) |
| 0.0 | 0.2 | GO:0072659 | protein localization to plasma membrane(GO:0072659) |
| 0.0 | 0.5 | GO:0042744 | hydrogen peroxide catabolic process(GO:0042744) |
| 0.0 | 0.1 | GO:0042989 | sequestering of actin monomers(GO:0042989) |
| 0.0 | 0.3 | GO:0048564 | photosystem I assembly(GO:0048564) |
| 0.0 | 0.0 | GO:0070813 | hydrogen sulfide metabolic process(GO:0070813) |
| 0.0 | 0.1 | GO:2000601 | regulation of Arp2/3 complex-mediated actin nucleation(GO:0034315) regulation of actin nucleation(GO:0051125) positive regulation of actin nucleation(GO:0051127) positive regulation of Arp2/3 complex-mediated actin nucleation(GO:2000601) |
| 0.0 | 0.7 | GO:0009828 | plant-type cell wall loosening(GO:0009828) |
| 0.0 | 0.3 | GO:0051762 | sesquiterpene biosynthetic process(GO:0051762) |
| 0.0 | 0.2 | GO:0010358 | leaf shaping(GO:0010358) |
| 0.0 | 0.1 | GO:1990570 | GDP-mannose transport(GO:0015784) purine nucleotide-sugar transmembrane transport(GO:0090480) GDP-mannose transmembrane transport(GO:1990570) |
| 0.0 | 0.1 | GO:0010190 | cytochrome b6f complex assembly(GO:0010190) |
| 0.0 | 0.1 | GO:0006751 | glutathione catabolic process(GO:0006751) |
| 0.0 | 0.1 | GO:0006449 | regulation of translational termination(GO:0006449) |
| 0.0 | 0.4 | GO:0009395 | phospholipid catabolic process(GO:0009395) |
| 0.0 | 0.1 | GO:0010424 | DNA methylation on cytosine within a CG sequence(GO:0010424) |
| 0.0 | 0.6 | GO:0009690 | cytokinin metabolic process(GO:0009690) |
| 0.0 | 0.1 | GO:0034724 | DNA replication-independent nucleosome organization(GO:0034724) |
| 0.0 | 0.0 | GO:2000082 | regulation of L-ascorbic acid biosynthetic process(GO:2000082) |
| 0.0 | 0.2 | GO:0080163 | regulation of protein serine/threonine phosphatase activity(GO:0080163) |
| 0.0 | 0.0 | GO:0015904 | tetracycline transport(GO:0015904) antibiotic transport(GO:0042891) |
| 0.0 | 0.2 | GO:0070940 | dephosphorylation of RNA polymerase II C-terminal domain(GO:0070940) |
| 0.0 | 0.2 | GO:0015976 | carbon utilization(GO:0015976) |
| 0.0 | 0.1 | GO:0006120 | mitochondrial electron transport, NADH to ubiquinone(GO:0006120) |
| 0.0 | 0.0 | GO:0071486 | cellular response to high light intensity(GO:0071486) |
| 0.0 | 0.2 | GO:0007143 | female meiotic division(GO:0007143) |
| 0.0 | 0.3 | GO:0031540 | regulation of anthocyanin biosynthetic process(GO:0031540) |
| 0.0 | 0.2 | GO:0006636 | unsaturated fatty acid biosynthetic process(GO:0006636) |
| 0.0 | 0.1 | GO:0006655 | phosphatidylglycerol biosynthetic process(GO:0006655) phosphatidylglycerol metabolic process(GO:0046471) |
| 0.0 | 0.1 | GO:0072583 | clathrin-mediated endocytosis(GO:0072583) |
| 0.0 | 0.1 | GO:1900367 | positive regulation of defense response to insect(GO:1900367) |
| 0.0 | 0.0 | GO:0048451 | petal formation(GO:0048451) |
| 0.0 | 0.1 | GO:0051865 | protein autoubiquitination(GO:0051865) |
| 0.0 | 0.1 | GO:0071479 | cellular response to ionizing radiation(GO:0071479) |
| 0.0 | 0.1 | GO:0032876 | negative regulation of DNA endoreduplication(GO:0032876) |
| 0.0 | 0.1 | GO:0017182 | peptidyl-diphthamide metabolic process(GO:0017182) peptidyl-diphthamide biosynthetic process from peptidyl-histidine(GO:0017183) peptidyl-histidine modification(GO:0018202) |
| 0.0 | 0.1 | GO:0045836 | positive regulation of meiotic nuclear division(GO:0045836) |
| 0.0 | 0.2 | GO:0060688 | regulation of morphogenesis of a branching structure(GO:0060688) regulation of secondary shoot formation(GO:2000032) |
| 0.0 | 0.1 | GO:0071451 | removal of superoxide radicals(GO:0019430) cellular response to oxygen radical(GO:0071450) cellular response to superoxide(GO:0071451) |
| 0.0 | 1.0 | GO:0000209 | protein polyubiquitination(GO:0000209) |
| 0.0 | 0.0 | GO:1902457 | negative regulation of stomatal opening(GO:1902457) |
| 0.0 | 0.2 | GO:0010215 | cellulose microfibril organization(GO:0010215) |
| 0.0 | 0.1 | GO:0070828 | heterochromatin organization(GO:0070828) |
| 0.0 | 0.1 | GO:1990019 | protein storage vacuole organization(GO:1990019) |
| 0.0 | 0.1 | GO:0031333 | negative regulation of protein complex assembly(GO:0031333) |
| 0.0 | 0.1 | GO:0090158 | endoplasmic reticulum membrane organization(GO:0090158) |
| 0.0 | 0.1 | GO:0006569 | tryptophan catabolic process(GO:0006569) indolalkylamine catabolic process(GO:0046218) |
| 0.0 | 0.1 | GO:0010158 | abaxial cell fate specification(GO:0010158) |
| 0.0 | 0.1 | GO:0018344 | protein geranylgeranylation(GO:0018344) |
| 0.0 | 0.0 | GO:0030002 | cellular anion homeostasis(GO:0030002) |
| 0.0 | 0.4 | GO:0000741 | karyogamy(GO:0000741) polar nucleus fusion(GO:0010197) |
| 0.0 | 0.6 | GO:0045488 | pectin metabolic process(GO:0045488) |
| 0.0 | 0.3 | GO:0050826 | response to freezing(GO:0050826) |
| 0.0 | 0.2 | GO:1905177 | tracheary element differentiation(GO:1905177) |
| 0.0 | 0.1 | GO:0090506 | axillary shoot meristem initiation(GO:0090506) |
| 0.0 | 0.2 | GO:2000033 | regulation of seed dormancy process(GO:2000033) |
| 0.0 | 0.1 | GO:0010071 | root meristem specification(GO:0010071) |
Gene overrepresentation in cellular component category:
| Log-likelihood per target | Total log-likelihood | Term | Description |
|---|---|---|---|
| 0.1 | 0.2 | GO:0032432 | actin filament bundle(GO:0032432) |
| 0.1 | 0.2 | GO:0070382 | exocytic vesicle(GO:0070382) |
| 0.0 | 0.1 | GO:0030896 | checkpoint clamp complex(GO:0030896) |
| 0.0 | 2.0 | GO:0010319 | stromule(GO:0010319) |
| 0.0 | 0.1 | GO:0035101 | FACT complex(GO:0035101) |
| 0.0 | 0.0 | GO:0016328 | lateral plasma membrane(GO:0016328) |
| 0.0 | 0.2 | GO:0009897 | external side of plasma membrane(GO:0009897) |
| 0.0 | 0.4 | GO:0005788 | endoplasmic reticulum lumen(GO:0005788) |
| 0.0 | 0.2 | GO:0009533 | chloroplast stromal thylakoid(GO:0009533) |
| 0.0 | 0.1 | GO:0005782 | peroxisomal matrix(GO:0005782) microbody lumen(GO:0031907) |
| 0.0 | 0.2 | GO:1990124 | messenger ribonucleoprotein complex(GO:1990124) |
| 0.0 | 0.1 | GO:0044614 | nuclear pore cytoplasmic filaments(GO:0044614) |
| 0.0 | 0.6 | GO:0016324 | apical plasma membrane(GO:0016324) |
| 0.0 | 0.2 | GO:0035861 | site of double-strand break(GO:0035861) |
| 0.0 | 0.5 | GO:0000792 | heterochromatin(GO:0000792) |
| 0.0 | 0.3 | GO:0000326 | storage vacuole(GO:0000322) protein storage vacuole(GO:0000326) |
| 0.0 | 0.5 | GO:0009654 | photosystem II oxygen evolving complex(GO:0009654) |
| 0.0 | 0.1 | GO:0043673 | pollen wall(GO:0043667) exine(GO:0043668) sexine(GO:0043673) columella(GO:0043674) |
| 0.0 | 0.2 | GO:1902562 | NuA4 histone acetyltransferase complex(GO:0035267) H4/H2A histone acetyltransferase complex(GO:0043189) H4 histone acetyltransferase complex(GO:1902562) |
| 0.0 | 4.4 | GO:0048046 | apoplast(GO:0048046) |
| 0.0 | 0.4 | GO:0031978 | chloroplast thylakoid lumen(GO:0009543) plastid thylakoid lumen(GO:0031978) |
| 0.0 | 0.1 | GO:0048226 | Casparian strip(GO:0048226) |
| 0.0 | 0.1 | GO:0031209 | SCAR complex(GO:0031209) |
| 0.0 | 0.1 | GO:0005968 | Rab-protein geranylgeranyltransferase complex(GO:0005968) |
| 0.0 | 0.1 | GO:0048476 | Holliday junction resolvase complex(GO:0048476) |
Gene overrepresentation in molecular function category:
| Log-likelihood per target | Total log-likelihood | Term | Description |
|---|---|---|---|
| 0.2 | 0.8 | GO:0080002 | indole-3-acetate beta-glucosyltransferase activity(GO:0047215) UDP-glucose:4-aminobenzoate acylglucosyltransferase activity(GO:0080002) |
| 0.1 | 1.0 | GO:0010279 | indole-3-acetic acid amido synthetase activity(GO:0010279) |
| 0.1 | 0.4 | GO:0051669 | levanase activity(GO:0031219) fructan beta-fructosidase activity(GO:0051669) |
| 0.1 | 0.4 | GO:0008798 | beta-aspartyl-peptidase activity(GO:0008798) |
| 0.1 | 0.8 | GO:0008083 | growth factor activity(GO:0008083) |
| 0.1 | 0.3 | GO:0044540 | L-cystine L-cysteine-lyase (deaminating)(GO:0044540) |
| 0.1 | 0.6 | GO:0016781 | phosphotransferase activity, paired acceptors(GO:0016781) |
| 0.1 | 0.3 | GO:0015204 | urea transmembrane transporter activity(GO:0015204) |
| 0.1 | 0.4 | GO:0047780 | citrate dehydratase activity(GO:0047780) |
| 0.1 | 0.3 | GO:0016656 | monodehydroascorbate reductase (NADH) activity(GO:0016656) |
| 0.1 | 0.2 | GO:0070336 | Y-form DNA binding(GO:0000403) flap-structured DNA binding(GO:0070336) |
| 0.1 | 0.4 | GO:0045547 | dehydrodolichyl diphosphate synthase activity(GO:0045547) |
| 0.1 | 0.3 | GO:0080103 | 4-methylthiopropyl glucosinolate S-oxygenase activity(GO:0080103) |
| 0.1 | 0.2 | GO:0016661 | oxidoreductase activity, acting on other nitrogenous compounds as donors(GO:0016661) |
| 0.1 | 0.4 | GO:0008964 | phosphoenolpyruvate carboxylase activity(GO:0008964) |
| 0.1 | 0.2 | GO:0019788 | NEDD8 transferase activity(GO:0019788) |
| 0.1 | 0.3 | GO:0034432 | bis(5'-adenosyl)-pentaphosphatase activity(GO:0034432) |
| 0.1 | 0.5 | GO:0019139 | cytokinin dehydrogenase activity(GO:0019139) |
| 0.1 | 0.5 | GO:0045549 | 9-cis-epoxycarotenoid dioxygenase activity(GO:0045549) |
| 0.1 | 0.3 | GO:0052924 | trans-octaprenyltranstransferase activity(GO:0050347) all-trans-nonaprenyl-diphosphate synthase (geranylgeranyl-diphosphate specific) activity(GO:0052924) |
| 0.1 | 0.6 | GO:0004096 | catalase activity(GO:0004096) |
| 0.1 | 2.0 | GO:0016762 | xyloglucan:xyloglucosyl transferase activity(GO:0016762) |
| 0.1 | 0.2 | GO:0004719 | protein-L-isoaspartate (D-aspartate) O-methyltransferase activity(GO:0004719) |
| 0.1 | 0.2 | GO:0004750 | ribulose-phosphate 3-epimerase activity(GO:0004750) |
| 0.1 | 0.5 | GO:0050307 | sucrose-phosphate phosphatase activity(GO:0050307) |
| 0.1 | 0.9 | GO:0004629 | phospholipase C activity(GO:0004629) |
| 0.1 | 0.3 | GO:0045544 | gibberellin 20-oxidase activity(GO:0045544) |
| 0.1 | 0.2 | GO:0045485 | omega-6 fatty acid desaturase activity(GO:0045485) |
| 0.0 | 0.2 | GO:0009885 | transmembrane receptor histidine kinase activity(GO:0009784) transmembrane histidine kinase cytokinin receptor activity(GO:0009885) |
| 0.0 | 0.5 | GO:0047938 | glucose-6-phosphate 1-epimerase activity(GO:0047938) |
| 0.0 | 0.4 | GO:0016646 | oxidoreductase activity, acting on the CH-NH group of donors, NAD or NADP as acceptor(GO:0016646) |
| 0.0 | 0.4 | GO:0046933 | proton-transporting ATP synthase activity, rotational mechanism(GO:0046933) |
| 0.0 | 0.2 | GO:0022842 | leak channel activity(GO:0022840) potassium ion leak channel activity(GO:0022841) narrow pore channel activity(GO:0022842) |
| 0.0 | 0.4 | GO:0004351 | glutamate decarboxylase activity(GO:0004351) |
| 0.0 | 1.2 | GO:0008810 | cellulase activity(GO:0008810) |
| 0.0 | 0.1 | GO:0052901 | spermine:oxygen oxidoreductase (spermidine-forming) activity(GO:0052901) |
| 0.0 | 0.9 | GO:0015179 | L-amino acid transmembrane transporter activity(GO:0015179) |
| 0.0 | 0.1 | GO:0047874 | dolichyldiphosphatase activity(GO:0047874) |
| 0.0 | 0.2 | GO:0003979 | UDP-glucose 6-dehydrogenase activity(GO:0003979) |
| 0.0 | 0.2 | GO:0008430 | selenium binding(GO:0008430) |
| 0.0 | 0.1 | GO:0046409 | p-coumarate 3-hydroxylase activity(GO:0046409) |
| 0.0 | 0.1 | GO:0043812 | phosphatidylinositol phosphate 4-phosphatase activity(GO:0034596) phosphatidylinositol-4-phosphate phosphatase activity(GO:0043812) |
| 0.0 | 0.1 | GO:0010242 | oxygen evolving activity(GO:0010242) |
| 0.0 | 0.2 | GO:0016984 | ribulose-bisphosphate carboxylase activity(GO:0016984) |
| 0.0 | 0.2 | GO:0004614 | phosphoglucomutase activity(GO:0004614) |
| 0.0 | 0.2 | GO:0004781 | sulfate adenylyltransferase (ATP) activity(GO:0004781) |
| 0.0 | 0.3 | GO:0004356 | glutamate-ammonia ligase activity(GO:0004356) |
| 0.0 | 0.1 | GO:0045548 | phenylalanine ammonia-lyase activity(GO:0045548) |
| 0.0 | 0.5 | GO:0008252 | nucleotidase activity(GO:0008252) |
| 0.0 | 0.3 | GO:0004024 | alcohol dehydrogenase activity, zinc-dependent(GO:0004024) |
| 0.0 | 1.2 | GO:0005179 | hormone activity(GO:0005179) |
| 0.0 | 0.2 | GO:0050378 | UDP-glucuronate 4-epimerase activity(GO:0050378) |
| 0.0 | 0.2 | GO:0042879 | phosphoglycerate transmembrane transporter activity(GO:0015120) aldonate transmembrane transporter activity(GO:0042879) |
| 0.0 | 0.3 | GO:0008199 | ferric iron binding(GO:0008199) |
| 0.0 | 0.4 | GO:0000210 | NAD+ diphosphatase activity(GO:0000210) |
| 0.0 | 0.3 | GO:0004869 | cysteine-type endopeptidase inhibitor activity(GO:0004869) |
| 0.0 | 0.2 | GO:0004559 | alpha-mannosidase activity(GO:0004559) |
| 0.0 | 0.2 | GO:1990137 | plant seed peroxidase activity(GO:1990137) |
| 0.0 | 0.2 | GO:0001872 | (1->3)-beta-D-glucan binding(GO:0001872) |
| 0.0 | 0.2 | GO:0018708 | thiol S-methyltransferase activity(GO:0018708) |
| 0.0 | 0.3 | GO:0004022 | alcohol dehydrogenase (NAD) activity(GO:0004022) |
| 0.0 | 0.1 | GO:0046509 | 1,2-diacylglycerol 3-beta-galactosyltransferase activity(GO:0046509) |
| 0.0 | 0.5 | GO:0000822 | inositol hexakisphosphate binding(GO:0000822) |
| 0.0 | 0.1 | GO:0009678 | hydrogen-translocating pyrophosphatase activity(GO:0009678) |
| 0.0 | 0.2 | GO:0009979 | 16:0 monogalactosyldiacylglycerol desaturase activity(GO:0009979) |
| 0.0 | 0.1 | GO:0047724 | inosine nucleosidase activity(GO:0047724) |
| 0.0 | 1.4 | GO:0061631 | ubiquitin conjugating enzyme activity(GO:0061631) |
| 0.0 | 0.2 | GO:0016987 | core DNA-dependent RNA polymerase binding promoter specificity activity(GO:0000996) sigma factor activity(GO:0016987) |
| 0.0 | 0.3 | GO:0051920 | thioredoxin peroxidase activity(GO:0008379) peroxiredoxin activity(GO:0051920) |
| 0.0 | 0.1 | GO:0050377 | UDP-L-rhamnose synthase activity(GO:0010280) UDP-glucose 4,6-dehydratase activity(GO:0050377) |
| 0.0 | 0.2 | GO:0004550 | nucleoside diphosphate kinase activity(GO:0004550) |
| 0.0 | 0.1 | GO:0016707 | gibberellin 3-beta-dioxygenase activity(GO:0016707) |
| 0.0 | 0.1 | GO:0001227 | transcriptional repressor activity, RNA polymerase II transcription regulatory region sequence-specific binding(GO:0001227) |
| 0.0 | 0.3 | GO:0015174 | basic amino acid transmembrane transporter activity(GO:0015174) |
| 0.0 | 1.8 | GO:0030599 | pectinesterase activity(GO:0030599) |
| 0.0 | 0.6 | GO:0004565 | beta-galactosidase activity(GO:0004565) |
| 0.0 | 0.1 | GO:0005046 | KDEL sequence binding(GO:0005046) |
| 0.0 | 0.1 | GO:0004476 | mannose-6-phosphate isomerase activity(GO:0004476) |
| 0.0 | 0.2 | GO:0008381 | mechanically-gated ion channel activity(GO:0008381) mechanically gated channel activity(GO:0022833) |
| 0.0 | 0.3 | GO:0047259 | glucomannan 4-beta-mannosyltransferase activity(GO:0047259) |
| 0.0 | 0.6 | GO:0030570 | carbon-oxygen lyase activity, acting on polysaccharides(GO:0016837) pectate lyase activity(GO:0030570) |
| 0.0 | 0.1 | GO:0071771 | octadecanal decarbonylase activity(GO:0009924) aldehyde decarbonylase activity(GO:0071771) aldehyde oxygenase (deformylating) activity(GO:1990465) |
| 0.0 | 0.3 | GO:0033926 | glycopeptide alpha-N-acetylgalactosaminidase activity(GO:0033926) |
| 0.0 | 1.1 | GO:0102483 | scopolin beta-glucosidase activity(GO:0102483) |
| 0.0 | 0.6 | GO:0047262 | polygalacturonate 4-alpha-galacturonosyltransferase activity(GO:0047262) |
| 0.0 | 0.1 | GO:0004729 | oxygen-dependent protoporphyrinogen oxidase activity(GO:0004729) protoporphyrinogen oxidase activity(GO:0070818) |
| 0.0 | 0.3 | GO:0016157 | sucrose synthase activity(GO:0016157) |
| 0.0 | 0.1 | GO:0035671 | enone reductase activity(GO:0035671) |
| 0.0 | 0.1 | GO:0051019 | mitogen-activated protein kinase binding(GO:0051019) |
| 0.0 | 0.5 | GO:0008378 | galactosyltransferase activity(GO:0008378) |
| 0.0 | 0.1 | GO:0004791 | thioredoxin-disulfide reductase activity(GO:0004791) |
| 0.0 | 0.1 | GO:0003785 | actin monomer binding(GO:0003785) |
| 0.0 | 0.2 | GO:0052747 | sinapyl alcohol dehydrogenase activity(GO:0052747) |
| 0.0 | 0.1 | GO:0071933 | protein kinase A regulatory subunit binding(GO:0034237) protein kinase A binding(GO:0051018) Arp2/3 complex binding(GO:0071933) |
| 0.0 | 0.4 | GO:0005253 | anion channel activity(GO:0005253) |
| 0.0 | 0.4 | GO:0005381 | iron ion transmembrane transporter activity(GO:0005381) |
| 0.0 | 0.3 | GO:0047196 | long-chain-alcohol O-fatty-acyltransferase activity(GO:0047196) |
| 0.0 | 0.1 | GO:0052623 | ATP dimethylallyltransferase activity(GO:0052622) ADP dimethylallyltransferase activity(GO:0052623) |
| 0.0 | 0.1 | GO:0004652 | polynucleotide adenylyltransferase activity(GO:0004652) |
| 0.0 | 0.1 | GO:0005458 | GDP-mannose transmembrane transporter activity(GO:0005458) |
| 0.0 | 0.1 | GO:0008121 | ubiquinol-cytochrome-c reductase activity(GO:0008121) oxidoreductase activity, acting on diphenols and related substances as donors, cytochrome as acceptor(GO:0016681) |
| 0.0 | 0.2 | GO:0004427 | inorganic diphosphatase activity(GO:0004427) |
| 0.0 | 0.1 | GO:0017048 | Rho GTPase binding(GO:0017048) |
| 0.0 | 0.2 | GO:0016847 | 1-aminocyclopropane-1-carboxylate synthase activity(GO:0016847) |
| 0.0 | 0.2 | GO:0016308 | 1-phosphatidylinositol-4-phosphate 5-kinase activity(GO:0016308) |
| 0.0 | 0.1 | GO:0000062 | fatty-acyl-CoA binding(GO:0000062) |
| 0.0 | 0.1 | GO:0033843 | xyloglucan 6-xylosyltransferase activity(GO:0033843) |
| 0.0 | 0.1 | GO:0004564 | beta-fructofuranosidase activity(GO:0004564) |
| 0.0 | 0.3 | GO:0004630 | phospholipase D activity(GO:0004630) N-acylphosphatidylethanolamine-specific phospholipase D activity(GO:0070290) |
| 0.0 | 0.1 | GO:0010429 | methyl-CpNpG binding(GO:0010428) methyl-CpNpN binding(GO:0010429) |
| 0.0 | 0.3 | GO:0003951 | NAD+ kinase activity(GO:0003951) |
| 0.0 | 0.3 | GO:0016868 | intramolecular transferase activity, phosphotransferases(GO:0016868) |
| 0.0 | 0.1 | GO:0004737 | pyruvate decarboxylase activity(GO:0004737) |
| 0.0 | 0.3 | GO:0022821 | potassium ion antiporter activity(GO:0022821) |
| 0.0 | 0.3 | GO:0004033 | aldo-keto reductase (NADP) activity(GO:0004033) |
| 0.0 | 0.2 | GO:0043878 | glyceraldehyde-3-phosphate dehydrogenase (NAD+) (non-phosphorylating) activity(GO:0043878) |
| 0.0 | 0.7 | GO:0016706 | oxidoreductase activity, acting on paired donors, with incorporation or reduction of molecular oxygen, 2-oxoglutarate as one donor, and incorporation of one atom each of oxygen into both donors(GO:0016706) |
| 0.0 | 0.2 | GO:0004930 | G-protein coupled receptor activity(GO:0004930) |
| 0.0 | 0.1 | GO:0005483 | soluble NSF attachment protein activity(GO:0005483) |
| 0.0 | 0.1 | GO:0016161 | beta-amylase activity(GO:0016161) |
| 0.0 | 0.3 | GO:0046912 | transferase activity, transferring acyl groups, acyl groups converted into alkyl on transfer(GO:0046912) |
| 0.0 | 0.1 | GO:0016812 | hydrolase activity, acting on carbon-nitrogen (but not peptide) bonds, in cyclic amides(GO:0016812) |
| 0.0 | 0.1 | GO:0015037 | peptide disulfide oxidoreductase activity(GO:0015037) glutathione disulfide oxidoreductase activity(GO:0015038) |
| 0.0 | 0.2 | GO:0004864 | protein phosphatase inhibitor activity(GO:0004864) |
| 0.0 | 0.0 | GO:0008493 | tetracycline transporter activity(GO:0008493) toxin transporter activity(GO:0019534) antibiotic transporter activity(GO:0042895) |
| 0.0 | 0.6 | GO:0004190 | aspartic-type endopeptidase activity(GO:0004190) |
| 0.0 | 0.2 | GO:0008889 | glycerophosphodiester phosphodiesterase activity(GO:0008889) |
| 0.0 | 0.1 | GO:0004784 | superoxide dismutase activity(GO:0004784) oxidoreductase activity, acting on superoxide radicals as acceptor(GO:0016721) |
| 0.0 | 0.1 | GO:0005092 | GDP-dissociation inhibitor activity(GO:0005092) |
| 0.0 | 0.5 | GO:0015171 | amino acid transmembrane transporter activity(GO:0015171) |
| 0.0 | 0.4 | GO:0045735 | nutrient reservoir activity(GO:0045735) |
| 0.0 | 0.2 | GO:0008515 | sucrose transmembrane transporter activity(GO:0008515) |
| 0.0 | 0.1 | GO:0019158 | glucose binding(GO:0005536) mannokinase activity(GO:0019158) |
| 0.0 | 0.1 | GO:0009927 | histidine phosphotransfer kinase activity(GO:0009927) |
| 0.0 | 0.1 | GO:0017169 | CDP-alcohol phosphatidyltransferase activity(GO:0017169) |
Gene overrepresentation in curated gene sets: canonical pathways category:
| Log-likelihood per target | Total log-likelihood | Term | Description |
|---|---|---|---|
| 0.0 | 0.3 | SIG INSULIN RECEPTOR PATHWAY IN CARDIAC MYOCYTES | Genes related to the insulin receptor pathway |
| 0.0 | 0.1 | PID AMB2 NEUTROPHILS PATHWAY | amb2 Integrin signaling |
| 0.0 | 0.1 | PID AP1 PATHWAY | AP-1 transcription factor network |
Gene overrepresentation in curated gene sets: REACTOME pathways category:
| Log-likelihood per target | Total log-likelihood | Term | Description |
|---|---|---|---|
| 0.1 | 0.3 | REACTOME GABA SYNTHESIS RELEASE REUPTAKE AND DEGRADATION | Genes involved in GABA synthesis, release, reuptake and degradation |
| 0.1 | 0.4 | REACTOME CITRIC ACID CYCLE TCA CYCLE | Genes involved in Citric acid cycle (TCA cycle) |
| 0.1 | 0.3 | REACTOME PROCESSING OF CAPPED INTRON CONTAINING PRE MRNA | Genes involved in Processing of Capped Intron-Containing Pre-mRNA |
| 0.1 | 0.2 | REACTOME PREFOLDIN MEDIATED TRANSFER OF SUBSTRATE TO CCT TRIC | Genes involved in Prefoldin mediated transfer of substrate to CCT/TriC |
| 0.0 | 0.2 | REACTOME GLUCOSE METABOLISM | Genes involved in Glucose metabolism |
| 0.0 | 0.1 | REACTOME METABOLISM OF CARBOHYDRATES | Genes involved in Metabolism of carbohydrates |
| 0.0 | 0.1 | REACTOME L1CAM INTERACTIONS | Genes involved in L1CAM interactions |