Project
GSE43616: Time-course of wild-type Arabidopsis leaf
Navigation
Downloads
Results for AT4G18960
Z-value: 0.18
Transcription factors associated with AT4G18960
| Gene Symbol | Gene ID | Gene Info |
|---|---|---|
|
AT4G18960
|
AT4G18960 | K-box region and MADS-box transcription factor family protein |
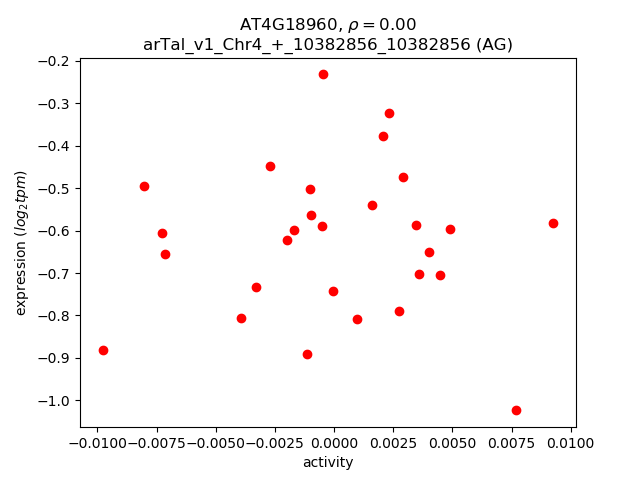
Activity-expression correlation:
| Gene | Promoter | Pearson corr. coef. | P-value | Plot |
|---|---|---|---|---|
| AG | arTal_v1_Chr4_+_10382856_10382856 | 0.00 | 9.9e-01 | Click! |
Activity profile of AT4G18960 motif
Sorted Z-values of AT4G18960 motif
| Promoter | Log-likelihood | Transcript | Gene | Gene Info |
|---|---|---|---|---|
| arTal_v1_Chr5_-_20001572_20001572 | 0.23 |
AT5G49330.1
|
MYB111
|
myb domain protein 111 |
| arTal_v1_Chr1_+_27759941_27759973 | 0.22 |
AT1G73830.1
AT1G73830.2 |
BEE3
|
BR enhanced expression 3 |
| arTal_v1_Chr5_+_16370368_16370368 | 0.20 |
AT5G40860.2
AT5G40860.1 |
AT5G40860
|
transmembrane protein |
| arTal_v1_Chr5_+_13596824_13596824 | 0.17 |
AT5G35390.1
|
PRK1
|
Leucine-rich repeat protein kinase family protein |
| arTal_v1_Chr3_+_8242256_8242256 | 0.15 |
AT3G23130.1
|
SUP
|
C2H2 and C2HC zinc fingers superfamily protein |
| arTal_v1_Chr3_-_20121314_20121314 | 0.15 |
AT3G54340.1
|
AP3
|
K-box region and MADS-box transcription factor family protein |
| arTal_v1_Chr5_-_3876990_3877004 | 0.15 |
AT5G12000.2
AT5G12000.1 |
AT5G12000
|
kinase with adenine nucleotide alpha hydrolases-like domain-containing protein |
| arTal_v1_Chr2_+_13396042_13396042 | 0.15 |
AT2G31430.1
|
PMEI5
|
Plant invertase/pectin methylesterase inhibitor superfamily protein |
| arTal_v1_Chr4_-_17316374_17316441 | 0.14 |
AT4G36740.2
AT4G36740.1 |
HB40
|
homeobox protein 40 |
| arTal_v1_Chr4_+_10382856_10382856 | 0.14 |
AT4G18960.2
AT4G18960.4 AT4G18960.1 AT4G18960.3 |
AG
|
K-box region and MADS-box transcription factor family protein |
| arTal_v1_Chr1_+_415074_415079 | 0.13 |
AT1G02190.1
AT1G02190.2 |
AT1G02190
|
Fatty acid hydroxylase superfamily |
| arTal_v1_Chr2_+_11773187_11773187 | 0.13 |
AT2G27550.1
|
ATC
|
centroradiali |
| arTal_v1_Chr4_+_959964_959964 | 0.13 |
AT4G02180.1
|
AT4G02180
|
DC1 domain-containing protein |
| arTal_v1_Chr2_-_7810811_7810811 | 0.12 |
AT2G17950.1
|
WUS
|
Homeodomain-like superfamily protein |
| arTal_v1_Chr2_+_17820114_17820255 | 0.11 |
AT2G42830.1
AT2G42830.2 |
SHP2
|
K-box region and MADS-box transcription factor family protein |
| arTal_v1_Chr4_+_11480321_11480329 | 0.10 |
AT4G21590.1
AT4G21590.2 |
ENDO3
|
endonuclease 3 |
| arTal_v1_Chr1_+_17504714_17504714 | 0.10 |
AT1G47610.1
|
AT1G47610
|
Transducin/WD40 repeat-like superfamily protein |
| arTal_v1_Chr1_+_4597567_4597567 | 0.09 |
AT1G13400.1
|
NUB
|
C2H2 and C2HC zinc fingers superfamily protein |
| arTal_v1_Chr2_+_6801803_6801920 | 0.09 |
AT2G15590.2
AT2G15590.1 |
AT2G15590
|
spire, putative (DUF1685) |
| arTal_v1_Chr5_-_15834420_15834420 | 0.07 |
AT5G39540.1
|
AT5G39540
|
F-box associated ubiquitination effector family protein |
| arTal_v1_Chr4_-_17837584_17837584 | 0.07 |
AT4G37940.2
|
AGL21
|
AGAMOUS-like 21 |
| arTal_v1_Chr3_+_5800272_5800272 | 0.07 |
AT3G17010.1
|
REM22
|
AP2/B3-like transcriptional factor family protein |
| arTal_v1_Chr3_+_22720921_22720972 | 0.07 |
AT3G61410.2
AT3G61410.1 AT3G61410.3 |
AT3G61410
|
U-box kinase family protein |
| arTal_v1_Chr4_-_17838621_17838621 | 0.07 |
AT4G37940.4
|
AGL21
|
AGAMOUS-like 21 |
| arTal_v1_Chr4_-_17838969_17838969 | 0.07 |
AT4G37940.1
AT4G37940.3 |
AGL21
|
AGAMOUS-like 21 |
| arTal_v1_Chr3_+_3447568_3447568 | 0.06 |
AT3G11000.1
AT3G11000.2 |
AT3G11000
|
DCD (Development and Cell Death) domain protein |
| arTal_v1_Chr3_-_11009413_11009456 | 0.05 |
AT3G29020.1
AT3G29020.2 |
MYB110
|
myb domain protein 110 |
| arTal_v1_Chr4_-_12027421_12027421 | 0.05 |
AT4G22950.3
|
AGL19
|
AGAMOUS-like 19 |
| arTal_v1_Chr1_-_8596098_8596123 | 0.04 |
AT1G24260.2
AT1G24260.3 AT1G24260.1 |
SEP3
|
K-box region and MADS-box transcription factor family protein |
| arTal_v1_Chr2_+_14856664_14856664 | 0.04 |
AT2G35270.1
|
GIK
|
Putative AT-hook DNA-binding family protein |
| arTal_v1_Chr4_-_12028004_12028004 | 0.03 |
AT4G22950.1
AT4G22950.2 |
AGL19
|
AGAMOUS-like 19 |
| arTal_v1_Chr4_-_15918044_15918153 | 0.03 |
AT4G32980.2
AT4G32980.1 |
ATH1
|
homeobox protein ATH1 |
| arTal_v1_Chr4_+_7439115_7439115 | 0.03 |
AT4G12550.1
|
AIR1
|
Auxin-Induced in Root cultures 1 |
| arTal_v1_Chr1_-_26009141_26009141 | 0.02 |
AT1G69180.1
|
CRC
|
Plant-specific transcription factor YABBY family protein |
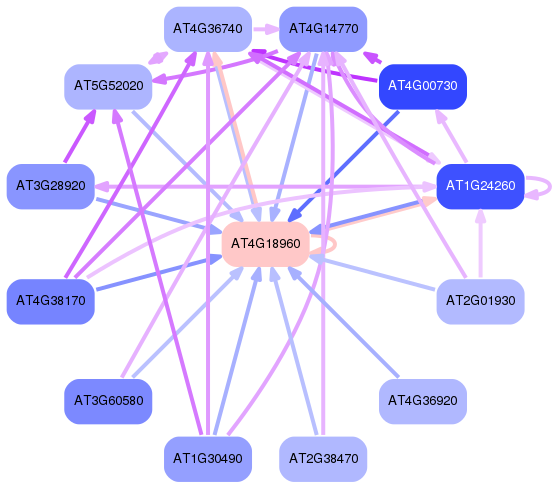
Network of associatons between targets according to the STRING database.

First level regulatory network of AT4G18960
Gene Ontology Analysis
Gene overrepresentation in biological process category:
| Log-likelihood per target | Total log-likelihood | Term | Description |
|---|---|---|---|
| 0.1 | 0.2 | GO:1900386 | positive regulation of flavonol biosynthetic process(GO:1900386) |
| 0.0 | 0.3 | GO:0010093 | specification of floral organ identity(GO:0010093) |
| 0.0 | 0.1 | GO:0090506 | axillary shoot meristem initiation(GO:0090506) |
| 0.0 | 0.1 | GO:0048496 | maintenance of organ identity(GO:0048496) maintenance of floral organ identity(GO:0048497) |
| 0.0 | 0.1 | GO:0006308 | DNA catabolic process(GO:0006308) |
Gene overrepresentation in molecular function category:
| Log-likelihood per target | Total log-likelihood | Term | Description |
|---|---|---|---|
| 0.0 | 0.1 | GO:0043765 | T/G mismatch-specific endonuclease activity(GO:0043765) |