Project
GSE43616: Time-course of wild-type Arabidopsis leaf
Navigation
Downloads
Results for AT4G16750
Z-value: 0.71
Transcription factors associated with AT4G16750
| Gene Symbol | Gene ID | Gene Info |
|---|---|---|
|
AT4G16750
|
AT4G16750 | Integrase-type DNA-binding superfamily protein |
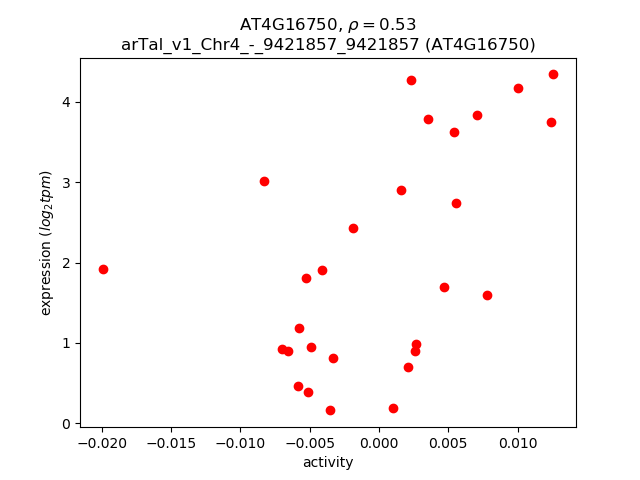
Activity-expression correlation:
| Gene | Promoter | Pearson corr. coef. | P-value | Plot |
|---|---|---|---|---|
| AT4G16750 | arTal_v1_Chr4_-_9421857_9421857 | 0.53 | 3.5e-03 | Click! |
Activity profile of AT4G16750 motif
Sorted Z-values of AT4G16750 motif
| Promoter | Log-likelihood | Transcript | Gene | Gene Info |
|---|---|---|---|---|
| arTal_v1_Chr3_-_21189859_21189967 | 1.29 |
AT3G57260.1
AT3G57260.2 |
BGL2
|
beta-1,3-glucanase 2 |
| arTal_v1_Chr4_+_8392825_8392825 | 1.12 |
AT4G14630.1
|
GLP9
|
germin-like protein 9 |
| arTal_v1_Chr5_-_17166032_17166032 | 1.10 |
AT5G42800.1
|
DFR
|
dihydroflavonol 4-reductase |
| arTal_v1_Chr3_+_18873911_18873911 | 1.10 |
AT3G50770.1
|
CML41
|
calmodulin-like 41 |
| arTal_v1_Chr3_+_15983199_15983199 | 1.08 |
AT3G44300.1
|
NIT2
|
nitrilase 2 |
| arTal_v1_Chr1_+_28177670_28177670 | 1.07 |
AT1G75040.1
|
PR5
|
pathogenesis-related protein 5 |
| arTal_v1_Chr5_-_17907638_17907638 | 1.03 |
AT5G44420.1
|
PDF1.2
|
plant defensin 1.2 |
| arTal_v1_Chr3_-_6258426_6258426 | 1.01 |
AT3G18250.1
|
AT3G18250
|
Putative membrane lipoprotein |
| arTal_v1_Chr1_-_21235292_21235292 | 0.98 |
AT1G56650.1
|
PAP1
|
production of anthocyanin pigment 1 |
| arTal_v1_Chr1_+_12917070_12917070 | 0.95 |
AT1G35230.1
|
AGP5
|
arabinogalactan protein 5 |
| arTal_v1_Chr1_-_9956960_9956980 | 0.93 |
AT1G28370.1
AT1G28370.2 |
ERF11
|
ERF domain protein 11 |
| arTal_v1_Chr3_-_8007836_8007836 | 0.92 |
AT3G22600.1
|
AT3G22600
|
Bifunctional inhibitor/lipid-transfer protein/seed storage 2S albumin superfamily protein |
| arTal_v1_Chr4_-_9201643_9201643 | 0.91 |
AT4G16260.2
AT4G16260.1 |
AT4G16260
|
Glycosyl hydrolase superfamily protein |
| arTal_v1_Chr3_+_9208861_9208941 | 0.90 |
AT3G25290.1
AT3G25290.2 |
AT3G25290
|
Auxin-responsive family protein |
| arTal_v1_Chr2_+_8097420_8097420 | 0.89 |
AT2G18690.2
AT2G18690.1 |
AT2G18690
|
transmembrane protein |
| arTal_v1_Chr1_-_662456_662475 | 0.89 |
AT1G02930.2
AT1G02930.1 |
GSTF6
|
glutathione S-transferase 6 |
| arTal_v1_Chr3_-_327412_327412 | 0.87 |
AT3G01970.1
|
WRKY45
|
WRKY DNA-binding protein 45 |
| arTal_v1_Chr2_+_12600914_12601033 | 0.87 |
AT2G29350.2
AT2G29350.1 AT2G29350.3 |
SAG13
|
senescence-associated gene 13 |
| arTal_v1_Chr5_-_2176446_2176446 | 0.86 |
AT5G07010.1
|
ST2A
|
sulfotransferase 2A |
| arTal_v1_Chr1_+_25426234_25426234 | 0.86 |
AT1G67810.1
|
SUFE2
|
sulfur E2 |
| arTal_v1_Chr3_-_23410360_23410360 | 0.86 |
AT3G63380.1
|
AT3G63380
|
ATPase E1-E2 type family protein / haloacid dehalogenase-like hydrolase family protein |
| arTal_v1_Chr5_-_8659352_8659352 | 0.86 |
AT5G25110.1
|
CIPK25
|
CBL-interacting protein kinase 25 |
| arTal_v1_Chr1_-_7469995_7469995 | 0.84 |
AT1G21326.1
|
AT1G21326
|
VQ motif-containing protein |
| arTal_v1_Chr4_+_6491017_6491017 | 0.84 |
AT4G10500.1
|
AT4G10500
|
2-oxoglutarate (2OG) and Fe(II)-dependent oxygenase superfamily protein |
| arTal_v1_Chr1_+_11310997_11310997 | 0.83 |
AT1G31580.1
|
ECS1
|
ECS1 |
| arTal_v1_Chr3_-_20769324_20769410 | 0.83 |
AT3G55970.2
AT3G55970.1 |
JRG21
|
jasmonate-regulated gene 21 |
| arTal_v1_Chr5_-_3402389_3402389 | 0.83 |
AT5G10760.1
|
AT5G10760
|
Eukaryotic aspartyl protease family protein |
| arTal_v1_Chr4_-_12853845_12853845 | 0.83 |
AT4G25000.1
|
AMY1
|
alpha-amylase-like protein |
| arTal_v1_Chr1_+_25765718_25765718 | 0.82 |
AT1G68620.1
|
AT1G68620
|
alpha/beta-Hydrolases superfamily protein |
| arTal_v1_Chr2_+_17409370_17409370 | 0.81 |
AT2G41730.1
|
AT2G41730
|
calcium-binding site protein |
| arTal_v1_Chr4_-_12006209_12006209 | 0.80 |
AT4G22880.2
AT4G22880.1 AT4G22880.3 |
LDOX
|
leucoanthocyanidin dioxygenase |
| arTal_v1_Chr1_-_1559917_1559917 | 0.79 |
AT1G05340.1
|
AT1G05340
|
cysteine-rich TM module stress tolerance protein |
| arTal_v1_Chr4_-_8123835_8123835 | 0.79 |
AT4G14090.1
|
AT4G14090
|
UDP-Glycosyltransferase superfamily protein |
| arTal_v1_Chr3_-_18294621_18294621 | 0.78 |
AT3G49340.1
|
AT3G49340
|
Cysteine proteinases superfamily protein |
| arTal_v1_Chr5_+_4213955_4213955 | 0.77 |
AT5G13210.1
|
AT5G13210
|
Uncharacterized conserved protein UCP015417, vWA |
| arTal_v1_Chr2_+_19375985_19375985 | 0.76 |
AT2G47190.1
|
MYB2
|
myb domain protein 2 |
| arTal_v1_Chr4_+_10974456_10974510 | 0.76 |
AT4G20320.2
AT4G20320.4 AT4G20320.3 AT4G20320.1 AT4G20320.5 AT4G20320.6 |
AT4G20320
|
CTP synthase family protein |
| arTal_v1_Chr2_-_18646606_18646606 | 0.75 |
AT2G45220.1
|
AT2G45220
|
Plant invertase/pectin methylesterase inhibitor superfamily |
| arTal_v1_Chr3_-_3963984_3963984 | 0.75 |
AT3G12500.1
|
HCHIB
|
basic chitinase |
| arTal_v1_Chr3_-_4269691_4269691 | 0.75 |
AT3G13229.1
|
AT3G13229
|
kinesin-like protein (DUF868) |
| arTal_v1_Chr3_-_11400332_11400332 | 0.75 |
AT3G29590.1
|
AT5MAT
|
HXXXD-type acyl-transferase family protein |
| arTal_v1_Chr5_-_25089603_25089626 | 0.75 |
AT5G62480.3
AT5G62480.2 AT5G62480.1 |
GSTU9
|
glutathione S-transferase tau 9 |
| arTal_v1_Chr5_+_8202919_8203003 | 0.74 |
AT5G24200.1
AT5G24200.2 AT5G24200.3 |
AT5G24200
|
alpha/beta-Hydrolases superfamily protein |
| arTal_v1_Chr4_+_12121369_12121383 | 0.74 |
AT4G23140.1
AT4G23140.2 |
CRK6
|
cysteine-rich RLK (RECEPTOR-like protein kinase) 6 |
| arTal_v1_Chr3_+_17724400_17724400 | 0.73 |
AT3G48020.1
|
AT3G48020
|
hypothetical protein |
| arTal_v1_Chr4_+_15828228_15828228 | 0.73 |
AT4G32810.1
AT4G32810.2 |
CCD8
|
carotenoid cleavage dioxygenase 8 |
| arTal_v1_Chr2_-_11980003_11980003 | 0.73 |
AT2G28110.1
|
FRA8
|
Exostosin family protein |
| arTal_v1_Chr1_+_10892445_10892445 | 0.73 |
AT1G30700.1
|
AT1G30700
|
FAD-binding Berberine family protein |
| arTal_v1_Chr1_-_29622445_29622447 | 0.73 |
AT1G78780.1
AT1G78780.2 AT1G78780.4 |
AT1G78780
|
pathogenesis-related family protein |
| arTal_v1_Chr3_-_4657723_4657723 | 0.72 |
AT3G14060.1
|
AT3G14060
|
hypothetical protein |
| arTal_v1_Chr3_+_9892791_9892791 | 0.72 |
AT3G26840.1
|
PES2
|
Esterase/lipase/thioesterase family protein |
| arTal_v1_Chr1_+_4416315_4416315 | 0.70 |
AT1G12940.1
|
NRT2.5
|
nitrate transporter2.5 |
| arTal_v1_Chr4_-_7026224_7026224 | 0.70 |
AT4G11650.1
|
OSM34
|
osmotin 34 |
| arTal_v1_Chr2_+_15110492_15110492 | 0.70 |
AT2G35980.1
|
YLS9
|
Late embryogenesis abundant (LEA) hydroxyproline-rich glycoprotein family |
| arTal_v1_Chr5_-_4151201_4151201 | 0.70 |
AT5G13080.1
|
WRKY75
|
WRKY DNA-binding protein 75 |
| arTal_v1_Chr5_+_3239617_3239617 | 0.70 |
AT5G10300.2
|
MES5
|
methyl esterase 5 |
| arTal_v1_Chr1_+_9378404_9378404 | 0.69 |
AT1G27020.1
|
AT1G27020
|
plant/protein |
| arTal_v1_Chr1_-_17706460_17706460 | 0.69 |
AT1G48000.1
|
MYB112
|
myb domain protein 112 |
| arTal_v1_Chr5_+_3239455_3239455 | 0.69 |
AT5G10300.1
|
MES5
|
methyl esterase 5 |
| arTal_v1_Chr2_+_17251819_17251819 | 0.69 |
AT2G41380.1
|
AT2G41380
|
S-adenosyl-L-methionine-dependent methyltransferases superfamily protein |
| arTal_v1_Chr4_-_11588373_11588373 | 0.69 |
AT4G21840.1
|
MSRB8
|
methionine sulfoxide reductase B8 |
| arTal_v1_Chr5_+_6826365_6826365 | 0.68 |
AT5G20230.1
|
BCB
|
blue-copper-binding protein |
| arTal_v1_Chr2_-_18306395_18306395 | 0.68 |
AT2G44290.1
|
AT2G44290
|
Bifunctional inhibitor/lipid-transfer protein/seed storage 2S albumin superfamily protein |
| arTal_v1_Chr3_-_7818985_7818985 | 0.68 |
AT3G22160.1
|
AT3G22160
|
VQ motif-containing protein |
| arTal_v1_Chr3_-_1063103_1063234 | 0.67 |
AT3G04070.2
AT3G04070.1 |
NAC047
|
NAC domain containing protein 47 |
| arTal_v1_Chr4_-_1046993_1047105 | 0.67 |
AT4G02380.2
AT4G02380.1 AT4G02380.3 |
SAG21
|
senescence-associated gene 21 |
| arTal_v1_Chr2_+_12871984_12872134 | 0.67 |
AT2G30140.1
AT2G30140.2 |
UGT87A2
|
UDP-Glycosyltransferase superfamily protein |
| arTal_v1_Chr3_-_2699257_2699257 | 0.67 |
AT3G08860.2
|
PYD4
|
PYRIMIDINE 4 |
| arTal_v1_Chr1_-_513698_513721 | 0.67 |
AT1G02470.2
AT1G02470.1 |
AT1G02470
|
Polyketide cyclase/dehydrase and lipid transport superfamily protein |
| arTal_v1_Chr5_-_6042938_6043014 | 0.67 |
AT5G18270.2
AT5G18270.1 |
ANAC087
|
NAC domain containing protein 87 |
| arTal_v1_Chr3_+_9887917_9887917 | 0.67 |
AT3G26830.1
|
PAD3
|
Cytochrome P450 superfamily protein |
| arTal_v1_Chr2_-_18781973_18781973 | 0.66 |
AT2G45570.1
|
CYP76C2
|
cytochrome P450, family 76, subfamily C, polypeptide 2 |
| arTal_v1_Chr1_-_5133860_5133860 | 0.66 |
AT1G14880.1
|
PCR1
|
PLANT CADMIUM RESISTANCE 1 |
| arTal_v1_Chr3_-_2699420_2699420 | 0.66 |
AT3G08860.1
|
PYD4
|
PYRIMIDINE 4 |
| arTal_v1_Chr2_+_6244772_6244772 | 0.66 |
AT2G14620.2
AT2G14620.3 AT2G14620.1 |
XTH10
|
xyloglucan endotransglucosylase/hydrolase 10 |
| arTal_v1_Chr3_-_22959018_22959018 | 0.66 |
AT3G61990.1
|
OMTF3
|
S-adenosyl-L-methionine-dependent methyltransferases superfamily protein |
| arTal_v1_Chr1_-_27755297_27755297 | 0.66 |
AT1G73810.1
|
AT1G73810
|
Core-2/I-branching beta-1,6-N-acetylglucosaminyltransferase family protein |
| arTal_v1_Chr3_-_829926_829926 | 0.65 |
AT3G03480.1
|
CHAT
|
acetyl CoA:(Z)-3-hexen-1-ol acetyltransferase |
| arTal_v1_Chr3_-_7676519_7676519 | 0.65 |
AT3G21780.1
|
UGT71B6
|
UDP-glucosyl transferase 71B6 |
| arTal_v1_Chr2_+_17640546_17640546 | 0.65 |
AT2G42360.1
|
AT2G42360
|
RING/U-box superfamily protein |
| arTal_v1_Chr4_+_7148124_7148386 | 0.65 |
AT4G11890.3
AT4G11890.1 AT4G11890.4 |
ARCK1
|
Protein kinase superfamily protein |
| arTal_v1_Chr3_-_1286760_1286760 | 0.64 |
AT3G04720.1
|
PR4
|
pathogenesis-related 4 |
| arTal_v1_Chr3_-_18375784_18375784 | 0.64 |
AT3G49580.3
AT3G49580.2 |
LSU1
|
response to low sulfur 1 |
| arTal_v1_Chr1_-_23460884_23460884 | 0.64 |
AT1G63245.1
|
CLE14
|
CLAVATA3/ESR-RELATED 14 |
| arTal_v1_Chr1_+_6100964_6101015 | 0.64 |
AT1G17745.1
AT1G17745.2 |
PGDH
|
D-3-phosphoglycerate dehydrogenase |
| arTal_v1_Chr2_+_11247160_11247160 | 0.64 |
AT2G26440.1
|
AT2G26440
|
Plant invertase/pectin methylesterase inhibitor superfamily |
| arTal_v1_Chr5_+_20436180_20436275 | 0.64 |
AT5G50200.3
AT5G50200.2 |
WR3
|
nitrate transmembrane transporter |
| arTal_v1_Chr1_+_7823066_7823066 | 0.63 |
AT1G22160.1
|
AT1G22160
|
senescence-associated family protein (DUF581) |
| arTal_v1_Chr4_+_12125664_12125664 | 0.63 |
AT4G23150.1
|
CRK7
|
cysteine-rich RLK (RECEPTOR-like protein kinase) 7 |
| arTal_v1_Chr3_+_9685932_9685932 | 0.63 |
AT3G26470.1
|
AT3G26470
|
Powdery mildew resistance protein, RPW8 domain-containing protein |
| arTal_v1_Chr3_+_22552560_22552560 | 0.63 |
AT3G60966.1
|
AT3G60966
|
RING/U-box superfamily protein |
| arTal_v1_Chr3_+_23289243_23289243 | 0.63 |
AT3G63010.1
|
GID1B
|
alpha/beta-Hydrolases superfamily protein |
| arTal_v1_Chr3_-_162905_162905 | 0.62 |
AT3G01420.1
|
DOX1
|
Peroxidase superfamily protein |
| arTal_v1_Chr5_-_18804056_18804056 | 0.62 |
AT5G46350.1
|
WRKY8
|
WRKY DNA-binding protein 8 |
| arTal_v1_Chr1_-_7388512_7388512 | 0.62 |
AT1G21100.1
|
IGMT1
|
O-methyltransferase family protein |
| arTal_v1_Chr1_+_24045092_24045092 | 0.62 |
AT1G64710.3
|
AT1G64710
|
GroES-like zinc-binding alcohol dehydrogenase family protein |
| arTal_v1_Chr5_+_2204206_2204248 | 0.62 |
AT5G07100.5
AT5G07100.3 AT5G07100.4 AT5G07100.2 AT5G07100.1 |
WRKY26
|
WRKY DNA-binding protein 26 |
| arTal_v1_Chr1_-_17266724_17266824 | 0.62 |
AT1G46768.3
AT1G46768.2 AT1G46768.1 |
RAP2.1
|
related to AP2 1 |
| arTal_v1_Chr1_-_10356482_10356482 | 0.62 |
AT1G29640.1
|
AT1G29640
|
senescence regulator (Protein of unknown function, DUF584) |
| arTal_v1_Chr3_-_3993886_3993886 | 0.61 |
AT3G12580.1
|
HSP70
|
heat shock protein 70 |
| arTal_v1_Chr5_-_761840_761840 | 0.61 |
AT5G03200.1
|
LUL1
|
RING/U-box superfamily protein |
| arTal_v1_Chr5_+_16815310_16815310 | 0.61 |
AT5G42050.1
|
AT5G42050
|
DCD (Development and Cell Death) domain protein |
| arTal_v1_Chr3_-_7999552_7999552 | 0.61 |
AT3G22560.1
|
AT3G22560
|
Acyl-CoA N-acyltransferases (NAT) superfamily protein |
| arTal_v1_Chr5_-_216773_216773 | 0.61 |
AT5G01550.1
|
LECRKA4.2
|
lectin receptor kinase a4.1 |
| arTal_v1_Chr1_-_19336072_19336135 | 0.61 |
AT1G52000.2
AT1G52000.1 |
AT1G52000
|
Mannose-binding lectin superfamily protein |
| arTal_v1_Chr3_-_826585_826585 | 0.61 |
AT3G03470.1
|
CYP89A9
|
cytochrome P450, family 87, subfamily A, polypeptide 9 |
| arTal_v1_Chr5_-_5862462_5862475 | 0.61 |
AT5G17760.2
AT5G17760.1 |
AT5G17760
|
P-loop containing nucleoside triphosphate hydrolases superfamily protein |
| arTal_v1_Chr1_+_6927736_6927736 | 0.61 |
AT1G19960.1
|
AT1G19960
|
transcription factor |
| arTal_v1_Chr4_-_11636720_11636720 | 0.60 |
AT4G21920.1
|
AT4G21920
|
hypothetical protein |
| arTal_v1_Chr1_-_6101983_6101983 | 0.60 |
AT1G17744.1
|
AT1G17744
|
hypothetical protein |
| arTal_v1_Chr5_-_2079005_2079005 | 0.60 |
AT5G06720.1
|
PA2
|
peroxidase 2 |
| arTal_v1_Chr2_+_7606728_7606905 | 0.60 |
AT2G17500.2
AT2G17500.1 AT2G17500.3 AT2G17500.4 |
AT2G17500
|
Auxin efflux carrier family protein |
| arTal_v1_Chr4_+_17855637_17855637 | 0.60 |
AT4G37990.1
|
ELI3-2
|
cinnamyl alcohol dehydrogenase 8 |
| arTal_v1_Chr5_-_19977620_19977620 | 0.60 |
AT5G49280.1
|
AT5G49280
|
hydroxyproline-rich glycoprotein family protein |
| arTal_v1_Chr1_-_20849054_20849054 | 0.60 |
AT1G55760.1
|
AT1G55760
|
BTB/POZ domain-containing protein |
| arTal_v1_Chr5_-_14935885_14935885 | 0.60 |
AT5G37600.1
|
GSR 1
|
hypothetical protein |
| arTal_v1_Chr1_+_25473544_25473544 | 0.60 |
AT1G67920.1
|
AT1G67920
|
hypothetical protein |
| arTal_v1_Chr1_+_11945250_11945250 | 0.59 |
AT1G32960.1
|
SBT3.3
|
Subtilase family protein |
| arTal_v1_Chr1_+_24044686_24044771 | 0.59 |
AT1G64710.1
AT1G64710.2 |
AT1G64710
|
GroES-like zinc-binding alcohol dehydrogenase family protein |
| arTal_v1_Chr5_+_2938193_2938193 | 0.59 |
AT5G09440.1
|
EXL4
|
EXORDIUM like 4 |
| arTal_v1_Chr2_-_17882636_17882636 | 0.59 |
AT2G43000.1
AT2G43000.2 |
NAC042
|
NAC domain containing protein 42 |
| arTal_v1_Chr4_-_9421857_9421857 | 0.59 |
AT4G16750.1
|
AT4G16750
|
Integrase-type DNA-binding superfamily protein |
| arTal_v1_Chr3_-_18375940_18375940 | 0.59 |
AT3G49580.1
|
LSU1
|
response to low sulfur 1 |
| arTal_v1_Chr1_-_7534927_7534927 | 0.59 |
AT1G21520.1
|
AT1G21520
|
hypothetical protein |
| arTal_v1_Chr2_+_16303295_16303295 | 0.59 |
AT2G39050.1
|
EULS3
|
hydroxyproline-rich glycoprotein family protein |
| arTal_v1_Chr1_+_13220471_13220471 | 0.59 |
AT1G35710.1
|
AT1G35710
|
kinase family with leucine-rich repeat domain-containing protein |
| arTal_v1_Chr3_+_18634546_18634546 | 0.58 |
AT3G50260.1
|
CEJ1
|
cooperatively regulated by ethylene and jasmonate 1 |
| arTal_v1_Chr1_+_21345445_21345445 | 0.58 |
AT1G57630.1
|
AT1G57630
|
Toll-Interleukin-Resistance (TIR) domain family protein |
| arTal_v1_Chr1_-_5338326_5338326 | 0.58 |
AT1G15520.1
AT1G15520.2 |
ABCG40
|
pleiotropic drug resistance 12 |
| arTal_v1_Chr5_+_7138762_7138762 | 0.58 |
AT5G21020.2
|
AT5G21020
|
transmembrane protein |
| arTal_v1_Chr5_+_16290386_16290386 | 0.58 |
AT5G40690.1
|
AT5G40690
|
histone-lysine N-methyltransferase trithorax-like protein |
| arTal_v1_Chr2_+_13677986_13677986 | 0.58 |
AT2G32210.3
AT2G32210.2 AT2G32210.1 |
AT2G32210
|
cysteine-rich/transmembrane domain A-like protein |
| arTal_v1_Chr1_-_24362054_24362054 | 0.58 |
AT1G65520.1
|
ECI1
|
delta(3), delta(2)-enoyl CoA isomerase 1 |
| arTal_v1_Chr4_+_18530318_18530318 | 0.58 |
AT4G39955.1
|
AT4G39955
|
alpha/beta-Hydrolases superfamily protein |
| arTal_v1_Chr1_-_30142697_30142697 | 0.58 |
AT1G80130.1
|
AT1G80130
|
Tetratricopeptide repeat (TPR)-like superfamily protein |
| arTal_v1_Chr1_-_17076417_17076417 | 0.57 |
AT1G45145.1
|
TRX5
|
thioredoxin H-type 5 |
| arTal_v1_Chr4_-_16344818_16344818 | 0.57 |
AT4G34131.1
|
UGT73B3
|
UDP-glucosyl transferase 73B3 |
| arTal_v1_Chr3_-_3679943_3679943 | 0.57 |
AT3G11660.1
|
NHL1
|
NDR1/HIN1-like 1 |
| arTal_v1_Chr1_+_8102728_8102728 | 0.57 |
AT1G22890.1
|
AT1G22890
|
transmembrane protein |
| arTal_v1_Chr3_+_4603885_4603885 | 0.57 |
AT3G13950.1
|
AT3G13950
|
ankyrin |
| arTal_v1_Chr4_+_17440177_17440177 | 0.57 |
AT4G36990.1
|
HSF4
|
heat shock factor 4 |
| arTal_v1_Chr5_-_1580875_1580875 | 0.56 |
AT5G05340.1
|
PRX52
|
Peroxidase superfamily protein |
| arTal_v1_Chr3_-_10047453_10047453 | 0.56 |
AT3G27210.1
|
AT3G27210
|
hypothetical protein |
| arTal_v1_Chr5_+_20436426_20436426 | 0.56 |
AT5G50200.1
|
WR3
|
nitrate transmembrane transporter |
| arTal_v1_Chr1_+_5869543_5869543 | 0.56 |
AT1G17170.1
|
GSTU24
|
glutathione S-transferase TAU 24 |
| arTal_v1_Chr2_+_1966806_1966816 | 0.56 |
AT2G05380.1
AT2G05380.2 |
GRP3S
|
glycine-rich protein 3 short isoform |
| arTal_v1_Chr1_+_29502506_29502582 | 0.56 |
AT1G78410.1
AT1G78410.2 |
AT1G78410
|
VQ motif-containing protein |
| arTal_v1_Chr3_+_19089026_19089026 | 0.56 |
AT3G51440.1
|
AT3G51440
|
Calcium-dependent phosphotriesterase superfamily protein |
| arTal_v1_Chr4_+_10818128_10818128 | 0.56 |
AT4G19970.1
|
AT4G19970
|
nucleotide-diphospho-sugar transferase family protein |
| arTal_v1_Chr5_+_26410344_26410447 | 0.56 |
AT5G66040.1
AT5G66040.2 |
STR16
|
sulfurtransferase protein 16 |
| arTal_v1_Chr4_+_6188755_6188755 | 0.56 |
AT4G09830.1
|
AT4G09830
|
nuclear receptor family 2 group C protein |
| arTal_v1_Chr1_-_5645443_5645443 | 0.56 |
AT1G16510.1
|
AT1G16510
|
SAUR-like auxin-responsive protein family |
| arTal_v1_Chr5_+_4488476_4488476 | 0.55 |
AT5G13930.1
|
TT4
|
Chalcone and stilbene synthase family protein |
| arTal_v1_Chr3_-_16024510_16024519 | 0.55 |
AT3G44350.1
AT3G44350.2 |
NAC061
|
NAC domain containing protein 61 |
| arTal_v1_Chr2_-_11295918_11295918 | 0.55 |
AT2G26560.1
|
PLA2A
|
phospholipase A 2A |
| arTal_v1_Chr1_-_23690807_23690807 | 0.55 |
AT1G63840.1
|
AT1G63840
|
RING/U-box superfamily protein |
| arTal_v1_Chr4_+_11269985_11270040 | 0.55 |
AT4G21120.1
AT4G21120.2 |
AAT1
|
amino acid transporter 1 |
| arTal_v1_Chr2_+_12322386_12322386 | 0.55 |
AT2G28710.1
|
AT2G28710
|
C2H2-type zinc finger family protein |
| arTal_v1_Chr5_-_23673287_23673287 | 0.55 |
AT5G58570.1
|
AT5G58570
|
transmembrane protein |
| arTal_v1_Chr1_+_29298243_29298243 | 0.55 |
AT1G77920.1
|
TGA7
|
bZIP transcription factor family protein |
| arTal_v1_Chr4_-_17571743_17571743 | 0.55 |
AT4G37370.1
|
CYP81D8
|
cytochrome P450, family 81, subfamily D, polypeptide 8 |
| arTal_v1_Chr5_-_23896702_23896702 | 0.54 |
AT5G59220.2
|
HAI1
|
PP2C protein (Clade A protein phosphatases type 2C) |
| arTal_v1_Chr4_+_17955110_17955110 | 0.54 |
AT4G38340.2
|
AT4G38340
|
Plant regulator RWP-RK family protein |
| arTal_v1_Chr2_-_8850111_8850111 | 0.54 |
AT2G20560.1
|
AT2G20560
|
DNAJ heat shock family protein |
| arTal_v1_Chr4_-_15903523_15903523 | 0.54 |
AT4G32940.1
|
GAMMA-VPE
|
gamma vacuolar processing enzyme |
| arTal_v1_Chr4_-_12923337_12923431 | 0.54 |
AT4G25225.1
AT4G25225.2 |
AT4G25225
|
transmembrane protein |
| arTal_v1_Chr1_-_9973942_9973942 | 0.54 |
AT1G28400.1
|
AT1G28400
|
GATA zinc finger protein |
| arTal_v1_Chr4_+_744804_744804 | 0.54 |
AT4G01720.1
|
WRKY47
|
WRKY family transcription factor |
| arTal_v1_Chr1_+_19515143_19515151 | 0.54 |
AT1G52400.3
AT1G52400.2 |
BGLU18
|
beta glucosidase 18 |
| arTal_v1_Chr1_-_3671191_3671191 | 0.54 |
AT1G10990.1
AT1G10990.2 |
AT1G10990
|
transmembrane protein |
| arTal_v1_Chr2_+_17165191_17165191 | 0.54 |
AT2G41180.1
|
SIB2
|
VQ motif-containing protein |
| arTal_v1_Chr5_-_1935840_1935840 | 0.54 |
AT5G06330.1
|
AT5G06330
|
Late embryogenesis abundant (LEA) hydroxyproline-rich glycoprotein family |
| arTal_v1_Chr5_-_19381190_19381190 | 0.54 |
AT5G47850.1
|
CCR4
|
CRINKLY4 related 4 |
| arTal_v1_Chr2_+_13674255_13674398 | 0.54 |
AT2G32190.2
AT2G32190.1 |
AT2G32190
|
cysteine-rich/transmembrane domain A-like protein |
| arTal_v1_Chr5_+_19616066_19616066 | 0.54 |
AT5G48400.1
AT5G48400.2 |
ATGLR1.2
|
Glutamate receptor family protein |
| arTal_v1_Chr4_-_18386811_18386811 | 0.54 |
AT4G39580.1
|
AT4G39580
|
Galactose oxidase/kelch repeat superfamily protein |
| arTal_v1_Chr2_+_10906460_10906460 | 0.53 |
AT2G25625.2
|
AT2G25625
|
histone deacetylase-like protein |
| arTal_v1_Chr5_-_23896939_23896939 | 0.53 |
AT5G59220.1
|
HAI1
|
PP2C protein (Clade A protein phosphatases type 2C) |
| arTal_v1_Chr2_-_12499723_12499723 | 0.53 |
AT2G29090.1
AT2G29090.2 AT2G29090.4 |
CYP707A2
|
cytochrome P450, family 707, subfamily A, polypeptide 2 |
| arTal_v1_Chr5_+_15634444_15634444 | 0.53 |
AT5G39050.1
|
PMAT1
|
HXXXD-type acyl-transferase family protein |
| arTal_v1_Chr5_+_5995479_5995479 | 0.53 |
AT5G18130.2
|
AT5G18130
|
transmembrane protein |
| arTal_v1_Chr1_-_638681_638681 | 0.53 |
AT1G02870.1
|
AT1G02870
|
nucleolar-like protein |
| arTal_v1_Chr4_-_7494234_7494234 | 0.53 |
AT4G12735.1
|
AT4G12735
|
hypothetical protein |
| arTal_v1_Chr5_+_5995323_5995323 | 0.53 |
AT5G18130.1
|
AT5G18130
|
transmembrane protein |
| arTal_v1_Chr4_+_7239200_7239200 | 0.53 |
AT4G12080.1
|
AHL1
|
AT-hook motif nuclear-localized protein 1 |
| arTal_v1_Chr1_-_23019494_23019494 | 0.53 |
AT1G62300.1
|
WRKY6
|
WRKY family transcription factor |
| arTal_v1_Chr5_+_18390942_18390942 | 0.53 |
AT5G45380.1
|
DUR3
|
urea-proton symporter DEGRADATION OF UREA 3 (DUR3) |
| arTal_v1_Chr5_-_763322_763322 | 0.53 |
AT5G03210.1
|
DIP2
|
E3 ubiquitin-protein ligase |
| arTal_v1_Chr4_+_17954710_17954710 | 0.52 |
AT4G38340.1
|
AT4G38340
|
Plant regulator RWP-RK family protein |
| arTal_v1_Chr1_-_4621585_4621585 | 0.52 |
AT1G13470.1
|
AT1G13470
|
hypothetical protein (DUF1262) |
| arTal_v1_Chr4_+_14348637_14348637 | 0.52 |
AT4G29110.1
|
AT4G29110
|
cotton fiber protein |
| arTal_v1_Chr3_-_11468857_11468857 | 0.52 |
AT3G29636.1
|
AT3G29636
|
transferase-like protein |
| arTal_v1_Chr2_+_1564056_1564056 | 0.52 |
AT2G04495.1
|
AT2G04495
|
transmembrane protein |
| arTal_v1_Chr5_+_9683988_9683988 | 0.52 |
AT5G27420.1
|
CNI1
|
carbon/nitrogen insensitive 1 |
| arTal_v1_Chr5_+_17451488_17451488 | 0.52 |
AT5G43420.1
|
AT5G43420
|
RING/U-box superfamily protein |
| arTal_v1_Chr2_+_10906215_10906215 | 0.52 |
AT2G25625.1
|
AT2G25625
|
histone deacetylase-like protein |
| arTal_v1_Chr4_+_14065992_14065992 | 0.52 |
AT4G28460.1
|
AT4G28460
|
transmembrane protein |
| arTal_v1_Chr1_+_5389952_5389952 | 0.52 |
AT1G15670.1
|
AT1G15670
|
Galactose oxidase/kelch repeat superfamily protein |
| arTal_v1_Chr5_+_4268532_4268532 | 0.52 |
AT5G13320.3
|
PBS3
|
Auxin-responsive GH3 family protein |
| arTal_v1_Chr5_-_1570609_1570609 | 0.52 |
AT5G05300.1
|
AT5G05300
|
hypothetical protein |
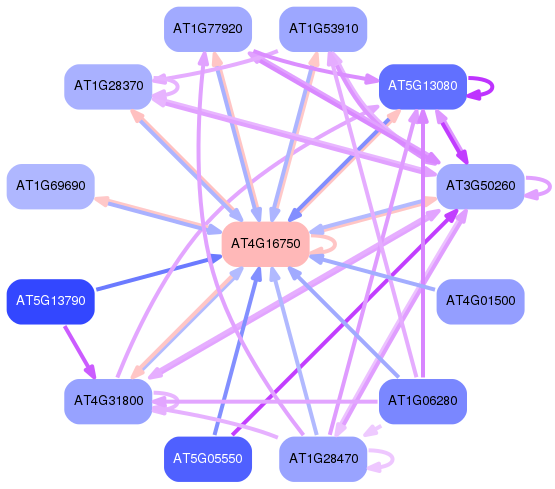
Network of associatons between targets according to the STRING database.

First level regulatory network of AT4G16750
Gene Ontology Analysis
Gene overrepresentation in biological process category:
| Log-likelihood per target | Total log-likelihood | Term | Description |
|---|---|---|---|
| 0.5 | 1.5 | GO:0002215 | defense response to nematode(GO:0002215) |
| 0.5 | 1.5 | GO:0016046 | detection of fungus(GO:0016046) |
| 0.4 | 2.3 | GO:0051176 | positive regulation of sulfur metabolic process(GO:0051176) |
| 0.4 | 1.4 | GO:0048838 | release of seed from dormancy(GO:0048838) exit from dormancy(GO:0097438) |
| 0.3 | 1.4 | GO:0016139 | glycoside catabolic process(GO:0016139) |
| 0.3 | 1.0 | GO:0016124 | tetraterpenoid catabolic process(GO:0016110) carotenoid catabolic process(GO:0016118) xanthophyll catabolic process(GO:0016124) |
| 0.3 | 1.0 | GO:0016107 | sesquiterpenoid catabolic process(GO:0016107) apocarotenoid catabolic process(GO:0043290) abscisic acid catabolic process(GO:0046345) |
| 0.3 | 0.9 | GO:0015802 | basic amino acid transport(GO:0015802) |
| 0.3 | 0.9 | GO:0071422 | thiosulfate transport(GO:0015709) succinate transmembrane transport(GO:0071422) |
| 0.3 | 0.6 | GO:1900378 | positive regulation of secondary metabolite biosynthetic process(GO:1900378) |
| 0.3 | 0.3 | GO:0046217 | toxin biosynthetic process(GO:0009403) indole phytoalexin biosynthetic process(GO:0009700) indole phytoalexin metabolic process(GO:0046217) phytoalexin metabolic process(GO:0052314) phytoalexin biosynthetic process(GO:0052315) |
| 0.3 | 1.3 | GO:0009759 | indole glucosinolate biosynthetic process(GO:0009759) |
| 0.3 | 1.8 | GO:0009745 | sucrose mediated signaling(GO:0009745) |
| 0.2 | 0.5 | GO:0071467 | cellular response to pH(GO:0071467) |
| 0.2 | 0.9 | GO:0009871 | jasmonic acid and ethylene-dependent systemic resistance, ethylene mediated signaling pathway(GO:0009871) |
| 0.2 | 0.7 | GO:0010055 | atrichoblast differentiation(GO:0010055) |
| 0.2 | 0.7 | GO:0010618 | aerenchyma formation(GO:0010618) |
| 0.2 | 0.9 | GO:0015692 | lead ion transport(GO:0015692) |
| 0.2 | 0.7 | GO:0010597 | green leaf volatile biosynthetic process(GO:0010597) |
| 0.2 | 1.0 | GO:0051091 | positive regulation of sequence-specific DNA binding transcription factor activity(GO:0051091) |
| 0.2 | 0.6 | GO:0044236 | collagen metabolic process(GO:0032963) multicellular organism metabolic process(GO:0044236) multicellular organismal macromolecule metabolic process(GO:0044259) |
| 0.2 | 0.2 | GO:0010447 | response to acidic pH(GO:0010447) |
| 0.2 | 2.2 | GO:0052317 | camalexin biosynthetic process(GO:0010120) camalexin metabolic process(GO:0052317) |
| 0.2 | 1.8 | GO:0010188 | response to microbial phytotoxin(GO:0010188) |
| 0.2 | 1.4 | GO:0010438 | cellular response to sulfur starvation(GO:0010438) |
| 0.2 | 1.9 | GO:0050691 | regulation of defense response to virus by host(GO:0050691) |
| 0.2 | 0.8 | GO:0019567 | pentose biosynthetic process(GO:0019322) arabinose biosynthetic process(GO:0019567) |
| 0.2 | 0.6 | GO:0018119 | protein nitrosylation(GO:0017014) peptidyl-cysteine S-nitrosylation(GO:0018119) peptidyl-cysteine S-trans-nitrosylation(GO:0035606) |
| 0.2 | 0.9 | GO:0006564 | L-serine biosynthetic process(GO:0006564) |
| 0.2 | 1.2 | GO:0006597 | spermine biosynthetic process(GO:0006597) |
| 0.2 | 2.5 | GO:0001676 | long-chain fatty acid metabolic process(GO:0001676) |
| 0.2 | 1.7 | GO:0070301 | cellular response to hydrogen peroxide(GO:0070301) |
| 0.2 | 0.7 | GO:0019343 | cysteine biosynthetic process via cystathionine(GO:0019343) |
| 0.2 | 0.3 | GO:0051291 | protein heterooligomerization(GO:0051291) |
| 0.2 | 0.5 | GO:1902289 | negative regulation of defense response to oomycetes(GO:1902289) |
| 0.2 | 5.4 | GO:0009718 | anthocyanin-containing compound biosynthetic process(GO:0009718) |
| 0.2 | 0.6 | GO:1900409 | positive regulation of cellular response to oxidative stress(GO:1900409) |
| 0.2 | 0.8 | GO:0045730 | respiratory burst involved in defense response(GO:0002679) respiratory burst(GO:0045730) |
| 0.2 | 0.5 | GO:0051204 | protein insertion into membrane from inner side(GO:0032978) protein insertion into mitochondrial membrane from inner side(GO:0032979) protein insertion into mitochondrial membrane(GO:0051204) |
| 0.2 | 1.0 | GO:0043090 | amino acid import(GO:0043090) |
| 0.2 | 0.5 | GO:0032490 | detection of molecule of bacterial origin(GO:0032490) |
| 0.1 | 0.4 | GO:0009221 | deoxyribonucleoside triphosphate biosynthetic process(GO:0009202) pyrimidine deoxyribonucleoside triphosphate metabolic process(GO:0009211) pyrimidine deoxyribonucleotide metabolic process(GO:0009219) pyrimidine deoxyribonucleotide biosynthetic process(GO:0009221) 2'-deoxyribonucleotide biosynthetic process(GO:0009265) deoxyribose phosphate biosynthetic process(GO:0046385) |
| 0.1 | 0.3 | GO:0018874 | benzoate metabolic process(GO:0018874) |
| 0.1 | 2.5 | GO:0046149 | chlorophyll catabolic process(GO:0015996) pigment catabolic process(GO:0046149) |
| 0.1 | 0.1 | GO:0010107 | potassium ion import(GO:0010107) potassium ion import across plasma membrane(GO:1990573) |
| 0.1 | 1.3 | GO:0000304 | response to singlet oxygen(GO:0000304) |
| 0.1 | 1.1 | GO:0006089 | lactate metabolic process(GO:0006089) methylglyoxal metabolic process(GO:0009438) methylglyoxal catabolic process to D-lactate via S-lactoyl-glutathione(GO:0019243) ketone catabolic process(GO:0042182) methylglyoxal catabolic process(GO:0051596) methylglyoxal catabolic process to lactate(GO:0061727) |
| 0.1 | 0.4 | GO:0030970 | retrograde protein transport, ER to cytosol(GO:0030970) endoplasmic reticulum to cytosol transport(GO:1903513) |
| 0.1 | 0.6 | GO:0030643 | cellular phosphate ion homeostasis(GO:0030643) cellular trivalent inorganic anion homeostasis(GO:0072502) |
| 0.1 | 0.6 | GO:0034720 | histone H3-K4 demethylation(GO:0034720) |
| 0.1 | 0.1 | GO:0009200 | deoxyribonucleoside triphosphate metabolic process(GO:0009200) 2'-deoxyribonucleotide metabolic process(GO:0009394) deoxyribose phosphate metabolic process(GO:0019692) |
| 0.1 | 5.9 | GO:0009625 | response to insect(GO:0009625) |
| 0.1 | 0.8 | GO:0006624 | vacuolar protein processing(GO:0006624) |
| 0.1 | 1.1 | GO:0009939 | positive regulation of gibberellic acid mediated signaling pathway(GO:0009939) |
| 0.1 | 0.4 | GO:0042351 | 'de novo' GDP-L-fucose biosynthetic process(GO:0042351) |
| 0.1 | 0.3 | GO:0006571 | tyrosine biosynthetic process(GO:0006571) |
| 0.1 | 0.3 | GO:0031349 | positive regulation of defense response(GO:0031349) |
| 0.1 | 0.5 | GO:0080029 | cellular response to boron-containing substance levels(GO:0080029) |
| 0.1 | 0.5 | GO:0010336 | gibberellic acid homeostasis(GO:0010336) |
| 0.1 | 0.3 | GO:1902347 | response to strigolactone(GO:1902347) |
| 0.1 | 1.6 | GO:0009684 | indoleacetic acid biosynthetic process(GO:0009684) |
| 0.1 | 1.0 | GO:0009061 | anaerobic respiration(GO:0009061) |
| 0.1 | 0.1 | GO:0071280 | cellular response to copper ion(GO:0071280) |
| 0.1 | 0.4 | GO:0006369 | termination of RNA polymerase II transcription(GO:0006369) |
| 0.1 | 0.6 | GO:0097034 | respiratory chain complex IV assembly(GO:0008535) mitochondrial respiratory chain complex IV assembly(GO:0033617) mitochondrial respiratory chain complex IV biogenesis(GO:0097034) |
| 0.1 | 0.5 | GO:0070676 | intralumenal vesicle formation(GO:0070676) |
| 0.1 | 0.4 | GO:0006990 | positive regulation of transcription from RNA polymerase II promoter involved in unfolded protein response(GO:0006990) positive regulation of transcription from RNA polymerase II promoter involved in cellular response to chemical stimulus(GO:1901522) |
| 0.1 | 0.4 | GO:1902065 | response to L-glutamate(GO:1902065) |
| 0.1 | 0.6 | GO:0034052 | positive regulation of plant-type hypersensitive response(GO:0034052) |
| 0.1 | 0.4 | GO:0010289 | homogalacturonan biosynthetic process(GO:0010289) |
| 0.1 | 1.8 | GO:0009697 | salicylic acid biosynthetic process(GO:0009697) |
| 0.1 | 0.2 | GO:1902586 | transport of virus in host, cell to cell(GO:0046740) multi-organism intercellular transport(GO:1902586) |
| 0.1 | 0.2 | GO:0009268 | response to pH(GO:0009268) |
| 0.1 | 0.5 | GO:0000455 | enzyme-directed rRNA pseudouridine synthesis(GO:0000455) |
| 0.1 | 0.1 | GO:1990019 | protein storage vacuole organization(GO:1990019) |
| 0.1 | 0.3 | GO:0009727 | detection of ethylene stimulus(GO:0009727) |
| 0.1 | 0.5 | GO:1902751 | positive regulation of G2/M transition of mitotic cell cycle(GO:0010971) positive regulation of cell cycle G2/M phase transition(GO:1902751) |
| 0.1 | 0.6 | GO:1902418 | (+)-abscisic acid D-glucopyranosyl ester transmembrane transport(GO:1902418) |
| 0.1 | 0.8 | GO:0090059 | protoxylem development(GO:0090059) |
| 0.1 | 0.2 | GO:0006825 | copper ion transport(GO:0006825) |
| 0.1 | 1.4 | GO:0015706 | nitrate transport(GO:0015706) |
| 0.1 | 0.4 | GO:0080024 | indolebutyric acid metabolic process(GO:0080024) |
| 0.1 | 0.4 | GO:0071323 | cellular response to chitin(GO:0071323) |
| 0.1 | 0.4 | GO:0035264 | multicellular organism growth(GO:0035264) |
| 0.1 | 0.3 | GO:0032000 | positive regulation of fatty acid beta-oxidation(GO:0032000) positive regulation of lipid catabolic process(GO:0050996) |
| 0.1 | 0.2 | GO:0010288 | response to lead ion(GO:0010288) |
| 0.1 | 0.5 | GO:1903313 | positive regulation of mRNA metabolic process(GO:1903313) |
| 0.1 | 0.4 | GO:0033306 | phytol metabolic process(GO:0033306) |
| 0.1 | 0.2 | GO:0006569 | tryptophan catabolic process(GO:0006569) indolalkylamine catabolic process(GO:0046218) |
| 0.1 | 0.3 | GO:0035246 | peptidyl-arginine methylation, to asymmetrical-dimethyl arginine(GO:0019919) peptidyl-arginine N-methylation(GO:0035246) peptidyl-arginine omega-N-methylation(GO:0035247) |
| 0.1 | 0.6 | GO:0043066 | apoptotic process(GO:0006915) regulation of apoptotic process(GO:0042981) negative regulation of apoptotic process(GO:0043066) |
| 0.1 | 0.3 | GO:0010507 | negative regulation of autophagy(GO:0010507) |
| 0.1 | 0.5 | GO:1902626 | assembly of large subunit precursor of preribosome(GO:1902626) |
| 0.1 | 1.0 | GO:0010112 | regulation of systemic acquired resistance(GO:0010112) |
| 0.1 | 0.1 | GO:0007021 | tubulin complex assembly(GO:0007021) |
| 0.1 | 1.0 | GO:0010244 | response to low fluence blue light stimulus by blue low-fluence system(GO:0010244) |
| 0.1 | 0.3 | GO:0019859 | thymine catabolic process(GO:0006210) uracil catabolic process(GO:0006212) beta-alanine biosynthetic process(GO:0019483) thymine metabolic process(GO:0019859) |
| 0.1 | 0.8 | GO:0043928 | exonucleolytic nuclear-transcribed mRNA catabolic process involved in deadenylation-dependent decay(GO:0043928) |
| 0.1 | 0.2 | GO:0019740 | nitrogen utilization(GO:0019740) |
| 0.1 | 0.8 | GO:0070370 | cellular heat acclimation(GO:0070370) |
| 0.1 | 0.4 | GO:1902457 | negative regulation of stomatal opening(GO:1902457) |
| 0.1 | 0.5 | GO:0051180 | vitamin transport(GO:0051180) |
| 0.1 | 0.4 | GO:1901001 | negative regulation of response to salt stress(GO:1901001) |
| 0.1 | 0.5 | GO:0010310 | regulation of hydrogen peroxide metabolic process(GO:0010310) |
| 0.1 | 0.2 | GO:0033530 | raffinose metabolic process(GO:0033530) |
| 0.1 | 0.5 | GO:0051051 | negative regulation of anion channel activity(GO:0010360) regulation of anion channel activity by blue light(GO:0010361) negative regulation of anion channel activity by blue light(GO:0010362) negative regulation of transporter activity(GO:0032410) negative regulation of ion transmembrane transporter activity(GO:0032413) negative regulation of transmembrane transport(GO:0034763) negative regulation of ion transmembrane transport(GO:0034766) negative regulation of ion transport(GO:0043271) negative regulation of transport(GO:0051051) negative regulation of anion transport(GO:1903792) negative regulation of anion transmembrane transport(GO:1903960) |
| 0.1 | 0.2 | GO:0048281 | inflorescence morphogenesis(GO:0048281) |
| 0.1 | 2.3 | GO:0060548 | negative regulation of cell death(GO:0060548) |
| 0.1 | 0.4 | GO:2000036 | regulation of stem cell population maintenance(GO:2000036) regulation of stem cell differentiation(GO:2000736) |
| 0.1 | 0.5 | GO:0009819 | drought recovery(GO:0009819) |
| 0.1 | 0.7 | GO:0017006 | protein-tetrapyrrole linkage(GO:0017006) |
| 0.1 | 0.3 | GO:0009720 | detection of hormone stimulus(GO:0009720) detection of endogenous stimulus(GO:0009726) |
| 0.1 | 1.1 | GO:0009861 | jasmonic acid and ethylene-dependent systemic resistance(GO:0009861) |
| 0.1 | 0.4 | GO:0006103 | 2-oxoglutarate metabolic process(GO:0006103) aspartate metabolic process(GO:0006531) |
| 0.1 | 0.3 | GO:1904062 | regulation of potassium ion transmembrane transport(GO:1901379) regulation of cation transmembrane transport(GO:1904062) |
| 0.1 | 0.3 | GO:0006004 | fucose metabolic process(GO:0006004) fucose biosynthetic process(GO:0042353) |
| 0.1 | 0.4 | GO:0009557 | antipodal cell differentiation(GO:0009557) |
| 0.1 | 1.2 | GO:0052324 | plant-type cell wall cellulose biosynthetic process(GO:0052324) |
| 0.1 | 0.4 | GO:0035865 | cellular response to potassium ion(GO:0035865) |
| 0.1 | 0.2 | GO:1901654 | response to silver ion(GO:0010272) response to cycloheximide(GO:0046898) cellular response to biotic stimulus(GO:0071216) cellular response to external biotic stimulus(GO:0071217) response to ketone(GO:1901654) |
| 0.1 | 0.3 | GO:0048464 | sepal development(GO:0048442) flower calyx development(GO:0048464) |
| 0.1 | 0.4 | GO:0019048 | modulation by virus of host morphology or physiology(GO:0019048) |
| 0.1 | 0.7 | GO:0052482 | defense response by cell wall thickening(GO:0052482) |
| 0.1 | 3.5 | GO:0043562 | cellular response to nitrogen levels(GO:0043562) |
| 0.1 | 0.4 | GO:0070525 | tRNA threonylcarbamoyladenosine metabolic process(GO:0070525) |
| 0.1 | 1.0 | GO:0042343 | indole glucosinolate metabolic process(GO:0042343) |
| 0.1 | 0.3 | GO:0010185 | regulation of cellular defense response(GO:0010185) |
| 0.1 | 0.3 | GO:0046416 | D-amino acid metabolic process(GO:0046416) |
| 0.1 | 0.3 | GO:0000492 | box C/D snoRNP assembly(GO:0000492) |
| 0.1 | 0.3 | GO:0045046 | protein import into peroxisome membrane(GO:0045046) |
| 0.1 | 3.2 | GO:2000022 | regulation of jasmonic acid mediated signaling pathway(GO:2000022) |
| 0.1 | 0.5 | GO:1900425 | negative regulation of defense response to bacterium(GO:1900425) |
| 0.1 | 0.8 | GO:0045962 | positive regulation of development, heterochronic(GO:0045962) |
| 0.1 | 0.4 | GO:0015939 | pantothenate metabolic process(GO:0015939) pantothenate biosynthetic process(GO:0015940) |
| 0.1 | 1.5 | GO:0010942 | positive regulation of cell death(GO:0010942) |
| 0.1 | 0.6 | GO:0006542 | glutamine biosynthetic process(GO:0006542) |
| 0.1 | 0.2 | GO:2000693 | positive regulation of seed maturation(GO:2000693) |
| 0.1 | 0.4 | GO:0030007 | cellular potassium ion homeostasis(GO:0030007) |
| 0.1 | 0.4 | GO:0019336 | phenol-containing compound catabolic process(GO:0019336) |
| 0.1 | 0.4 | GO:0022898 | regulation of anion channel activity(GO:0010359) regulation of transmembrane transporter activity(GO:0022898) regulation of ion transmembrane transporter activity(GO:0032412) |
| 0.1 | 0.3 | GO:0015697 | quaternary ammonium group transport(GO:0015697) |
| 0.1 | 0.6 | GO:0070813 | hydrogen sulfide metabolic process(GO:0070813) |
| 0.1 | 6.5 | GO:0009615 | response to virus(GO:0009615) |
| 0.1 | 0.4 | GO:0000706 | meiotic DNA double-strand break processing(GO:0000706) DNA double-strand break processing(GO:0000729) |
| 0.1 | 0.8 | GO:0031204 | posttranslational protein targeting to membrane, translocation(GO:0031204) |
| 0.1 | 0.5 | GO:0006567 | threonine catabolic process(GO:0006567) |
| 0.1 | 0.2 | GO:0010246 | rhamnogalacturonan I biosynthetic process(GO:0010246) |
| 0.1 | 1.8 | GO:0030968 | endoplasmic reticulum unfolded protein response(GO:0030968) |
| 0.1 | 0.1 | GO:0090392 | sepal giant cell differentiation(GO:0090392) |
| 0.1 | 1.0 | GO:1900424 | regulation of defense response to bacterium(GO:1900424) |
| 0.1 | 0.7 | GO:0006120 | mitochondrial electron transport, NADH to ubiquinone(GO:0006120) |
| 0.1 | 0.2 | GO:1990258 | box C/D snoRNA 3'-end processing(GO:0000494) peptidyl-glutamine methylation(GO:0018364) box C/D snoRNA metabolic process(GO:0033967) box C/D snoRNA processing(GO:0034963) histone glutamine methylation(GO:1990258) |
| 0.1 | 0.6 | GO:0002221 | pattern recognition receptor signaling pathway(GO:0002221) |
| 0.1 | 0.5 | GO:0009970 | cellular response to sulfate starvation(GO:0009970) |
| 0.1 | 0.2 | GO:0009945 | radial axis specification(GO:0009945) |
| 0.1 | 0.5 | GO:0048578 | positive regulation of long-day photoperiodism, flowering(GO:0048578) |
| 0.1 | 0.3 | GO:0033499 | galactose catabolic process(GO:0019388) galactose catabolic process via UDP-galactose(GO:0033499) |
| 0.1 | 3.1 | GO:0002239 | response to oomycetes(GO:0002239) |
| 0.1 | 0.8 | GO:0048317 | seed morphogenesis(GO:0048317) |
| 0.1 | 0.2 | GO:0051205 | protein insertion into membrane(GO:0051205) |
| 0.1 | 0.5 | GO:0033356 | UDP-L-arabinose metabolic process(GO:0033356) |
| 0.1 | 1.3 | GO:0010555 | response to mannitol(GO:0010555) |
| 0.1 | 0.2 | GO:0036265 | RNA (guanine-N7)-methylation(GO:0036265) wound healing(GO:0042060) rRNA (guanine-N7)-methylation(GO:0070476) callus formation(GO:1990110) |
| 0.1 | 0.2 | GO:0071569 | protein ufmylation(GO:0071569) |
| 0.1 | 0.1 | GO:0071033 | nuclear retention of pre-mRNA at the site of transcription(GO:0071033) |
| 0.1 | 0.9 | GO:0060260 | regulation of transcription initiation from RNA polymerase II promoter(GO:0060260) positive regulation of transcription initiation from RNA polymerase II promoter(GO:0060261) positive regulation of DNA-templated transcription, initiation(GO:2000144) |
| 0.1 | 0.2 | GO:0030030 | cell projection organization(GO:0030030) cell projection assembly(GO:0030031) |
| 0.1 | 0.3 | GO:0055073 | cadmium ion homeostasis(GO:0055073) |
| 0.1 | 0.3 | GO:0006361 | transcription initiation from RNA polymerase I promoter(GO:0006361) |
| 0.1 | 0.2 | GO:0090069 | regulation of ribosome biogenesis(GO:0090069) |
| 0.1 | 0.3 | GO:0046786 | viral replication complex formation and maintenance(GO:0046786) |
| 0.1 | 0.4 | GO:1902767 | farnesyl diphosphate biosynthetic process, mevalonate pathway(GO:0010142) isoprenoid biosynthetic process via mevalonate(GO:1902767) |
| 0.1 | 0.8 | GO:0046337 | phosphatidylethanolamine biosynthetic process(GO:0006646) phosphatidylethanolamine metabolic process(GO:0046337) |
| 0.1 | 0.8 | GO:0043162 | ubiquitin-dependent protein catabolic process via the multivesicular body sorting pathway(GO:0043162) |
| 0.1 | 0.4 | GO:0006285 | base-excision repair, AP site formation(GO:0006285) |
| 0.1 | 0.4 | GO:0006809 | nitric oxide biosynthetic process(GO:0006809) |
| 0.1 | 0.1 | GO:0034058 | endosomal vesicle fusion(GO:0034058) |
| 0.1 | 0.9 | GO:0072662 | protein targeting to peroxisome(GO:0006625) protein localization to peroxisome(GO:0072662) establishment of protein localization to peroxisome(GO:0072663) |
| 0.1 | 0.5 | GO:0046473 | phosphatidic acid metabolic process(GO:0046473) |
| 0.1 | 0.3 | GO:0009068 | aspartate family amino acid catabolic process(GO:0009068) |
| 0.1 | 0.1 | GO:0034614 | cellular response to reactive oxygen species(GO:0034614) |
| 0.1 | 0.5 | GO:0006183 | GTP biosynthetic process(GO:0006183) |
| 0.1 | 0.7 | GO:0090158 | endoplasmic reticulum membrane organization(GO:0090158) |
| 0.1 | 0.6 | GO:1900056 | negative regulation of leaf senescence(GO:1900056) |
| 0.1 | 0.2 | GO:0048833 | specification of organ number(GO:0048832) specification of floral organ number(GO:0048833) |
| 0.1 | 0.4 | GO:0006591 | ornithine metabolic process(GO:0006591) |
| 0.1 | 0.1 | GO:0000050 | urea cycle(GO:0000050) |
| 0.1 | 0.6 | GO:0070131 | regulation of mitochondrial translation(GO:0070129) positive regulation of mitochondrial translation(GO:0070131) |
| 0.1 | 0.2 | GO:0031120 | snRNA pseudouridine synthesis(GO:0031120) |
| 0.1 | 0.3 | GO:0043407 | negative regulation of MAP kinase activity(GO:0043407) negative regulation of MAPK cascade(GO:0043409) |
| 0.1 | 0.5 | GO:0010601 | positive regulation of auxin biosynthetic process(GO:0010601) |
| 0.1 | 0.2 | GO:0072388 | FAD biosynthetic process(GO:0006747) flavin adenine dinucleotide biosynthetic process(GO:0072388) |
| 0.1 | 7.0 | GO:0010200 | response to chitin(GO:0010200) |
| 0.1 | 0.3 | GO:0000082 | G1/S transition of mitotic cell cycle(GO:0000082) |
| 0.1 | 0.3 | GO:0006651 | diacylglycerol biosynthetic process(GO:0006651) |
| 0.1 | 2.0 | GO:0009626 | plant-type hypersensitive response(GO:0009626) |
| 0.1 | 0.5 | GO:0048363 | mucilage pectin metabolic process(GO:0048363) |
| 0.1 | 0.1 | GO:0098661 | inorganic anion transmembrane transport(GO:0098661) |
| 0.1 | 0.8 | GO:0010044 | response to aluminum ion(GO:0010044) |
| 0.1 | 0.2 | GO:1900458 | negative regulation of brassinosteroid mediated signaling pathway(GO:1900458) |
| 0.1 | 0.6 | GO:0006656 | phosphatidylcholine biosynthetic process(GO:0006656) |
| 0.1 | 0.1 | GO:0010353 | response to trehalose(GO:0010353) |
| 0.1 | 0.3 | GO:0006123 | mitochondrial electron transport, cytochrome c to oxygen(GO:0006123) |
| 0.1 | 0.9 | GO:0009593 | detection of chemical stimulus(GO:0009593) |
| 0.1 | 0.2 | GO:0009107 | lipoate biosynthetic process(GO:0009107) |
| 0.1 | 0.1 | GO:0080182 | histone H3-K4 trimethylation(GO:0080182) |
| 0.1 | 0.4 | GO:0071169 | establishment of mitotic sister chromatid cohesion(GO:0034087) establishment of protein localization to chromosome(GO:0070199) rDNA condensation(GO:0070550) establishment of protein localization to chromatin(GO:0071169) transcriptional activation by promoter-enhancer looping(GO:0071733) gene looping(GO:0090202) dsDNA loop formation(GO:0090579) |
| 0.1 | 0.3 | GO:0019287 | isopentenyl diphosphate biosynthetic process, mevalonate pathway(GO:0019287) |
| 0.1 | 0.2 | GO:2000105 | positive regulation of DNA endoreduplication(GO:0032877) positive regulation of DNA-dependent DNA replication(GO:2000105) |
| 0.1 | 0.2 | GO:1902326 | positive regulation of chlorophyll biosynthetic process(GO:1902326) |
| 0.1 | 0.1 | GO:0061062 | nematode larval development(GO:0002119) larval development(GO:0002164) regulation of nematode larval development(GO:0061062) |
| 0.1 | 0.2 | GO:0034247 | snoRNA splicing(GO:0034247) |
| 0.1 | 0.2 | GO:1902916 | regulation of protein polyubiquitination(GO:1902914) positive regulation of protein polyubiquitination(GO:1902916) |
| 0.1 | 0.4 | GO:0010019 | chloroplast-nucleus signaling pathway(GO:0010019) |
| 0.1 | 0.4 | GO:0006801 | superoxide metabolic process(GO:0006801) |
| 0.1 | 1.2 | GO:0010193 | response to ozone(GO:0010193) |
| 0.1 | 1.4 | GO:0009816 | defense response to bacterium, incompatible interaction(GO:0009816) |
| 0.1 | 0.1 | GO:0051601 | exocyst localization(GO:0051601) |
| 0.1 | 0.2 | GO:0034035 | guanosine tetraphosphate metabolic process(GO:0015969) purine ribonucleoside bisphosphate metabolic process(GO:0034035) |
| 0.1 | 0.5 | GO:0097428 | protein maturation by iron-sulfur cluster transfer(GO:0097428) |
| 0.1 | 0.2 | GO:0019320 | hexose catabolic process(GO:0019320) |
| 0.1 | 0.1 | GO:0031118 | rRNA pseudouridine synthesis(GO:0031118) |
| 0.1 | 0.2 | GO:0046037 | GMP biosynthetic process(GO:0006177) GMP metabolic process(GO:0046037) |
| 0.1 | 0.2 | GO:2000037 | regulation of stomatal complex patterning(GO:2000037) |
| 0.1 | 2.7 | GO:0030490 | maturation of SSU-rRNA(GO:0030490) |
| 0.1 | 0.9 | GO:0007029 | endoplasmic reticulum organization(GO:0007029) |
| 0.1 | 0.9 | GO:0097031 | mitochondrial respiratory chain complex I assembly(GO:0032981) mitochondrial respiratory chain complex I biogenesis(GO:0097031) |
| 0.1 | 0.2 | GO:0045332 | phospholipid translocation(GO:0045332) |
| 0.1 | 0.7 | GO:0009051 | pentose-phosphate shunt, oxidative branch(GO:0009051) |
| 0.1 | 0.1 | GO:1901070 | guanosine-containing compound biosynthetic process(GO:1901070) |
| 0.1 | 0.2 | GO:0009772 | photosynthetic electron transport in photosystem II(GO:0009772) |
| 0.1 | 0.4 | GO:0046900 | tetrahydrofolylpolyglutamate metabolic process(GO:0046900) |
| 0.1 | 0.3 | GO:0098869 | cellular oxidant detoxification(GO:0098869) |
| 0.1 | 0.4 | GO:0045039 | protein import into mitochondrial inner membrane(GO:0045039) |
| 0.1 | 0.1 | GO:0034626 | fatty acid elongation, saturated fatty acid(GO:0019367) fatty acid elongation, unsaturated fatty acid(GO:0019368) fatty acid elongation, monounsaturated fatty acid(GO:0034625) fatty acid elongation, polyunsaturated fatty acid(GO:0034626) |
| 0.1 | 0.2 | GO:0018315 | molybdenum incorporation into molybdenum-molybdopterin complex(GO:0018315) metal incorporation into metallo-molybdopterin complex(GO:0042040) |
| 0.1 | 0.6 | GO:0006878 | cellular copper ion homeostasis(GO:0006878) |
| 0.1 | 0.2 | GO:0031930 | mitochondria-nucleus signaling pathway(GO:0031930) |
| 0.1 | 0.5 | GO:0006880 | intracellular sequestering of iron ion(GO:0006880) sequestering of iron ion(GO:0097577) |
| 0.1 | 0.4 | GO:0009957 | epidermal cell fate specification(GO:0009957) |
| 0.1 | 0.2 | GO:0070272 | proton-transporting ATP synthase complex assembly(GO:0043461) proton-transporting ATP synthase complex biogenesis(GO:0070272) |
| 0.1 | 0.9 | GO:0006538 | glutamate catabolic process(GO:0006538) |
| 0.1 | 0.2 | GO:0070863 | regulation of protein exit from endoplasmic reticulum(GO:0070861) positive regulation of protein exit from endoplasmic reticulum(GO:0070863) |
| 0.1 | 0.6 | GO:0030522 | blue light signaling pathway(GO:0009785) intracellular receptor signaling pathway(GO:0030522) |
| 0.1 | 0.3 | GO:0006884 | chloride transport(GO:0006821) cell volume homeostasis(GO:0006884) |
| 0.1 | 0.1 | GO:0048439 | flower morphogenesis(GO:0048439) |
| 0.1 | 1.3 | GO:0030091 | protein repair(GO:0030091) |
| 0.1 | 2.2 | GO:0009407 | toxin metabolic process(GO:0009404) toxin catabolic process(GO:0009407) secondary metabolite catabolic process(GO:0090487) |
| 0.1 | 0.1 | GO:0098740 | pollen tube adhesion(GO:0009865) cell-cell adhesion(GO:0098609) multi organism cell adhesion(GO:0098740) |
| 0.1 | 0.2 | GO:0006386 | termination of RNA polymerase III transcription(GO:0006386) |
| 0.1 | 0.5 | GO:0033683 | nucleotide-excision repair, DNA incision(GO:0033683) |
| 0.1 | 0.2 | GO:0010387 | COP9 signalosome assembly(GO:0010387) |
| 0.1 | 0.6 | GO:0072506 | phosphate ion homeostasis(GO:0055062) trivalent inorganic anion homeostasis(GO:0072506) |
| 0.1 | 0.6 | GO:0009423 | chorismate biosynthetic process(GO:0009423) |
| 0.1 | 0.6 | GO:0000463 | maturation of LSU-rRNA from tricistronic rRNA transcript (SSU-rRNA, 5.8S rRNA, LSU-rRNA)(GO:0000463) |
| 0.1 | 0.2 | GO:0001672 | regulation of chromatin assembly or disassembly(GO:0001672) |
| 0.1 | 0.7 | GO:0046283 | anthocyanin-containing compound metabolic process(GO:0046283) |
| 0.0 | 0.8 | GO:0000266 | mitochondrial fission(GO:0000266) |
| 0.0 | 0.2 | GO:0046365 | pentose catabolic process(GO:0019323) monosaccharide catabolic process(GO:0046365) |
| 0.0 | 0.3 | GO:0071265 | L-methionine biosynthetic process(GO:0071265) |
| 0.0 | 0.1 | GO:0043649 | dicarboxylic acid catabolic process(GO:0043649) |
| 0.0 | 0.3 | GO:0000244 | spliceosomal tri-snRNP complex assembly(GO:0000244) |
| 0.0 | 0.2 | GO:0015739 | sialic acid transport(GO:0015739) |
| 0.0 | 1.1 | GO:0006817 | phosphate ion transport(GO:0006817) |
| 0.0 | 0.0 | GO:0043902 | positive regulation of multi-organism process(GO:0043902) |
| 0.0 | 0.4 | GO:0006086 | acetyl-CoA biosynthetic process from pyruvate(GO:0006086) |
| 0.0 | 0.1 | GO:0090056 | regulation of chlorophyll metabolic process(GO:0090056) |
| 0.0 | 0.3 | GO:0070534 | protein K63-linked ubiquitination(GO:0070534) |
| 0.0 | 0.6 | GO:0006388 | tRNA splicing, via endonucleolytic cleavage and ligation(GO:0006388) |
| 0.0 | 0.1 | GO:0071398 | response to fatty acid(GO:0070542) cellular response to fatty acid(GO:0071398) |
| 0.0 | 0.1 | GO:0060967 | negative regulation of gene silencing by RNA(GO:0060967) negative regulation of RNA interference(GO:1900369) |
| 0.0 | 0.0 | GO:0019419 | sulfate reduction(GO:0019419) |
| 0.0 | 1.1 | GO:0042631 | cellular response to water deprivation(GO:0042631) |
| 0.0 | 3.5 | GO:0010150 | leaf senescence(GO:0010150) |
| 0.0 | 0.5 | GO:0006002 | fructose 6-phosphate metabolic process(GO:0006002) |
| 0.0 | 0.1 | GO:0045857 | regulation of molecular function, epigenetic(GO:0040030) negative regulation of molecular function, epigenetic(GO:0045857) |
| 0.0 | 0.2 | GO:0006107 | oxaloacetate metabolic process(GO:0006107) |
| 0.0 | 0.1 | GO:0043633 | polyadenylation-dependent RNA catabolic process(GO:0043633) polyadenylation-dependent ncRNA catabolic process(GO:0043634) nuclear ncRNA surveillance(GO:0071029) nuclear polyadenylation-dependent rRNA catabolic process(GO:0071035) nuclear polyadenylation-dependent ncRNA catabolic process(GO:0071046) |
| 0.0 | 0.4 | GO:0009610 | response to symbiotic fungus(GO:0009610) |
| 0.0 | 0.4 | GO:0070973 | protein localization to endoplasmic reticulum exit site(GO:0070973) |
| 0.0 | 1.3 | GO:0009789 | positive regulation of abscisic acid-activated signaling pathway(GO:0009789) |
| 0.0 | 0.6 | GO:0006857 | oligopeptide transport(GO:0006857) peptide transport(GO:0015833) |
| 0.0 | 0.1 | GO:0055047 | generative cell mitosis(GO:0055047) |
| 0.0 | 0.9 | GO:0032968 | positive regulation of transcription elongation from RNA polymerase II promoter(GO:0032968) |
| 0.0 | 0.0 | GO:0010071 | root meristem specification(GO:0010071) |
| 0.0 | 0.5 | GO:0016554 | cytidine to uridine editing(GO:0016554) |
| 0.0 | 0.6 | GO:0006188 | IMP biosynthetic process(GO:0006188) |
| 0.0 | 0.1 | GO:0090143 | nucleoid organization(GO:0090143) |
| 0.0 | 0.1 | GO:0060776 | simple leaf morphogenesis(GO:0060776) |
| 0.0 | 0.1 | GO:0046156 | siroheme biosynthetic process(GO:0019354) siroheme metabolic process(GO:0046156) |
| 0.0 | 0.2 | GO:0048530 | fruit morphogenesis(GO:0048530) |
| 0.0 | 0.5 | GO:0006896 | Golgi to vacuole transport(GO:0006896) |
| 0.0 | 0.2 | GO:1901004 | ubiquinone-6 metabolic process(GO:1901004) ubiquinone-6 biosynthetic process(GO:1901006) |
| 0.0 | 1.0 | GO:0006012 | galactose metabolic process(GO:0006012) |
| 0.0 | 0.4 | GO:0051131 | chaperone-mediated protein complex assembly(GO:0051131) |
| 0.0 | 0.6 | GO:0018231 | peptidyl-L-cysteine S-palmitoylation(GO:0018230) peptidyl-S-diacylglycerol-L-cysteine biosynthetic process from peptidyl-cysteine(GO:0018231) |
| 0.0 | 0.2 | GO:0034620 | cellular response to unfolded protein(GO:0034620) |
| 0.0 | 0.3 | GO:0007205 | protein kinase C-activating G-protein coupled receptor signaling pathway(GO:0007205) |
| 0.0 | 0.1 | GO:0060628 | regulation of ER to Golgi vesicle-mediated transport(GO:0060628) |
| 0.0 | 0.2 | GO:0032456 | endocytic recycling(GO:0032456) |
| 0.0 | 0.1 | GO:0001173 | DNA-templated transcriptional start site selection(GO:0001173) |
| 0.0 | 0.7 | GO:0006623 | protein targeting to vacuole(GO:0006623) protein localization to vacuole(GO:0072665) establishment of protein localization to vacuole(GO:0072666) |
| 0.0 | 0.2 | GO:0015691 | cadmium ion transport(GO:0015691) |
| 0.0 | 0.2 | GO:0072531 | pyrimidine-containing compound transmembrane transport(GO:0072531) |
| 0.0 | 0.2 | GO:0007041 | lysosomal transport(GO:0007041) endosome to lysosome transport(GO:0008333) |
| 0.0 | 0.2 | GO:0015914 | phospholipid transport(GO:0015914) |
| 0.0 | 0.3 | GO:0002238 | response to molecule of fungal origin(GO:0002238) |
| 0.0 | 0.4 | GO:0009870 | defense response signaling pathway, resistance gene-dependent(GO:0009870) |
| 0.0 | 0.4 | GO:0006607 | NLS-bearing protein import into nucleus(GO:0006607) |
| 0.0 | 0.4 | GO:0045836 | positive regulation of meiotic nuclear division(GO:0045836) |
| 0.0 | 0.2 | GO:0052543 | callose deposition in cell wall(GO:0052543) |
| 0.0 | 0.2 | GO:0016559 | peroxisome fission(GO:0016559) |
| 0.0 | 0.1 | GO:1905181 | regulation of urease activity(GO:1905181) positive regulation of urease activity(GO:1905182) |
| 0.0 | 0.2 | GO:0060866 | leaf abscission(GO:0060866) |
| 0.0 | 0.1 | GO:2000072 | regulation of defense response to fungus, incompatible interaction(GO:2000072) |
| 0.0 | 0.2 | GO:0006370 | 7-methylguanosine mRNA capping(GO:0006370) |
| 0.0 | 0.0 | GO:0031125 | rRNA 3'-end processing(GO:0031125) |
| 0.0 | 1.9 | GO:0006888 | ER to Golgi vesicle-mediated transport(GO:0006888) |
| 0.0 | 0.2 | GO:0080183 | response to photooxidative stress(GO:0080183) |
| 0.0 | 0.2 | GO:1901527 | abscisic acid-activated signaling pathway involved in stomatal movement(GO:1901527) |
| 0.0 | 0.1 | GO:0071494 | cellular response to UV-C(GO:0071494) |
| 0.0 | 0.1 | GO:0006513 | protein monoubiquitination(GO:0006513) |
| 0.0 | 0.1 | GO:0015800 | acidic amino acid transport(GO:0015800) |
| 0.0 | 0.3 | GO:0000387 | spliceosomal snRNP assembly(GO:0000387) |
| 0.0 | 0.2 | GO:0080009 | mRNA methylation(GO:0080009) |
| 0.0 | 0.3 | GO:0006264 | mitochondrial DNA replication(GO:0006264) |
| 0.0 | 0.9 | GO:0030150 | protein import into mitochondrial matrix(GO:0030150) |
| 0.0 | 0.3 | GO:0071051 | nuclear RNA surveillance(GO:0071027) polyadenylation-dependent snoRNA 3'-end processing(GO:0071051) |
| 0.0 | 0.1 | GO:0098532 | histone H3-K27 trimethylation(GO:0098532) regulation of histone H3-K27 trimethylation(GO:1902464) |
| 0.0 | 0.2 | GO:0080190 | lateral growth(GO:0080190) |
| 0.0 | 0.8 | GO:0006914 | autophagy(GO:0006914) |
| 0.0 | 0.1 | GO:1901535 | regulation of DNA demethylation(GO:1901535) |
| 0.0 | 0.1 | GO:0010337 | regulation of salicylic acid metabolic process(GO:0010337) |
| 0.0 | 1.3 | GO:0000302 | response to reactive oxygen species(GO:0000302) |
| 0.0 | 0.1 | GO:0043693 | monoterpene biosynthetic process(GO:0043693) |
| 0.0 | 0.2 | GO:0006000 | fructose metabolic process(GO:0006000) |
| 0.0 | 0.1 | GO:0032786 | positive regulation of DNA-templated transcription, elongation(GO:0032786) |
| 0.0 | 0.2 | GO:0010821 | regulation of mitochondrion organization(GO:0010821) |
| 0.0 | 1.0 | GO:0010286 | heat acclimation(GO:0010286) |
| 0.0 | 0.4 | GO:0035999 | tetrahydrofolate interconversion(GO:0035999) |
| 0.0 | 0.1 | GO:0018065 | protein-cofactor linkage(GO:0018065) |
| 0.0 | 0.5 | GO:0009937 | regulation of gibberellic acid mediated signaling pathway(GO:0009937) |
| 0.0 | 0.3 | GO:0032351 | negative regulation of hormone metabolic process(GO:0032351) |
| 0.0 | 0.6 | GO:0051788 | response to misfolded protein(GO:0051788) |
| 0.0 | 0.3 | GO:0033523 | histone H2B ubiquitination(GO:0033523) |
| 0.0 | 0.3 | GO:0009862 | systemic acquired resistance, salicylic acid mediated signaling pathway(GO:0009862) |
| 0.0 | 0.2 | GO:0070536 | protein K63-linked deubiquitination(GO:0070536) protein K48-linked deubiquitination(GO:0071108) |
| 0.0 | 0.1 | GO:0042149 | cellular response to glucose starvation(GO:0042149) |
| 0.0 | 0.2 | GO:0080027 | response to herbivore(GO:0080027) |
| 0.0 | 0.1 | GO:0034059 | response to anoxia(GO:0034059) |
| 0.0 | 2.1 | GO:0042273 | ribosomal large subunit biogenesis(GO:0042273) |
| 0.0 | 0.1 | GO:0016098 | monoterpenoid metabolic process(GO:0016098) monoterpenoid biosynthetic process(GO:0016099) |
| 0.0 | 0.2 | GO:0030308 | negative regulation of cell growth(GO:0030308) |
| 0.0 | 1.0 | GO:0072329 | monocarboxylic acid catabolic process(GO:0072329) |
| 0.0 | 0.2 | GO:0051365 | cellular response to potassium ion starvation(GO:0051365) |
| 0.0 | 0.8 | GO:0044744 | protein import into nucleus(GO:0006606) protein targeting to nucleus(GO:0044744) |
| 0.0 | 0.2 | GO:0061087 | positive regulation of histone H3-K27 methylation(GO:0061087) |
| 0.0 | 0.2 | GO:0010155 | regulation of proton transport(GO:0010155) |
| 0.0 | 0.3 | GO:1990937 | xylan acetylation(GO:1990937) |
| 0.0 | 0.2 | GO:0006360 | transcription from RNA polymerase I promoter(GO:0006360) |
| 0.0 | 0.3 | GO:0016925 | protein sumoylation(GO:0016925) |
| 0.0 | 0.2 | GO:0000965 | mitochondrial RNA 3'-end processing(GO:0000965) |
| 0.0 | 0.3 | GO:0006368 | transcription elongation from RNA polymerase II promoter(GO:0006368) |
| 0.0 | 0.5 | GO:0050779 | RNA destabilization(GO:0050779) mRNA destabilization(GO:0061157) |
| 0.0 | 0.1 | GO:0019433 | triglyceride catabolic process(GO:0019433) |
| 0.0 | 0.3 | GO:0006491 | N-glycan processing(GO:0006491) |
| 0.0 | 0.2 | GO:0007031 | peroxisome organization(GO:0007031) |
| 0.0 | 0.5 | GO:0009682 | induced systemic resistance(GO:0009682) |
| 0.0 | 0.2 | GO:0010257 | NADH dehydrogenase complex assembly(GO:0010257) NADH dehydrogenase complex (plastoquinone) assembly(GO:0010258) |
| 0.0 | 0.3 | GO:0000103 | sulfate assimilation(GO:0000103) |
| 0.0 | 0.7 | GO:0016144 | S-glycoside biosynthetic process(GO:0016144) glycosinolate biosynthetic process(GO:0019758) glucosinolate biosynthetic process(GO:0019761) |
| 0.0 | 0.8 | GO:0034599 | cellular response to oxidative stress(GO:0034599) |
| 0.0 | 0.1 | GO:0009188 | UDP biosynthetic process(GO:0006225) ribonucleoside diphosphate biosynthetic process(GO:0009188) pyrimidine ribonucleoside diphosphate metabolic process(GO:0009193) pyrimidine ribonucleoside diphosphate biosynthetic process(GO:0009194) UDP metabolic process(GO:0046048) |
| 0.0 | 0.3 | GO:0045116 | protein neddylation(GO:0045116) |
| 0.0 | 0.5 | GO:0071230 | cellular response to amino acid stimulus(GO:0071230) |
| 0.0 | 0.1 | GO:0090213 | regulation of radial pattern formation(GO:0090213) |
| 0.0 | 0.2 | GO:0009855 | determination of bilateral symmetry(GO:0009855) |
| 0.0 | 0.2 | GO:0016444 | somatic cell DNA recombination(GO:0016444) |
| 0.0 | 0.2 | GO:0015846 | polyamine transport(GO:0015846) |
| 0.0 | 0.2 | GO:0052386 | cell wall thickening(GO:0052386) |
| 0.0 | 0.4 | GO:0006465 | signal peptide processing(GO:0006465) |
| 0.0 | 0.1 | GO:0002188 | translation reinitiation(GO:0002188) |
| 0.0 | 0.1 | GO:0072344 | rescue of stalled ribosome(GO:0072344) |
| 0.0 | 0.9 | GO:0090305 | nucleic acid phosphodiester bond hydrolysis(GO:0090305) |
| 0.0 | 0.3 | GO:0006574 | valine catabolic process(GO:0006574) |
| 0.0 | 0.1 | GO:0006106 | fumarate metabolic process(GO:0006106) |
| 0.0 | 0.0 | GO:0060321 | acceptance of pollen(GO:0060321) |
| 0.0 | 0.2 | GO:0006102 | isocitrate metabolic process(GO:0006102) |
| 0.0 | 0.2 | GO:0015749 | monosaccharide transport(GO:0015749) |
| 0.0 | 0.7 | GO:0007166 | cell surface receptor signaling pathway(GO:0007166) |
| 0.0 | 0.3 | GO:0042026 | protein refolding(GO:0042026) |
| 0.0 | 0.1 | GO:0080001 | mucilage extrusion from seed coat(GO:0080001) |
| 0.0 | 0.1 | GO:0010603 | regulation of cytoplasmic mRNA processing body assembly(GO:0010603) |
| 0.0 | 0.2 | GO:0045903 | positive regulation of translational fidelity(GO:0045903) |
| 0.0 | 0.3 | GO:0031348 | negative regulation of defense response(GO:0031348) |
| 0.0 | 0.0 | GO:0016578 | histone deubiquitination(GO:0016578) |
| 0.0 | 0.4 | GO:0010072 | primary shoot apical meristem specification(GO:0010072) |
| 0.0 | 0.4 | GO:0019374 | galactolipid metabolic process(GO:0019374) |
| 0.0 | 0.0 | GO:0006011 | UDP-glucose metabolic process(GO:0006011) |
| 0.0 | 0.9 | GO:0009694 | jasmonic acid metabolic process(GO:0009694) |
| 0.0 | 0.3 | GO:2000024 | regulation of leaf development(GO:2000024) |
| 0.0 | 0.6 | GO:0000245 | spliceosomal complex assembly(GO:0000245) |
| 0.0 | 0.2 | GO:0010031 | circumnutation(GO:0010031) multicellular organismal movement(GO:0050879) |
| 0.0 | 0.3 | GO:0098754 | detoxification(GO:0098754) |
| 0.0 | 0.1 | GO:0010042 | response to manganese ion(GO:0010042) |
| 0.0 | 0.3 | GO:0006563 | L-serine metabolic process(GO:0006563) cysteine biosynthetic process(GO:0019344) |
| 0.0 | 0.1 | GO:0033591 | response to L-ascorbic acid(GO:0033591) |
| 0.0 | 0.8 | GO:0071804 | cellular potassium ion transport(GO:0071804) potassium ion transmembrane transport(GO:0071805) |
| 0.0 | 0.1 | GO:0006998 | nuclear envelope organization(GO:0006998) |
| 0.0 | 0.1 | GO:0006424 | glutamyl-tRNA aminoacylation(GO:0006424) glutaminyl-tRNA aminoacylation(GO:0006425) |
| 0.0 | 0.3 | GO:0006826 | iron ion transport(GO:0006826) |
| 0.0 | 0.2 | GO:0006621 | protein retention in ER lumen(GO:0006621) |
| 0.0 | 0.3 | GO:0009649 | entrainment of circadian clock(GO:0009649) |
| 0.0 | 0.1 | GO:0022610 | cell adhesion(GO:0007155) biological adhesion(GO:0022610) |
| 0.0 | 0.9 | GO:0009749 | response to glucose(GO:0009749) |
| 0.0 | 1.4 | GO:0016579 | protein deubiquitination(GO:0016579) |
| 0.0 | 0.3 | GO:0006892 | post-Golgi vesicle-mediated transport(GO:0006892) Golgi to plasma membrane transport(GO:0006893) |
| 0.0 | 0.2 | GO:1903830 | magnesium ion transmembrane transport(GO:1903830) |
| 0.0 | 0.1 | GO:0046391 | 5-phosphoribose 1-diphosphate biosynthetic process(GO:0006015) 5-phosphoribose 1-diphosphate metabolic process(GO:0046391) |
| 0.0 | 0.1 | GO:0051457 | maintenance of protein location in nucleus(GO:0051457) |
| 0.0 | 0.1 | GO:0010321 | regulation of vegetative phase change(GO:0010321) |
| 0.0 | 0.4 | GO:0006415 | translational termination(GO:0006415) |
| 0.0 | 0.1 | GO:0030174 | regulation of DNA-dependent DNA replication initiation(GO:0030174) |
| 0.0 | 0.3 | GO:0052546 | cell wall pectin metabolic process(GO:0052546) |
| 0.0 | 0.1 | GO:0051099 | positive regulation of binding(GO:0051099) |
| 0.0 | 0.2 | GO:0070646 | protein modification by small protein removal(GO:0070646) |
| 0.0 | 0.3 | GO:0000373 | Group II intron splicing(GO:0000373) |
| 0.0 | 0.1 | GO:0045926 | negative regulation of growth(GO:0045926) |
| 0.0 | 0.8 | GO:0034605 | cellular response to heat(GO:0034605) |
| 0.0 | 0.2 | GO:0017182 | peptidyl-diphthamide metabolic process(GO:0017182) peptidyl-diphthamide biosynthetic process from peptidyl-histidine(GO:0017183) peptidyl-histidine modification(GO:0018202) |
| 0.0 | 0.0 | GO:0018279 | peptidyl-asparagine modification(GO:0018196) protein N-linked glycosylation via asparagine(GO:0018279) |
| 0.0 | 0.2 | GO:0051260 | protein homooligomerization(GO:0051260) |
| 0.0 | 0.1 | GO:0010677 | negative regulation of cellular carbohydrate metabolic process(GO:0010677) |
| 0.0 | 0.4 | GO:0070585 | protein targeting to mitochondrion(GO:0006626) protein localization to mitochondrion(GO:0070585) establishment of protein localization to mitochondrion(GO:0072655) |
| 0.0 | 0.1 | GO:0006670 | sphingosine metabolic process(GO:0006670) diol metabolic process(GO:0034311) diol biosynthetic process(GO:0034312) sphingosine biosynthetic process(GO:0046512) |
| 0.0 | 0.4 | GO:0010099 | regulation of photomorphogenesis(GO:0010099) |
| 0.0 | 0.0 | GO:0019720 | Mo-molybdopterin cofactor biosynthetic process(GO:0006777) Mo-molybdopterin cofactor metabolic process(GO:0019720) molybdopterin cofactor biosynthetic process(GO:0032324) molybdopterin cofactor metabolic process(GO:0043545) prosthetic group metabolic process(GO:0051189) |
| 0.0 | 1.9 | GO:0006457 | protein folding(GO:0006457) |
| 0.0 | 0.2 | GO:0010030 | positive regulation of seed germination(GO:0010030) |
| 0.0 | 0.8 | GO:0006897 | endocytosis(GO:0006897) |
| 0.0 | 2.6 | GO:0036294 | cellular response to decreased oxygen levels(GO:0036294) cellular response to oxygen levels(GO:0071453) cellular response to hypoxia(GO:0071456) |
| 0.0 | 0.1 | GO:1904961 | quiescent center organization(GO:1904961) |
| 0.0 | 0.2 | GO:0018344 | protein geranylgeranylation(GO:0018344) |
| 0.0 | 0.1 | GO:0055070 | copper ion homeostasis(GO:0055070) |
| 0.0 | 2.9 | GO:0008380 | RNA splicing(GO:0008380) |
| 0.0 | 0.1 | GO:0032511 | late endosome to vacuole transport via multivesicular body sorting pathway(GO:0032511) |
| 0.0 | 0.2 | GO:0010274 | hydrotropism(GO:0010274) |
| 0.0 | 0.1 | GO:0032957 | inositol trisphosphate metabolic process(GO:0032957) |
| 0.0 | 0.0 | GO:0046203 | spermidine catabolic process(GO:0046203) |
| 0.0 | 0.1 | GO:0006419 | alanyl-tRNA aminoacylation(GO:0006419) |
| 0.0 | 0.1 | GO:0051014 | actin filament severing(GO:0051014) |
| 0.0 | 0.3 | GO:0010941 | regulation of cell death(GO:0010941) |
| 0.0 | 0.3 | GO:0010229 | inflorescence development(GO:0010229) |
| 0.0 | 0.0 | GO:0051571 | positive regulation of histone H3-K4 methylation(GO:0051571) |
| 0.0 | 0.1 | GO:0043248 | proteasome assembly(GO:0043248) |
| 0.0 | 0.1 | GO:1990428 | miRNA transport(GO:1990428) |
| 0.0 | 0.1 | GO:0051262 | protein tetramerization(GO:0051262) |
| 0.0 | 0.1 | GO:2000574 | positive regulation of ATPase activity(GO:0032781) regulation of microtubule motor activity(GO:2000574) positive regulation of microtubule motor activity(GO:2000576) regulation of ATP-dependent microtubule motor activity, plus-end-directed(GO:2000580) positive regulation of ATP-dependent microtubule motor activity, plus-end-directed(GO:2000582) |
| 0.0 | 0.1 | GO:0016584 | nucleosome positioning(GO:0016584) |
| 0.0 | 0.1 | GO:0031221 | arabinan metabolic process(GO:0031221) |
| 0.0 | 0.4 | GO:0016575 | histone deacetylation(GO:0016575) |
| 0.0 | 0.1 | GO:0044205 | 'de novo' UMP biosynthetic process(GO:0044205) |
| 0.0 | 0.6 | GO:0072657 | protein localization to membrane(GO:0072657) |
| 0.0 | 0.1 | GO:0046685 | response to arsenic-containing substance(GO:0046685) |
| 0.0 | 0.4 | GO:0042274 | ribosomal small subunit biogenesis(GO:0042274) |
| 0.0 | 0.1 | GO:0045851 | pH reduction(GO:0045851) |
| 0.0 | 0.1 | GO:0015074 | DNA integration(GO:0015074) |
| 0.0 | 0.2 | GO:0007568 | aging(GO:0007568) |
| 0.0 | 0.1 | GO:0070141 | response to UV-A(GO:0070141) cellular response to UV-A(GO:0071492) |
| 0.0 | 3.5 | GO:0032446 | protein modification by small protein conjugation(GO:0032446) |
| 0.0 | 0.0 | GO:0033517 | myo-inositol hexakisphosphate biosynthetic process(GO:0010264) myo-inositol hexakisphosphate metabolic process(GO:0033517) |
| 0.0 | 0.4 | GO:0006289 | nucleotide-excision repair(GO:0006289) |
| 0.0 | 0.1 | GO:0045910 | negative regulation of DNA recombination(GO:0045910) |
| 0.0 | 0.1 | GO:0042732 | D-xylose metabolic process(GO:0042732) |
| 0.0 | 0.2 | GO:0033866 | coenzyme A biosynthetic process(GO:0015937) nucleoside bisphosphate biosynthetic process(GO:0033866) ribonucleoside bisphosphate biosynthetic process(GO:0034030) purine nucleoside bisphosphate biosynthetic process(GO:0034033) |
| 0.0 | 0.3 | GO:0006487 | protein N-linked glycosylation(GO:0006487) |
| 0.0 | 0.1 | GO:0046513 | ceramide biosynthetic process(GO:0046513) |
| 0.0 | 0.7 | GO:0015992 | hydrogen transport(GO:0006818) proton transport(GO:0015992) |
| 0.0 | 0.3 | GO:1901420 | negative regulation of response to alcohol(GO:1901420) |
| 0.0 | 0.0 | GO:0043473 | pigmentation(GO:0043473) pigment accumulation(GO:0043476) pigment accumulation in response to UV light(GO:0043478) pigment accumulation in tissues in response to UV light(GO:0043479) pigment accumulation in tissues(GO:0043480) anthocyanin accumulation in tissues in response to UV light(GO:0043481) |
| 0.0 | 0.4 | GO:0009631 | cold acclimation(GO:0009631) |
| 0.0 | 0.2 | GO:0050826 | response to freezing(GO:0050826) |
| 0.0 | 0.2 | GO:0017148 | negative regulation of translation(GO:0017148) negative regulation of cellular amide metabolic process(GO:0034249) |
| 0.0 | 3.8 | GO:0051603 | proteolysis involved in cellular protein catabolic process(GO:0051603) |
Gene overrepresentation in cellular component category:
| Log-likelihood per target | Total log-likelihood | Term | Description |
|---|---|---|---|
| 0.3 | 1.2 | GO:0034663 | endoplasmic reticulum chaperone complex(GO:0034663) |
| 0.3 | 0.8 | GO:0030015 | CCR4-NOT core complex(GO:0030015) |
| 0.2 | 1.5 | GO:0042406 | extrinsic component of endoplasmic reticulum membrane(GO:0042406) |
| 0.2 | 0.2 | GO:0045334 | clathrin-coated endocytic vesicle(GO:0045334) |
| 0.2 | 1.5 | GO:0010168 | ER body(GO:0010168) |
| 0.1 | 1.3 | GO:0000813 | ESCRT I complex(GO:0000813) |
| 0.1 | 0.1 | GO:0034702 | ion channel complex(GO:0034702) cation channel complex(GO:0034703) |
| 0.1 | 0.6 | GO:0005967 | mitochondrial pyruvate dehydrogenase complex(GO:0005967) |
| 0.1 | 0.8 | GO:0034388 | Pwp2p-containing subcomplex of 90S preribosome(GO:0034388) |
| 0.1 | 0.4 | GO:0005775 | vacuolar lumen(GO:0005775) |
| 0.1 | 0.4 | GO:0042709 | succinate-CoA ligase complex(GO:0042709) |
| 0.1 | 0.5 | GO:0031352 | intrinsic component of plastid inner membrane(GO:0031352) integral component of plastid inner membrane(GO:0031353) intrinsic component of chloroplast inner membrane(GO:0031356) integral component of chloroplast inner membrane(GO:0031357) |
| 0.1 | 0.8 | GO:0005784 | Sec61 translocon complex(GO:0005784) |
| 0.1 | 0.3 | GO:0000792 | heterochromatin(GO:0000792) |
| 0.1 | 0.4 | GO:0034715 | pICln-Sm protein complex(GO:0034715) |
| 0.1 | 0.9 | GO:0089701 | U2AF(GO:0089701) |
| 0.1 | 0.4 | GO:0030130 | clathrin coat of trans-Golgi network vesicle(GO:0030130) |
| 0.1 | 0.5 | GO:0016363 | nuclear matrix(GO:0016363) |
| 0.1 | 0.8 | GO:0017119 | Golgi transport complex(GO:0017119) |
| 0.1 | 0.5 | GO:0044613 | nuclear pore central transport channel(GO:0044613) |
| 0.1 | 1.3 | GO:0005779 | integral component of peroxisomal membrane(GO:0005779) intrinsic component of peroxisomal membrane(GO:0031231) |
| 0.1 | 0.2 | GO:0034457 | Mpp10 complex(GO:0034457) |
| 0.1 | 0.9 | GO:0030125 | clathrin vesicle coat(GO:0030125) |
| 0.1 | 1.2 | GO:0005801 | cis-Golgi network(GO:0005801) |
| 0.1 | 0.5 | GO:0031371 | ubiquitin conjugating enzyme complex(GO:0031371) UBC13-MMS2 complex(GO:0031372) |
| 0.1 | 0.3 | GO:0032045 | guanyl-nucleotide exchange factor complex(GO:0032045) |
| 0.1 | 1.3 | GO:0016602 | CCAAT-binding factor complex(GO:0016602) |
| 0.1 | 0.4 | GO:0000408 | EKC/KEOPS complex(GO:0000408) |
| 0.1 | 0.4 | GO:0034098 | VCP-NPL4-UFD1 AAA ATPase complex(GO:0034098) |
| 0.1 | 0.8 | GO:0005849 | mRNA cleavage factor complex(GO:0005849) |
| 0.1 | 2.3 | GO:0031228 | integral component of Golgi membrane(GO:0030173) intrinsic component of Golgi membrane(GO:0031228) |
| 0.1 | 0.3 | GO:0042788 | polysomal ribosome(GO:0042788) |
| 0.1 | 1.0 | GO:0030687 | preribosome, large subunit precursor(GO:0030687) |
| 0.1 | 0.5 | GO:0090395 | plant cell papilla(GO:0090395) |
| 0.1 | 0.5 | GO:0005844 | polysome(GO:0005844) |
| 0.1 | 0.3 | GO:0072588 | box H/ACA snoRNP complex(GO:0031429) box H/ACA RNP complex(GO:0072588) |
| 0.1 | 1.1 | GO:0031305 | integral component of mitochondrial inner membrane(GO:0031305) |
| 0.1 | 1.2 | GO:0031970 | organelle envelope lumen(GO:0031970) |
| 0.1 | 0.2 | GO:0033290 | eukaryotic 48S preinitiation complex(GO:0033290) translation preinitiation complex(GO:0070993) |
| 0.1 | 0.7 | GO:0005744 | mitochondrial inner membrane presequence translocase complex(GO:0005744) |
| 0.1 | 0.4 | GO:0005787 | signal peptidase complex(GO:0005787) |
| 0.1 | 0.2 | GO:0005640 | nuclear outer membrane(GO:0005640) |
| 0.1 | 0.7 | GO:0008180 | COP9 signalosome(GO:0008180) |
| 0.1 | 0.6 | GO:0031428 | box C/D snoRNP complex(GO:0031428) |
| 0.1 | 0.7 | GO:0005682 | U5 snRNP(GO:0005682) |
| 0.1 | 0.1 | GO:0030665 | trans-Golgi network transport vesicle membrane(GO:0012510) clathrin-coated vesicle membrane(GO:0030665) |
| 0.1 | 0.7 | GO:1903561 | extracellular organelle(GO:0043230) extracellular exosome(GO:0070062) extracellular vesicle(GO:1903561) |
| 0.1 | 0.2 | GO:0005851 | eukaryotic translation initiation factor 2B complex(GO:0005851) |
| 0.1 | 0.2 | GO:0030681 | nucleolar ribonuclease P complex(GO:0005655) multimeric ribonuclease P complex(GO:0030681) |
| 0.1 | 0.2 | GO:0000812 | Swr1 complex(GO:0000812) |
| 0.1 | 0.2 | GO:0031304 | intrinsic component of mitochondrial inner membrane(GO:0031304) |
| 0.0 | 0.2 | GO:0005798 | Golgi-associated vesicle(GO:0005798) |
| 0.0 | 4.3 | GO:0000138 | Golgi trans cisterna(GO:0000138) |
| 0.0 | 0.4 | GO:0030118 | clathrin coat(GO:0030118) |
| 0.0 | 0.6 | GO:0005742 | mitochondrial outer membrane translocase complex(GO:0005742) |
| 0.0 | 0.6 | GO:0005763 | mitochondrial small ribosomal subunit(GO:0005763) |
| 0.0 | 0.6 | GO:0000974 | Prp19 complex(GO:0000974) |
| 0.0 | 0.7 | GO:0000176 | nuclear exosome (RNase complex)(GO:0000176) |
| 0.0 | 0.3 | GO:0045252 | oxoglutarate dehydrogenase complex(GO:0045252) |
| 0.0 | 0.4 | GO:0008250 | oligosaccharyltransferase complex(GO:0008250) |
| 0.0 | 0.4 | GO:0090544 | SWI/SNF complex(GO:0016514) BAF-type complex(GO:0090544) |
| 0.0 | 0.2 | GO:0042645 | mitochondrial nucleoid(GO:0042645) |
| 0.0 | 1.9 | GO:0016592 | mediator complex(GO:0016592) |
| 0.0 | 0.2 | GO:0071541 | eukaryotic translation initiation factor 3 complex, eIF3m(GO:0071541) |
| 0.0 | 0.1 | GO:0009514 | glyoxysome(GO:0009514) |
| 0.0 | 0.1 | GO:0008278 | cohesin complex(GO:0008278) |
| 0.0 | 0.3 | GO:0030688 | preribosome, small subunit precursor(GO:0030688) |
| 0.0 | 0.1 | GO:0048188 | Set1C/COMPASS complex(GO:0048188) |
| 0.0 | 0.2 | GO:0031907 | peroxisomal matrix(GO:0005782) microbody lumen(GO:0031907) |
| 0.0 | 0.2 | GO:0034657 | GID complex(GO:0034657) |
| 0.0 | 0.3 | GO:0030127 | COPII vesicle coat(GO:0030127) |
| 0.0 | 0.5 | GO:0045283 | mitochondrial respiratory chain complex II, succinate dehydrogenase complex (ubiquinone)(GO:0005749) succinate dehydrogenase complex (ubiquinone)(GO:0045257) fumarate reductase complex(GO:0045283) |
| 0.0 | 0.3 | GO:0000275 | mitochondrial proton-transporting ATP synthase complex, catalytic core F(1)(GO:0000275) |
| 0.0 | 0.1 | GO:0000811 | GINS complex(GO:0000811) |
| 0.0 | 0.1 | GO:0097361 | CIA complex(GO:0097361) |
| 0.0 | 0.8 | GO:0005771 | multivesicular body(GO:0005771) |
| 0.0 | 0.8 | GO:0010494 | cytoplasmic stress granule(GO:0010494) |
| 0.0 | 0.3 | GO:0016272 | prefoldin complex(GO:0016272) |
| 0.0 | 0.8 | GO:0032040 | small-subunit processome(GO:0032040) |
| 0.0 | 0.5 | GO:0048471 | perinuclear region of cytoplasm(GO:0048471) |
| 0.0 | 0.3 | GO:0005834 | heterotrimeric G-protein complex(GO:0005834) |
| 0.0 | 0.4 | GO:0019774 | proteasome core complex, beta-subunit complex(GO:0019774) |
| 0.0 | 0.2 | GO:0005845 | mRNA cap binding complex(GO:0005845) |
| 0.0 | 0.3 | GO:0072546 | ER membrane protein complex(GO:0072546) |
| 0.0 | 0.9 | GO:0044452 | nucleolar part(GO:0044452) |
| 0.0 | 0.1 | GO:0034272 | phosphatidylinositol 3-kinase complex(GO:0005942) phosphatidylinositol 3-kinase complex, class III, type I(GO:0034271) phosphatidylinositol 3-kinase complex, class III, type II(GO:0034272) phosphatidylinositol 3-kinase complex, class III(GO:0035032) |
| 0.0 | 0.2 | GO:0030897 | HOPS complex(GO:0030897) |
| 0.0 | 1.8 | GO:0045271 | mitochondrial respiratory chain complex I(GO:0005747) NADH dehydrogenase complex(GO:0030964) respiratory chain complex I(GO:0045271) |
| 0.0 | 0.1 | GO:0033185 | mannosyltransferase complex(GO:0031501) dolichol-phosphate-mannose synthase complex(GO:0033185) |
| 0.0 | 2.7 | GO:0005887 | integral component of plasma membrane(GO:0005887) |
| 0.0 | 0.3 | GO:0071782 | endoplasmic reticulum tubular network(GO:0071782) endoplasmic reticulum subcompartment(GO:0098827) |
| 0.0 | 0.1 | GO:0030119 | AP-type membrane coat adaptor complex(GO:0030119) |
| 0.0 | 0.5 | GO:0005689 | U12-type spliceosomal complex(GO:0005689) |
| 0.0 | 0.1 | GO:0038201 | TORC1 complex(GO:0031931) TOR complex(GO:0038201) |
| 0.0 | 0.1 | GO:0097344 | Rix1 complex(GO:0097344) |
| 0.0 | 0.1 | GO:0009501 | amyloplast(GO:0009501) |
| 0.0 | 2.7 | GO:0022627 | cytosolic small ribosomal subunit(GO:0022627) |
| 0.0 | 0.1 | GO:0030135 | coated vesicle(GO:0030135) |
| 0.0 | 0.9 | GO:0000137 | Golgi cis cisterna(GO:0000137) |
| 0.0 | 0.6 | GO:0031012 | extracellular matrix(GO:0031012) |
| 0.0 | 0.3 | GO:0005675 | holo TFIIH complex(GO:0005675) carboxy-terminal domain protein kinase complex(GO:0032806) |
| 0.0 | 0.0 | GO:0005960 | glycine cleavage complex(GO:0005960) |
| 0.0 | 0.2 | GO:0000153 | cytoplasmic ubiquitin ligase complex(GO:0000153) |
| 0.0 | 0.1 | GO:0017053 | transcriptional repressor complex(GO:0017053) |
| 0.0 | 0.2 | GO:0005832 | chaperonin-containing T-complex(GO:0005832) |
| 0.0 | 0.5 | GO:0031354 | intrinsic component of plastid outer membrane(GO:0031354) integral component of plastid outer membrane(GO:0031355) intrinsic component of chloroplast outer membrane(GO:0031358) integral component of chloroplast outer membrane(GO:0031359) |
| 0.0 | 0.1 | GO:0000938 | GARP complex(GO:0000938) |
| 0.0 | 0.5 | GO:0008023 | transcription elongation factor complex(GO:0008023) |
| 0.0 | 0.4 | GO:0005666 | DNA-directed RNA polymerase III complex(GO:0005666) |
| 0.0 | 7.2 | GO:0005777 | peroxisome(GO:0005777) microbody(GO:0042579) |
| 0.0 | 0.3 | GO:0005665 | DNA-directed RNA polymerase II, core complex(GO:0005665) |
| 0.0 | 0.1 | GO:0000307 | cyclin-dependent protein kinase holoenzyme complex(GO:0000307) |
| 0.0 | 0.2 | GO:0005968 | Rab-protein geranylgeranyltransferase complex(GO:0005968) |
| 0.0 | 4.0 | GO:0005789 | endoplasmic reticulum membrane(GO:0005789) |
| 0.0 | 0.1 | GO:0002189 | ribose phosphate diphosphokinase complex(GO:0002189) |
| 0.0 | 0.1 | GO:0034045 | pre-autophagosomal structure membrane(GO:0034045) |
| 0.0 | 1.3 | GO:0005743 | mitochondrial inner membrane(GO:0005743) |
| 0.0 | 3.3 | GO:0015934 | large ribosomal subunit(GO:0015934) |
| 0.0 | 0.2 | GO:0005786 | signal recognition particle, endoplasmic reticulum targeting(GO:0005786) |
| 0.0 | 0.1 | GO:0033180 | proton-transporting V-type ATPase, V1 domain(GO:0033180) |
| 0.0 | 2.5 | GO:0000790 | nuclear chromatin(GO:0000790) |
| 0.0 | 0.7 | GO:0000139 | Golgi membrane(GO:0000139) |
| 0.0 | 0.3 | GO:0032588 | trans-Golgi network membrane(GO:0032588) |
| 0.0 | 0.8 | GO:0000323 | lytic vacuole(GO:0000323) |
| 0.0 | 0.1 | GO:0035145 | exon-exon junction complex(GO:0035145) |
| 0.0 | 0.1 | GO:0070390 | transcription export complex 2(GO:0070390) |
| 0.0 | 2.1 | GO:0033647 | host(GO:0018995) host cell part(GO:0033643) host intracellular part(GO:0033646) host intracellular organelle(GO:0033647) host intracellular membrane-bounded organelle(GO:0033648) host cell nucleus(GO:0042025) intracellular region of host(GO:0043656) host cell(GO:0043657) other organism(GO:0044215) other organism cell(GO:0044216) other organism part(GO:0044217) |
| 0.0 | 0.1 | GO:0005956 | protein kinase CK2 complex(GO:0005956) |
| 0.0 | 0.1 | GO:0009898 | cytoplasmic side of plasma membrane(GO:0009898) |
| 0.0 | 0.1 | GO:0016281 | eukaryotic translation initiation factor 4F complex(GO:0016281) |
| 0.0 | 1.4 | GO:0016604 | nuclear body(GO:0016604) |
| 0.0 | 0.2 | GO:0005769 | early endosome(GO:0005769) |
| 0.0 | 0.5 | GO:0022624 | proteasome regulatory particle(GO:0005838) proteasome accessory complex(GO:0022624) |
| 0.0 | 0.3 | GO:0005686 | U2 snRNP(GO:0005686) |
| 0.0 | 9.6 | GO:0005783 | endoplasmic reticulum(GO:0005783) |
| 0.0 | 0.3 | GO:0005643 | nuclear pore(GO:0005643) |
| 0.0 | 0.3 | GO:0005770 | late endosome(GO:0005770) |
| 0.0 | 3.1 | GO:0005730 | nucleolus(GO:0005730) |
| 0.0 | 0.1 | GO:0005850 | eukaryotic translation initiation factor 2 complex(GO:0005850) |
| 0.0 | 0.1 | GO:0030286 | dynein complex(GO:0030286) |
| 0.0 | 0.3 | GO:0005852 | eukaryotic translation initiation factor 3 complex(GO:0005852) |
| 0.0 | 0.2 | GO:0005635 | nuclear envelope(GO:0005635) |
| 0.0 | 0.1 | GO:0005776 | autophagosome(GO:0005776) |
| 0.0 | 0.1 | GO:0031588 | nucleotide-activated protein kinase complex(GO:0031588) |
| 0.0 | 0.6 | GO:0005759 | mitochondrial matrix(GO:0005759) |
| 0.0 | 0.0 | GO:0032299 | ribonuclease H2 complex(GO:0032299) |
| 0.0 | 0.3 | GO:0000502 | proteasome complex(GO:0000502) |
| 0.0 | 0.0 | GO:0043240 | Fanconi anaemia nuclear complex(GO:0043240) |
| 0.0 | 0.4 | GO:0005741 | mitochondrial outer membrane(GO:0005741) |
| 0.0 | 0.3 | GO:1903293 | protein serine/threonine phosphatase complex(GO:0008287) phosphatase complex(GO:1903293) |
| 0.0 | 0.1 | GO:0045239 | tricarboxylic acid cycle enzyme complex(GO:0045239) |
| 0.0 | 0.1 | GO:0005688 | U6 snRNP(GO:0005688) |
| 0.0 | 9.8 | GO:0005773 | vacuole(GO:0005773) |
| 0.0 | 0.1 | GO:0005664 | origin recognition complex(GO:0000808) nuclear origin of replication recognition complex(GO:0005664) |
| 0.0 | 23.1 | GO:0005829 | cytosol(GO:0005829) |
Gene overrepresentation in molecular function category:
| Log-likelihood per target | Total log-likelihood | Term | Description |
|---|---|---|---|
| 0.5 | 1.6 | GO:0050736 | O-malonyltransferase activity(GO:0050736) |
| 0.5 | 1.5 | GO:0052628 | 4-aminobenzoate amino acid synthetase activity(GO:0052625) benzoate amino acid synthetase activity(GO:0052626) vanillate amino acid synthetase activity(GO:0052627) 4-hydroxybenzoate amino acid synthetase activity(GO:0052628) |
| 0.4 | 1.3 | GO:0008909 | isochorismate synthase activity(GO:0008909) |
| 0.3 | 1.2 | GO:0046593 | mandelonitrile lyase activity(GO:0046593) |
| 0.3 | 1.5 | GO:0010295 | (+)-abscisic acid 8'-hydroxylase activity(GO:0010295) |
| 0.3 | 0.9 | GO:0015117 | thiosulfate transmembrane transporter activity(GO:0015117) |
| 0.3 | 0.8 | GO:0010331 | gibberellin binding(GO:0010331) |
| 0.3 | 1.5 | GO:0004838 | L-tyrosine:2-oxoglutarate aminotransferase activity(GO:0004838) L-tyrosine aminotransferase activity(GO:0070547) |
| 0.3 | 1.3 | GO:0016768 | spermine synthase activity(GO:0016768) |
| 0.2 | 2.6 | GO:0033743 | peptide-methionine (R)-S-oxide reductase activity(GO:0033743) |
| 0.2 | 0.9 | GO:0052595 | tryptamine:oxygen oxidoreductase (deaminating) activity(GO:0052593) aminoacetone:oxygen oxidoreductase(deaminating) activity(GO:0052594) aliphatic-amine oxidase activity(GO:0052595) phenethylamine:oxygen oxidoreductase (deaminating) activity(GO:0052596) |
| 0.2 | 0.9 | GO:0004617 | phosphoglycerate dehydrogenase activity(GO:0004617) |
| 0.2 | 1.0 | GO:0016629 | 12-oxophytodienoate reductase activity(GO:0016629) |
| 0.2 | 0.7 | GO:0019172 | glyoxalase III activity(GO:0019172) |
| 0.2 | 0.6 | GO:0047209 | coniferyl-alcohol glucosyltransferase activity(GO:0047209) |
| 0.2 | 0.7 | GO:0005432 | calcium:sodium antiporter activity(GO:0005432) |
| 0.2 | 0.6 | GO:0035605 | peptidyl-cysteine S-nitrosylase activity(GO:0035605) |
| 0.2 | 0.7 | GO:0004737 | pyruvate decarboxylase activity(GO:0004737) |
| 0.2 | 1.1 | GO:0080109 | indole-3-acetonitrile nitrile hydratase activity(GO:0080109) |
| 0.2 | 1.1 | GO:0004416 | hydroxyacylglutathione hydrolase activity(GO:0004416) |
| 0.2 | 1.0 | GO:0004792 | thiosulfate sulfurtransferase activity(GO:0004792) |
| 0.2 | 0.5 | GO:0008517 | folic acid transporter activity(GO:0008517) |
| 0.2 | 0.5 | GO:0050403 | trans-zeatin O-beta-D-glucosyltransferase activity(GO:0050403) cis-zeatin O-beta-D-glucosyltransferase activity(GO:0050502) |
| 0.2 | 0.7 | GO:0004556 | alpha-amylase activity(GO:0004556) |
| 0.2 | 0.8 | GO:0004165 | dodecenoyl-CoA delta-isomerase activity(GO:0004165) |
| 0.2 | 0.7 | GO:0019784 | NEDD8-specific protease activity(GO:0019784) |
| 0.2 | 1.4 | GO:0047216 | inositol 3-alpha-galactosyltransferase activity(GO:0047216) |
| 0.2 | 0.8 | GO:0004535 | poly(A)-specific ribonuclease activity(GO:0004535) |
| 0.2 | 0.5 | GO:0016672 | oxidoreductase activity, acting on a sulfur group of donors, quinone or similar compound as acceptor(GO:0016672) glutathione dehydrogenase (ascorbate) activity(GO:0045174) |
| 0.2 | 1.2 | GO:0004566 | beta-glucuronidase activity(GO:0004566) |
| 0.2 | 0.6 | GO:0080103 | 4-methylthiopropyl glucosinolate S-oxygenase activity(GO:0080103) |
| 0.2 | 2.3 | GO:0008195 | phosphatidate phosphatase activity(GO:0008195) |
| 0.1 | 0.7 | GO:0005355 | glucose transmembrane transporter activity(GO:0005355) |
| 0.1 | 0.3 | GO:0080002 | UDP-glucose:4-aminobenzoate acylglucosyltransferase activity(GO:0080002) |
| 0.1 | 0.9 | GO:0005313 | L-glutamate transmembrane transporter activity(GO:0005313) |
| 0.1 | 0.4 | GO:0047804 | cysteine-S-conjugate beta-lyase activity(GO:0047804) |
| 0.1 | 0.6 | GO:0016985 | mannan endo-1,4-beta-mannosidase activity(GO:0016985) |
| 0.1 | 0.4 | GO:0004353 | glutamate dehydrogenase [NAD(P)+] activity(GO:0004353) |
| 0.1 | 0.4 | GO:0000249 | C-22 sterol desaturase activity(GO:0000249) |
| 0.1 | 0.5 | GO:0016165 | linoleate 13S-lipoxygenase activity(GO:0016165) |
| 0.1 | 0.9 | GO:0004834 | tryptophan synthase activity(GO:0004834) |
| 0.1 | 1.4 | GO:0008453 | alanine-glyoxylate transaminase activity(GO:0008453) |
| 0.1 | 0.5 | GO:0003852 | 2-isopropylmalate synthase activity(GO:0003852) |
| 0.1 | 0.4 | GO:0070678 | preprotein binding(GO:0070678) |
| 0.1 | 0.6 | GO:0008113 | peptide-methionine (S)-S-oxide reductase activity(GO:0008113) |
| 0.1 | 0.5 | GO:0004307 | ethanolaminephosphotransferase activity(GO:0004307) |
| 0.1 | 0.4 | GO:0004774 | succinate-CoA ligase activity(GO:0004774) succinate-CoA ligase (ADP-forming) activity(GO:0004775) succinate-CoA ligase (GDP-forming) activity(GO:0004776) |
| 0.1 | 0.9 | GO:0033549 | MAP kinase phosphatase activity(GO:0033549) |
| 0.1 | 0.8 | GO:0010279 | indole-3-acetic acid amido synthetase activity(GO:0010279) |
| 0.1 | 0.4 | GO:0035671 | enone reductase activity(GO:0035671) |
| 0.1 | 0.2 | GO:0000179 | rRNA (adenine-N6,N6-)-dimethyltransferase activity(GO:0000179) |
| 0.1 | 1.1 | GO:0010294 | abscisic acid glucosyltransferase activity(GO:0010294) |
| 0.1 | 0.3 | GO:0015172 | acidic amino acid transmembrane transporter activity(GO:0015172) |
| 0.1 | 0.6 | GO:1902417 | (+)-abscisic acid D-glucopyranosyl ester transmembrane transporter activity(GO:1902417) |
| 0.1 | 0.3 | GO:0008311 | phosphodiesterase I activity(GO:0004528) double-stranded DNA 3'-5' exodeoxyribonuclease activity(GO:0008311) |
| 0.1 | 0.4 | GO:0070401 | NADP+ binding(GO:0070401) |
| 0.1 | 0.4 | GO:0050284 | sinapate 1-glucosyltransferase activity(GO:0050284) |
| 0.1 | 0.4 | GO:0004719 | protein-L-isoaspartate (D-aspartate) O-methyltransferase activity(GO:0004719) |
| 0.1 | 1.3 | GO:0008061 | chitin binding(GO:0008061) |
| 0.1 | 1.3 | GO:0015112 | nitrate transmembrane transporter activity(GO:0015112) |
| 0.1 | 0.7 | GO:0016703 | oxidoreductase activity, acting on single donors with incorporation of molecular oxygen, incorporation of one atom of oxygen (internal monooxygenases or internal mixed function oxidases)(GO:0016703) |
| 0.1 | 0.3 | GO:0016277 | [myelin basic protein]-arginine N-methyltransferase activity(GO:0016277) |
| 0.1 | 0.6 | GO:0052691 | UDP-arabinopyranose mutase activity(GO:0052691) |
| 0.1 | 0.3 | GO:0004488 | methenyltetrahydrofolate cyclohydrolase activity(GO:0004477) methylenetetrahydrofolate dehydrogenase (NADP+) activity(GO:0004488) |
| 0.1 | 0.7 | GO:0032977 | membrane insertase activity(GO:0032977) |
| 0.1 | 0.5 | GO:0009883 | red or far-red light photoreceptor activity(GO:0009883) |
| 0.1 | 0.3 | GO:0003849 | 3-deoxy-7-phosphoheptulonate synthase activity(GO:0003849) |
| 0.1 | 0.3 | GO:0008661 | 1-deoxy-D-xylulose-5-phosphate synthase activity(GO:0008661) |
| 0.1 | 0.5 | GO:0016724 | ferroxidase activity(GO:0004322) oxidoreductase activity, oxidizing metal ions, oxygen as acceptor(GO:0016724) |
| 0.1 | 0.3 | GO:0019003 | GDP binding(GO:0019003) |
| 0.1 | 0.3 | GO:0008442 | 3-hydroxyisobutyrate dehydrogenase activity(GO:0008442) |
| 0.1 | 0.3 | GO:0080132 | fatty acid alpha-hydroxylase activity(GO:0080132) |
| 0.1 | 0.4 | GO:0008174 | mRNA methyltransferase activity(GO:0008174) |
| 0.1 | 0.3 | GO:0032131 | alkylated DNA binding(GO:0032131) |
| 0.1 | 0.3 | GO:0019776 | Atg8 ligase activity(GO:0019776) Atg8 activating enzyme activity(GO:0019779) |
| 0.1 | 0.6 | GO:0009041 | uridylate kinase activity(GO:0009041) |
| 0.1 | 0.5 | GO:0004793 | threonine aldolase activity(GO:0004793) L-allo-threonine aldolase activity(GO:0008732) |
| 0.1 | 0.3 | GO:0016262 | protein N-acetylglucosaminyltransferase activity(GO:0016262) |
| 0.1 | 0.3 | GO:0034722 | gamma-glutamyl-peptidase activity(GO:0034722) |
| 0.1 | 0.3 | GO:0097157 | U2 snRNA binding(GO:0030620) pre-mRNA intronic binding(GO:0097157) |
| 0.1 | 0.3 | GO:0047493 | sphingomyelin synthase activity(GO:0033188) ceramide cholinephosphotransferase activity(GO:0047493) |
| 0.1 | 0.6 | GO:0004739 | pyruvate dehydrogenase (acetyl-transferring) activity(GO:0004739) |
| 0.1 | 0.6 | GO:0004356 | glutamate-ammonia ligase activity(GO:0004356) |
| 0.1 | 0.2 | GO:0004750 | ribulose-phosphate 3-epimerase activity(GO:0004750) |
| 0.1 | 0.2 | GO:0098748 | clathrin adaptor activity(GO:0035615) endocytic adaptor activity(GO:0098748) |
| 0.1 | 0.7 | GO:0009881 | photoreceptor activity(GO:0009881) |
| 0.1 | 0.2 | GO:0004424 | imidazoleglycerol-phosphate dehydratase activity(GO:0004424) |
| 0.1 | 0.2 | GO:0003864 | 3-methyl-2-oxobutanoate hydroxymethyltransferase activity(GO:0003864) |
| 0.1 | 0.2 | GO:0019788 | NEDD8 transferase activity(GO:0019788) |
| 0.1 | 1.6 | GO:0016702 | oxidoreductase activity, acting on single donors with incorporation of molecular oxygen, incorporation of two atoms of oxygen(GO:0016702) |
| 0.1 | 0.2 | GO:1990259 | protein-glutamine N-methyltransferase activity(GO:0036009) histone-glutamine methyltransferase activity(GO:1990259) |
| 0.1 | 2.1 | GO:0051787 | misfolded protein binding(GO:0051787) |
| 0.1 | 1.5 | GO:0043295 | glutathione binding(GO:0043295) oligopeptide binding(GO:1900750) |
| 0.1 | 0.5 | GO:0003872 | 6-phosphofructokinase activity(GO:0003872) |
| 0.1 | 0.2 | GO:0019136 | deoxynucleoside kinase activity(GO:0019136) |
| 0.1 | 0.2 | GO:0016435 | rRNA (guanine) methyltransferase activity(GO:0016435) |
| 0.1 | 0.6 | GO:0097177 | translation activator activity(GO:0008494) mitochondrial ribosome binding(GO:0097177) |
| 0.1 | 0.5 | GO:0008157 | protein phosphatase 1 binding(GO:0008157) |
| 0.1 | 0.1 | GO:0070628 | proteasome binding(GO:0070628) |
| 0.1 | 0.2 | GO:1990247 | N6-methyladenosine-containing RNA binding(GO:1990247) |
| 0.1 | 1.0 | GO:0009815 | 1-aminocyclopropane-1-carboxylate oxidase activity(GO:0009815) |
| 0.1 | 1.4 | GO:0016844 | strictosidine synthase activity(GO:0016844) |
| 0.1 | 0.5 | GO:0016781 | phosphotransferase activity, paired acceptors(GO:0016781) |
| 0.1 | 0.4 | GO:0005460 | UDP-glucose transmembrane transporter activity(GO:0005460) |
| 0.1 | 0.9 | GO:0030628 | pre-mRNA 3'-splice site binding(GO:0030628) |
| 0.1 | 0.2 | GO:0090422 | thiamine pyrophosphate transporter activity(GO:0090422) |
| 0.1 | 0.3 | GO:0016748 | dihydrolipoyllysine-residue succinyltransferase activity(GO:0004149) succinyltransferase activity(GO:0016748) S-succinyltransferase activity(GO:0016751) |
| 0.1 | 0.2 | GO:0046524 | sucrose-phosphate synthase activity(GO:0046524) |
| 0.1 | 0.1 | GO:0031072 | heat shock protein binding(GO:0031072) |
| 0.1 | 0.3 | GO:0005544 | calcium-dependent phospholipid binding(GO:0005544) |
| 0.1 | 0.4 | GO:0030544 | Hsp70 protein binding(GO:0030544) |
| 0.1 | 0.4 | GO:0016312 | inositol bisphosphate phosphatase activity(GO:0016312) |
| 0.1 | 1.3 | GO:0015248 | sterol transporter activity(GO:0015248) |
| 0.1 | 0.3 | GO:0004112 | cyclic-nucleotide phosphodiesterase activity(GO:0004112) 2',3'-cyclic-nucleotide 3'-phosphodiesterase activity(GO:0004113) |
| 0.1 | 0.3 | GO:0004765 | shikimate kinase activity(GO:0004765) |
| 0.1 | 0.8 | GO:0051879 | Hsp90 protein binding(GO:0051879) |
| 0.1 | 1.1 | GO:0004630 | phospholipase D activity(GO:0004630) N-acylphosphatidylethanolamine-specific phospholipase D activity(GO:0070290) |
| 0.1 | 0.2 | GO:0047134 | protein-disulfide reductase activity(GO:0047134) |
| 0.1 | 0.2 | GO:0052692 | alpha-galactosidase activity(GO:0004557) raffinose alpha-galactosidase activity(GO:0052692) |
| 0.1 | 0.6 | GO:0004708 | MAP kinase kinase activity(GO:0004708) |
| 0.1 | 0.3 | GO:0046537 | 2,3-bisphosphoglycerate-independent phosphoglycerate mutase activity(GO:0046537) |
| 0.1 | 0.3 | GO:0010313 | phytochrome binding(GO:0010313) |
| 0.1 | 0.3 | GO:0016675 | cytochrome-c oxidase activity(GO:0004129) heme-copper terminal oxidase activity(GO:0015002) oxidoreductase activity, acting on a heme group of donors(GO:0016675) oxidoreductase activity, acting on a heme group of donors, oxygen as acceptor(GO:0016676) |
| 0.1 | 0.2 | GO:0016992 | lipoate-protein ligase activity(GO:0016979) lipoate synthase activity(GO:0016992) |
| 0.1 | 0.3 | GO:0004028 | 3-chloroallyl aldehyde dehydrogenase activity(GO:0004028) |
| 0.1 | 0.2 | GO:0004123 | cystathionine gamma-lyase activity(GO:0004123) |
| 0.1 | 0.6 | GO:0004869 | cysteine-type endopeptidase inhibitor activity(GO:0004869) |
| 0.1 | 0.6 | GO:0071617 | lysophospholipid acyltransferase activity(GO:0071617) |
| 0.1 | 0.6 | GO:0031078 | NAD-dependent histone deacetylase activity(GO:0017136) histone deacetylase activity (H3-K14 specific)(GO:0031078) NAD-dependent histone deacetylase activity (H3-K14 specific)(GO:0032041) NAD-dependent protein deacetylase activity(GO:0034979) |
| 0.1 | 0.2 | GO:0016149 | translation release factor activity, codon specific(GO:0016149) |
| 0.1 | 0.5 | GO:0001653 | peptide receptor activity(GO:0001653) |
| 0.1 | 0.5 | GO:0043023 | ribosomal large subunit binding(GO:0043023) |
| 0.1 | 2.7 | GO:0080043 | quercetin 3-O-glucosyltransferase activity(GO:0080043) |
| 0.1 | 0.3 | GO:1990825 | sequence-specific mRNA binding(GO:1990825) |
| 0.1 | 0.2 | GO:0008936 | nicotinamidase activity(GO:0008936) |
| 0.1 | 0.4 | GO:0051748 | UTP-monosaccharide-1-phosphate uridylyltransferase activity(GO:0051748) |
| 0.1 | 0.4 | GO:0008177 | succinate dehydrogenase (ubiquinone) activity(GO:0008177) |
| 0.1 | 0.2 | GO:0035197 | siRNA binding(GO:0035197) |
| 0.1 | 0.3 | GO:0036002 | pre-mRNA binding(GO:0036002) |
| 0.1 | 0.4 | GO:0004345 | glucose-6-phosphate dehydrogenase activity(GO:0004345) |
| 0.1 | 0.2 | GO:0003861 | 3-isopropylmalate dehydratase activity(GO:0003861) |
| 0.1 | 0.2 | GO:0043425 | bHLH transcription factor binding(GO:0043425) |
| 0.1 | 0.2 | GO:0035591 | MAP-kinase scaffold activity(GO:0005078) protein kinase C binding(GO:0005080) protein complex scaffold(GO:0032947) signaling adaptor activity(GO:0035591) |
| 0.1 | 0.1 | GO:0016635 | oxidoreductase activity, acting on the CH-CH group of donors, quinone or related compound as acceptor(GO:0016635) |
| 0.1 | 0.2 | GO:0043546 | molybdopterin cofactor binding(GO:0043546) |
| 0.1 | 0.1 | GO:0051731 | polynucleotide 5'-hydroxyl-kinase activity(GO:0051731) |
| 0.1 | 0.8 | GO:0000993 | RNA polymerase II core binding(GO:0000993) |
| 0.1 | 1.0 | GO:0070122 | isopeptidase activity(GO:0070122) |
| 0.1 | 0.2 | GO:0032791 | lead ion binding(GO:0032791) |
| 0.1 | 0.2 | GO:0004359 | glutaminase activity(GO:0004359) |
| 0.1 | 2.1 | GO:0004707 | MAP kinase activity(GO:0004707) |
| 0.1 | 0.5 | GO:1904680 | oligopeptide transmembrane transporter activity(GO:0035673) peptide transmembrane transporter activity(GO:1904680) |
| 0.1 | 0.8 | GO:0016018 | cyclosporin A binding(GO:0016018) |
| 0.1 | 0.3 | GO:0016426 | tRNA (adenine) methyltransferase activity(GO:0016426) |
| 0.1 | 0.6 | GO:0004714 | transmembrane receptor protein tyrosine kinase activity(GO:0004714) |
| 0.1 | 0.3 | GO:0001664 | G-protein coupled receptor binding(GO:0001664) G-protein beta/gamma-subunit complex binding(GO:0031683) |
| 0.1 | 0.4 | GO:0003997 | acyl-CoA oxidase activity(GO:0003997) |
| 0.1 | 0.2 | GO:0003995 | acyl-CoA dehydrogenase activity(GO:0003995) |
| 0.1 | 0.2 | GO:0000403 | Y-form DNA binding(GO:0000403) flap-structured DNA binding(GO:0070336) |
| 0.1 | 0.4 | GO:0001046 | core promoter sequence-specific DNA binding(GO:0001046) core promoter binding(GO:0001047) |
| 0.1 | 0.1 | GO:0051019 | mitogen-activated protein kinase binding(GO:0051019) |
| 0.0 | 0.3 | GO:0001102 | RNA polymerase II activating transcription factor binding(GO:0001102) |
| 0.0 | 1.0 | GO:0008353 | RNA polymerase II carboxy-terminal domain kinase activity(GO:0008353) |
| 0.0 | 0.4 | GO:0017091 | AU-rich element binding(GO:0017091) |
| 0.0 | 0.2 | GO:0003919 | FMN adenylyltransferase activity(GO:0003919) |
| 0.0 | 0.5 | GO:0015294 | solute:cation symporter activity(GO:0015294) |
| 0.0 | 0.1 | GO:0003857 | 3-hydroxyacyl-CoA dehydrogenase activity(GO:0003857) |
| 0.0 | 0.1 | GO:0035242 | protein-arginine omega-N asymmetric methyltransferase activity(GO:0035242) |
| 0.0 | 0.5 | GO:0035198 | miRNA binding(GO:0035198) |
| 0.0 | 0.2 | GO:0015136 | sialic acid transmembrane transporter activity(GO:0015136) |
| 0.0 | 0.3 | GO:0008728 | GTP diphosphokinase activity(GO:0008728) |
| 0.0 | 0.6 | GO:0015020 | glucuronosyltransferase activity(GO:0015020) |
| 0.0 | 0.1 | GO:0016767 | geranylgeranyl-diphosphate geranylgeranyltransferase activity(GO:0016767) |
| 0.0 | 0.1 | GO:0016726 | oxidoreductase activity, acting on CH or CH2 groups, NAD or NADP as acceptor(GO:0016726) |
| 0.0 | 0.6 | GO:0016208 | AMP binding(GO:0016208) |
| 0.0 | 3.2 | GO:0004197 | cysteine-type endopeptidase activity(GO:0004197) |
| 0.0 | 1.0 | GO:0043424 | protein histidine kinase binding(GO:0043424) |
| 0.0 | 0.2 | GO:0004473 | malate dehydrogenase (decarboxylating) (NADP+) activity(GO:0004473) |
| 0.0 | 0.2 | GO:0004791 | thioredoxin-disulfide reductase activity(GO:0004791) |
| 0.0 | 1.6 | GO:0016597 | amino acid binding(GO:0016597) |
| 0.0 | 0.3 | GO:0017112 | Rab guanyl-nucleotide exchange factor activity(GO:0017112) |
| 0.0 | 0.1 | GO:0050577 | GDP-L-fucose synthase activity(GO:0050577) |
| 0.0 | 0.3 | GO:0016004 | phospholipase activator activity(GO:0016004) lipase activator activity(GO:0060229) |
| 0.0 | 0.5 | GO:0047617 | acyl-CoA hydrolase activity(GO:0047617) |
| 0.0 | 0.8 | GO:0009982 | pseudouridine synthase activity(GO:0009982) |
| 0.0 | 0.8 | GO:0030276 | clathrin binding(GO:0030276) |
| 0.0 | 0.6 | GO:0052747 | sinapyl alcohol dehydrogenase activity(GO:0052747) |
| 0.0 | 0.1 | GO:0016314 | phosphatidylinositol-3,4,5-trisphosphate 3-phosphatase activity(GO:0016314) |
| 0.0 | 0.2 | GO:0048027 | mRNA 5'-UTR binding(GO:0048027) |
| 0.0 | 0.2 | GO:0052743 | inositol-polyphosphate 5-phosphatase activity(GO:0004445) inositol-1,3,4,5-tetrakisphosphate 5-phosphatase activity(GO:0052659) inositol tetrakisphosphate phosphatase activity(GO:0052743) |
| 0.0 | 0.3 | GO:0016812 | hydrolase activity, acting on carbon-nitrogen (but not peptide) bonds, in cyclic amides(GO:0016812) |
| 0.0 | 0.2 | GO:0047627 | hydrolase activity, acting on acid anhydrides, in sulfonyl-containing anhydrides(GO:0016819) adenylylsulfatase activity(GO:0047627) |
| 0.0 | 0.3 | GO:0004143 | diacylglycerol kinase activity(GO:0004143) |
| 0.0 | 0.3 | GO:0008239 | dipeptidyl-peptidase activity(GO:0008239) |
| 0.0 | 0.2 | GO:0004057 | arginyltransferase activity(GO:0004057) |
| 0.0 | 0.4 | GO:0005086 | ARF guanyl-nucleotide exchange factor activity(GO:0005086) |
| 0.0 | 0.2 | GO:0003935 | GTP cyclohydrolase II activity(GO:0003935) 3,4-dihydroxy-2-butanone-4-phosphate synthase activity(GO:0008686) |
| 0.0 | 0.4 | GO:0008139 | nuclear localization sequence binding(GO:0008139) |
| 0.0 | 0.2 | GO:0050017 | L-3-cyanoalanine synthase activity(GO:0050017) |
| 0.0 | 0.3 | GO:0004069 | L-aspartate:2-oxoglutarate aminotransferase activity(GO:0004069) |
| 0.0 | 0.6 | GO:0019706 | protein-cysteine S-palmitoyltransferase activity(GO:0019706) protein-cysteine S-acyltransferase activity(GO:0019707) |
| 0.0 | 0.2 | GO:0016174 | NAD(P)H oxidase activity(GO:0016174) oxidoreductase activity, acting on NAD(P)H, oxygen as acceptor(GO:0050664) |
| 0.0 | 0.1 | GO:0015089 | high-affinity copper ion transmembrane transporter activity(GO:0015089) |
| 0.0 | 0.5 | GO:0016813 | hydrolase activity, acting on carbon-nitrogen (but not peptide) bonds, in linear amidines(GO:0016813) |
| 0.0 | 0.0 | GO:0051903 | S-(hydroxymethyl)glutathione dehydrogenase activity(GO:0051903) |
| 0.0 | 2.2 | GO:0004683 | calmodulin-dependent protein kinase activity(GO:0004683) |
| 0.0 | 0.8 | GO:0042973 | glucan endo-1,3-beta-D-glucosidase activity(GO:0042973) |
| 0.0 | 0.1 | GO:0004609 | phosphatidylserine decarboxylase activity(GO:0004609) |
| 0.0 | 0.1 | GO:0004181 | metallocarboxypeptidase activity(GO:0004181) |
| 0.0 | 0.3 | GO:0070181 | small ribosomal subunit rRNA binding(GO:0070181) |
| 0.0 | 0.3 | GO:0016681 | ubiquinol-cytochrome-c reductase activity(GO:0008121) oxidoreductase activity, acting on diphenols and related substances as donors, cytochrome as acceptor(GO:0016681) |
| 0.0 | 1.9 | GO:0061631 | ubiquitin conjugating enzyme activity(GO:0061631) |
| 0.0 | 0.9 | GO:0016671 | oxidoreductase activity, acting on a sulfur group of donors, disulfide as acceptor(GO:0016671) |
| 0.0 | 0.4 | GO:0004351 | glutamate decarboxylase activity(GO:0004351) |
| 0.0 | 0.7 | GO:0008536 | Ran GTPase binding(GO:0008536) |
| 0.0 | 0.1 | GO:0015186 | L-glutamine transmembrane transporter activity(GO:0015186) |
| 0.0 | 0.1 | GO:0070006 | metalloaminopeptidase activity(GO:0070006) |
| 0.0 | 0.1 | GO:0018488 | aryl-aldehyde oxidase activity(GO:0018488) indole-3-acetaldehyde oxidase activity(GO:0050302) |
| 0.0 | 0.2 | GO:0004806 | triglyceride lipase activity(GO:0004806) |
| 0.0 | 0.1 | GO:0035516 | oxidative DNA demethylase activity(GO:0035516) |
| 0.0 | 2.0 | GO:0043130 | ubiquitin binding(GO:0043130) |
| 0.0 | 0.3 | GO:0004602 | glutathione peroxidase activity(GO:0004602) |
| 0.0 | 0.2 | GO:0003680 | AT DNA binding(GO:0003680) |
| 0.0 | 0.1 | GO:0019166 | trans-2-enoyl-CoA reductase (NADPH) activity(GO:0019166) |
| 0.0 | 0.4 | GO:0003950 | NAD+ ADP-ribosyltransferase activity(GO:0003950) |
| 0.0 | 0.4 | GO:0016157 | sucrose synthase activity(GO:0016157) |
| 0.0 | 0.1 | GO:0004450 | isocitrate dehydrogenase (NADP+) activity(GO:0004450) |
| 0.0 | 0.1 | GO:0000268 | peroxisome targeting sequence binding(GO:0000268) |
| 0.0 | 0.3 | GO:0000095 | S-adenosyl-L-methionine transmembrane transporter activity(GO:0000095) coenzyme transporter activity(GO:0051185) |
| 0.0 | 0.2 | GO:0043024 | ribosomal small subunit binding(GO:0043024) |
| 0.0 | 0.1 | GO:0032182 | ubiquitin-like protein binding(GO:0032182) |
| 0.0 | 0.1 | GO:0031210 | phosphatidylcholine binding(GO:0031210) quaternary ammonium group binding(GO:0050997) ammonium ion binding(GO:0070405) |
| 0.0 | 0.1 | GO:0004462 | lactoylglutathione lyase activity(GO:0004462) |
| 0.0 | 0.5 | GO:0008137 | NADH dehydrogenase (ubiquinone) activity(GO:0008137) NADH dehydrogenase (quinone) activity(GO:0050136) |
| 0.0 | 0.5 | GO:0004568 | chitinase activity(GO:0004568) |
| 0.0 | 0.4 | GO:0070180 | large ribosomal subunit rRNA binding(GO:0070180) |
| 0.0 | 4.2 | GO:0000978 | RNA polymerase II core promoter proximal region sequence-specific DNA binding(GO:0000978) |
| 0.0 | 1.2 | GO:0080030 | methyl indole-3-acetate esterase activity(GO:0080030) |
| 0.0 | 4.8 | GO:0061659 | ubiquitin-like protein ligase activity(GO:0061659) |
| 0.0 | 0.2 | GO:0004108 | citrate (Si)-synthase activity(GO:0004108) citrate synthase activity(GO:0036440) |
| 0.0 | 1.5 | GO:0003713 | transcription coactivator activity(GO:0003713) |
| 0.0 | 0.2 | GO:0015203 | polyamine transmembrane transporter activity(GO:0015203) |
| 0.0 | 0.2 | GO:0070696 | transmembrane receptor protein serine/threonine kinase binding(GO:0070696) |
| 0.0 | 0.6 | GO:0015086 | cadmium ion transmembrane transporter activity(GO:0015086) |
| 0.0 | 0.1 | GO:0004582 | dolichyl-phosphate beta-D-mannosyltransferase activity(GO:0004582) |
| 0.0 | 5.5 | GO:0004842 | ubiquitin-protein transferase activity(GO:0004842) |
| 0.0 | 1.1 | GO:0050135 | NAD(P)+ nucleosidase activity(GO:0050135) |
| 0.0 | 0.4 | GO:0030060 | L-malate dehydrogenase activity(GO:0030060) |
| 0.0 | 0.2 | GO:0019903 | protein phosphatase binding(GO:0019903) |
| 0.0 | 0.8 | GO:0043022 | ribosome binding(GO:0043022) |
| 0.0 | 0.1 | GO:0000009 | alpha-1,6-mannosyltransferase activity(GO:0000009) |
| 0.0 | 0.1 | GO:0034513 | box H/ACA snoRNA binding(GO:0034513) |
| 0.0 | 0.2 | GO:0015368 | calcium:cation antiporter activity(GO:0015368) calcium:proton antiporter activity(GO:0015369) |
| 0.0 | 0.4 | GO:0030515 | snoRNA binding(GO:0030515) |
| 0.0 | 0.7 | GO:0070717 | poly-purine tract binding(GO:0070717) |
| 0.0 | 0.2 | GO:0080025 | phosphatidylinositol-3,5-bisphosphate binding(GO:0080025) |
| 0.0 | 0.1 | GO:0016742 | hydroxymethyl-, formyl- and related transferase activity(GO:0016742) |
| 0.0 | 0.1 | GO:0005315 | inorganic phosphate transmembrane transporter activity(GO:0005315) |
| 0.0 | 0.2 | GO:0016889 | endodeoxyribonuclease activity, producing 3'-phosphomonoesters(GO:0016889) |
| 0.0 | 0.2 | GO:0010178 | IAA-amino acid conjugate hydrolase activity(GO:0010178) |
| 0.0 | 1.7 | GO:0042910 | xenobiotic transporter activity(GO:0042910) |
| 0.0 | 0.4 | GO:0097602 | cullin family protein binding(GO:0097602) |
| 0.0 | 0.2 | GO:0004664 | prephenate dehydratase activity(GO:0004664) arogenate dehydratase activity(GO:0047769) |
| 0.0 | 0.1 | GO:0001130 | bacterial-type RNA polymerase transcription factor activity, sequence-specific DNA binding(GO:0001130) bacterial-type RNA polymerase transcriptional activator activity, sequence-specific DNA binding(GO:0001216) |
| 0.0 | 0.6 | GO:0001871 | pattern binding(GO:0001871) polysaccharide binding(GO:0030247) |
| 0.0 | 0.2 | GO:0001872 | (1->3)-beta-D-glucan binding(GO:0001872) |
| 0.0 | 0.1 | GO:0052635 | C-20 gibberellin 2-beta-dioxygenase activity(GO:0052635) |
| 0.0 | 0.1 | GO:0008481 | sphinganine kinase activity(GO:0008481) |
| 0.0 | 0.1 | GO:0004333 | fumarate hydratase activity(GO:0004333) |
| 0.0 | 0.2 | GO:0008312 | 7S RNA binding(GO:0008312) |
| 0.0 | 0.1 | GO:0005483 | soluble NSF attachment protein activity(GO:0005483) |
| 0.0 | 0.3 | GO:0008889 | glycerophosphodiester phosphodiesterase activity(GO:0008889) |
| 0.0 | 0.6 | GO:0031386 | protein tag(GO:0031386) |
| 0.0 | 0.1 | GO:0008022 | protein C-terminus binding(GO:0008022) |
| 0.0 | 0.1 | GO:0030943 | mitochondrion targeting sequence binding(GO:0030943) |
| 0.0 | 0.9 | GO:0004364 | glutathione transferase activity(GO:0004364) |
| 0.0 | 0.1 | GO:0070403 | NAD+ binding(GO:0070403) |
| 0.0 | 0.2 | GO:0000175 | 3'-5'-exoribonuclease activity(GO:0000175) |
| 0.0 | 0.3 | GO:0050373 | UDP-arabinose 4-epimerase activity(GO:0050373) |
| 0.0 | 0.1 | GO:0016896 | exoribonuclease activity(GO:0004532) exoribonuclease activity, producing 5'-phosphomonoesters(GO:0016896) |
| 0.0 | 0.1 | GO:0017077 | oxidative phosphorylation uncoupler activity(GO:0017077) |
| 0.0 | 0.1 | GO:0004819 | glutamine-tRNA ligase activity(GO:0004819) |
| 0.0 | 0.1 | GO:0005247 | voltage-gated chloride channel activity(GO:0005247) chloride channel activity(GO:0005254) |
| 0.0 | 0.8 | GO:0051540 | iron-sulfur cluster binding(GO:0051536) metal cluster binding(GO:0051540) |
| 0.0 | 0.1 | GO:0015173 | aromatic amino acid transmembrane transporter activity(GO:0015173) |
| 0.0 | 0.2 | GO:0016274 | arginine N-methyltransferase activity(GO:0016273) protein-arginine N-methyltransferase activity(GO:0016274) |
| 0.0 | 0.1 | GO:0022841 | leak channel activity(GO:0022840) potassium ion leak channel activity(GO:0022841) narrow pore channel activity(GO:0022842) |
| 0.0 | 0.3 | GO:0015095 | magnesium ion transmembrane transporter activity(GO:0015095) |
| 0.0 | 1.1 | GO:0005096 | GTPase activator activity(GO:0005096) |
| 0.0 | 0.1 | GO:0004749 | ribose phosphate diphosphokinase activity(GO:0004749) |
| 0.0 | 0.1 | GO:0046509 | 1,2-diacylglycerol 3-beta-galactosyltransferase activity(GO:0046509) |
| 0.0 | 0.0 | GO:0016615 | malate dehydrogenase activity(GO:0016615) |
| 0.0 | 0.8 | GO:0036459 | thiol-dependent ubiquitin-specific protease activity(GO:0004843) thiol-dependent ubiquitinyl hydrolase activity(GO:0036459) |
| 0.0 | 0.1 | GO:0005049 | nuclear export signal receptor activity(GO:0005049) |
| 0.0 | 0.1 | GO:0015924 | mannosyl-oligosaccharide mannosidase activity(GO:0015924) |
| 0.0 | 0.4 | GO:0048029 | monosaccharide binding(GO:0048029) |
| 0.0 | 0.1 | GO:0038199 | ethylene receptor activity(GO:0038199) ethylene binding(GO:0051740) alkene binding(GO:0072328) |
| 0.0 | 0.1 | GO:0004449 | isocitrate dehydrogenase (NAD+) activity(GO:0004449) |
| 0.0 | 0.4 | GO:0044389 | ubiquitin protein ligase binding(GO:0031625) ubiquitin-like protein ligase binding(GO:0044389) |
| 0.0 | 0.7 | GO:0008171 | O-methyltransferase activity(GO:0008171) |
| 0.0 | 0.1 | GO:0004124 | cysteine synthase activity(GO:0004124) |
| 0.0 | 0.3 | GO:0005253 | anion channel activity(GO:0005253) |
| 0.0 | 0.2 | GO:0008526 | phosphatidylinositol transporter activity(GO:0008526) |
| 0.0 | 0.3 | GO:0008097 | 5S rRNA binding(GO:0008097) |
| 0.0 | 0.1 | GO:0015210 | pyrimidine nucleobase transmembrane transporter activity(GO:0005350) uracil transmembrane transporter activity(GO:0015210) |
| 0.0 | 0.1 | GO:0050378 | UDP-glucuronate 4-epimerase activity(GO:0050378) |
| 0.0 | 0.0 | GO:0003977 | UDP-N-acetylglucosamine diphosphorylase activity(GO:0003977) |
| 0.0 | 0.5 | GO:0017137 | Rab GTPase binding(GO:0017137) |
| 0.0 | 4.2 | GO:0003735 | structural constituent of ribosome(GO:0003735) |
| 0.0 | 0.3 | GO:0008515 | sucrose transmembrane transporter activity(GO:0008515) |
| 0.0 | 0.2 | GO:0048040 | UDP-glucuronate decarboxylase activity(GO:0048040) |
| 0.0 | 0.1 | GO:0004326 | tetrahydrofolylpolyglutamate synthase activity(GO:0004326) |
| 0.0 | 0.1 | GO:0015098 | molybdate ion transmembrane transporter activity(GO:0015098) |
| 0.0 | 0.2 | GO:0004144 | diacylglycerol O-acyltransferase activity(GO:0004144) |
| 0.0 | 0.4 | GO:0016776 | phosphotransferase activity, phosphate group as acceptor(GO:0016776) |
| 0.0 | 0.9 | GO:0003899 | DNA-directed RNA polymerase activity(GO:0003899) |
| 0.0 | 0.4 | GO:0031491 | nucleosome binding(GO:0031491) |
| 0.0 | 0.1 | GO:0070063 | RNA polymerase binding(GO:0070063) |
| 0.0 | 0.1 | GO:0016531 | copper chaperone activity(GO:0016531) |
| 0.0 | 0.1 | GO:0016151 | nickel cation binding(GO:0016151) |
| 0.0 | 0.1 | GO:0008934 | inositol monophosphate 1-phosphatase activity(GO:0008934) inositol monophosphate phosphatase activity(GO:0052834) |
| 0.0 | 0.1 | GO:0019825 | oxygen binding(GO:0019825) |
| 0.0 | 0.2 | GO:0015114 | phosphate ion transmembrane transporter activity(GO:0015114) |
| 0.0 | 0.1 | GO:0047782 | coniferin beta-glucosidase activity(GO:0047782) |
| 0.0 | 0.2 | GO:0070567 | cytidylyltransferase activity(GO:0070567) |
| 0.0 | 0.5 | GO:0005347 | ATP transmembrane transporter activity(GO:0005347) |
| 0.0 | 0.3 | GO:0008146 | sulfotransferase activity(GO:0008146) |
| 0.0 | 0.1 | GO:0009916 | alternative oxidase activity(GO:0009916) |
| 0.0 | 0.1 | GO:0000774 | adenyl-nucleotide exchange factor activity(GO:0000774) |
| 0.0 | 0.1 | GO:0045505 | dynein binding(GO:0045502) dynein intermediate chain binding(GO:0045505) dynein light intermediate chain binding(GO:0051959) |
| 0.0 | 0.3 | GO:0004022 | alcohol dehydrogenase (NAD) activity(GO:0004022) |
| 0.0 | 0.7 | GO:0043621 | protein self-association(GO:0043621) |
| 0.0 | 0.0 | GO:0046480 | galactolipid galactosyltransferase activity(GO:0046480) |
| 0.0 | 0.2 | GO:0051087 | chaperone binding(GO:0051087) |
| 0.0 | 0.8 | GO:0051213 | dioxygenase activity(GO:0051213) |
| 0.0 | 0.1 | GO:0008107 | galactoside 2-alpha-L-fucosyltransferase activity(GO:0008107) alpha-(1,2)-fucosyltransferase activity(GO:0031127) |
| 0.0 | 0.2 | GO:0005452 | inorganic anion exchanger activity(GO:0005452) |
| 0.0 | 0.0 | GO:0004412 | homoserine dehydrogenase activity(GO:0004412) |
| 0.0 | 11.9 | GO:0043565 | sequence-specific DNA binding(GO:0043565) |
| 0.0 | 1.4 | GO:0004722 | protein serine/threonine phosphatase activity(GO:0004722) |
| 0.0 | 0.3 | GO:0005385 | zinc ion transmembrane transporter activity(GO:0005385) |
| 0.0 | 0.1 | GO:0005223 | intracellular cGMP activated cation channel activity(GO:0005223) |
| 0.0 | 0.2 | GO:0004743 | pyruvate kinase activity(GO:0004743) potassium ion binding(GO:0030955) alkali metal ion binding(GO:0031420) |
| 0.0 | 0.2 | GO:0005242 | inward rectifier potassium channel activity(GO:0005242) |
| 0.0 | 0.0 | GO:0036402 | proteasome-activating ATPase activity(GO:0036402) |
| 0.0 | 0.1 | GO:0004396 | hexokinase activity(GO:0004396) |
| 0.0 | 0.1 | GO:0008417 | fucosyltransferase activity(GO:0008417) |
| 0.0 | 4.3 | GO:0004674 | protein serine/threonine kinase activity(GO:0004674) |
| 0.0 | 0.2 | GO:0004525 | ribonuclease III activity(GO:0004525) double-stranded RNA-specific ribonuclease activity(GO:0032296) |
| 0.0 | 0.9 | GO:0051082 | unfolded protein binding(GO:0051082) |
Gene overrepresentation in curated gene sets: canonical pathways category:
| Log-likelihood per target | Total log-likelihood | Term | Description |
|---|---|---|---|
| 0.2 | 0.5 | SIG PIP3 SIGNALING IN CARDIAC MYOCTES | Genes related to PIP3 signaling in cardiac myocytes |
| 0.1 | 0.4 | PID ERBB1 INTERNALIZATION PATHWAY | Internalization of ErbB1 |
| 0.1 | 0.4 | PID ARF 3PATHWAY | Arf1 pathway |
| 0.1 | 0.1 | PID IL12 2PATHWAY | IL12-mediated signaling events |
| 0.1 | 0.2 | PID A6B1 A6B4 INTEGRIN PATHWAY | a6b1 and a6b4 Integrin signaling |
| 0.1 | 0.3 | PID CIRCADIAN PATHWAY | Circadian rhythm pathway |
| 0.1 | 0.2 | PID VEGFR1 PATHWAY | VEGFR1 specific signals |
| 0.0 | 0.2 | PID FGF PATHWAY | FGF signaling pathway |
| 0.0 | 0.2 | PID ERA GENOMIC PATHWAY | Validated nuclear estrogen receptor alpha network |
| 0.0 | 0.3 | PID AJDISS 2PATHWAY | Posttranslational regulation of adherens junction stability and dissassembly |
| 0.0 | 0.1 | PID TAP63 PATHWAY | Validated transcriptional targets of TAp63 isoforms |
| 0.0 | 0.1 | PID CDC42 PATHWAY | CDC42 signaling events |
| 0.0 | 0.1 | PID BETA CATENIN NUC PATHWAY | Regulation of nuclear beta catenin signaling and target gene transcription |
| 0.0 | 0.1 | NABA ECM GLYCOPROTEINS | Genes encoding structural ECM glycoproteins |
| 0.0 | 0.1 | PID ERBB1 DOWNSTREAM PATHWAY | ErbB1 downstream signaling |
Gene overrepresentation in curated gene sets: REACTOME pathways category:
| Log-likelihood per target | Total log-likelihood | Term | Description |
|---|---|---|---|
| 0.2 | 0.6 | REACTOME NEGATIVE REGULATION OF FGFR SIGNALING | Genes involved in Negative regulation of FGFR signaling |
| 0.1 | 0.4 | REACTOME COPI MEDIATED TRANSPORT | Genes involved in COPI Mediated Transport |
| 0.1 | 0.8 | REACTOME GLYCEROPHOSPHOLIPID BIOSYNTHESIS | Genes involved in Glycerophospholipid biosynthesis |
| 0.1 | 0.5 | REACTOME L1CAM INTERACTIONS | Genes involved in L1CAM interactions |
| 0.1 | 0.2 | REACTOME CITRIC ACID CYCLE TCA CYCLE | Genes involved in Citric acid cycle (TCA cycle) |
| 0.1 | 0.4 | REACTOME RECRUITMENT OF MITOTIC CENTROSOME PROTEINS AND COMPLEXES | Genes involved in Recruitment of mitotic centrosome proteins and complexes |
| 0.1 | 0.3 | REACTOME PRE NOTCH EXPRESSION AND PROCESSING | Genes involved in Pre-NOTCH Expression and Processing |
| 0.1 | 0.4 | REACTOME METABOLISM OF NUCLEOTIDES | Genes involved in Metabolism of nucleotides |
| 0.1 | 0.3 | REACTOME MITOCHONDRIAL PROTEIN IMPORT | Genes involved in Mitochondrial Protein Import |
| 0.1 | 0.3 | REACTOME SYNTHESIS OF BILE ACIDS AND BILE SALTS | Genes involved in Synthesis of bile acids and bile salts |
| 0.1 | 0.8 | REACTOME FATTY ACID TRIACYLGLYCEROL AND KETONE BODY METABOLISM | Genes involved in Fatty acid, triacylglycerol, and ketone body metabolism |
| 0.1 | 0.3 | REACTOME BMAL1 CLOCK NPAS2 ACTIVATES CIRCADIAN EXPRESSION | Genes involved in BMAL1:CLOCK/NPAS2 Activates Circadian Expression |
| 0.1 | 0.2 | REACTOME MEIOTIC SYNAPSIS | Genes involved in Meiotic Synapsis |
| 0.1 | 0.3 | REACTOME HOST INTERACTIONS OF HIV FACTORS | Genes involved in Host Interactions of HIV factors |
| 0.0 | 0.4 | REACTOME CHEMOKINE RECEPTORS BIND CHEMOKINES | Genes involved in Chemokine receptors bind chemokines |
| 0.0 | 0.1 | REACTOME PROCESSING OF CAPPED INTRON CONTAINING PRE MRNA | Genes involved in Processing of Capped Intron-Containing Pre-mRNA |
| 0.0 | 0.1 | REACTOME MRNA DECAY BY 5 TO 3 EXORIBONUCLEASE | Genes involved in mRNA Decay by 5' to 3' Exoribonuclease |
| 0.0 | 0.4 | REACTOME SIGNALING BY RHO GTPASES | Genes involved in Signaling by Rho GTPases |
| 0.0 | 0.2 | REACTOME POL SWITCHING | Genes involved in Polymerase switching |
| 0.0 | 0.5 | REACTOME FORMATION OF THE TERNARY COMPLEX AND SUBSEQUENTLY THE 43S COMPLEX | Genes involved in Formation of the ternary complex, and subsequently, the 43S complex |
| 0.0 | 0.1 | REACTOME NEUROTRANSMITTER RECEPTOR BINDING AND DOWNSTREAM TRANSMISSION IN THE POSTSYNAPTIC CELL | Genes involved in Neurotransmitter Receptor Binding And Downstream Transmission In The Postsynaptic Cell |
| 0.0 | 0.1 | REACTOME AMINO ACID SYNTHESIS AND INTERCONVERSION TRANSAMINATION | Genes involved in Amino acid synthesis and interconversion (transamination) |
| 0.0 | 0.1 | REACTOME SPHINGOLIPID DE NOVO BIOSYNTHESIS | Genes involved in Sphingolipid de novo biosynthesis |
| 0.0 | 0.1 | REACTOME BIOSYNTHESIS OF THE N GLYCAN PRECURSOR DOLICHOL LIPID LINKED OLIGOSACCHARIDE LLO AND TRANSFER TO A NASCENT PROTEIN | Genes involved in Biosynthesis of the N-glycan precursor (dolichol lipid-linked oligosaccharide, LLO) and transfer to a nascent protein |
| 0.0 | 0.1 | REACTOME FORMATION OF INCISION COMPLEX IN GG NER | Genes involved in Formation of incision complex in GG-NER |
| 0.0 | 0.1 | REACTOME GLUCOSE TRANSPORT | Genes involved in Glucose transport |
| 0.0 | 0.1 | REACTOME INTERFERON SIGNALING | Genes involved in Interferon Signaling |
| 0.0 | 0.1 | REACTOME RNA POL II PRE TRANSCRIPTION EVENTS | Genes involved in RNA Polymerase II Pre-transcription Events |
| 0.0 | 0.2 | REACTOME METABOLISM OF LIPIDS AND LIPOPROTEINS | Genes involved in Metabolism of lipids and lipoproteins |
| 0.0 | 0.1 | REACTOME E2F ENABLED INHIBITION OF PRE REPLICATION COMPLEX FORMATION | Genes involved in E2F-enabled inhibition of pre-replication complex formation |
| 0.0 | 0.0 | REACTOME INTEGRATION OF ENERGY METABOLISM | Genes involved in Integration of energy metabolism |