Project
GSE43616: Time-course of wild-type Arabidopsis leaf
Navigation
Downloads
Results for AT4G15090
Z-value: 0.76
Transcription factors associated with AT4G15090
| Gene Symbol | Gene ID | Gene Info |
|---|---|---|
|
AT4G15090
|
AT4G15090 | FRS (FAR1 Related Sequences) transcription factor family |
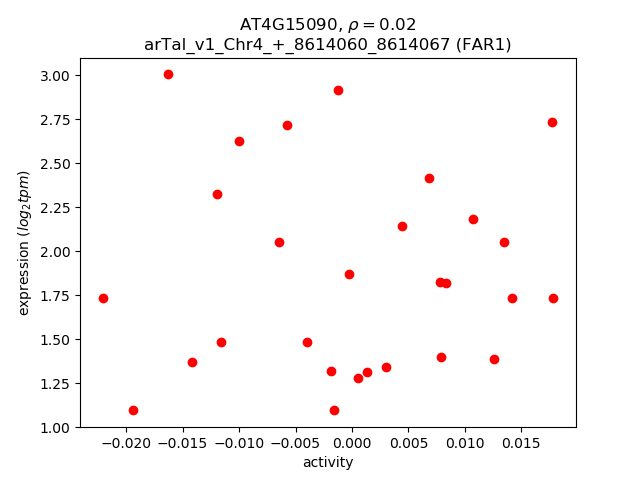
Activity-expression correlation:
| Gene | Promoter | Pearson corr. coef. | P-value | Plot |
|---|---|---|---|---|
| FAR1 | arTal_v1_Chr4_+_8614060_8614067 | 0.02 | 9.3e-01 | Click! |
Activity profile of AT4G15090 motif
Sorted Z-values of AT4G15090 motif
| Promoter | Log-likelihood | Transcript | Gene | Gene Info |
|---|---|---|---|---|
| arTal_v1_Chr2_-_6493512_6493512 | 1.45 |
AT2G15020.1
|
AT2G15020
|
hypothetical protein |
| arTal_v1_Chr3_-_1286760_1286760 | 1.35 |
AT3G04720.1
|
PR4
|
pathogenesis-related 4 |
| arTal_v1_Chr3_-_826585_826585 | 1.29 |
AT3G03470.1
|
CYP89A9
|
cytochrome P450, family 87, subfamily A, polypeptide 9 |
| arTal_v1_Chr1_-_27171410_27171410 | 1.00 |
AT1G72200.1
|
AT1G72200
|
RING/U-box superfamily protein |
| arTal_v1_Chr4_+_7304323_7304323 | 0.94 |
AT4G12290.2
|
AT4G12290
|
Copper amine oxidase family protein |
| arTal_v1_Chr4_+_7303985_7303985 | 0.93 |
AT4G12290.1
|
AT4G12290
|
Copper amine oxidase family protein |
| arTal_v1_Chr1_+_6450585_6450585 | 0.91 |
AT1G18710.1
|
MYB47
|
myb domain protein 47 |
| arTal_v1_Chr2_+_15192480_15192480 | 0.90 |
AT2G36220.1
|
AT2G36220
|
hypothetical protein |
| arTal_v1_Chr1_+_26651840_26651840 | 0.89 |
AT1G70690.1
|
HWI1
|
Receptor-like protein kinase-related family protein |
| arTal_v1_Chr2_+_17165191_17165191 | 0.85 |
AT2G41180.1
|
SIB2
|
VQ motif-containing protein |
| arTal_v1_Chr5_+_15501126_15501184 | 0.83 |
AT5G38710.1
AT5G38710.2 |
AT5G38710
|
Methylenetetrahydrofolate reductase family protein |
| arTal_v1_Chr5_+_17806397_17806397 | 0.79 |
AT5G44210.1
|
ERF9
|
erf domain protein 9 |
| arTal_v1_Chr4_-_12890261_12890262 | 0.76 |
AT4G25110.2
AT4G25110.1 |
MC2
|
metacaspase 2 |
| arTal_v1_Chr1_+_3945584_3945584 | 0.75 |
AT1G11700.1
|
AT1G11700
|
senescence regulator (Protein of unknown function, DUF584) |
| arTal_v1_Chr5_-_7826611_7826611 | 0.75 |
AT5G23230.1
|
NIC2
|
nicotinamidase 2 |
| arTal_v1_Chr4_-_8123835_8123835 | 0.74 |
AT4G14090.1
|
AT4G14090
|
UDP-Glycosyltransferase superfamily protein |
| arTal_v1_Chr1_+_29759030_29759158 | 0.72 |
AT1G79110.2
AT1G79110.3 AT1G79110.1 |
BRG2
|
zinc ion binding protein |
| arTal_v1_Chr5_+_19309227_19309227 | 0.64 |
AT5G47640.1
|
NF-YB2
|
nuclear factor Y, subunit B2 |
| arTal_v1_Chr3_+_8488695_8488695 | 0.63 |
AT3G23630.1
|
IPT7
|
isopentenyltransferase 7 |
| arTal_v1_Chr1_+_75390_75390 | 0.63 |
AT1G01180.1
|
AT1G01180
|
S-adenosyl-L-methionine-dependent methyltransferases superfamily protein |
| arTal_v1_Chr1_+_24458591_24458591 | 0.63 |
AT1G65760.1
|
AT1G65760
|
ascorbic acid mannose pathway regulator (DUF295) |
| arTal_v1_Chr5_-_7377667_7377776 | 0.61 |
AT5G22290.2
AT5G22290.1 |
NAC089
|
NAC domain containing protein 89 |
| arTal_v1_Chr3_-_18373147_18373147 | 0.61 |
AT3G49570.1
|
LSU3
|
response to low sulfur 3 |
| arTal_v1_Chr3_-_10941833_10941833 | 0.61 |
AT3G28920.1
|
HB34
|
homeobox protein 34 |
| arTal_v1_Chr2_+_16303295_16303295 | 0.60 |
AT2G39050.1
|
EULS3
|
hydroxyproline-rich glycoprotein family protein |
| arTal_v1_Chr5_+_7842607_7842607 | 0.59 |
AT5G23280.1
|
AT5G23280
|
TCP family transcription factor |
| arTal_v1_Chr4_+_18126057_18126057 | 0.58 |
AT4G38850.1
|
SAUR15
|
SAUR-like auxin-responsive protein family |
| arTal_v1_Chr5_-_21651626_21651713 | 0.57 |
AT5G53370.1
AT5G53370.2 |
PMEPCRF
|
pectin methylesterase PCR fragment F |
| arTal_v1_Chr1_+_27092893_27092893 | 0.57 |
AT1G71970.1
|
AT1G71970
|
hypothetical protein |
| arTal_v1_Chr4_+_9449114_9449114 | 0.56 |
AT4G16780.1
|
HB-2
|
homeobox protein 2 |
| arTal_v1_Chr4_-_15614544_15614544 | 0.56 |
AT4G32340.1
|
AT4G32340
|
Tetratricopeptide repeat (TPR)-like superfamily protein |
| arTal_v1_Chr5_-_4697078_4697078 | 0.55 |
AT5G14570.1
|
NRT2.7
|
high affinity nitrate transporter 2.7 |
| arTal_v1_Chr3_+_15567067_15567067 | 0.54 |
AT3G43670.1
|
AT3G43670
|
Copper amine oxidase family protein |
| arTal_v1_Chr4_-_1604628_1604628 | 0.54 |
AT4G03600.1
|
AT4G03600
|
pyrroline-5-carboxylate reductase |
| arTal_v1_Chr1_+_26832267_26832267 | 0.54 |
AT1G71180.1
|
AT1G71180
|
6-phosphogluconate dehydrogenase family protein |
| arTal_v1_Chr2_-_17098731_17098731 | 0.52 |
AT2G40970.1
|
MYBC1
|
Homeodomain-like superfamily protein |
| arTal_v1_Chr3_+_4642657_4642657 | 0.52 |
AT3G14020.2
|
NF-YA6
|
nuclear factor Y, subunit A6 |
| arTal_v1_Chr1_-_4577967_4577967 | 0.52 |
AT1G13360.2
AT1G13360.3 |
AT1G13360
|
hypothetical protein |
| arTal_v1_Chr1_-_4578369_4578369 | 0.51 |
AT1G13360.1
|
AT1G13360
|
hypothetical protein |
| arTal_v1_Chr1_+_8673914_8673914 | 0.50 |
AT1G24470.1
|
KCR2
|
beta-ketoacyl reductase 2 |
| arTal_v1_Chr3_-_8405289_8405289 | 0.50 |
AT3G23440.1
|
EDA6
|
embryo sac development arrest 6 |
| arTal_v1_Chr1_+_2187776_2187776 | 0.50 |
AT1G07130.1
|
STN1
|
Nucleic acid-binding, OB-fold-like protein |
| arTal_v1_Chr5_+_4427783_4427783 | 0.49 |
AT5G13720.1
|
AT5G13720
|
Uncharacterized protein family (UPF0114) |
| arTal_v1_Chr3_+_5081780_5081908 | 0.48 |
AT3G15095.2
AT3G15095.1 AT3G15095.3 |
HCF243
|
Serine/Threonine-kinase pakA-like protein |
| arTal_v1_Chr3_-_7709933_7709933 | 0.48 |
AT3G21890.1
|
BBX31
|
B-box type zinc finger family protein |
| arTal_v1_Chr2_+_11669629_11669629 | 0.48 |
AT2G27260.1
|
AT2G27260
|
Late embryogenesis abundant (LEA) hydroxyproline-rich glycoprotein family |
| arTal_v1_Chr1_-_22096620_22096620 | 0.48 |
AT1G60010.1
|
AT1G60010
|
D-ribose-binding periplasmic protein |
| arTal_v1_Chr2_+_16556801_16556801 | 0.47 |
AT2G39705.1
|
RTFL8
|
ROTUNDIFOLIA like 8 |
| arTal_v1_Chr1_+_26822517_26822517 | 0.47 |
AT1G71130.1
|
CRF8
|
Integrase-type DNA-binding superfamily protein |
| arTal_v1_Chr3_-_4660945_4660945 | 0.46 |
AT3G14067.1
|
AT3G14067
|
Subtilase family protein |
| arTal_v1_Chr3_+_4641930_4641930 | 0.46 |
AT3G14020.1
|
NF-YA6
|
nuclear factor Y, subunit A6 |
| arTal_v1_Chr3_+_19534585_19534585 | 0.46 |
AT3G52710.1
|
AT3G52710
|
hypothetical protein |
| arTal_v1_Chr3_+_21714911_21714912 | 0.46 |
AT3G58710.2
AT3G58710.1 |
WRKY69
|
WRKY DNA-binding protein 69 |
| arTal_v1_Chr4_-_15447042_15447042 | 0.46 |
AT4G31920.1
|
RR10
|
response regulator 10 |
| arTal_v1_Chr3_-_729638_729638 | 0.44 |
AT3G03150.1
|
AT3G03150
|
hypothetical protein |
| arTal_v1_Chr4_+_9928587_9928587 | 0.44 |
AT4G17870.1
|
PYR1
|
Polyketide cyclase/dehydrase and lipid transport superfamily protein |
| arTal_v1_Chr3_+_2288732_2288838 | 0.44 |
AT3G07195.1
AT3G07195.2 |
AT3G07195
|
RPM1-interacting protein 4 (RIN4) family protein |
| arTal_v1_Chr1_+_5168464_5168464 | 0.43 |
AT1G15000.1
|
scpl50
|
serine carboxypeptidase-like 50 |
| arTal_v1_Chr1_-_19822399_19822399 | 0.43 |
AT1G53170.1
|
ERF8
|
ethylene response factor 8 |
| arTal_v1_Chr4_+_2660156_2660156 | 0.43 |
AT4G05150.1
|
AT4G05150
|
Octicosapeptide/Phox/Bem1p family protein |
| arTal_v1_Chr1_-_8537780_8537780 | 0.42 |
AT1G24140.1
|
AT1G24140
|
Matrixin family protein |
| arTal_v1_Chr1_+_4547388_4547388 | 0.42 |
AT1G13280.1
|
AOC4
|
allene oxide cyclase 4 |
| arTal_v1_Chr4_-_15591213_15591213 | 0.41 |
AT4G32290.1
|
AT4G32290
|
Core-2/I-branching beta-1,6-N-acetylglucosaminyltransferase family protein |
| arTal_v1_Chr3_-_21008064_21008068 | 0.41 |
AT3G56710.1
AT3G56710.2 |
SIB1
|
sigma factor binding protein 1 |
| arTal_v1_Chr3_+_17644198_17644198 | 0.40 |
AT3G47820.1
|
PUB39
|
PLANT U-BOX 39 |
| arTal_v1_Chr5_-_16974877_16974877 | 0.39 |
AT5G42440.1
|
AT5G42440
|
Protein kinase superfamily protein |
| arTal_v1_Chr3_+_1172687_1172687 | 0.39 |
AT3G04420.2
AT3G04420.1 |
NAC048
|
NAC domain containing protein 48 |
| arTal_v1_Chr2_-_15556835_15556835 | 0.38 |
AT2G37035.1
|
AT2G37035
|
transmembrane protein |
| arTal_v1_Chr1_-_5055299_5055299 | 0.38 |
AT1G14690.2
AT1G14690.1 |
MAP65-7
|
microtubule-associated protein 65-7 |
| arTal_v1_Chr1_-_7534927_7534927 | 0.38 |
AT1G21520.1
|
AT1G21520
|
hypothetical protein |
| arTal_v1_Chr1_+_813413_813413 | 0.38 |
AT1G03310.1
AT1G03310.2 |
DBE1
|
debranching enzyme 1 |
| arTal_v1_Chr3_-_9710100_9710100 | 0.37 |
AT3G26500.1
|
PIRL2
|
plant intracellular ras group-related LRR 2 |
| arTal_v1_Chr1_-_182497_182534 | 0.37 |
AT1G01490.4
AT1G01490.3 |
AT1G01490
|
Heavy metal transport/detoxification superfamily protein |
| arTal_v1_Chr1_-_182749_182749 | 0.37 |
AT1G01490.2
AT1G01490.1 |
AT1G01490
|
Heavy metal transport/detoxification superfamily protein |
| arTal_v1_Chr3_-_18161486_18161486 | 0.37 |
AT3G48990.1
|
AAE3
|
AMP-dependent synthetase and ligase family protein |
| arTal_v1_Chr5_-_24185629_24185629 | 0.37 |
AT5G60050.1
|
AT5G60050
|
BTB/POZ domain-containing protein |
| arTal_v1_Chr4_+_17442612_17442612 | 0.37 |
AT4G37000.1
|
ACD2
|
accelerated cell death 2 (ACD2) |
| arTal_v1_Chr4_-_18329699_18329699 | 0.36 |
AT4G39403.1
|
PLS
|
polari |
| arTal_v1_Chr1_+_12455653_12455653 | 0.36 |
AT1G34200.1
|
AT1G34200
|
Glyceraldehyde-3-phosphate dehydrogenase-like family protein |
| arTal_v1_Chr4_-_18217616_18217616 | 0.36 |
AT4G39090.1
|
RD19
|
Papain family cysteine protease |
| arTal_v1_Chr4_+_12086898_12086898 | 0.36 |
AT4G23060.1
|
IQD22
|
IQ-domain 22 |
| arTal_v1_Chr1_+_22893101_22893101 | 0.36 |
AT1G61930.1
|
AT1G61930
|
senescence regulator (Protein of unknown function, DUF584) |
| arTal_v1_Chr4_-_543868_543939 | 0.35 |
AT4G01290.2
AT4G01290.1 |
AT4G01290
|
chorismate synthase |
| arTal_v1_Chr5_-_2508373_2508373 | 0.35 |
AT5G07840.1
|
PIA1
|
Ankyrin repeat family protein |
| arTal_v1_Chr1_+_1018058_1018058 | 0.34 |
AT1G03970.1
|
GBF4
|
G-box binding factor 4 |
| arTal_v1_Chr1_+_27029116_27029116 | 0.34 |
AT1G71865.1
|
AT1G71865
|
PyrD |
| arTal_v1_Chr5_+_17676795_17676823 | 0.34 |
AT5G43930.1
AT5G43930.3 AT5G43930.4 AT5G43930.2 |
AT5G43930
|
Transducin family protein / WD-40 repeat family protein |
| arTal_v1_Chr5_-_9486365_9486365 | 0.33 |
AT5G26960.1
|
AT5G26960
|
Galactose oxidase/kelch repeat superfamily protein |
| arTal_v1_Chr1_-_4590501_4590501 | 0.33 |
AT1G13380.1
|
AT1G13380
|
sodium/hydrogen exchanger (DUF1218) |
| arTal_v1_Chr2_+_13014859_13014859 | 0.33 |
AT2G30550.1
|
AT2G30550
|
alpha/beta-Hydrolases superfamily protein |
| arTal_v1_Chr5_-_2950695_2950695 | 0.33 |
AT5G09470.1
|
DIC3
|
dicarboxylate carrier 3 |
| arTal_v1_Chr4_-_18077369_18077369 | 0.32 |
AT4G38700.1
|
AT4G38700
|
Disease resistance-responsive (dirigent-like protein) family protein |
| arTal_v1_Chr1_-_12358966_12358966 | 0.32 |
AT1G34000.1
|
OHP2
|
one-helix protein 2 |
| arTal_v1_Chr5_+_26261136_26261136 | 0.32 |
AT5G65683.1
|
WAVH2
|
Zinc finger (C3HC4-type RING finger) family protein |
| arTal_v1_Chr3_+_20791173_20791173 | 0.31 |
AT3G56030.1
|
AT3G56030
|
Tetratricopeptide repeat (TPR)-like superfamily protein |
| arTal_v1_Chr3_+_9769634_9769666 | 0.31 |
AT3G26600.2
AT3G26600.1 |
ARO4
|
armadillo repeat only 4 |
| arTal_v1_Chr1_+_25765718_25765718 | 0.31 |
AT1G68620.1
|
AT1G68620
|
alpha/beta-Hydrolases superfamily protein |
| arTal_v1_Chr1_+_25319804_25319804 | 0.31 |
AT1G67560.1
|
LOX6
|
PLAT/LH2 domain-containing lipoxygenase family protein |
| arTal_v1_Chr3_+_2958676_2958676 | 0.30 |
AT3G09650.1
|
HCF152
|
Tetratricopeptide repeat (TPR)-like superfamily protein |
| arTal_v1_Chr1_+_28932868_28932868 | 0.30 |
AT1G76990.3
AT1G76990.2 |
ACR3
|
ACT domain repeat 3 |
| arTal_v1_Chr1_+_28932119_28932162 | 0.30 |
AT1G76990.1
AT1G76990.4 |
ACR3
|
ACT domain repeat 3 |
| arTal_v1_Chr4_+_13511837_13511837 | 0.30 |
AT4G26890.1
|
MAPKKK16
|
mitogen-activated protein kinase kinase kinase 16 |
| arTal_v1_Chr1_-_3241863_3241863 | 0.30 |
AT1G09950.1
|
RAS1
|
RESPONSE TO ABA AND SALT 1 |
| arTal_v1_Chr3_-_2037791_2037791 | 0.30 |
AT3G06540.1
|
REP
|
Rab escort protein |
| arTal_v1_Chr5_+_16779643_16779643 | 0.30 |
AT5G41920.1
|
AT5G41920
|
GRAS family transcription factor |
| arTal_v1_Chr5_+_24386010_24386010 | 0.29 |
AT5G60680.1
|
AT5G60680
|
transcription initiation factor TFIID subunit (Protein of unknown function, DUF584) |
| arTal_v1_Chr1_+_28932359_28932359 | 0.29 |
AT1G76990.5
|
ACR3
|
ACT domain repeat 3 |
| arTal_v1_Chr3_-_15953346_15953346 | 0.29 |
AT3G44260.1
|
CAF1a
|
Polynucleotidyl transferase, ribonuclease H-like superfamily protein |
| arTal_v1_Chr1_+_29387672_29387672 | 0.29 |
AT1G78100.1
|
AUF1
|
F-box family protein |
| arTal_v1_Chr5_-_25698971_25698971 | 0.29 |
AT5G64250.1
|
AT5G64250
|
Aldolase-type TIM barrel family protein |
| arTal_v1_Chr5_+_1767630_1767630 | 0.29 |
AT5G05870.1
|
UGT76C1
|
UDP-glucosyl transferase 76C1 |
| arTal_v1_Chr2_+_9645270_9645270 | 0.29 |
AT2G22680.1
|
WAVH1
|
Zinc finger (C3HC4-type RING finger) family protein |
| arTal_v1_Chr2_+_13014530_13014530 | 0.28 |
AT2G30550.2
|
AT2G30550
|
alpha/beta-Hydrolases superfamily protein |
| arTal_v1_Chr3_+_1983731_1983731 | 0.28 |
AT3G06470.1
|
AT3G06470
|
GNS1/SUR4 membrane protein family |
| arTal_v1_Chr3_+_23289243_23289243 | 0.28 |
AT3G63010.1
|
GID1B
|
alpha/beta-Hydrolases superfamily protein |
| arTal_v1_Chr1_+_20588397_20588397 | 0.28 |
AT1G55190.1
|
PRA7
|
PRA1 (Prenylated rab acceptor) family protein |
| arTal_v1_Chr3_-_19281345_19281393 | 0.28 |
AT3G51950.3
AT3G51950.1 AT3G51950.2 |
AT3G51950
|
Zinc finger (CCCH-type) family protein / RNA recognition motif (RRM)-containing protein |
| arTal_v1_Chr5_-_25699255_25699255 | 0.28 |
AT5G64250.2
|
AT5G64250
|
Aldolase-type TIM barrel family protein |
| arTal_v1_Chr5_+_23355337_23355337 | 0.28 |
AT5G57660.1
|
COL5
|
CONSTANS-like 5 |
| arTal_v1_Chr1_+_4423540_4423540 | 0.27 |
AT1G12970.1
|
PIRL3
|
plant intracellular ras group-related LRR 3 |
| arTal_v1_Chr5_+_1319074_1319074 | 0.27 |
AT5G04590.1
|
SIR
|
sulfite reductase |
| arTal_v1_Chr4_-_11732674_11732674 | 0.27 |
AT4G22150.1
|
PUX3
|
UBA/UBX domain protein |
| arTal_v1_Chr5_-_19533390_19533390 | 0.27 |
AT5G48170.1
|
SLY2
|
F-box family protein |
| arTal_v1_Chr1_-_11595982_11596056 | 0.26 |
AT1G32190.2
AT1G32190.1 |
AT1G32190
|
alpha/beta-Hydrolases superfamily protein |
| arTal_v1_Chr3_-_1837988_1837988 | 0.26 |
AT3G06080.2
AT3G06080.1 |
TBL10
|
trichome birefringence-like protein (DUF828) |
| arTal_v1_Chr1_-_19851725_19851725 | 0.26 |
AT1G53230.1
|
TCP3
|
TEOSINTE BRANCHED 1, cycloidea and PCF transcription factor 3 |
| arTal_v1_Chr1_+_7588414_7588414 | 0.26 |
AT1G21640.2
|
NADK2
|
NAD kinase 2 |
| arTal_v1_Chr1_+_7588589_7588589 | 0.26 |
AT1G21640.1
|
NADK2
|
NAD kinase 2 |
| arTal_v1_Chr2_+_12114062_12114062 | 0.26 |
AT2G28350.2
|
ARF10
|
auxin response factor 10 |
| arTal_v1_Chr3_+_17567126_17567126 | 0.26 |
AT3G47640.2
AT3G47640.3 |
PYE
|
basic helix-loop-helix (bHLH) DNA-binding superfamily protein |
| arTal_v1_Chr5_-_22764576_22764587 | 0.26 |
AT5G56240.1
AT5G56240.3 AT5G56240.2 |
AT5G56240
|
hapless protein |
| arTal_v1_Chr3_+_22804998_22804998 | 0.25 |
AT3G61630.1
|
CRF6
|
cytokinin response factor 6 |
| arTal_v1_Chr2_+_12113889_12113889 | 0.25 |
AT2G28350.1
|
ARF10
|
auxin response factor 10 |
| arTal_v1_Chr3_-_19280823_19280823 | 0.25 |
AT3G51950.4
|
AT3G51950
|
Zinc finger (CCCH-type) family protein / RNA recognition motif (RRM)-containing protein |
| arTal_v1_Chr1_-_7382543_7382661 | 0.25 |
AT1G21080.1
AT1G21080.3 |
AT1G21080
|
DNAJ heat shock N-terminal domain-containing protein |
| arTal_v1_Chr1_-_8153530_8153796 | 0.25 |
AT1G23020.2
AT1G23020.7 AT1G23020.6 AT1G23020.5 AT1G23020.4 AT1G23020.3 AT1G23020.1 |
FRO3
|
ferric reduction oxidase 3 |
| arTal_v1_Chr4_+_9385119_9385180 | 0.25 |
AT4G16670.2
AT4G16670.3 AT4G16670.1 |
AT4G16670
|
auxin canalization protein (DUF828) |
| arTal_v1_Chr5_-_7366799_7366799 | 0.25 |
AT5G22250.1
|
CAF1b
|
Polynucleotidyl transferase, ribonuclease H-like superfamily protein |
| arTal_v1_Chr2_-_18321696_18321696 | 0.25 |
AT2G44360.1
|
AT2G44360
|
ecotropic viral integration site protein |
| arTal_v1_Chr1_-_7382196_7382196 | 0.25 |
AT1G21080.2
|
AT1G21080
|
DNAJ heat shock N-terminal domain-containing protein |
| arTal_v1_Chr5_-_5006882_5006882 | 0.25 |
AT5G15410.1
AT5G15410.2 |
DND1
|
Cyclic nucleotide-regulated ion channel family protein |
| arTal_v1_Chr2_+_18785990_18785990 | 0.25 |
AT2G45590.1
|
AT2G45590
|
Protein kinase superfamily protein |
| arTal_v1_Chr1_+_29946185_29946185 | 0.25 |
AT1G79590.2
AT1G79590.1 |
SYP52
|
syntaxin of plants 52 |
| arTal_v1_Chr1_+_29741728_29741728 | 0.25 |
AT1G79060.1
|
AT1G79060
|
TPRXL |
| arTal_v1_Chr3_+_6120029_6120029 | 0.25 |
AT3G17860.3
AT3G17860.2 |
JAZ3
|
jasmonate-zim-domain protein 3 |
| arTal_v1_Chr3_-_16876083_16876083 | 0.24 |
AT3G45900.1
|
AT3G45900
|
Ribonuclease P protein subunit P38-like protein |
| arTal_v1_Chr5_+_21128085_21128129 | 0.24 |
AT5G52030.1
AT5G52030.2 |
AT5G52030
|
TraB family protein |
| arTal_v1_Chr2_+_17285731_17285837 | 0.24 |
AT2G41460.2
AT2G41460.4 |
ARP
|
apurinic endonuclease-redox protein |
| arTal_v1_Chr1_-_19851435_19851435 | 0.24 |
AT1G53230.2
|
TCP3
|
TEOSINTE BRANCHED 1, cycloidea and PCF transcription factor 3 |
| arTal_v1_Chr3_-_821652_821652 | 0.24 |
AT3G03450.1
|
RGL2
|
RGA-like 2 |
| arTal_v1_Chr3_-_1949916_1949916 | 0.23 |
AT3G06410.1
|
AT3G06410
|
Zinc finger C-x8-C-x5-C-x3-H type family protein |
| arTal_v1_Chr2_+_17285470_17285470 | 0.23 |
AT2G41460.3
AT2G41460.1 |
ARP
|
apurinic endonuclease-redox protein |
| arTal_v1_Chr5_-_26879639_26879639 | 0.23 |
AT5G67370.1
|
CGLD27
|
DUF1230 family protein (DUF1230) |
| arTal_v1_Chr1_-_7692459_7692459 | 0.23 |
AT1G21900.1
|
p24delta5
|
emp24/gp25L/p24 family/GOLD family protein |
| arTal_v1_Chr4_-_18381945_18381945 | 0.23 |
AT4G39550.1
|
AT4G39550
|
Galactose oxidase/kelch repeat superfamily protein |
| arTal_v1_Chr2_-_17481241_17481241 | 0.23 |
AT2G41890.1
|
AT2G41890
|
curculin-like (mannose-binding) lectin family protein / PAN domain-containing protein |
| arTal_v1_Chr5_+_3398790_3398790 | 0.23 |
AT5G10750.1
|
AT5G10750
|
enhanced disease resistance-like protein (DUF1336) |
| arTal_v1_Chr1_+_6744353_6744405 | 0.23 |
AT1G19480.1
AT1G19480.2 |
AT1G19480
|
DNA glycosylase superfamily protein |
| arTal_v1_Chr3_+_2476306_2476394 | 0.23 |
AT3G07760.3
AT3G07760.1 AT3G07760.4 AT3G07760.2 AT3G07760.5 AT3G07760.6 AT3G07760.9 AT3G07760.7 AT3G07760.8 |
AT3G07760
|
Sterile alpha motif (SAM) domain-containing protein |
| arTal_v1_Chr1_+_10224815_10224815 | 0.23 |
AT1G29260.1
|
PEX7
|
peroxin 7 |
| arTal_v1_Chr1_+_28274588_28274588 | 0.23 |
AT1G75360.1
AT1G75360.2 |
AT1G75360
|
transmembrane protein |
| arTal_v1_Chr1_+_27721190_27721190 | 0.22 |
AT1G73710.1
|
AT1G73710
|
Pentatricopeptide repeat (PPR) superfamily protein |
| arTal_v1_Chr2_-_17701417_17701417 | 0.22 |
AT2G42500.1
AT2G42500.2 AT2G42500.4 AT2G42500.5 AT2G42500.3 |
PP2A-3
|
protein phosphatase 2A-3 |
| arTal_v1_Chr3_+_20788610_20788610 | 0.22 |
AT3G56010.1
|
AT3G56010
|
transmembrane protein |
| arTal_v1_Chr5_-_3793026_3793026 | 0.22 |
AT5G11770.1
|
AT5G11770
|
NADH-ubiquinone oxidoreductase 20 kDa subunit |
| arTal_v1_Chr5_-_26804249_26804271 | 0.22 |
AT5G67180.1
AT5G67180.3 AT5G67180.4 AT5G67180.2 |
TOE3
|
target of early activation tagged (EAT) 3 |
| arTal_v1_Chr1_+_25230239_25230239 | 0.22 |
AT1G67340.1
|
AT1G67340
|
HCP-like superfamily protein with MYND-type zinc finger |
| arTal_v1_Chr1_-_21562965_21562966 | 0.22 |
AT1G58220.2
AT1G58220.1 |
AT1G58220
|
Homeodomain-like superfamily protein |
| arTal_v1_Chr1_-_3227083_3227083 | 0.21 |
AT1G09920.1
|
AT1G09920
|
TRAF-type zinc finger-like protein |
| arTal_v1_Chr5_+_3831500_3831500 | 0.21 |
AT5G11890.1
|
EMB3135
|
harpin-induced protein |
| arTal_v1_Chr5_-_22763923_22763923 | 0.21 |
AT5G56240.4
|
AT5G56240
|
hapless protein |
| arTal_v1_Chr1_+_29946474_29946474 | 0.21 |
AT1G79590.3
|
SYP52
|
syntaxin of plants 52 |
| arTal_v1_Chr1_+_9782847_9782847 | 0.21 |
AT1G28070.1
|
AT1G28070
|
ATP-dependent RNA helicase |
| arTal_v1_Chr2_+_221013_221020 | 0.21 |
AT2G01490.1
AT2G01490.2 |
PAHX
|
phytanoyl-CoA dioxygenase (PhyH) family protein |
| arTal_v1_Chr1_+_411664_411664 | 0.21 |
AT1G02170.1
|
MC1
|
metacaspase 1 |
| arTal_v1_Chr5_-_19218007_19218007 | 0.21 |
AT5G47370.1
|
HAT2
|
Homeobox-leucine zipper protein 4 (HB-4) / HD-ZIP protein |
| arTal_v1_Chr5_-_17739949_17739949 | 0.21 |
AT5G44080.1
|
AT5G44080
|
Basic-leucine zipper (bZIP) transcription factor family protein |
| arTal_v1_Chr1_+_30097336_30097336 | 0.21 |
AT1G80010.1
|
FRS8
|
FAR1-related sequence 8 |
| arTal_v1_Chr1_-_5241538_5241541 | 0.21 |
AT1G15220.1
AT1G15220.2 |
CCMH
|
cytochrome c biogenesis protein family |
| arTal_v1_Chr1_+_4989562_4989563 | 0.21 |
AT1G14580.3
AT1G14580.2 AT1G14580.1 |
AT1G14580
|
C2H2-like zinc finger protein |
| arTal_v1_Chr4_-_320935_320935 | 0.21 |
AT4G00752.1
|
AT4G00752
|
UBX domain-containing protein |
| arTal_v1_Chr3_-_5038114_5038114 | 0.20 |
AT3G14960.1
|
AT3G14960
|
Galactosyltransferase family protein |
| arTal_v1_Chr2_+_12776208_12776208 | 0.20 |
AT2G29970.1
|
AT2G29970
|
Double Clp-N motif-containing P-loop nucleoside triphosphate hydrolases superfamily protein |
| arTal_v1_Chr1_+_11464934_11465049 | 0.20 |
AT1G31930.2
AT1G31930.3 AT1G31930.4 AT1G31930.1 |
XLG3
|
extra-large GTP-binding protein 3 |
| arTal_v1_Chr3_+_6119707_6119707 | 0.20 |
AT3G17860.4
AT3G17860.1 |
JAZ3
|
jasmonate-zim-domain protein 3 |
| arTal_v1_Chr4_-_233652_233652 | 0.20 |
AT4G00530.1
|
AT4G00530
|
UvrABC system protein A |
| arTal_v1_Chr2_-_17090556_17090556 | 0.20 |
AT2G40950.1
|
BZIP17
|
Basic-leucine zipper (bZIP) transcription factor family protein |
| arTal_v1_Chr3_+_17567476_17567476 | 0.20 |
AT3G47640.1
|
PYE
|
basic helix-loop-helix (bHLH) DNA-binding superfamily protein |
| arTal_v1_Chr1_-_16800307_16800321 | 0.20 |
AT1G44170.2
AT1G44170.1 |
ALDH3H1
|
aldehyde dehydrogenase 3H1 |
| arTal_v1_Chr3_+_7912905_7912905 | 0.19 |
AT3G22380.2
AT3G22380.3 AT3G22380.1 |
TIC
|
time for coffee |
| arTal_v1_Chr2_+_1041388_1041388 | 0.19 |
AT2G03450.1
|
PAP9
|
purple acid phosphatase 9 |
| arTal_v1_Chr1_+_11465246_11465302 | 0.19 |
AT1G31930.5
AT1G31930.6 |
XLG3
|
extra-large GTP-binding protein 3 |
| arTal_v1_Chr5_-_3956185_3956185 | 0.19 |
AT5G12230.1
|
MED19A
|
mediator of RNA polymerase II transcription subunit 19a-like protein |
| arTal_v1_Chr4_-_18220324_18220324 | 0.19 |
AT4G39100.2
AT4G39100.1 |
SHL1
|
PHD finger family protein / bromo-adjacent homology (BAH) domain-containing protein |
| arTal_v1_Chr3_+_10073082_10073082 | 0.19 |
AT3G27270.1
|
AT3G27270
|
TRAM, LAG1 and CLN8 (TLC) lipid-sensing domain containing protein |
| arTal_v1_Chr3_-_7412457_7412457 | 0.19 |
AT3G21140.1
|
AT3G21140
|
Pyridoxamine 5'-phosphate oxidase family protein |
| arTal_v1_Chr3_+_18377409_18377560 | 0.19 |
AT3G49590.1
AT3G49590.3 AT3G49590.2 |
ATG13
|
Autophagy-related protein 13 |
| arTal_v1_Chr3_-_5912001_5912001 | 0.19 |
AT3G17310.3
|
DRM3
|
S-adenosyl-L-methionine-dependent methyltransferases superfamily protein |
| arTal_v1_Chr4_+_2029855_2029855 | 0.19 |
AT4G04210.1
|
PUX4
|
plant UBX domain containing protein 4 |
| arTal_v1_Chr5_-_3286347_3286347 | 0.19 |
AT5G10450.3
AT5G10450.2 AT5G10450.4 |
GRF6
|
G-box regulating factor 6 |
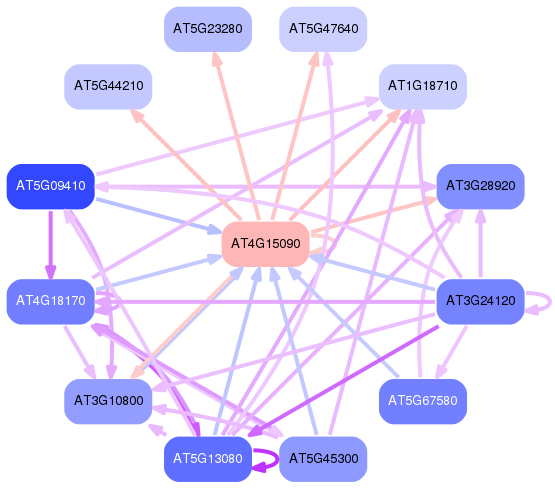
Network of associatons between targets according to the STRING database.

First level regulatory network of AT4G15090
Gene Ontology Analysis
Gene overrepresentation in biological process category:
| Log-likelihood per target | Total log-likelihood | Term | Description |
|---|---|---|---|
| 0.3 | 1.3 | GO:0051091 | positive regulation of sequence-specific DNA binding transcription factor activity(GO:0051091) |
| 0.1 | 0.5 | GO:0006741 | NADP biosynthetic process(GO:0006741) |
| 0.1 | 0.5 | GO:0031468 | nuclear envelope reassembly(GO:0031468) |
| 0.1 | 0.9 | GO:0009061 | anaerobic respiration(GO:0009061) |
| 0.1 | 0.5 | GO:0048442 | sepal development(GO:0048442) flower calyx development(GO:0048464) |
| 0.1 | 0.3 | GO:0010541 | acropetal auxin transport(GO:0010541) |
| 0.1 | 0.7 | GO:0007187 | G-protein coupled receptor signaling pathway, coupled to cyclic nucleotide second messenger(GO:0007187) adenylate cyclase-modulating G-protein coupled receptor signaling pathway(GO:0007188) |
| 0.1 | 0.3 | GO:0071422 | thiosulfate transport(GO:0015709) succinate transmembrane transport(GO:0071422) |
| 0.1 | 0.5 | GO:0000289 | nuclear-transcribed mRNA poly(A) tail shortening(GO:0000289) |
| 0.1 | 1.3 | GO:0080027 | response to herbivore(GO:0080027) |
| 0.1 | 1.0 | GO:0010262 | somatic embryogenesis(GO:0010262) |
| 0.1 | 0.6 | GO:0080190 | lateral growth(GO:0080190) |
| 0.1 | 0.2 | GO:0070509 | calcium ion import(GO:0070509) |
| 0.1 | 0.5 | GO:0016233 | telomere capping(GO:0016233) |
| 0.1 | 0.6 | GO:0045962 | positive regulation of development, heterochronic(GO:0045962) |
| 0.1 | 0.5 | GO:0071249 | cellular response to nitrate(GO:0071249) |
| 0.1 | 0.3 | GO:0019419 | sulfate reduction(GO:0019419) |
| 0.1 | 0.6 | GO:0009610 | response to symbiotic fungus(GO:0009610) |
| 0.0 | 0.1 | GO:0046499 | S-adenosylmethioninamine biosynthetic process(GO:0006557) S-adenosylmethioninamine metabolic process(GO:0046499) |
| 0.0 | 0.1 | GO:0010501 | RNA secondary structure unwinding(GO:0010501) |
| 0.0 | 0.5 | GO:0033683 | nucleotide-excision repair, DNA incision(GO:0033683) |
| 0.0 | 0.2 | GO:0006571 | tyrosine biosynthetic process(GO:0006571) |
| 0.0 | 0.2 | GO:0006285 | base-excision repair, AP site formation(GO:0006285) DNA dealkylation involved in DNA repair(GO:0006307) |
| 0.0 | 0.5 | GO:0010106 | cellular response to iron ion starvation(GO:0010106) |
| 0.0 | 0.7 | GO:0006574 | valine catabolic process(GO:0006574) |
| 0.0 | 0.4 | GO:1902584 | positive regulation of response to water deprivation(GO:1902584) |
| 0.0 | 0.1 | GO:0034625 | fatty acid elongation, saturated fatty acid(GO:0019367) fatty acid elongation, unsaturated fatty acid(GO:0019368) fatty acid elongation, monounsaturated fatty acid(GO:0034625) fatty acid elongation, polyunsaturated fatty acid(GO:0034626) |
| 0.0 | 0.3 | GO:0010325 | raffinose family oligosaccharide biosynthetic process(GO:0010325) |
| 0.0 | 0.3 | GO:1901001 | negative regulation of response to salt stress(GO:1901001) |
| 0.0 | 0.2 | GO:0048863 | stem cell differentiation(GO:0048863) |
| 0.0 | 0.1 | GO:0006990 | positive regulation of transcription from RNA polymerase II promoter involved in unfolded protein response(GO:0006990) positive regulation of transcription from RNA polymerase II promoter involved in cellular response to chemical stimulus(GO:1901522) |
| 0.0 | 0.8 | GO:2000033 | regulation of seed dormancy process(GO:2000033) |
| 0.0 | 0.7 | GO:0019674 | NAD metabolic process(GO:0019674) |
| 0.0 | 0.1 | GO:0010480 | microsporocyte differentiation(GO:0010480) |
| 0.0 | 0.8 | GO:0010207 | photosystem II assembly(GO:0010207) |
| 0.0 | 0.3 | GO:0018344 | protein geranylgeranylation(GO:0018344) |
| 0.0 | 0.5 | GO:0080036 | regulation of cytokinin-activated signaling pathway(GO:0080036) |
| 0.0 | 0.1 | GO:0006072 | glycerol-3-phosphate metabolic process(GO:0006072) |
| 0.0 | 0.4 | GO:0010021 | amylopectin biosynthetic process(GO:0010021) amylopectin metabolic process(GO:2000896) |
| 0.0 | 0.1 | GO:0048657 | anther wall tapetum formation(GO:0048656) anther wall tapetum cell differentiation(GO:0048657) |
| 0.0 | 0.1 | GO:0009647 | skotomorphogenesis(GO:0009647) |
| 0.0 | 0.7 | GO:0009269 | response to desiccation(GO:0009269) |
| 0.0 | 0.5 | GO:0070298 | negative regulation of ethylene-activated signaling pathway(GO:0010105) negative regulation of phosphorelay signal transduction system(GO:0070298) |
| 0.0 | 0.7 | GO:0009691 | cytokinin biosynthetic process(GO:0009691) |
| 0.0 | 0.1 | GO:0043479 | pigment accumulation in response to UV light(GO:0043478) pigment accumulation in tissues in response to UV light(GO:0043479) pigment accumulation in tissues(GO:0043480) anthocyanin accumulation in tissues in response to UV light(GO:0043481) |
| 0.0 | 0.4 | GO:0015996 | chlorophyll catabolic process(GO:0015996) |
| 0.0 | 0.7 | GO:0009695 | jasmonic acid biosynthetic process(GO:0009695) |
| 0.0 | 0.5 | GO:0098869 | cellular oxidant detoxification(GO:0098869) |
| 0.0 | 0.2 | GO:0006183 | GTP biosynthetic process(GO:0006183) |
| 0.0 | 0.1 | GO:0048830 | adventitious root development(GO:0048830) |
| 0.0 | 0.2 | GO:1990641 | response to iron ion starvation(GO:1990641) |
| 0.0 | 0.7 | GO:0009718 | anthocyanin-containing compound biosynthetic process(GO:0009718) |
| 0.0 | 0.4 | GO:0043649 | dicarboxylic acid catabolic process(GO:0043649) |
| 0.0 | 0.2 | GO:0006120 | mitochondrial electron transport, NADH to ubiquinone(GO:0006120) |
| 0.0 | 0.1 | GO:0000187 | activation of MAPK activity(GO:0000187) positive regulation of MAP kinase activity(GO:0043406) |
| 0.0 | 1.4 | GO:0043067 | regulation of programmed cell death(GO:0043067) |
| 0.0 | 0.2 | GO:0016558 | protein import into peroxisome matrix(GO:0016558) |
| 0.0 | 0.2 | GO:0017006 | protein-tetrapyrrole linkage(GO:0017006) |
| 0.0 | 0.3 | GO:0009937 | regulation of gibberellic acid mediated signaling pathway(GO:0009937) |
| 0.0 | 0.3 | GO:0048829 | root cap development(GO:0048829) |
| 0.0 | 0.6 | GO:0048574 | long-day photoperiodism, flowering(GO:0048574) |
| 0.0 | 0.3 | GO:0007602 | phototransduction(GO:0007602) red, far-red light phototransduction(GO:0009585) |
| 0.0 | 0.2 | GO:0097031 | mitochondrial respiratory chain complex I assembly(GO:0032981) mitochondrial respiratory chain complex I biogenesis(GO:0097031) |
| 0.0 | 0.2 | GO:0016559 | peroxisome fission(GO:0016559) |
| 0.0 | 0.6 | GO:0009910 | negative regulation of flower development(GO:0009910) |
| 0.0 | 0.6 | GO:0055046 | microgametogenesis(GO:0055046) |
| 0.0 | 0.4 | GO:0050826 | response to freezing(GO:0050826) |
| 0.0 | 0.1 | GO:0006880 | intracellular sequestering of iron ion(GO:0006880) sequestering of iron ion(GO:0097577) |
| 0.0 | 0.6 | GO:0090332 | stomatal closure(GO:0090332) |
| 0.0 | 0.1 | GO:0043266 | regulation of potassium ion transport(GO:0043266) |
| 0.0 | 0.1 | GO:0009094 | L-phenylalanine biosynthetic process(GO:0009094) aromatic amino acid family biosynthetic process, prephenate pathway(GO:0009095) erythrose 4-phosphate/phosphoenolpyruvate family amino acid biosynthetic process(GO:1902223) |
| 0.0 | 0.1 | GO:0006882 | cellular zinc ion homeostasis(GO:0006882) |
| 0.0 | 0.2 | GO:1905037 | autophagosome assembly(GO:0000045) autophagosome organization(GO:1905037) |
| 0.0 | 0.6 | GO:0009809 | lignin biosynthetic process(GO:0009809) |
Gene overrepresentation in cellular component category:
| Log-likelihood per target | Total log-likelihood | Term | Description |
|---|---|---|---|
| 0.2 | 0.5 | GO:0030015 | CCR4-NOT core complex(GO:0030015) |
| 0.1 | 1.0 | GO:0016602 | CCAAT-binding factor complex(GO:0016602) |
| 0.0 | 0.2 | GO:0031907 | peroxisomal matrix(GO:0005782) microbody lumen(GO:0031907) |
| 0.0 | 0.3 | GO:0005968 | Rab-protein geranylgeranyltransferase complex(GO:0005968) |
| 0.0 | 0.3 | GO:0005834 | heterotrimeric G-protein complex(GO:0005834) |
| 0.0 | 0.2 | GO:0005776 | autophagosome(GO:0005776) |
| 0.0 | 0.3 | GO:0016272 | prefoldin complex(GO:0016272) |
| 0.0 | 0.5 | GO:0000784 | nuclear chromosome, telomeric region(GO:0000784) |
| 0.0 | 0.3 | GO:0005801 | cis-Golgi network(GO:0005801) |
| 0.0 | 0.1 | GO:0031083 | BLOC complex(GO:0031082) BLOC-1 complex(GO:0031083) |
| 0.0 | 0.7 | GO:0042644 | chloroplast nucleoid(GO:0042644) |
| 0.0 | 0.2 | GO:0035267 | NuA4 histone acetyltransferase complex(GO:0035267) H4/H2A histone acetyltransferase complex(GO:0043189) H4 histone acetyltransferase complex(GO:1902562) |
| 0.0 | 0.1 | GO:0010445 | nuclear dicing body(GO:0010445) |
| 0.0 | 0.2 | GO:0030140 | trans-Golgi network transport vesicle(GO:0030140) |
| 0.0 | 0.2 | GO:0033179 | proton-transporting V-type ATPase, V0 domain(GO:0033179) |
Gene overrepresentation in molecular function category:
| Log-likelihood per target | Total log-likelihood | Term | Description |
|---|---|---|---|
| 0.2 | 0.7 | GO:0008936 | nicotinamidase activity(GO:0008936) |
| 0.2 | 0.7 | GO:0008442 | 3-hydroxyisobutyrate dehydrogenase activity(GO:0008442) |
| 0.2 | 0.5 | GO:0008311 | phosphodiesterase I activity(GO:0004528) double-stranded DNA 3'-5' exodeoxyribonuclease activity(GO:0008311) |
| 0.1 | 1.3 | GO:0008061 | chitin binding(GO:0008061) |
| 0.1 | 0.5 | GO:0004535 | poly(A)-specific ribonuclease activity(GO:0004535) |
| 0.1 | 0.4 | GO:0046423 | allene-oxide cyclase activity(GO:0046423) |
| 0.1 | 0.7 | GO:0016621 | cinnamoyl-CoA reductase activity(GO:0016621) |
| 0.1 | 0.3 | GO:0010331 | gibberellin binding(GO:0010331) |
| 0.1 | 0.4 | GO:0019156 | isoamylase activity(GO:0019156) |
| 0.1 | 0.3 | GO:0015117 | thiosulfate transmembrane transporter activity(GO:0015117) |
| 0.1 | 0.7 | GO:0052622 | ATP dimethylallyltransferase activity(GO:0052622) ADP dimethylallyltransferase activity(GO:0052623) |
| 0.1 | 0.6 | GO:0016703 | oxidoreductase activity, acting on single donors with incorporation of molecular oxygen, incorporation of one atom of oxygen (internal monooxygenases or internal mixed function oxidases)(GO:0016703) |
| 0.1 | 0.3 | GO:0016165 | linoleate 13S-lipoxygenase activity(GO:0016165) |
| 0.1 | 0.2 | GO:0032131 | alkylated DNA binding(GO:0032131) |
| 0.1 | 0.4 | GO:0031956 | medium-chain fatty acid-CoA ligase activity(GO:0031956) |
| 0.1 | 0.3 | GO:0010313 | phytochrome binding(GO:0010313) |
| 0.1 | 0.3 | GO:0004028 | 3-chloroallyl aldehyde dehydrogenase activity(GO:0004028) |
| 0.1 | 0.3 | GO:0001664 | G-protein coupled receptor binding(GO:0001664) G-protein beta/gamma-subunit complex binding(GO:0031683) |
| 0.1 | 0.2 | GO:0000268 | peroxisome targeting sequence binding(GO:0000268) |
| 0.1 | 0.5 | GO:0035198 | miRNA binding(GO:0035198) |
| 0.0 | 0.3 | GO:0004664 | prephenate dehydratase activity(GO:0004664) arogenate dehydratase activity(GO:0047769) |
| 0.0 | 0.1 | GO:0004014 | adenosylmethionine decarboxylase activity(GO:0004014) |
| 0.0 | 0.5 | GO:0015112 | nitrate transmembrane transporter activity(GO:0015112) |
| 0.0 | 0.1 | GO:0008253 | 5'-nucleotidase activity(GO:0008253) |
| 0.0 | 0.2 | GO:0005221 | intracellular cyclic nucleotide activated cation channel activity(GO:0005221) cyclic nucleotide-gated ion channel activity(GO:0043855) |
| 0.0 | 0.5 | GO:0030674 | protein binding, bridging(GO:0030674) |
| 0.0 | 0.2 | GO:1990841 | promoter-specific chromatin binding(GO:1990841) |
| 0.0 | 0.3 | GO:0010328 | auxin influx transmembrane transporter activity(GO:0010328) |
| 0.0 | 0.3 | GO:0005092 | GDP-dissociation inhibitor activity(GO:0005092) |
| 0.0 | 0.3 | GO:0004930 | G-protein coupled receptor activity(GO:0004930) |
| 0.0 | 0.1 | GO:0004322 | ferroxidase activity(GO:0004322) oxidoreductase activity, oxidizing metal ions, oxygen as acceptor(GO:0016724) |
| 0.0 | 0.2 | GO:0048038 | quinone binding(GO:0048038) |
| 0.0 | 0.3 | GO:0016722 | ferric-chelate reductase activity(GO:0000293) oxidoreductase activity, oxidizing metal ions(GO:0016722) oxidoreductase activity, oxidizing metal ions, NAD or NADP as acceptor(GO:0016723) |
| 0.0 | 0.7 | GO:0016597 | amino acid binding(GO:0016597) |
| 0.0 | 0.2 | GO:0016161 | beta-amylase activity(GO:0016161) |
| 0.0 | 0.1 | GO:0098599 | palmitoyl hydrolase activity(GO:0098599) |
| 0.0 | 0.4 | GO:0045309 | protein phosphorylated amino acid binding(GO:0045309) phosphoprotein binding(GO:0051219) |
| 0.0 | 0.2 | GO:0051117 | ATPase binding(GO:0051117) |
| 0.0 | 0.2 | GO:0048040 | UDP-glucuronate decarboxylase activity(GO:0048040) |
| 0.0 | 0.3 | GO:0046961 | proton-transporting ATPase activity, rotational mechanism(GO:0046961) |
| 0.0 | 0.1 | GO:0003680 | AT DNA binding(GO:0003680) |
| 0.0 | 0.1 | GO:0050378 | UDP-glucuronate 4-epimerase activity(GO:0050378) |
| 0.0 | 0.7 | GO:0080044 | quercetin 7-O-glucosyltransferase activity(GO:0080044) |
| 0.0 | 0.1 | GO:0009922 | fatty acid elongase activity(GO:0009922) |
| 0.0 | 0.0 | GO:0080042 | ADP-glucose pyrophosphohydrolase activity(GO:0080042) |
| 0.0 | 0.2 | GO:0004864 | protein phosphatase inhibitor activity(GO:0004864) |
| 0.0 | 0.0 | GO:0015173 | aromatic amino acid transmembrane transporter activity(GO:0015173) |
Gene overrepresentation in curated gene sets: canonical pathways category:
| Log-likelihood per target | Total log-likelihood | Term | Description |
|---|---|---|---|
| 0.0 | 0.2 | SIG INSULIN RECEPTOR PATHWAY IN CARDIAC MYOCYTES | Genes related to the insulin receptor pathway |
| 0.0 | 0.0 | PID IL12 2PATHWAY | IL12-mediated signaling events |
Gene overrepresentation in curated gene sets: REACTOME pathways category:
| Log-likelihood per target | Total log-likelihood | Term | Description |
|---|---|---|---|
| 0.1 | 0.7 | REACTOME CHEMOKINE RECEPTORS BIND CHEMOKINES | Genes involved in Chemokine receptors bind chemokines |