Project
GSE43616: Time-course of wild-type Arabidopsis leaf
Navigation
Downloads
Results for AT4G01930
Z-value: 0.05
Transcription factors associated with AT4G01930
| Gene Symbol | Gene ID | Gene Info |
|---|---|---|
|
AT4G01930
|
AT4G01930 | Cysteine/Histidine-rich C1 domain family protein |
Activity-expression correlation:
| Gene | Promoter | Pearson corr. coef. | P-value | Plot |
|---|---|---|---|---|
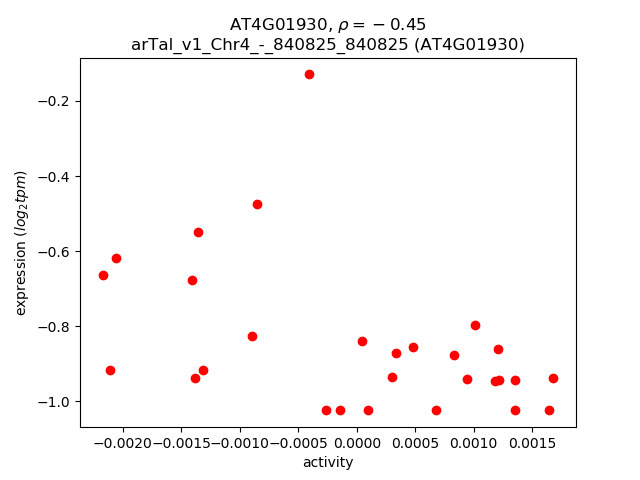
| AT4G01930 | arTal_v1_Chr4_-_840825_840825 | -0.45 | 1.6e-02 | Click! |
Activity profile of AT4G01930 motif
Sorted Z-values of AT4G01930 motif
| Promoter | Log-likelihood | Transcript | Gene | Gene Info |
|---|---|---|---|---|
| arTal_v1_Chr4_-_6240054_6240054 | 0.03 |
AT4G09960.6
|
STK
|
K-box region and MADS-box transcription factor family protein |
| arTal_v1_Chr4_-_6241281_6241281 | 0.03 |
AT4G09960.4
|
STK
|
K-box region and MADS-box transcription factor family protein |
| arTal_v1_Chr4_-_6240973_6240973 | 0.03 |
AT4G09960.1
|
STK
|
K-box region and MADS-box transcription factor family protein |
| arTal_v1_Chr4_-_6240681_6240820 | 0.03 |
AT4G09960.3
AT4G09960.5 AT4G09960.2 |
STK
|
K-box region and MADS-box transcription factor family protein |
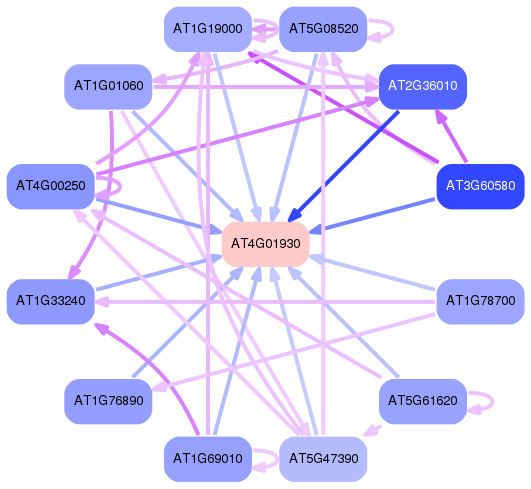
Network of associatons between targets according to the STRING database.

First level regulatory network of AT4G01930
Gene Ontology Analysis
Gene overrepresentation in cellular component category:
| Log-likelihood per target | Total log-likelihood | Term | Description |
|---|---|---|---|
| 0.0 | 0.1 | GO:0090397 | stigma papilla(GO:0090397) |