Project
GSE43616: Time-course of wild-type Arabidopsis leaf
Navigation
Downloads
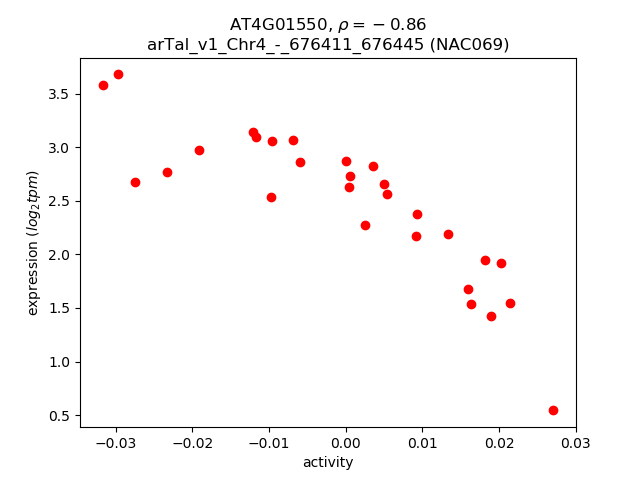
Results for AT4G01550
Z-value: 1.34
Transcription factors associated with AT4G01550
| Gene Symbol | Gene ID | Gene Info |
|---|---|---|
|
AT4G01550
|
AT4G01550 | NAC domain containing protein 69 |
Activity-expression correlation:
| Gene | Promoter | Pearson corr. coef. | P-value | Plot |
|---|---|---|---|---|
| NAC069 | arTal_v1_Chr4_-_676411_676445 | -0.86 | 5.2e-09 | Click! |
Activity profile of AT4G01550 motif
Sorted Z-values of AT4G01550 motif
| Promoter | Log-likelihood | Transcript | Gene | Gene Info |
|---|---|---|---|---|
| arTal_v1_Chr1_-_29635931_29635931 | 6.10 |
AT1G78820.1
|
AT1G78820
|
D-mannose binding lectin protein with Apple-like carbohydrate-binding domain-containing protein |
| arTal_v1_Chr3_-_197974_197974 | 5.96 |
AT3G01500.1
|
CA1
|
carbonic anhydrase 1 |
| arTal_v1_Chr1_+_3157501_3157501 | 5.96 |
AT1G09750.1
|
AT1G09750
|
Eukaryotic aspartyl protease family protein |
| arTal_v1_Chr3_-_198160_198160 | 5.91 |
AT3G01500.2
|
CA1
|
carbonic anhydrase 1 |
| arTal_v1_Chr3_-_198664_198664 | 5.88 |
AT3G01500.3
|
CA1
|
carbonic anhydrase 1 |
| arTal_v1_Chr3_-_197564_197564 | 5.80 |
AT3G01500.4
|
CA1
|
carbonic anhydrase 1 |
| arTal_v1_Chr4_-_17777445_17777445 | 5.48 |
AT4G37800.1
|
XTH7
|
xyloglucan endotransglucosylase/hydrolase 7 |
| arTal_v1_Chr2_-_17648945_17649062 | 4.97 |
AT2G42380.1
AT2G42380.4 AT2G42380.3 AT2G42380.2 AT2G42380.5 |
BZIP34
|
Basic-leucine zipper (bZIP) transcription factor family protein |
| arTal_v1_Chr1_-_20648891_20648891 | 4.94 |
AT1G55330.1
|
AGP21
|
arabinogalactan protein 21 |
| arTal_v1_Chr1_+_10371675_10371675 | 4.69 |
AT1G29660.1
|
AT1G29660
|
GDSL-like Lipase/Acylhydrolase superfamily protein |
| arTal_v1_Chr3_+_17228642_17228642 | 4.60 |
AT3G46780.1
|
PTAC16
|
plastid transcriptionally active 16 |
| arTal_v1_Chr4_-_10391298_10391298 | 4.57 |
AT4G18970.1
|
AT4G18970
|
GDSL-like Lipase/Acylhydrolase superfamily protein |
| arTal_v1_Chr4_-_10390991_10390991 | 4.53 |
AT4G18970.2
|
AT4G18970
|
GDSL-like Lipase/Acylhydrolase superfamily protein |
| arTal_v1_Chr5_+_625254_625254 | 4.44 |
AT5G02760.1
|
AT5G02760
|
Protein phosphatase 2C family protein |
| arTal_v1_Chr4_-_176870_176870 | 4.32 |
AT4G00400.1
|
GPAT8
|
glycerol-3-phosphate acyltransferase 8 |
| arTal_v1_Chr5_-_6976036_6976036 | 4.30 |
AT5G20630.1
|
GER3
|
germin 3 |
| arTal_v1_Chr2_+_16476198_16476216 | 4.20 |
AT2G39470.1
AT2G39470.2 AT2G39470.3 |
PnsL1
|
PsbP-like protein 2 |
| arTal_v1_Chr5_+_22038165_22038165 | 4.14 |
AT5G54270.1
|
LHCB3
|
light-harvesting chlorophyll B-binding protein 3 |
| arTal_v1_Chr4_+_12660687_12660687 | 4.08 |
AT4G24510.1
|
CER2
|
HXXXD-type acyl-transferase family protein |
| arTal_v1_Chr5_+_18634041_18634041 | 4.06 |
AT5G45950.1
|
AT5G45950
|
GDSL-like Lipase/Acylhydrolase superfamily protein |
| arTal_v1_Chr1_+_4001113_4001295 | 4.02 |
AT1G11860.3
AT1G11860.1 AT1G11860.2 |
AT1G11860
|
Glycine cleavage T-protein family |
| arTal_v1_Chr1_-_27340044_27340044 | 4.01 |
AT1G72610.1
|
GER1
|
germin-like protein 1 |
| arTal_v1_Chr3_-_16448844_16448844 | 3.96 |
AT3G44990.1
|
XTH31
|
xyloglucan endo-transglycosylase-related 8 |
| arTal_v1_Chr5_-_14562863_14562863 | 3.92 |
AT5G36910.1
|
THI2.2
|
thionin 2.2 |
| arTal_v1_Chr5_-_4171954_4171954 | 3.91 |
AT5G13140.1
|
AT5G13140
|
Pollen Ole e 1 allergen and extensin family protein |
| arTal_v1_Chr5_-_18026077_18026077 | 3.82 |
AT5G44680.1
|
AT5G44680
|
DNA glycosylase superfamily protein |
| arTal_v1_Chr3_+_251868_251868 | 3.80 |
AT3G01680.1
|
SEOR1
|
sieve element occlusion amino-terminus protein |
| arTal_v1_Chr3_-_7557969_7557969 | 3.76 |
AT3G21460.1
|
AT3G21460
|
Glutaredoxin family protein |
| arTal_v1_Chr1_-_983544_983544 | 3.75 |
AT1G03870.1
|
FLA9
|
FASCICLIN-like arabinoogalactan 9 |
| arTal_v1_Chr1_+_7252111_7252111 | 3.70 |
AT1G20850.1
|
XCP2
|
xylem cysteine peptidase 2 |
| arTal_v1_Chr2_-_15474717_15474828 | 3.70 |
AT2G36870.2
AT2G36870.1 |
XTH32
|
xyloglucan endotransglucosylase/hydrolase 32 |
| arTal_v1_Chr1_+_17918207_17918207 | 3.70 |
AT1G48480.1
|
RKL1
|
receptor-like kinase 1 |
| arTal_v1_Chr3_-_2334185_2334185 | 3.70 |
AT3G07320.1
|
AT3G07320
|
O-Glycosyl hydrolases family 17 protein |
| arTal_v1_Chr1_-_28419635_28419635 | 3.68 |
AT1G75680.1
|
GH9B7
|
glycosyl hydrolase 9B7 |
| arTal_v1_Chr1_-_6999839_6999839 | 3.67 |
AT1G20190.1
|
EXPA11
|
expansin 11 |
| arTal_v1_Chr5_+_21020014_21020014 | 3.57 |
AT5G51750.1
|
SBT1.3
|
subtilase 1.3 |
| arTal_v1_Chr1_+_24778257_24778257 | 3.56 |
AT1G66430.1
|
AT1G66430
|
pfkB-like carbohydrate kinase family protein |
| arTal_v1_Chr1_+_26141726_26141836 | 3.52 |
AT1G69530.2
AT1G69530.1 AT1G69530.3 AT1G69530.5 AT1G69530.4 |
EXPA1
|
expansin A1 |
| arTal_v1_Chr4_-_16583075_16583075 | 3.49 |
AT4G34760.1
|
AT4G34760
|
SAUR-like auxin-responsive protein family |
| arTal_v1_Chr1_-_6999523_6999523 | 3.46 |
AT1G20190.2
|
EXPA11
|
expansin 11 |
| arTal_v1_Chr1_+_19454798_19454798 | 3.42 |
AT1G52230.1
|
PSAH2
|
photosystem I subunit H2 |
| arTal_v1_Chr1_-_21614169_21614169 | 3.41 |
AT1G58270.1
|
ZW9
|
TRAF-like family protein |
| arTal_v1_Chr5_+_16468327_16468344 | 3.32 |
AT5G41140.1
AT5G41140.2 |
AT5G41140
|
Myosin heavy chain-related protein |
| arTal_v1_Chr3_-_15617149_15617149 | 3.28 |
AT3G43720.2
|
LTPG2
|
Bifunctional inhibitor/lipid-transfer protein/seed storage 2S albumin superfamily protein |
| arTal_v1_Chr1_+_10477885_10477885 | 3.26 |
AT1G29930.1
|
CAB1
|
chlorophyll A/B binding protein 1 |
| arTal_v1_Chr3_-_15617309_15617309 | 3.25 |
AT3G43720.1
|
LTPG2
|
Bifunctional inhibitor/lipid-transfer protein/seed storage 2S albumin superfamily protein |
| arTal_v1_Chr2_-_7954680_7954785 | 3.25 |
AT2G18300.1
AT2G18300.3 AT2G18300.2 |
HBI1
|
basic helix-loop-helix (bHLH) DNA-binding superfamily protein |
| arTal_v1_Chr4_-_18370698_18370698 | 3.23 |
AT4G39510.1
|
CYP96A12
|
cytochrome P450, family 96, subfamily A, polypeptide 12 |
| arTal_v1_Chr5_-_17581275_17581275 | 3.22 |
AT5G43750.1
|
PnsB5
|
NAD(P)H dehydrogenase 18 |
| arTal_v1_Chr1_+_27452748_27452766 | 3.20 |
AT1G72970.1
AT1G72970.2 |
HTH
|
Glucose-methanol-choline (GMC) oxidoreductase family protein |
| arTal_v1_Chr5_-_990630_990630 | 3.17 |
AT5G03760.1
|
ATCSLA09
|
Nucleotide-diphospho-sugar transferases superfamily protein |
| arTal_v1_Chr1_+_16871696_16871696 | 3.14 |
AT1G44575.2
|
NPQ4
|
Chlorophyll A-B binding family protein |
| arTal_v1_Chr1_+_16871511_16871511 | 3.14 |
AT1G44575.3
|
NPQ4
|
Chlorophyll A-B binding family protein |
| arTal_v1_Chr2_+_19191247_19191247 | 3.12 |
AT2G46710.1
|
ROPGAP3
|
Rho GTPase activating protein with PAK-box/P21-Rho-binding domain-containing protein |
| arTal_v1_Chr1_+_16870221_16870221 | 3.12 |
AT1G44575.1
|
NPQ4
|
Chlorophyll A-B binding family protein |
| arTal_v1_Chr5_-_8916856_8916856 | 3.07 |
AT5G25610.1
|
RD22
|
BURP domain-containing protein |
| arTal_v1_Chr3_+_21076505_21076505 | 3.06 |
AT3G56940.1
AT3G56940.2 |
CRD1
|
dicarboxylate diiron protein, putative (Crd1) |
| arTal_v1_Chr3_+_188321_188384 | 3.05 |
AT3G01480.1
AT3G01480.2 |
CYP38
|
cyclophilin 38 |
| arTal_v1_Chr2_+_14427509_14427893 | 3.04 |
AT2G34170.3
AT2G34170.2 AT2G34170.1 AT2G34170.4 AT2G34170.5 AT2G34170.6 |
AT2G34170
|
hypothetical protein (DUF688) |
| arTal_v1_Chr4_+_12390167_12390167 | 3.03 |
AT4G23800.1
AT4G23800.2 |
3xHMG-box2
|
HMG (high mobility group) box protein |
| arTal_v1_Chr2_+_18286321_18286321 | 3.03 |
AT2G44230.1
|
AT2G44230
|
hypothetical protein (DUF946) |
| arTal_v1_Chr1_-_18405493_18405681 | 3.02 |
AT1G49730.3
AT1G49730.4 AT1G49730.2 AT1G49730.5 AT1G49730.1 |
AT1G49730
|
Protein kinase superfamily protein |
| arTal_v1_Chr3_-_5469594_5469594 | 3.01 |
AT3G16140.1
|
PSAH-1
|
photosystem I subunit H-1 |
| arTal_v1_Chr1_-_15607966_15607966 | 3.00 |
AT1G41830.1
|
SKS6
|
SKU5-similar 6 |
| arTal_v1_Chr4_-_18165740_18165740 | 2.96 |
AT4G38970.2
|
FBA2
|
fructose-bisphosphate aldolase 2 |
| arTal_v1_Chr4_-_18166008_18166008 | 2.96 |
AT4G38970.1
|
FBA2
|
fructose-bisphosphate aldolase 2 |
| arTal_v1_Chr3_-_20576249_20576249 | 2.95 |
AT3G55500.1
|
EXPA16
|
expansin A16 |
| arTal_v1_Chr1_-_20803449_20803449 | 2.95 |
AT1G55670.1
|
PSAG
|
photosystem I subunit G |
| arTal_v1_Chr3_-_6436046_6436046 | 2.95 |
AT3G18710.1
|
PUB29
|
plant U-box 29 |
| arTal_v1_Chr1_+_23911024_23911024 | 2.94 |
AT1G64390.1
|
GH9C2
|
glycosyl hydrolase 9C2 |
| arTal_v1_Chr5_+_18945543_18945543 | 2.93 |
AT5G46690.2
AT5G46690.1 |
bHLH071
|
beta HLH protein 71 |
| arTal_v1_Chr5_+_22397457_22397457 | 2.92 |
AT5G55220.1
|
AT5G55220
|
trigger factor type chaperone family protein |
| arTal_v1_Chr1_+_12026936_12026936 | 2.92 |
AT1G33170.1
|
AT1G33170
|
S-adenosyl-L-methionine-dependent methyltransferases superfamily protein |
| arTal_v1_Chr2_-_7727404_7727503 | 2.87 |
AT2G17780.2
AT2G17780.4 AT2G17780.5 AT2G17780.8 AT2G17780.10 AT2G17780.9 AT2G17780.1 AT2G17780.6 AT2G17780.3 AT2G17780.7 |
MCA2
|
PLAC8 family protein |
| arTal_v1_Chr5_+_20945676_20945676 | 2.84 |
AT5G51560.1
|
AT5G51560
|
Leucine-rich repeat protein kinase family protein |
| arTal_v1_Chr3_-_18628888_18628914 | 2.82 |
AT3G50240.3
AT3G50240.2 AT3G50240.4 AT3G50240.1 |
KICP-02
|
ATP binding microtubule motor family protein |
| arTal_v1_Chr4_-_7591259_7591259 | 2.79 |
AT4G12980.1
|
AT4G12980
|
Auxin-responsive family protein |
| arTal_v1_Chr1_+_2047886_2047886 | 2.78 |
AT1G06680.2
|
PSBP-1
|
photosystem II subunit P-1 |
| arTal_v1_Chr1_+_2047634_2047634 | 2.78 |
AT1G06680.1
|
PSBP-1
|
photosystem II subunit P-1 |
| arTal_v1_Chr1_-_6579314_6579314 | 2.77 |
AT1G19050.1
|
ARR7
|
response regulator 7 |
| arTal_v1_Chr1_-_25833966_25833966 | 2.75 |
AT1G68780.1
|
AT1G68780
|
RNI-like superfamily protein |
| arTal_v1_Chr2_-_17837618_17837618 | 2.73 |
AT2G42870.1
|
PAR1
|
phy rapidly regulated 1 |
| arTal_v1_Chr2_+_6542166_6542166 | 2.72 |
AT2G15090.1
|
KCS8
|
3-ketoacyl-CoA synthase 8 |
| arTal_v1_Chr4_-_7587099_7587099 | 2.72 |
AT4G12970.1
|
STOMAGEN
|
stomagen |
| arTal_v1_Chr1_+_19052193_19052193 | 2.72 |
AT1G51402.1
|
AT1G51402
|
hypothetical protein |
| arTal_v1_Chr4_+_4886962_4886962 | 2.70 |
AT4G08040.1
|
ACS11
|
1-aminocyclopropane-1-carboxylate synthase 11 |
| arTal_v1_Chr4_+_13177356_13177356 | 2.69 |
AT4G25960.1
|
ABCB2
|
P-glycoprotein 2 |
| arTal_v1_Chr1_-_22317070_22317070 | 2.68 |
AT1G60590.1
|
AT1G60590
|
Pectin lyase-like superfamily protein |
| arTal_v1_Chr5_-_23561944_23562001 | 2.68 |
AT5G58260.2
AT5G58260.1 |
NdhN
|
oxidoreductases, acting on NADH or NADPH, quinone or similar compound as acceptor |
| arTal_v1_Chr1_+_9259750_9259750 | 2.66 |
AT1G26770.2
|
EXPA10
|
expansin A10 |
| arTal_v1_Chr5_+_6387341_6387489 | 2.65 |
AT5G19090.1
AT5G19090.4 AT5G19090.3 AT5G19090.2 |
AT5G19090
|
Heavy metal transport/detoxification superfamily protein |
| arTal_v1_Chr3_+_20016837_20016892 | 2.64 |
AT3G54050.1
AT3G54050.2 |
HCEF1
|
high cyclic electron flow 1 |
| arTal_v1_Chr1_-_18690503_18690503 | 2.63 |
AT1G50450.1
|
AT1G50450
|
Saccharopine dehydrogenase |
| arTal_v1_Chr2_+_12254888_12254888 | 2.62 |
AT2G28605.1
|
AT2G28605
|
Photosystem II reaction center PsbP family protein |
| arTal_v1_Chr1_-_1307973_1307973 | 2.62 |
AT1G04680.1
|
AT1G04680
|
Pectin lyase-like superfamily protein |
| arTal_v1_Chr5_+_23077120_23077120 | 2.60 |
AT5G57030.1
|
LUT2
|
Lycopene beta/epsilon cyclase protein |
| arTal_v1_Chr1_+_9259432_9259432 | 2.60 |
AT1G26770.1
|
EXPA10
|
expansin A10 |
| arTal_v1_Chr5_+_8365601_8365601 | 2.60 |
AT5G24490.1
|
AT5G24490
|
30S ribosomal protein |
| arTal_v1_Chr3_-_3277930_3277930 | 2.58 |
AT3G10520.1
|
HB2
|
hemoglobin 2 |
| arTal_v1_Chr5_+_15421573_15421573 | 2.58 |
AT5G38520.2
|
AT5G38520
|
alpha/beta-Hydrolases superfamily protein |
| arTal_v1_Chr2_-_13797237_13797237 | 2.58 |
AT2G32500.2
AT2G32500.1 |
AT2G32500
|
Stress responsive alpha-beta barrel domain protein |
| arTal_v1_Chr5_+_15421289_15421289 | 2.57 |
AT5G38520.1
|
AT5G38520
|
alpha/beta-Hydrolases superfamily protein |
| arTal_v1_Chr3_+_20709294_20709294 | 2.57 |
AT3G55800.1
|
SBPASE
|
sedoheptulose-bisphosphatase |
| arTal_v1_Chr1_-_19978048_19978048 | 2.56 |
AT1G53520.1
|
FAP3
|
Chalcone-flavanone isomerase family protein |
| arTal_v1_Chr2_-_11173278_11173278 | 2.55 |
AT2G26250.1
|
KCS10
|
3-ketoacyl-CoA synthase 10 |
| arTal_v1_Chr1_-_8075037_8075037 | 2.54 |
AT1G22810.1
|
AT1G22810
|
Integrase-type DNA-binding superfamily protein |
| arTal_v1_Chr3_-_9723904_9723904 | 2.54 |
AT3G26520.1
|
TIP2
|
tonoplast intrinsic protein 2 |
| arTal_v1_Chr2_+_9948594_9948594 | 2.52 |
AT2G23360.1
|
AT2G23360
|
filament-like protein (DUF869) |
| arTal_v1_Chr2_-_12785037_12785037 | 2.52 |
AT2G29980.2
|
FAD3
|
fatty acid desaturase 3 |
| arTal_v1_Chr3_-_6855513_6855590 | 2.51 |
AT3G19720.3
AT3G19720.2 AT3G19720.1 |
ARC5
|
P-loop containing nucleoside triphosphate hydrolases superfamily protein |
| arTal_v1_Chr4_-_14439723_14439769 | 2.50 |
AT4G29310.1
AT4G29310.2 |
AT4G29310
|
DUF1005 family protein (DUF1005) |
| arTal_v1_Chr5_+_7778017_7778095 | 2.50 |
AT5G23120.2
AT5G23120.1 |
HCF136
|
photosystem II stability/assembly factor, chloroplast (HCF136) |
| arTal_v1_Chr1_-_3518035_3518035 | 2.50 |
AT1G10640.1
|
AT1G10640
|
Pectin lyase-like superfamily protein |
| arTal_v1_Chr5_+_23400715_23400715 | 2.49 |
AT5G57760.1
|
AT5G57760
|
hypothetical protein |
| arTal_v1_Chr3_-_22972239_22972303 | 2.49 |
AT3G62020.2
AT3G62020.1 |
GLP10
|
germin-like protein 10 |
| arTal_v1_Chr2_-_12785190_12785190 | 2.48 |
AT2G29980.1
|
FAD3
|
fatty acid desaturase 3 |
| arTal_v1_Chr2_-_5051613_5051613 | 2.46 |
AT2G12462.1
|
AT2G12462
|
sterile alpha motif (SAM) domain protein |
| arTal_v1_Chr2_+_1289832_1289832 | 2.42 |
AT2G04032.1
|
ZIP7
|
zinc transporter 7 precursor |
| arTal_v1_Chr3_+_9813223_9813223 | 2.40 |
AT3G26710.1
|
CCB1
|
cofactor assembly of complex C |
| arTal_v1_Chr1_+_18802552_18802552 | 2.39 |
AT1G50732.1
|
AT1G50732
|
transmembrane protein |
| arTal_v1_Chr1_+_18866197_18866197 | 2.39 |
AT1G50900.1
|
GDC1
|
Ankyrin repeat family protein |
| arTal_v1_Chr5_+_23374873_23374874 | 2.37 |
AT5G57700.3
AT5G57700.2 AT5G57700.1 AT5G57700.5 |
AT5G57700
|
BNR/Asp-box repeat family protein |
| arTal_v1_Chr1_-_6283348_6283348 | 2.37 |
AT1G18265.1
|
AT1G18265
|
zein-binding protein (Protein of unknown function, DUF593) |
| arTal_v1_Chr1_-_11539896_11539896 | 2.36 |
AT1G32080.1
|
LrgB
|
membrane protein |
| arTal_v1_Chr4_-_13496738_13496738 | 2.36 |
AT4G26830.1
AT4G26830.2 |
AT4G26830
|
O-Glycosyl hydrolases family 17 protein |
| arTal_v1_Chr4_+_14192569_14192569 | 2.35 |
AT4G28720.1
|
YUC8
|
Flavin-binding monooxygenase family protein |
| arTal_v1_Chr5_+_1912013_1912013 | 2.35 |
AT5G06270.2
AT5G06270.1 |
AT5G06270
|
hypothetical protein |
| arTal_v1_Chr3_-_10877578_10877578 | 2.35 |
AT3G28860.1
|
ABCB19
|
ATP binding cassette subfamily B19 |
| arTal_v1_Chr1_+_28498821_28498821 | 2.34 |
AT1G75900.1
|
AT1G75900
|
GDSL-like Lipase/Acylhydrolase superfamily protein |
| arTal_v1_Chr5_-_13959830_13959830 | 2.34 |
AT5G35790.1
|
G6PD1
|
glucose-6-phosphate dehydrogenase 1 |
| arTal_v1_Chr4_+_10949573_10949573 | 2.33 |
AT4G20270.1
|
BAM3
|
Leucine-rich receptor-like protein kinase family protein |
| arTal_v1_Chr4_-_8016582_8016582 | 2.33 |
AT4G13840.1
|
AT4G13840
|
HXXXD-type acyl-transferase family protein |
| arTal_v1_Chr2_-_18443405_18443405 | 2.32 |
AT2G44740.1
|
CYCP4%3B1
|
cyclin p4;1 |
| arTal_v1_Chr3_+_19930798_19930798 | 2.31 |
AT3G53800.1
AT3G53800.2 |
Fes1B
|
Fes1B |
| arTal_v1_Chr5_+_25727126_25727268 | 2.29 |
AT5G64330.1
AT5G64330.2 AT5G64330.3 |
NPH3
|
Phototropic-responsive NPH3 family protein |
| arTal_v1_Chr5_+_25159208_25159208 | 2.29 |
AT5G62670.1
|
HA11
|
H[+]-ATPase 11 |
| arTal_v1_Chr5_-_9676189_9676219 | 2.28 |
AT5G27390.4
AT5G27390.3 AT5G27390.1 AT5G27390.2 |
AT5G27390
|
tagatose-6-phosphate ketose/aldose isomerase, putative (Mog1/PsbP/DUF1795-like photosystem II reaction center PsbP family protein) |
| arTal_v1_Chr2_+_16912805_16912805 | 2.27 |
AT2G40490.1
|
HEME2
|
Uroporphyrinogen decarboxylase |
| arTal_v1_Chr4_+_418327_418391 | 2.27 |
AT4G00970.1
AT4G00970.2 |
CRK41
|
cysteine-rich RLK (RECEPTOR-like protein kinase) 41 |
| arTal_v1_Chr2_-_12885768_12885776 | 2.27 |
AT2G30200.2
AT2G30200.1 |
EMB3147
|
EMBRYO DEFECTIVE 3147 |
| arTal_v1_Chr1_+_8156504_8156504 | 2.26 |
AT1G23030.1
|
AT1G23030
|
ARM repeat superfamily protein |
| arTal_v1_Chr2_-_1021186_1021186 | 2.22 |
AT2G03350.1
|
AT2G03350
|
DUF538 family protein (Protein of unknown function, DUF538) |
| arTal_v1_Chr5_+_20900859_20900860 | 2.21 |
AT5G51460.1
AT5G51460.4 |
ATTPPA
|
Haloacid dehalogenase-like hydrolase (HAD) superfamily protein |
| arTal_v1_Chr4_-_17979740_17979885 | 2.21 |
AT4G38400.1
AT4G38401.1 |
EXLA2
AT4G38401
|
expansin-like A2 hypothetical protein |
| arTal_v1_Chr5_-_4647461_4647503 | 2.19 |
AT5G14410.1
AT5G14410.2 |
AT5G14410
|
hypothetical protein |
| arTal_v1_Chr4_-_5932475_5932475 | 2.19 |
AT4G09350.1
|
NdhT
|
Chaperone DnaJ-domain superfamily protein |
| arTal_v1_Chr5_-_4430901_4430901 | 2.18 |
AT5G13730.1
|
SIG4
|
sigma factor 4 |
| arTal_v1_Chr3_-_19022647_19022647 | 2.17 |
AT3G51220.1
|
AT3G51220
|
WEB family protein (DUF827) |
| arTal_v1_Chr1_-_4807517_4807517 | 2.15 |
AT1G14030.1
|
LSMT-L
|
Rubisco methyltransferase family protein |
| arTal_v1_Chr2_+_12805667_12805714 | 2.15 |
AT2G30010.2
AT2G30010.1 |
TBL45
|
TRICHOME BIREFRINGENCE-LIKE 45 |
| arTal_v1_Chr1_-_1358547_1358547 | 2.15 |
AT1G04820.1
|
TUA4
|
tubulin alpha-4 chain |
| arTal_v1_Chr5_-_9242854_9242854 | 2.15 |
AT5G26330.1
|
AT5G26330
|
Cupredoxin superfamily protein |
| arTal_v1_Chr3_+_9794862_9794862 | 2.14 |
AT3G26650.1
|
GAPA
|
glyceraldehyde 3-phosphate dehydrogenase A subunit |
| arTal_v1_Chr4_+_455768_455768 | 2.14 |
AT4G01050.1
|
TROL
|
thylakoid rhodanese-like protein |
| arTal_v1_Chr4_+_455583_455583 | 2.13 |
AT4G01050.2
|
TROL
|
thylakoid rhodanese-like protein |
| arTal_v1_Chr2_-_12965723_12965723 | 2.13 |
AT2G30424.2
AT2G30424.3 AT2G30424.1 |
TCL2
|
Homeodomain-like superfamily protein |
| arTal_v1_Chr2_+_14849357_14849357 | 2.12 |
AT2G35260.1
|
AT2G35260
|
CAAX protease self-immunity protein |
| arTal_v1_Chr4_+_7336330_7336330 | 2.12 |
AT4G12390.1
|
PME1
|
pectin methylesterase inhibitor 1 |
| arTal_v1_Chr2_-_444324_444324 | 2.12 |
AT2G01950.1
|
BRL2
|
BRI1-like 2 |
| arTal_v1_Chr1_-_21418115_21418115 | 2.12 |
AT1G57820.1
AT1G57820.3 |
VIM1
|
Zinc finger (C3HC4-type RING finger) family protein |
| arTal_v1_Chr3_-_6818329_6818329 | 2.12 |
AT3G19620.1
|
AT3G19620
|
Glycosyl hydrolase family protein |
| arTal_v1_Chr5_+_20902087_20902087 | 2.11 |
AT5G51460.2
|
ATTPPA
|
Haloacid dehalogenase-like hydrolase (HAD) superfamily protein |
| arTal_v1_Chr4_-_11612903_11612903 | 2.11 |
AT4G21890.1
|
AT4G21890
|
zinc finger MYND domain protein |
| arTal_v1_Chr4_-_9305763_9305845 | 2.11 |
AT4G16515.1
AT4G16515.2 |
RGF6
|
root meristem growth factor |
| arTal_v1_Chr1_-_3396953_3396953 | 2.10 |
AT1G10360.1
|
GSTU18
|
glutathione S-transferase TAU 18 |
| arTal_v1_Chr2_+_9293261_9293261 | 2.10 |
AT2G21790.1
|
RNR1
|
ribonucleotide reductase 1 |
| arTal_v1_Chr5_+_19002564_19002564 | 2.08 |
AT5G46830.1
|
NIG1
|
calcium-binding transcription factor NIG1 |
| arTal_v1_Chr1_+_26400694_26400790 | 2.08 |
AT1G70090.1
AT1G70090.2 |
LGT8
|
glucosyl transferase family 8 |
| arTal_v1_Chr5_+_26671273_26671273 | 2.07 |
AT5G66800.1
|
AT5G66800
|
membrane-associated kinase regulator-like protein |
| arTal_v1_Chr5_+_20901835_20901835 | 2.06 |
AT5G51460.5
|
ATTPPA
|
Haloacid dehalogenase-like hydrolase (HAD) superfamily protein |
| arTal_v1_Chr2_-_17161293_17161294 | 2.05 |
AT2G41170.2
AT2G41170.1 AT2G41170.3 |
AT2G41170
|
F-box family protein |
| arTal_v1_Chr2_-_16573519_16573519 | 2.04 |
AT2G39730.3
|
RCA
|
rubisco activase |
| arTal_v1_Chr2_-_16573692_16573692 | 2.04 |
AT2G39730.1
AT2G39730.2 |
RCA
|
rubisco activase |
| arTal_v1_Chr2_+_16745628_16745653 | 2.03 |
AT2G40100.1
AT2G40100.2 |
LHCB4.3
|
light harvesting complex photosystem II |
| arTal_v1_Chr2_-_1035969_1035969 | 2.03 |
AT2G03420.1
|
AT2G03420
|
hypothetical protein |
| arTal_v1_Chr5_+_20901537_20901537 | 2.03 |
AT5G51460.3
|
ATTPPA
|
Haloacid dehalogenase-like hydrolase (HAD) superfamily protein |
| arTal_v1_Chr1_-_3272110_3272110 | 2.03 |
AT1G10020.1
|
AT1G10020
|
formin-like protein (DUF1005) |
| arTal_v1_Chr3_-_8058764_8058782 | 2.02 |
AT3G22790.3
AT3G22790.2 |
NET1A
|
Kinase interacting (KIP1-like) family protein |
| arTal_v1_Chr5_-_24640639_24640765 | 2.00 |
AT5G61270.3
AT5G61270.1 AT5G61270.2 |
PIF7
|
phytochrome-interacting factor7 |
| arTal_v1_Chr5_+_6138717_6138717 | 2.00 |
AT5G18500.3
AT5G18500.4 AT5G18500.5 |
AT5G18500
|
Protein kinase superfamily protein |
| arTal_v1_Chr1_+_28327698_28327698 | 1.99 |
AT1G75460.1
|
AT1G75460
|
ATP-dependent protease La (LON) domain protein |
| arTal_v1_Chr5_+_22401927_22401997 | 1.99 |
AT5G55230.1
AT5G55230.3 AT5G55230.2 |
MAP65-1
|
microtubule-associated proteins 65-1 |
| arTal_v1_Chr4_+_17524461_17524461 | 1.98 |
AT4G37240.1
|
AT4G37240
|
HTH-type transcriptional regulator |
| arTal_v1_Chr3_+_168408_168408 | 1.98 |
AT3G01440.1
|
PnsL3
|
PsbQ-like 1 |
| arTal_v1_Chr2_-_14629183_14629207 | 1.97 |
AT2G34680.2
AT2G34680.1 |
AIR9
|
Outer arm dynein light chain 1 protein |
| arTal_v1_Chr5_+_24940203_24940396 | 1.97 |
AT5G62100.2
AT5G62100.4 AT5G62100.3 AT5G62100.5 AT5G62100.6 AT5G62100.1 |
BAG2
|
BCL-2-associated athanogene 2 |
| arTal_v1_Chr3_-_19821505_19821519 | 1.97 |
AT3G53460.1
AT3G53460.2 AT3G53460.3 AT3G53460.4 |
CP29
|
chloroplast RNA-binding protein 29 |
| arTal_v1_Chr1_+_564018_564018 | 1.97 |
AT1G02640.1
|
BXL2
|
beta-xylosidase 2 |
| arTal_v1_Chr5_+_6387735_6387735 | 1.96 |
AT5G19090.5
|
AT5G19090
|
Heavy metal transport/detoxification superfamily protein |
| arTal_v1_Chr4_-_13481870_13481870 | 1.94 |
AT4G26760.1
|
MAP65-2
|
microtubule-associated protein 65-2 |
| arTal_v1_Chr1_-_6213591_6213591 | 1.94 |
AT1G18060.1
|
AT1G18060
|
microbial collagenase |
| arTal_v1_Chr3_+_19037140_19037140 | 1.94 |
AT3G51280.1
|
AT3G51280
|
Tetratricopeptide repeat (TPR)-like superfamily protein |
| arTal_v1_Chr4_-_14627631_14627631 | 1.94 |
AT4G29905.1
|
AT4G29905
|
hypothetical protein |
| arTal_v1_Chr3_+_15927939_15927939 | 1.94 |
AT3G44220.1
|
AT3G44220
|
Late embryogenesis abundant (LEA) hydroxyproline-rich glycoprotein family |
| arTal_v1_Chr4_+_17739514_17739514 | 1.93 |
AT4G37750.1
|
ANT
|
Integrase-type DNA-binding superfamily protein |
| arTal_v1_Chr3_-_18892508_18892508 | 1.93 |
AT3G50820.1
|
PSBO2
|
photosystem II subunit O-2 |
| arTal_v1_Chr2_-_9699915_9699944 | 1.93 |
AT2G22795.3
AT2G22795.2 AT2G22795.1 |
AT2G22795
|
hypothetical protein |
| arTal_v1_Chr2_+_10842863_10842863 | 1.91 |
AT2G25480.2
AT2G25480.1 |
AT2G25480
|
TPX2 (targeting protein for Xklp2) protein family |
| arTal_v1_Chr1_+_5136874_5136874 | 1.91 |
AT1G14890.1
|
AT1G14890
|
Plant invertase/pectin methylesterase inhibitor superfamily protein |
| arTal_v1_Chr2_-_11599322_11599322 | 1.90 |
AT2G27140.1
|
AT2G27140
|
HSP20-like chaperones superfamily protein |
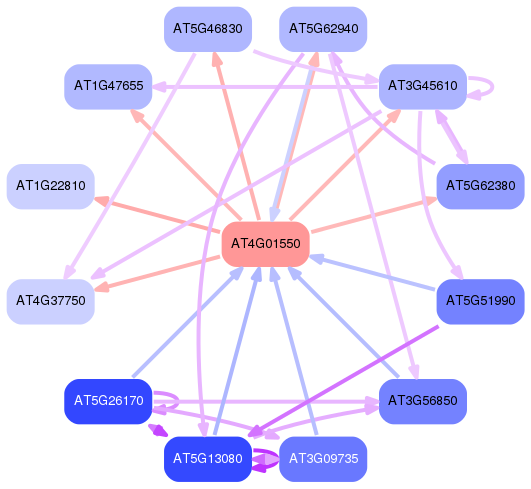
Network of associatons between targets according to the STRING database.

First level regulatory network of AT4G01550
Gene Ontology Analysis
Gene overrepresentation in biological process category:
| Log-likelihood per target | Total log-likelihood | Term | Description |
|---|---|---|---|
| 1.8 | 23.6 | GO:2000122 | negative regulation of stomatal complex development(GO:2000122) |
| 1.3 | 3.9 | GO:0042353 | fucose biosynthetic process(GO:0042353) |
| 1.1 | 4.2 | GO:0015669 | gas transport(GO:0015669) |
| 1.0 | 5.2 | GO:0031055 | chromatin remodeling at centromere(GO:0031055) |
| 0.9 | 2.7 | GO:0035445 | borate transmembrane transport(GO:0035445) |
| 0.9 | 6.1 | GO:0009772 | photosynthetic electron transport in photosystem II(GO:0009772) |
| 0.9 | 2.6 | GO:0045900 | negative regulation of translational elongation(GO:0045900) |
| 0.9 | 9.4 | GO:0010196 | nonphotochemical quenching(GO:0010196) energy quenching(GO:1990066) |
| 0.8 | 2.3 | GO:0010541 | acropetal auxin transport(GO:0010541) |
| 0.8 | 2.3 | GO:0090058 | metaxylem development(GO:0090058) |
| 0.8 | 3.8 | GO:0010450 | inflorescence meristem growth(GO:0010450) |
| 0.7 | 3.7 | GO:0042549 | photosystem II stabilization(GO:0042549) |
| 0.7 | 3.0 | GO:0010451 | floral meristem growth(GO:0010451) |
| 0.7 | 4.3 | GO:0010258 | NADH dehydrogenase complex (plastoquinone) assembly(GO:0010258) |
| 0.7 | 2.9 | GO:0070509 | calcium ion import(GO:0070509) |
| 0.7 | 2.2 | GO:0071258 | cellular response to gravity(GO:0071258) |
| 0.7 | 2.1 | GO:1900033 | regulation of trichome patterning(GO:1900032) negative regulation of trichome patterning(GO:1900033) |
| 0.7 | 2.1 | GO:0009202 | deoxyribonucleoside triphosphate biosynthetic process(GO:0009202) |
| 0.7 | 4.1 | GO:0009769 | photosynthesis, light harvesting in photosystem II(GO:0009769) |
| 0.7 | 2.7 | GO:0046901 | tetrahydrofolylpolyglutamate biosynthetic process(GO:0046901) |
| 0.7 | 3.3 | GO:0019860 | uracil metabolic process(GO:0019860) |
| 0.6 | 3.2 | GO:0045730 | respiratory burst involved in defense response(GO:0002679) respiratory burst(GO:0045730) |
| 0.6 | 2.5 | GO:0080170 | hydrogen peroxide transmembrane transport(GO:0080170) |
| 0.6 | 2.5 | GO:0080003 | thalianol metabolic process(GO:0080003) |
| 0.6 | 11.1 | GO:0030388 | fructose 1,6-bisphosphate metabolic process(GO:0030388) |
| 0.6 | 2.4 | GO:0019586 | uronic acid metabolic process(GO:0006063) galacturonate metabolic process(GO:0019586) |
| 0.6 | 11.4 | GO:0006949 | syncytium formation(GO:0006949) |
| 0.6 | 2.9 | GO:0042550 | photosystem I stabilization(GO:0042550) |
| 0.6 | 2.9 | GO:0045793 | positive regulation of cell size(GO:0045793) |
| 0.6 | 4.0 | GO:0019464 | glycine decarboxylation via glycine cleavage system(GO:0019464) |
| 0.6 | 2.8 | GO:0010422 | regulation of brassinosteroid biosynthetic process(GO:0010422) regulation of steroid metabolic process(GO:0019218) regulation of steroid biosynthetic process(GO:0050810) regulation of steroid hormone biosynthetic process(GO:0090030) |
| 0.5 | 1.6 | GO:2000029 | regulation of proanthocyanidin biosynthetic process(GO:2000029) |
| 0.5 | 2.2 | GO:0018023 | peptidyl-lysine trimethylation(GO:0018023) |
| 0.5 | 3.7 | GO:0010623 | programmed cell death involved in cell development(GO:0010623) |
| 0.5 | 2.6 | GO:0035970 | peptidyl-threonine dephosphorylation(GO:0035970) |
| 0.5 | 4.1 | GO:0031222 | arabinan catabolic process(GO:0031222) |
| 0.5 | 7.9 | GO:0046501 | protoporphyrinogen IX biosynthetic process(GO:0006782) protoporphyrinogen IX metabolic process(GO:0046501) |
| 0.5 | 4.6 | GO:0016123 | xanthophyll biosynthetic process(GO:0016123) |
| 0.5 | 1.8 | GO:0046949 | fatty-acyl-CoA biosynthetic process(GO:0046949) |
| 0.5 | 7.7 | GO:0016998 | cell wall macromolecule catabolic process(GO:0016998) |
| 0.4 | 1.7 | GO:0006024 | aminoglycan biosynthetic process(GO:0006023) glycosaminoglycan biosynthetic process(GO:0006024) UDP-glucuronate biosynthetic process(GO:0006065) glycosaminoglycan metabolic process(GO:0030203) |
| 0.4 | 1.7 | GO:0048200 | COPI-coated vesicle budding(GO:0035964) Golgi transport vesicle coating(GO:0048200) COPI coating of Golgi vesicle(GO:0048205) |
| 0.4 | 6.2 | GO:0042761 | very long-chain fatty acid biosynthetic process(GO:0042761) |
| 0.4 | 3.3 | GO:0080165 | callose deposition in phloem sieve plate(GO:0080165) |
| 0.4 | 1.6 | GO:0046741 | transport of virus in host, tissue to tissue(GO:0046741) |
| 0.4 | 2.0 | GO:0001578 | microtubule bundle formation(GO:0001578) |
| 0.4 | 6.4 | GO:0009768 | photosynthesis, light harvesting in photosystem I(GO:0009768) |
| 0.4 | 3.9 | GO:0009405 | pathogenesis(GO:0009405) |
| 0.4 | 1.6 | GO:1901601 | lactone metabolic process(GO:1901334) lactone biosynthetic process(GO:1901336) strigolactone metabolic process(GO:1901600) strigolactone biosynthetic process(GO:1901601) |
| 0.4 | 1.6 | GO:0043157 | response to cation stress(GO:0043157) |
| 0.4 | 1.2 | GO:0000730 | DNA recombinase assembly(GO:0000730) strand invasion(GO:0042148) |
| 0.4 | 10.1 | GO:0009828 | plant-type cell wall loosening(GO:0009828) |
| 0.4 | 2.6 | GO:0051127 | regulation of Arp2/3 complex-mediated actin nucleation(GO:0034315) regulation of actin nucleation(GO:0051125) positive regulation of actin nucleation(GO:0051127) positive regulation of Arp2/3 complex-mediated actin nucleation(GO:2000601) |
| 0.4 | 1.5 | GO:0099636 | cytoplasmic streaming(GO:0099636) |
| 0.4 | 1.8 | GO:0042218 | 1-aminocyclopropane-1-carboxylate biosynthetic process(GO:0042218) |
| 0.4 | 1.1 | GO:0046102 | inosine catabolic process(GO:0006148) inosine metabolic process(GO:0046102) |
| 0.3 | 1.0 | GO:0045876 | positive regulation of sister chromatid cohesion(GO:0045876) |
| 0.3 | 2.4 | GO:0010067 | procambium histogenesis(GO:0010067) |
| 0.3 | 0.7 | GO:0018065 | protein-cofactor linkage(GO:0018065) |
| 0.3 | 1.7 | GO:0006788 | heme oxidation(GO:0006788) |
| 0.3 | 3.0 | GO:0042659 | regulation of cell fate specification(GO:0042659) |
| 0.3 | 5.0 | GO:0030497 | fatty acid elongation(GO:0030497) |
| 0.3 | 1.0 | GO:0060211 | regulation of nuclear-transcribed mRNA poly(A) tail shortening(GO:0060211) regulation of nuclear-transcribed mRNA catabolic process, deadenylation-dependent decay(GO:1900151) |
| 0.3 | 1.3 | GO:0042450 | arginine biosynthetic process via ornithine(GO:0042450) |
| 0.3 | 0.9 | GO:0051639 | actin filament network formation(GO:0051639) |
| 0.3 | 2.4 | GO:0010190 | cytochrome b6f complex assembly(GO:0010190) |
| 0.3 | 0.9 | GO:0033321 | homomethionine metabolic process(GO:0033321) glucosinolate biosynthetic process from homomethionine(GO:0033506) |
| 0.3 | 1.2 | GO:0009305 | protein biotinylation(GO:0009305) |
| 0.3 | 2.0 | GO:0043489 | RNA stabilization(GO:0043489) |
| 0.3 | 1.4 | GO:0006556 | S-adenosylmethionine biosynthetic process(GO:0006556) |
| 0.3 | 0.8 | GO:0015812 | gamma-aminobutyric acid transport(GO:0015812) |
| 0.3 | 1.8 | GO:0072337 | modified amino acid transport(GO:0072337) |
| 0.3 | 2.6 | GO:0010088 | phloem development(GO:0010088) |
| 0.3 | 2.3 | GO:0051513 | regulation of monopolar cell growth(GO:0051513) |
| 0.2 | 1.0 | GO:0098609 | pollen tube adhesion(GO:0009865) cell-cell adhesion(GO:0098609) multi organism cell adhesion(GO:0098740) |
| 0.2 | 1.0 | GO:0030856 | regulation of epithelial cell differentiation(GO:0030856) regulation of epidermal cell differentiation(GO:0045604) regulation of epidermis development(GO:0045682) |
| 0.2 | 3.6 | GO:0055069 | zinc ion homeostasis(GO:0055069) |
| 0.2 | 0.7 | GO:0010500 | transmitting tissue development(GO:0010500) carpel formation(GO:0048462) |
| 0.2 | 0.7 | GO:0010446 | response to alkaline pH(GO:0010446) |
| 0.2 | 2.8 | GO:0046520 | sphingoid biosynthetic process(GO:0046520) |
| 0.2 | 0.5 | GO:0048445 | carpel morphogenesis(GO:0048445) |
| 0.2 | 3.4 | GO:0048496 | maintenance of organ identity(GO:0048496) maintenance of floral organ identity(GO:0048497) |
| 0.2 | 0.2 | GO:0080155 | regulation of fertilization(GO:0080154) regulation of double fertilization forming a zygote and endosperm(GO:0080155) |
| 0.2 | 1.8 | GO:0000967 | rRNA 5'-end processing(GO:0000967) ncRNA 5'-end processing(GO:0034471) |
| 0.2 | 0.9 | GO:0071313 | cellular response to alkaloid(GO:0071312) cellular response to caffeine(GO:0071313) cellular response to purine-containing compound(GO:0071415) negative regulation of cellular response to caffeine(GO:1901181) |
| 0.2 | 5.6 | GO:2000012 | regulation of auxin polar transport(GO:2000012) |
| 0.2 | 1.1 | GO:0043247 | telomere maintenance in response to DNA damage(GO:0043247) |
| 0.2 | 1.3 | GO:0080120 | CAAX-box protein processing(GO:0071586) CAAX-box protein maturation(GO:0080120) |
| 0.2 | 1.3 | GO:0009800 | cinnamic acid biosynthetic process(GO:0009800) |
| 0.2 | 0.6 | GO:0032414 | positive regulation of transporter activity(GO:0032411) positive regulation of ion transmembrane transporter activity(GO:0032414) positive regulation of anion channel activity(GO:1901529) positive regulation of anion transport(GO:1903793) positive regulation of anion transmembrane transport(GO:1903961) |
| 0.2 | 1.1 | GO:0071366 | cellular response to indolebutyric acid stimulus(GO:0071366) |
| 0.2 | 2.3 | GO:0010158 | abaxial cell fate specification(GO:0010158) |
| 0.2 | 2.7 | GO:0010052 | guard cell differentiation(GO:0010052) |
| 0.2 | 1.4 | GO:0010018 | far-red light signaling pathway(GO:0010018) |
| 0.2 | 1.4 | GO:0070979 | protein K11-linked ubiquitination(GO:0070979) |
| 0.2 | 1.2 | GO:0019408 | dolichol biosynthetic process(GO:0019408) |
| 0.2 | 2.4 | GO:0010600 | regulation of auxin biosynthetic process(GO:0010600) |
| 0.2 | 1.6 | GO:0009854 | oxidative photosynthetic carbon pathway(GO:0009854) |
| 0.2 | 2.1 | GO:0010233 | vascular transport(GO:0010232) phloem transport(GO:0010233) |
| 0.2 | 4.9 | GO:0045037 | protein import into chloroplast stroma(GO:0045037) |
| 0.2 | 1.3 | GO:0006552 | leucine catabolic process(GO:0006552) |
| 0.2 | 2.4 | GO:1901141 | regulation of lignin biosynthetic process(GO:1901141) |
| 0.2 | 0.7 | GO:0030322 | stabilization of membrane potential(GO:0030322) |
| 0.2 | 1.1 | GO:1903426 | regulation of reactive oxygen species biosynthetic process(GO:1903426) |
| 0.2 | 0.9 | GO:0031022 | nuclear migration along microfilament(GO:0031022) |
| 0.2 | 3.1 | GO:0006075 | (1->3)-beta-D-glucan metabolic process(GO:0006074) (1->3)-beta-D-glucan biosynthetic process(GO:0006075) |
| 0.2 | 0.5 | GO:0006011 | UDP-glucose metabolic process(GO:0006011) |
| 0.2 | 2.3 | GO:0009051 | pentose-phosphate shunt, oxidative branch(GO:0009051) |
| 0.2 | 0.7 | GO:0000289 | nuclear-transcribed mRNA poly(A) tail shortening(GO:0000289) |
| 0.2 | 2.1 | GO:0019253 | carbon fixation(GO:0015977) reductive pentose-phosphate cycle(GO:0019253) |
| 0.2 | 1.4 | GO:0051214 | RNA virus induced gene silencing(GO:0051214) |
| 0.2 | 1.6 | GO:0010205 | photoinhibition(GO:0010205) negative regulation of photosynthesis, light reaction(GO:0043155) negative regulation of photosynthesis(GO:1905156) |
| 0.2 | 11.9 | GO:0007018 | microtubule-based movement(GO:0007018) |
| 0.2 | 0.5 | GO:0008153 | para-aminobenzoic acid biosynthetic process(GO:0008153) |
| 0.2 | 0.5 | GO:0046459 | short-chain fatty acid metabolic process(GO:0046459) |
| 0.2 | 1.0 | GO:0010244 | response to low fluence blue light stimulus by blue low-fluence system(GO:0010244) |
| 0.2 | 1.5 | GO:0043096 | adenine salvage(GO:0006168) purine nucleobase salvage(GO:0043096) |
| 0.2 | 1.4 | GO:0050879 | circumnutation(GO:0010031) multicellular organismal movement(GO:0050879) |
| 0.2 | 2.7 | GO:0009299 | mRNA transcription(GO:0009299) |
| 0.2 | 2.6 | GO:0000038 | very long-chain fatty acid metabolic process(GO:0000038) |
| 0.2 | 0.8 | GO:0018206 | peptidyl-methionine modification(GO:0018206) |
| 0.2 | 2.5 | GO:0010497 | plasmodesmata-mediated intercellular transport(GO:0010497) |
| 0.2 | 1.0 | GO:0009090 | homoserine biosynthetic process(GO:0009090) |
| 0.2 | 0.5 | GO:0010185 | regulation of cellular defense response(GO:0010185) |
| 0.2 | 4.1 | GO:0016132 | phytosteroid biosynthetic process(GO:0016129) brassinosteroid biosynthetic process(GO:0016132) |
| 0.2 | 2.5 | GO:0000373 | Group II intron splicing(GO:0000373) |
| 0.2 | 0.8 | GO:0005980 | glycogen catabolic process(GO:0005980) |
| 0.2 | 20.1 | GO:0015979 | photosynthesis(GO:0015979) |
| 0.2 | 3.2 | GO:0071577 | zinc II ion transmembrane transport(GO:0071577) |
| 0.1 | 0.4 | GO:1990532 | stress response to nickel ion(GO:1990532) |
| 0.1 | 0.7 | GO:0051016 | barbed-end actin filament capping(GO:0051016) |
| 0.1 | 1.2 | GO:0006048 | UDP-N-acetylglucosamine biosynthetic process(GO:0006048) |
| 0.1 | 1.5 | GO:0010359 | regulation of anion channel activity(GO:0010359) |
| 0.1 | 0.9 | GO:0044211 | CTP salvage(GO:0044211) |
| 0.1 | 1.5 | GO:1990937 | xylan acetylation(GO:1990937) |
| 0.1 | 0.4 | GO:0019279 | L-methionine biosynthetic process from L-homoserine via cystathionine(GO:0019279) 'de novo' L-methionine biosynthetic process(GO:0071266) |
| 0.1 | 0.6 | GO:0006083 | acetate metabolic process(GO:0006083) acetyl-CoA biosynthetic process from acetate(GO:0019427) |
| 0.1 | 0.6 | GO:0045597 | positive regulation of cell differentiation(GO:0045597) |
| 0.1 | 0.8 | GO:0010047 | fruit dehiscence(GO:0010047) |
| 0.1 | 0.7 | GO:0034497 | protein localization to pre-autophagosomal structure(GO:0034497) |
| 0.1 | 0.9 | GO:0010929 | positive regulation of auxin mediated signaling pathway(GO:0010929) |
| 0.1 | 0.4 | GO:0016094 | polyprenol biosynthetic process(GO:0016094) |
| 0.1 | 0.5 | GO:0080094 | response to trehalose-6-phosphate(GO:0080094) |
| 0.1 | 1.8 | GO:0045839 | negative regulation of mitotic nuclear division(GO:0045839) |
| 0.1 | 0.4 | GO:0009102 | biotin metabolic process(GO:0006768) biotin biosynthetic process(GO:0009102) |
| 0.1 | 2.1 | GO:0010215 | cellulose microfibril organization(GO:0010215) |
| 0.1 | 0.6 | GO:0006814 | sodium ion transport(GO:0006814) |
| 0.1 | 0.5 | GO:0034389 | lipid particle organization(GO:0034389) |
| 0.1 | 0.8 | GO:0070814 | hydrogen sulfide biosynthetic process(GO:0070814) |
| 0.1 | 1.8 | GO:0006085 | acetyl-CoA biosynthetic process(GO:0006085) thioester biosynthetic process(GO:0035384) acyl-CoA biosynthetic process(GO:0071616) |
| 0.1 | 1.2 | GO:0036065 | fucosylation(GO:0036065) |
| 0.1 | 1.3 | GO:0072583 | clathrin-mediated endocytosis(GO:0072583) |
| 0.1 | 1.2 | GO:0006607 | NLS-bearing protein import into nucleus(GO:0006607) |
| 0.1 | 1.0 | GO:0043171 | peptide catabolic process(GO:0043171) |
| 0.1 | 0.2 | GO:0009866 | induced systemic resistance, ethylene mediated signaling pathway(GO:0009866) |
| 0.1 | 2.6 | GO:0042335 | cuticle development(GO:0042335) |
| 0.1 | 2.8 | GO:0009958 | positive gravitropism(GO:0009958) |
| 0.1 | 0.7 | GO:1901703 | protein localization involved in auxin polar transport(GO:1901703) |
| 0.1 | 1.2 | GO:0005978 | glycogen biosynthetic process(GO:0005978) amylopectin biosynthetic process(GO:0010021) amylopectin metabolic process(GO:2000896) |
| 0.1 | 0.7 | GO:0010222 | stem vascular tissue pattern formation(GO:0010222) |
| 0.1 | 0.3 | GO:2000692 | negative regulation of seed maturation(GO:2000692) |
| 0.1 | 0.7 | GO:0010396 | rhamnogalacturonan II biosynthetic process(GO:0010306) rhamnogalacturonan II metabolic process(GO:0010396) |
| 0.1 | 1.3 | GO:0042793 | transcription from plastid promoter(GO:0042793) |
| 0.1 | 1.0 | GO:0010371 | regulation of gibberellin biosynthetic process(GO:0010371) |
| 0.1 | 0.5 | GO:0010321 | regulation of vegetative phase change(GO:0010321) |
| 0.1 | 1.7 | GO:1900865 | chloroplast RNA modification(GO:1900865) |
| 0.1 | 0.4 | GO:0071244 | cellular response to carbon dioxide(GO:0071244) |
| 0.1 | 1.0 | GO:0070919 | production of siRNA involved in chromatin silencing by small RNA(GO:0070919) |
| 0.1 | 0.9 | GO:0045962 | positive regulation of development, heterochronic(GO:0045962) |
| 0.1 | 5.9 | GO:0098727 | stem cell population maintenance(GO:0019827) maintenance of cell number(GO:0098727) |
| 0.1 | 1.5 | GO:0009827 | plant-type cell wall modification(GO:0009827) |
| 0.1 | 2.5 | GO:0010143 | cutin biosynthetic process(GO:0010143) |
| 0.1 | 5.0 | GO:0007267 | cell-cell signaling(GO:0007267) |
| 0.1 | 1.3 | GO:0006538 | glutamate catabolic process(GO:0006538) |
| 0.1 | 0.6 | GO:0010165 | response to X-ray(GO:0010165) |
| 0.1 | 2.2 | GO:0009294 | genetic transfer(GO:0009292) DNA mediated transformation(GO:0009294) |
| 0.1 | 0.9 | GO:1901463 | regulation of chlorophyll biosynthetic process(GO:0010380) regulation of tetrapyrrole biosynthetic process(GO:1901463) |
| 0.1 | 1.2 | GO:0005986 | sucrose biosynthetic process(GO:0005986) |
| 0.1 | 4.5 | GO:0010102 | post-embryonic root morphogenesis(GO:0010101) lateral root morphogenesis(GO:0010102) |
| 0.1 | 1.0 | GO:0048759 | xylem vessel member cell differentiation(GO:0048759) |
| 0.1 | 0.4 | GO:0010115 | regulation of abscisic acid biosynthetic process(GO:0010115) |
| 0.1 | 1.6 | GO:0009638 | phototropism(GO:0009638) |
| 0.1 | 0.6 | GO:0046513 | ceramide biosynthetic process(GO:0046513) |
| 0.1 | 2.6 | GO:0006284 | base-excision repair(GO:0006284) |
| 0.1 | 0.2 | GO:0010343 | singlet oxygen-mediated programmed cell death(GO:0010343) |
| 0.1 | 1.7 | GO:0006722 | triterpenoid metabolic process(GO:0006722) |
| 0.1 | 4.4 | GO:0048528 | post-embryonic root development(GO:0048528) |
| 0.1 | 0.8 | GO:0006783 | heme biosynthetic process(GO:0006783) |
| 0.1 | 1.1 | GO:0015693 | magnesium ion transport(GO:0015693) |
| 0.1 | 0.4 | GO:0071249 | cellular response to nitrate(GO:0071249) |
| 0.1 | 0.2 | GO:0033258 | plastid DNA metabolic process(GO:0033258) plastid DNA replication(GO:0033259) |
| 0.1 | 0.4 | GO:0010338 | leaf formation(GO:0010338) positive regulation of organ growth(GO:0046622) |
| 0.1 | 1.6 | GO:2000008 | regulation of protein localization to cell surface(GO:2000008) |
| 0.1 | 0.4 | GO:0010231 | maintenance of seed dormancy(GO:0010231) maintenance of dormancy(GO:0097437) |
| 0.1 | 1.4 | GO:0007064 | mitotic sister chromatid cohesion(GO:0007064) |
| 0.1 | 0.9 | GO:0009423 | chorismate biosynthetic process(GO:0009423) |
| 0.1 | 0.9 | GO:2000033 | regulation of seed dormancy process(GO:2000033) |
| 0.1 | 0.4 | GO:1903175 | fatty alcohol biosynthetic process(GO:1903175) |
| 0.1 | 0.7 | GO:1904668 | positive regulation of ubiquitin protein ligase activity(GO:1904668) |
| 0.1 | 0.8 | GO:0010106 | cellular response to iron ion starvation(GO:0010106) |
| 0.1 | 0.7 | GO:0046294 | formaldehyde catabolic process(GO:0046294) |
| 0.1 | 1.6 | GO:0043572 | chloroplast fission(GO:0010020) plastid fission(GO:0043572) |
| 0.1 | 0.7 | GO:0052548 | negative regulation of endopeptidase activity(GO:0010951) regulation of endopeptidase activity(GO:0052548) |
| 0.1 | 0.6 | GO:0048579 | negative regulation of long-day photoperiodism, flowering(GO:0048579) |
| 0.1 | 0.3 | GO:0006893 | Golgi to plasma membrane transport(GO:0006893) |
| 0.1 | 5.5 | GO:0043086 | negative regulation of catalytic activity(GO:0043086) |
| 0.1 | 2.3 | GO:0045489 | pectin biosynthetic process(GO:0045489) |
| 0.1 | 2.3 | GO:0009664 | plant-type cell wall organization(GO:0009664) |
| 0.1 | 5.5 | GO:0006633 | fatty acid biosynthetic process(GO:0006633) |
| 0.1 | 1.1 | GO:0048015 | phosphatidylinositol-mediated signaling(GO:0048015) |
| 0.1 | 1.0 | GO:0009641 | shade avoidance(GO:0009641) |
| 0.1 | 1.7 | GO:0019915 | lipid storage(GO:0019915) |
| 0.1 | 1.4 | GO:0045036 | protein targeting to chloroplast(GO:0045036) establishment of protein localization to chloroplast(GO:0072596) |
| 0.1 | 0.5 | GO:0051103 | lagging strand elongation(GO:0006273) DNA ligation involved in DNA repair(GO:0051103) |
| 0.1 | 0.9 | GO:0034219 | carbohydrate transmembrane transport(GO:0034219) |
| 0.1 | 2.0 | GO:0032543 | mitochondrial translation(GO:0032543) |
| 0.1 | 0.8 | GO:1902533 | positive regulation of intracellular signal transduction(GO:1902533) |
| 0.1 | 0.4 | GO:0036297 | interstrand cross-link repair(GO:0036297) |
| 0.1 | 0.6 | GO:0009934 | regulation of meristem structural organization(GO:0009934) |
| 0.1 | 0.3 | GO:0060321 | acceptance of pollen(GO:0060321) |
| 0.1 | 1.3 | GO:0009269 | response to desiccation(GO:0009269) |
| 0.1 | 0.5 | GO:0010192 | mucilage biosynthetic process(GO:0010192) |
| 0.1 | 1.3 | GO:0006378 | mRNA polyadenylation(GO:0006378) |
| 0.1 | 0.6 | GO:0016925 | protein sumoylation(GO:0016925) |
| 0.1 | 8.3 | GO:0009657 | plastid organization(GO:0009657) |
| 0.1 | 2.7 | GO:0048481 | plant ovule development(GO:0048481) |
| 0.1 | 0.7 | GO:0005987 | sucrose catabolic process(GO:0005987) |
| 0.1 | 0.2 | GO:0035335 | peptidyl-tyrosine dephosphorylation(GO:0035335) |
| 0.1 | 0.7 | GO:0010413 | glucuronoxylan metabolic process(GO:0010413) glucuronoxylan biosynthetic process(GO:0010417) |
| 0.1 | 0.6 | GO:0060688 | regulation of morphogenesis of a branching structure(GO:0060688) regulation of secondary shoot formation(GO:2000032) |
| 0.1 | 0.2 | GO:0042908 | xenobiotic transport(GO:0042908) |
| 0.1 | 1.1 | GO:0001678 | cellular glucose homeostasis(GO:0001678) |
| 0.1 | 2.0 | GO:0010075 | regulation of meristem growth(GO:0010075) |
| 0.1 | 0.1 | GO:0006430 | lysyl-tRNA aminoacylation(GO:0006430) |
| 0.1 | 0.3 | GO:0010438 | cellular response to sulfur starvation(GO:0010438) |
| 0.1 | 0.6 | GO:0000079 | regulation of cyclin-dependent protein serine/threonine kinase activity(GO:0000079) regulation of cyclin-dependent protein kinase activity(GO:1904029) |
| 0.1 | 0.7 | GO:0010274 | hydrotropism(GO:0010274) |
| 0.1 | 0.2 | GO:0001173 | DNA-templated transcriptional start site selection(GO:0001173) |
| 0.1 | 1.4 | GO:0009251 | glucan catabolic process(GO:0009251) |
| 0.1 | 0.5 | GO:0009704 | de-etiolation(GO:0009704) |
| 0.1 | 4.1 | GO:0045490 | pectin catabolic process(GO:0045490) |
| 0.1 | 0.5 | GO:0006308 | DNA catabolic process(GO:0006308) |
| 0.1 | 0.3 | GO:0019320 | hexose catabolic process(GO:0019320) |
| 0.1 | 1.3 | GO:0080092 | regulation of pollen tube growth(GO:0080092) |
| 0.0 | 0.1 | GO:0032011 | ARF protein signal transduction(GO:0032011) regulation of ARF protein signal transduction(GO:0032012) |
| 0.0 | 0.1 | GO:0000492 | box C/D snoRNP assembly(GO:0000492) |
| 0.0 | 0.2 | GO:0080119 | ER body organization(GO:0080119) |
| 0.0 | 0.9 | GO:0006108 | malate metabolic process(GO:0006108) |
| 0.0 | 0.3 | GO:0000379 | tRNA-type intron splice site recognition and cleavage(GO:0000379) |
| 0.0 | 0.5 | GO:0000919 | cell plate assembly(GO:0000919) |
| 0.0 | 1.2 | GO:0009691 | cytokinin biosynthetic process(GO:0009691) |
| 0.0 | 0.3 | GO:0030007 | cellular potassium ion homeostasis(GO:0030007) |
| 0.0 | 0.4 | GO:0034644 | cellular response to UV(GO:0034644) |
| 0.0 | 1.8 | GO:0010411 | xyloglucan metabolic process(GO:0010411) |
| 0.0 | 0.5 | GO:0035265 | organ growth(GO:0035265) |
| 0.0 | 1.4 | GO:0046351 | disaccharide biosynthetic process(GO:0046351) |
| 0.0 | 0.9 | GO:0050918 | chemotaxis(GO:0006935) pollen tube guidance(GO:0010183) taxis(GO:0042330) positive chemotaxis(GO:0050918) |
| 0.0 | 1.7 | GO:0019759 | S-glycoside catabolic process(GO:0016145) glycosinolate catabolic process(GO:0019759) glucosinolate catabolic process(GO:0019762) |
| 0.0 | 0.3 | GO:0071423 | malate transmembrane transport(GO:0071423) |
| 0.0 | 3.7 | GO:0009860 | pollen tube growth(GO:0009860) |
| 0.0 | 0.5 | GO:0000272 | polysaccharide catabolic process(GO:0000272) |
| 0.0 | 0.1 | GO:0010434 | nectary development(GO:0010254) bract morphogenesis(GO:0010433) bract formation(GO:0010434) flower morphogenesis(GO:0048439) |
| 0.0 | 0.8 | GO:0006268 | DNA unwinding involved in DNA replication(GO:0006268) |
| 0.0 | 0.6 | GO:0051123 | RNA polymerase II transcriptional preinitiation complex assembly(GO:0051123) |
| 0.0 | 0.7 | GO:0050821 | protein stabilization(GO:0050821) |
| 0.0 | 0.3 | GO:0050691 | regulation of defense response to virus by host(GO:0050691) |
| 0.0 | 1.8 | GO:0009736 | cytokinin-activated signaling pathway(GO:0009736) |
| 0.0 | 1.0 | GO:0035304 | regulation of protein dephosphorylation(GO:0035304) |
| 0.0 | 0.6 | GO:0010212 | response to ionizing radiation(GO:0010212) |
| 0.0 | 0.1 | GO:0034414 | tRNA 3'-trailer cleavage, endonucleolytic(GO:0034414) |
| 0.0 | 0.3 | GO:0031365 | N-terminal protein amino acid modification(GO:0031365) |
| 0.0 | 0.3 | GO:0001709 | cell fate determination(GO:0001709) |
| 0.0 | 0.5 | GO:0006817 | phosphate ion transport(GO:0006817) |
| 0.0 | 1.5 | GO:0006352 | DNA-templated transcription, initiation(GO:0006352) |
| 0.0 | 0.7 | GO:0085029 | pollen wall assembly(GO:0010208) cellular component assembly involved in morphogenesis(GO:0010927) extracellular matrix assembly(GO:0085029) |
| 0.0 | 0.5 | GO:0009612 | response to mechanical stimulus(GO:0009612) |
| 0.0 | 0.3 | GO:0016109 | tetraterpenoid biosynthetic process(GO:0016109) carotenoid biosynthetic process(GO:0016117) |
| 0.0 | 0.2 | GO:0098586 | virus induced gene silencing(GO:0009616) modulation by symbiont of RNA levels in host(GO:0052018) modulation of RNA levels in other organism involved in symbiotic interaction(GO:0052249) cellular response to virus(GO:0098586) |
| 0.0 | 0.1 | GO:0045912 | negative regulation of carbohydrate metabolic process(GO:0045912) |
| 0.0 | 0.3 | GO:0010383 | cell wall polysaccharide metabolic process(GO:0010383) hemicellulose metabolic process(GO:0010410) |
| 0.0 | 0.1 | GO:0007023 | post-chaperonin tubulin folding pathway(GO:0007023) |
| 0.0 | 0.2 | GO:0045039 | protein import into mitochondrial inner membrane(GO:0045039) |
| 0.0 | 0.4 | GO:0046246 | terpene biosynthetic process(GO:0046246) |
| 0.0 | 0.2 | GO:1901642 | nucleoside transmembrane transport(GO:1901642) |
| 0.0 | 0.1 | GO:0010093 | specification of floral organ identity(GO:0010093) |
| 0.0 | 0.4 | GO:0000162 | tryptophan biosynthetic process(GO:0000162) indolalkylamine biosynthetic process(GO:0046219) |
| 0.0 | 0.1 | GO:0033478 | UDP-rhamnose biosynthetic process(GO:0010253) UDP-rhamnose metabolic process(GO:0033478) |
| 0.0 | 0.3 | GO:0006415 | translational termination(GO:0006415) |
| 0.0 | 0.8 | GO:0009630 | gravitropism(GO:0009630) |
| 0.0 | 0.8 | GO:0006081 | cellular aldehyde metabolic process(GO:0006081) |
| 0.0 | 0.2 | GO:0070940 | dephosphorylation of RNA polymerase II C-terminal domain(GO:0070940) |
| 0.0 | 0.2 | GO:0046337 | phosphatidylethanolamine biosynthetic process(GO:0006646) phosphatidylethanolamine metabolic process(GO:0046337) |
| 0.0 | 0.3 | GO:0006302 | double-strand break repair(GO:0006302) |
| 0.0 | 0.1 | GO:0048830 | adventitious root development(GO:0048830) |
| 0.0 | 0.3 | GO:0009926 | auxin polar transport(GO:0009926) |
| 0.0 | 0.1 | GO:0006821 | chloride transport(GO:0006821) |
| 0.0 | 1.0 | GO:0006885 | regulation of pH(GO:0006885) |
| 0.0 | 0.7 | GO:0000724 | double-strand break repair via homologous recombination(GO:0000724) |
| 0.0 | 0.1 | GO:0071786 | endoplasmic reticulum tubular network organization(GO:0071786) |
| 0.0 | 0.1 | GO:0006678 | glycosylceramide metabolic process(GO:0006677) glucosylceramide metabolic process(GO:0006678) glucosylceramide catabolic process(GO:0006680) glycosphingolipid metabolic process(GO:0006687) glycolipid catabolic process(GO:0019377) glycosylceramide catabolic process(GO:0046477) glycosphingolipid catabolic process(GO:0046479) ceramide catabolic process(GO:0046514) |
| 0.0 | 0.1 | GO:0019985 | translesion synthesis(GO:0019985) error-prone translesion synthesis(GO:0042276) |
| 0.0 | 0.2 | GO:2001289 | lipid X metabolic process(GO:2001289) |
| 0.0 | 1.1 | GO:0016579 | protein deubiquitination(GO:0016579) |
| 0.0 | 0.3 | GO:0006298 | mismatch repair(GO:0006298) |
| 0.0 | 0.2 | GO:0016024 | CDP-diacylglycerol biosynthetic process(GO:0016024) CDP-diacylglycerol metabolic process(GO:0046341) |
| 0.0 | 0.3 | GO:0009082 | branched-chain amino acid biosynthetic process(GO:0009082) |
| 0.0 | 0.1 | GO:0042044 | water transport(GO:0006833) fluid transport(GO:0042044) |
| 0.0 | 0.1 | GO:0042343 | indole glucosinolate metabolic process(GO:0042343) |
| 0.0 | 1.8 | GO:0010608 | posttranscriptional regulation of gene expression(GO:0010608) |
| 0.0 | 0.4 | GO:0006986 | response to unfolded protein(GO:0006986) |
| 0.0 | 0.1 | GO:0043486 | histone exchange(GO:0043486) |
| 0.0 | 0.6 | GO:0006997 | nucleus organization(GO:0006997) |
Gene overrepresentation in cellular component category:
| Log-likelihood per target | Total log-likelihood | Term | Description |
|---|---|---|---|
| 1.5 | 13.5 | GO:0009517 | thylakoid light-harvesting complex(GO:0009503) PSII associated light-harvesting complex II(GO:0009517) light-harvesting complex(GO:0030076) |
| 1.0 | 2.9 | GO:0030093 | chloroplast photosystem I(GO:0030093) |
| 0.8 | 2.5 | GO:0043674 | pollen wall(GO:0043667) exine(GO:0043668) sexine(GO:0043673) columella(GO:0043674) |
| 0.8 | 20.3 | GO:0009654 | photosystem II oxygen evolving complex(GO:0009654) |
| 0.8 | 6.4 | GO:0009538 | photosystem I reaction center(GO:0009538) |
| 0.8 | 33.2 | GO:0010319 | stromule(GO:0010319) |
| 0.7 | 2.2 | GO:0031390 | Ctf18 RFC-like complex(GO:0031390) |
| 0.7 | 2.2 | GO:0035619 | root hair(GO:0035618) root hair tip(GO:0035619) |
| 0.6 | 4.1 | GO:0009533 | chloroplast stromal thylakoid(GO:0009533) |
| 0.5 | 3.1 | GO:0009346 | citrate lyase complex(GO:0009346) |
| 0.5 | 8.2 | GO:0009531 | secondary cell wall(GO:0009531) |
| 0.4 | 1.3 | GO:0031021 | interphase microtubule organizing center(GO:0031021) |
| 0.4 | 8.3 | GO:0031012 | extracellular matrix(GO:0031012) |
| 0.4 | 3.9 | GO:0010369 | chromocenter(GO:0010369) |
| 0.4 | 4.3 | GO:0098807 | chloroplast thylakoid membrane protein complex(GO:0098807) |
| 0.4 | 3.9 | GO:0031209 | SCAR complex(GO:0031209) |
| 0.4 | 7.4 | GO:0009508 | plastid chromosome(GO:0009508) |
| 0.4 | 1.1 | GO:0009522 | photosystem I(GO:0009522) |
| 0.3 | 1.0 | GO:0070382 | exocytic vesicle(GO:0070382) |
| 0.3 | 0.9 | GO:0005828 | kinetochore microtubule(GO:0005828) |
| 0.3 | 0.9 | GO:0032432 | actin filament bundle(GO:0032432) |
| 0.3 | 4.9 | GO:0010598 | NAD(P)H dehydrogenase complex (plastoquinone)(GO:0010598) |
| 0.3 | 9.2 | GO:0055028 | cortical microtubule(GO:0055028) |
| 0.2 | 0.7 | GO:0030015 | CCR4-NOT core complex(GO:0030015) |
| 0.2 | 5.8 | GO:0009543 | chloroplast thylakoid lumen(GO:0009543) plastid thylakoid lumen(GO:0031978) |
| 0.2 | 1.5 | GO:0030139 | endocytic vesicle(GO:0030139) |
| 0.2 | 0.6 | GO:0043186 | P granule(GO:0043186) pole plasm(GO:0045495) germ plasm(GO:0060293) |
| 0.2 | 8.0 | GO:0010287 | plastoglobule(GO:0010287) |
| 0.2 | 0.7 | GO:0030681 | ribonuclease MRP complex(GO:0000172) nucleolar ribonuclease P complex(GO:0005655) multimeric ribonuclease P complex(GO:0030681) |
| 0.2 | 2.2 | GO:0045298 | tubulin complex(GO:0045298) |
| 0.2 | 3.1 | GO:0000148 | 1,3-beta-D-glucan synthase complex(GO:0000148) |
| 0.2 | 23.8 | GO:0046658 | anchored component of plasma membrane(GO:0046658) |
| 0.1 | 1.0 | GO:0031379 | RNA-directed RNA polymerase complex(GO:0031379) nuclear RNA-directed RNA polymerase complex(GO:0031380) |
| 0.1 | 8.1 | GO:0009706 | chloroplast inner membrane(GO:0009706) |
| 0.1 | 1.6 | GO:0034357 | photosynthetic membrane(GO:0034357) thylakoid membrane(GO:0042651) |
| 0.1 | 0.3 | GO:0035371 | microtubule plus-end(GO:0035371) microtubule end(GO:1990752) |
| 0.1 | 0.5 | GO:0031907 | peroxisomal matrix(GO:0005782) microbody lumen(GO:0031907) |
| 0.1 | 0.7 | GO:1990124 | messenger ribonucleoprotein complex(GO:1990124) |
| 0.1 | 0.4 | GO:0010316 | pyrophosphate-dependent phosphofructokinase complex(GO:0010316) |
| 0.1 | 0.4 | GO:0005672 | transcription factor TFIIA complex(GO:0005672) |
| 0.1 | 1.6 | GO:0019897 | extrinsic component of plasma membrane(GO:0019897) |
| 0.1 | 0.6 | GO:0030915 | Smc5-Smc6 complex(GO:0030915) |
| 0.1 | 0.7 | GO:0034045 | pre-autophagosomal structure membrane(GO:0034045) |
| 0.1 | 3.4 | GO:0005764 | lysosome(GO:0005764) |
| 0.1 | 1.2 | GO:0005880 | nuclear microtubule(GO:0005880) |
| 0.1 | 1.1 | GO:0005793 | endoplasmic reticulum-Golgi intermediate compartment(GO:0005793) |
| 0.1 | 22.1 | GO:0031976 | plastid thylakoid(GO:0031976) |
| 0.1 | 0.4 | GO:0009898 | cytoplasmic side of plasma membrane(GO:0009898) |
| 0.1 | 0.2 | GO:0005905 | clathrin-coated pit(GO:0005905) |
| 0.1 | 3.0 | GO:0005811 | lipid particle(GO:0005811) |
| 0.1 | 29.0 | GO:0009532 | plastid stroma(GO:0009532) |
| 0.1 | 15.8 | GO:0048046 | apoplast(GO:0048046) |
| 0.1 | 1.1 | GO:0035838 | growing cell tip(GO:0035838) cell tip(GO:0051286) pollen tube tip(GO:0090404) |
| 0.1 | 1.6 | GO:0005680 | anaphase-promoting complex(GO:0005680) |
| 0.1 | 3.1 | GO:0009527 | plastid outer membrane(GO:0009527) |
| 0.1 | 0.2 | GO:0070847 | core mediator complex(GO:0070847) |
| 0.1 | 0.6 | GO:0030125 | clathrin vesicle coat(GO:0030125) |
| 0.1 | 3.5 | GO:0005874 | microtubule(GO:0005874) |
| 0.1 | 0.2 | GO:0031314 | extrinsic component of mitochondrial inner membrane(GO:0031314) |
| 0.0 | 0.4 | GO:0030688 | preribosome, small subunit precursor(GO:0030688) |
| 0.0 | 0.3 | GO:1902555 | tRNA-intron endonuclease complex(GO:0000214) endoribonuclease complex(GO:1902555) |
| 0.0 | 2.8 | GO:0005615 | extracellular space(GO:0005615) |
| 0.0 | 5.1 | GO:0031225 | anchored component of membrane(GO:0031225) |
| 0.0 | 1.2 | GO:0000794 | condensed nuclear chromosome(GO:0000794) |
| 0.0 | 0.5 | GO:0009986 | cell surface(GO:0009986) |
| 0.0 | 0.4 | GO:0000127 | transcription factor TFIIIC complex(GO:0000127) |
| 0.0 | 4.1 | GO:0022625 | cytosolic large ribosomal subunit(GO:0022625) |
| 0.0 | 0.3 | GO:0031428 | box C/D snoRNP complex(GO:0031428) |
| 0.0 | 1.7 | GO:0005797 | Golgi medial cisterna(GO:0005797) |
| 0.0 | 4.5 | GO:0009505 | plant-type cell wall(GO:0009505) |
| 0.0 | 0.3 | GO:0005832 | chaperonin-containing T-complex(GO:0005832) |
| 0.0 | 0.6 | GO:0005669 | transcription factor TFIID complex(GO:0005669) |
| 0.0 | 1.3 | GO:0090575 | RNA polymerase II transcription factor complex(GO:0090575) |
| 0.0 | 0.2 | GO:0010168 | ER body(GO:0010168) |
| 0.0 | 0.6 | GO:0000145 | exocyst(GO:0000145) |
| 0.0 | 0.6 | GO:0005686 | U2 snRNP(GO:0005686) |
| 0.0 | 0.2 | GO:0017119 | Golgi transport complex(GO:0017119) |
| 0.0 | 0.2 | GO:0005732 | small nucleolar ribonucleoprotein complex(GO:0005732) |
| 0.0 | 0.1 | GO:0008622 | epsilon DNA polymerase complex(GO:0008622) |
| 0.0 | 0.6 | GO:0090406 | pollen tube(GO:0090406) |
| 0.0 | 0.3 | GO:0005689 | U12-type spliceosomal complex(GO:0005689) |
| 0.0 | 36.2 | GO:0005576 | extracellular region(GO:0005576) |
| 0.0 | 0.1 | GO:0000812 | Swr1 complex(GO:0000812) |
| 0.0 | 0.1 | GO:0030126 | COPI vesicle coat(GO:0030126) COPI-coated vesicle membrane(GO:0030663) |
| 0.0 | 0.1 | GO:0071458 | integral component of cytoplasmic side of endoplasmic reticulum membrane(GO:0071458) cytoplasmic side of endoplasmic reticulum membrane(GO:0098554) |
| 0.0 | 0.3 | GO:0005852 | eukaryotic translation initiation factor 3 complex(GO:0005852) |
| 0.0 | 1.8 | GO:0031982 | vesicle(GO:0031982) |
Gene overrepresentation in molecular function category:
| Log-likelihood per target | Total log-likelihood | Term | Description |
|---|---|---|---|
| 3.1 | 9.4 | GO:0051738 | xanthophyll binding(GO:0051738) |
| 2.1 | 8.2 | GO:0050162 | oxalate oxidase activity(GO:0050162) |
| 1.3 | 5.2 | GO:0042132 | fructose 1,6-bisphosphate 1-phosphatase activity(GO:0042132) |
| 1.2 | 3.7 | GO:0010242 | oxygen evolving activity(GO:0010242) |
| 1.1 | 3.3 | GO:0000170 | sphingosine hydroxylase activity(GO:0000170) |
| 1.1 | 3.2 | GO:0043425 | bHLH transcription factor binding(GO:0043425) |
| 1.1 | 1.1 | GO:0031409 | pigment binding(GO:0031409) |
| 0.9 | 2.6 | GO:0005344 | oxygen transporter activity(GO:0005344) |
| 0.8 | 3.2 | GO:0046593 | mandelonitrile lyase activity(GO:0046593) |
| 0.7 | 3.6 | GO:0016463 | cadmium-transporting ATPase activity(GO:0015434) zinc-exporting ATPase activity(GO:0016463) |
| 0.7 | 2.1 | GO:0047100 | glyceraldehyde-3-phosphate dehydrogenase (NADP+) (phosphorylating) activity(GO:0047100) |
| 0.7 | 2.1 | GO:0061731 | ribonucleoside-diphosphate reductase activity, thioredoxin disulfide as acceptor(GO:0004748) oxidoreductase activity, acting on CH or CH2 groups, disulfide as acceptor(GO:0016728) ribonucleoside-diphosphate reductase activity(GO:0061731) |
| 0.7 | 22.2 | GO:0004089 | carbonate dehydratase activity(GO:0004089) |
| 0.6 | 1.9 | GO:0016767 | geranylgeranyl-diphosphate geranylgeranyltransferase activity(GO:0016767) |
| 0.6 | 2.9 | GO:0043024 | ribosomal small subunit binding(GO:0043024) |
| 0.6 | 1.7 | GO:0051777 | ent-kaurenoate oxidase activity(GO:0051777) |
| 0.5 | 2.7 | GO:0046715 | borate transmembrane transporter activity(GO:0046715) borate efflux transmembrane transporter activity(GO:0080139) |
| 0.5 | 2.7 | GO:0004326 | tetrahydrofolylpolyglutamate synthase activity(GO:0004326) |
| 0.5 | 3.1 | GO:0003878 | ATP citrate synthase activity(GO:0003878) |
| 0.5 | 1.5 | GO:0003838 | sterol 24-C-methyltransferase activity(GO:0003838) |
| 0.5 | 4.0 | GO:0033946 | xyloglucan-specific endo-beta-1,4-glucanase activity(GO:0033946) |
| 0.5 | 1.4 | GO:0050567 | glutaminyl-tRNA synthase (glutamine-hydrolyzing) activity(GO:0050567) |
| 0.5 | 1.4 | GO:0047912 | galacturonokinase activity(GO:0047912) |
| 0.5 | 4.2 | GO:0004845 | uracil phosphoribosyltransferase activity(GO:0004845) |
| 0.5 | 11.6 | GO:0016762 | xyloglucan:xyloglucosyl transferase activity(GO:0016762) |
| 0.5 | 4.1 | GO:0016464 | chloroplast protein-transporting ATPase activity(GO:0016464) |
| 0.5 | 1.4 | GO:0046524 | sucrose-phosphate synthase activity(GO:0046524) |
| 0.4 | 3.8 | GO:0010428 | methyl-CpNpG binding(GO:0010428) methyl-CpNpN binding(GO:0010429) |
| 0.4 | 5.5 | GO:0042389 | omega-3 fatty acid desaturase activity(GO:0042389) |
| 0.4 | 5.9 | GO:0004332 | fructose-bisphosphate aldolase activity(GO:0004332) |
| 0.4 | 1.2 | GO:0003844 | 1,4-alpha-glucan branching enzyme activity(GO:0003844) |
| 0.4 | 4.9 | GO:0047259 | glucomannan 4-beta-mannosyltransferase activity(GO:0047259) |
| 0.4 | 8.9 | GO:0102336 | 3-oxo-arachidoyl-CoA synthase activity(GO:0102336) 3-oxo-cerotoyl-CoA synthase activity(GO:0102337) 3-oxo-lignoceronyl-CoA synthase activity(GO:0102338) |
| 0.4 | 1.5 | GO:0004729 | oxygen-dependent protoporphyrinogen oxidase activity(GO:0004729) protoporphyrinogen oxidase activity(GO:0070818) |
| 0.4 | 2.6 | GO:0071933 | protein kinase A regulatory subunit binding(GO:0034237) protein kinase A binding(GO:0051018) Arp2/3 complex binding(GO:0071933) |
| 0.4 | 7.5 | GO:0005199 | structural constituent of cell wall(GO:0005199) |
| 0.4 | 2.9 | GO:0070696 | transmembrane receptor protein serine/threonine kinase binding(GO:0070696) |
| 0.4 | 2.1 | GO:0051723 | protein methylesterase activity(GO:0051723) |
| 0.3 | 3.8 | GO:0043733 | alkylbase DNA N-glycosylase activity(GO:0003905) DNA-3-methyladenine glycosylase activity(GO:0008725) DNA-3-methylbase glycosylase activity(GO:0043733) |
| 0.3 | 3.5 | GO:0004312 | fatty acid synthase activity(GO:0004312) |
| 0.3 | 2.4 | GO:1990538 | xylan O-acetyltransferase activity(GO:1990538) |
| 0.3 | 3.4 | GO:0002094 | polyprenyltransferase activity(GO:0002094) |
| 0.3 | 1.7 | GO:0003979 | UDP-glucose 6-dehydrogenase activity(GO:0003979) |
| 0.3 | 1.0 | GO:0035671 | enone reductase activity(GO:0035671) |
| 0.3 | 9.5 | GO:0008266 | poly(U) RNA binding(GO:0008266) |
| 0.3 | 2.3 | GO:0004345 | glucose-6-phosphate dehydrogenase activity(GO:0004345) |
| 0.3 | 2.0 | GO:0045156 | electron transporter, transferring electrons within the cyclic electron transport pathway of photosynthesis activity(GO:0045156) |
| 0.3 | 1.3 | GO:0004075 | biotin carboxylase activity(GO:0004075) |
| 0.3 | 1.0 | GO:0004412 | homoserine dehydrogenase activity(GO:0004412) |
| 0.3 | 1.3 | GO:0045548 | phenylalanine ammonia-lyase activity(GO:0045548) |
| 0.3 | 1.3 | GO:0000340 | RNA 7-methylguanosine cap binding(GO:0000340) |
| 0.3 | 0.6 | GO:0019789 | SUMO transferase activity(GO:0019789) |
| 0.3 | 1.6 | GO:0004028 | 3-chloroallyl aldehyde dehydrogenase activity(GO:0004028) |
| 0.3 | 4.1 | GO:0046556 | xylan 1,4-beta-xylosidase activity(GO:0009044) alpha-L-arabinofuranosidase activity(GO:0046556) |
| 0.3 | 0.9 | GO:0001130 | bacterial-type RNA polymerase transcription factor activity, sequence-specific DNA binding(GO:0001130) bacterial-type RNA polymerase transcriptional activator activity, sequence-specific DNA binding(GO:0001216) |
| 0.3 | 1.9 | GO:0050105 | L-gulonolactone oxidase activity(GO:0050105) |
| 0.3 | 2.5 | GO:0090447 | glycerol-3-phosphate 2-O-acyltransferase activity(GO:0090447) |
| 0.3 | 1.2 | GO:0080116 | glucuronoxylan glucuronosyltransferase activity(GO:0080116) |
| 0.3 | 3.5 | GO:0000774 | adenyl-nucleotide exchange factor activity(GO:0000774) |
| 0.3 | 1.2 | GO:0004077 | biotin-[acetyl-CoA-carboxylase] ligase activity(GO:0004077) biotin-protein ligase activity(GO:0018271) |
| 0.3 | 0.9 | GO:0003849 | 3-deoxy-7-phosphoheptulonate synthase activity(GO:0003849) |
| 0.3 | 0.6 | GO:0052736 | beta-glucanase activity(GO:0052736) |
| 0.3 | 1.4 | GO:0004478 | methionine adenosyltransferase activity(GO:0004478) |
| 0.3 | 0.8 | GO:0015185 | gamma-aminobutyric acid transmembrane transporter activity(GO:0015185) |
| 0.3 | 2.2 | GO:0004392 | heme oxygenase (decyclizing) activity(GO:0004392) |
| 0.3 | 10.2 | GO:0045735 | nutrient reservoir activity(GO:0045735) |
| 0.3 | 7.4 | GO:0008810 | cellulase activity(GO:0008810) |
| 0.3 | 1.1 | GO:0047724 | inosine nucleosidase activity(GO:0047724) |
| 0.3 | 2.2 | GO:0016987 | core DNA-dependent RNA polymerase binding promoter specificity activity(GO:0000996) sigma factor activity(GO:0016987) |
| 0.3 | 2.1 | GO:0008083 | growth factor activity(GO:0008083) |
| 0.3 | 1.8 | GO:0016621 | cinnamoyl-CoA reductase activity(GO:0016621) |
| 0.3 | 1.3 | GO:0008430 | selenium binding(GO:0008430) |
| 0.2 | 2.7 | GO:0016847 | 1-aminocyclopropane-1-carboxylate synthase activity(GO:0016847) |
| 0.2 | 1.2 | GO:0000150 | recombinase activity(GO:0000150) |
| 0.2 | 5.3 | GO:0016168 | chlorophyll binding(GO:0016168) |
| 0.2 | 1.6 | GO:0052853 | very-long-chain-(S)-2-hydroxy-acid oxidase activity(GO:0052852) long-chain-(S)-2-hydroxy-long-chain-acid oxidase activity(GO:0052853) medium-chain-(S)-2-hydroxy-acid oxidase activity(GO:0052854) |
| 0.2 | 1.3 | GO:0052656 | L-leucine transaminase activity(GO:0052654) L-valine transaminase activity(GO:0052655) L-isoleucine transaminase activity(GO:0052656) |
| 0.2 | 1.1 | GO:0004127 | cytidylate kinase activity(GO:0004127) |
| 0.2 | 1.7 | GO:0008381 | mechanically-gated ion channel activity(GO:0008381) mechanically gated channel activity(GO:0022833) |
| 0.2 | 4.3 | GO:0015250 | water transmembrane transporter activity(GO:0005372) water channel activity(GO:0015250) |
| 0.2 | 0.6 | GO:0050412 | cinnamate beta-D-glucosyltransferase activity(GO:0050412) |
| 0.2 | 2.4 | GO:0103075 | indole-3-pyruvate monooxygenase activity(GO:0103075) |
| 0.2 | 1.4 | GO:0048487 | beta-tubulin binding(GO:0048487) |
| 0.2 | 1.5 | GO:0003999 | adenine phosphoribosyltransferase activity(GO:0003999) |
| 0.2 | 0.8 | GO:0008703 | 5-amino-6-(5-phosphoribosylamino)uracil reductase activity(GO:0008703) |
| 0.2 | 3.4 | GO:0010329 | auxin efflux transmembrane transporter activity(GO:0010329) |
| 0.2 | 0.8 | GO:0070006 | metalloaminopeptidase activity(GO:0070006) |
| 0.2 | 2.6 | GO:0016872 | intramolecular lyase activity(GO:0016872) |
| 0.2 | 1.1 | GO:0050062 | long-chain-fatty-acyl-CoA reductase activity(GO:0050062) |
| 0.2 | 0.9 | GO:0004473 | malate dehydrogenase (decarboxylating) (NADP+) activity(GO:0004473) |
| 0.2 | 1.0 | GO:0050378 | UDP-glucuronate 4-epimerase activity(GO:0050378) |
| 0.2 | 12.3 | GO:0003777 | microtubule motor activity(GO:0003777) |
| 0.2 | 1.2 | GO:0003830 | beta-1,4-mannosylglycoprotein 4-beta-N-acetylglucosaminyltransferase activity(GO:0003830) |
| 0.2 | 3.1 | GO:0003843 | 1,3-beta-D-glucan synthase activity(GO:0003843) |
| 0.2 | 0.8 | GO:0004325 | ferrochelatase activity(GO:0004325) |
| 0.2 | 1.1 | GO:0005452 | inorganic anion exchanger activity(GO:0005452) |
| 0.2 | 8.7 | GO:0102483 | scopolin beta-glucosidase activity(GO:0102483) |
| 0.2 | 4.0 | GO:0004805 | trehalose-phosphatase activity(GO:0004805) |
| 0.2 | 1.1 | GO:0001872 | (1->3)-beta-D-glucan binding(GO:0001872) |
| 0.1 | 0.7 | GO:0022841 | leak channel activity(GO:0022840) potassium ion leak channel activity(GO:0022841) narrow pore channel activity(GO:0022842) |
| 0.1 | 10.0 | GO:0004650 | polygalacturonase activity(GO:0004650) |
| 0.1 | 1.0 | GO:0003968 | RNA-directed RNA polymerase activity(GO:0003968) |
| 0.1 | 1.2 | GO:0010333 | terpene synthase activity(GO:0010333) |
| 0.1 | 0.4 | GO:0047804 | cysteine-S-conjugate beta-lyase activity(GO:0047804) |
| 0.1 | 1.4 | GO:0004351 | glutamate decarboxylase activity(GO:0004351) |
| 0.1 | 0.8 | GO:0004652 | polynucleotide adenylyltransferase activity(GO:0004652) |
| 0.1 | 3.7 | GO:0005385 | zinc ion transmembrane transporter activity(GO:0005385) |
| 0.1 | 1.1 | GO:0000095 | S-adenosyl-L-methionine transmembrane transporter activity(GO:0000095) coenzyme transporter activity(GO:0051185) |
| 0.1 | 0.8 | GO:0045431 | flavonol synthase activity(GO:0045431) |
| 0.1 | 1.1 | GO:0004340 | glucokinase activity(GO:0004340) glucose binding(GO:0005536) mannokinase activity(GO:0019158) |
| 0.1 | 0.7 | GO:0010179 | IAA-Ala conjugate hydrolase activity(GO:0010179) |
| 0.1 | 1.3 | GO:0016634 | oxidoreductase activity, acting on the CH-CH group of donors, oxygen as acceptor(GO:0016634) |
| 0.1 | 2.4 | GO:0004564 | beta-fructofuranosidase activity(GO:0004564) |
| 0.1 | 0.4 | GO:0004557 | alpha-galactosidase activity(GO:0004557) raffinose alpha-galactosidase activity(GO:0052692) |
| 0.1 | 1.0 | GO:0017048 | Rho GTPase binding(GO:0017048) |
| 0.1 | 0.7 | GO:0004930 | G-protein coupled receptor activity(GO:0004930) |
| 0.1 | 2.2 | GO:0005227 | calcium activated cation channel activity(GO:0005227) ion gated channel activity(GO:0022839) |
| 0.1 | 1.2 | GO:0047372 | acylglycerol lipase activity(GO:0047372) |
| 0.1 | 0.7 | GO:0003825 | alpha,alpha-trehalose-phosphate synthase (UDP-forming) activity(GO:0003825) |
| 0.1 | 1.6 | GO:0003689 | DNA clamp loader activity(GO:0003689) protein-DNA loading ATPase activity(GO:0033170) |
| 0.1 | 1.8 | GO:0015114 | phosphate ion transmembrane transporter activity(GO:0015114) |
| 0.1 | 3.9 | GO:0005200 | structural constituent of cytoskeleton(GO:0005200) |
| 0.1 | 0.7 | GO:0019904 | protein domain specific binding(GO:0019904) |
| 0.1 | 1.3 | GO:0016774 | phosphotransferase activity, carboxyl group as acceptor(GO:0016774) |
| 0.1 | 0.6 | GO:0003987 | acetate-CoA ligase activity(GO:0003987) |
| 0.1 | 0.4 | GO:0047334 | diphosphate-fructose-6-phosphate 1-phosphotransferase activity(GO:0047334) |
| 0.1 | 4.3 | GO:0000156 | phosphorelay response regulator activity(GO:0000156) |
| 0.1 | 0.7 | GO:0004791 | thioredoxin-disulfide reductase activity(GO:0004791) |
| 0.1 | 0.5 | GO:0043765 | T/G mismatch-specific endonuclease activity(GO:0043765) |
| 0.1 | 3.3 | GO:0033612 | receptor serine/threonine kinase binding(GO:0033612) |
| 0.1 | 1.5 | GO:0016157 | sucrose synthase activity(GO:0016157) |
| 0.1 | 0.5 | GO:0004001 | adenosine kinase activity(GO:0004001) |
| 0.1 | 0.4 | GO:0004048 | anthranilate phosphoribosyltransferase activity(GO:0004048) |
| 0.1 | 4.0 | GO:0004222 | metalloendopeptidase activity(GO:0004222) |
| 0.1 | 0.5 | GO:0008964 | phosphoenolpyruvate carboxylase activity(GO:0008964) |
| 0.1 | 0.5 | GO:0005544 | calcium-dependent phospholipid binding(GO:0005544) |
| 0.1 | 1.9 | GO:0005089 | Rho guanyl-nucleotide exchange factor activity(GO:0005089) |
| 0.1 | 0.4 | GO:0016165 | linoleate 13S-lipoxygenase activity(GO:0016165) |
| 0.1 | 0.5 | GO:0004535 | poly(A)-specific ribonuclease activity(GO:0004535) |
| 0.1 | 2.9 | GO:0009975 | cyclase activity(GO:0009975) |
| 0.1 | 0.4 | GO:0016882 | cyclo-ligase activity(GO:0016882) |
| 0.1 | 2.7 | GO:0047262 | polygalacturonate 4-alpha-galacturonosyltransferase activity(GO:0047262) |
| 0.1 | 0.4 | GO:0080118 | brassinosteroid sulfotransferase activity(GO:0080118) |
| 0.1 | 3.4 | GO:0019199 | transmembrane receptor protein kinase activity(GO:0019199) |
| 0.1 | 0.8 | GO:0004020 | adenylylsulfate kinase activity(GO:0004020) |
| 0.1 | 0.5 | GO:0003983 | UTP:glucose-1-phosphate uridylyltransferase activity(GO:0003983) |
| 0.1 | 1.7 | GO:0030145 | manganese ion binding(GO:0030145) |
| 0.1 | 0.4 | GO:0045544 | gibberellin 20-oxidase activity(GO:0045544) |
| 0.1 | 0.6 | GO:0005504 | fatty acid binding(GO:0005504) |
| 0.1 | 0.4 | GO:0016653 | oxidoreductase activity, acting on NAD(P)H, heme protein as acceptor(GO:0016653) |
| 0.1 | 0.4 | GO:0001653 | peptide receptor activity(GO:0001653) |
| 0.1 | 0.7 | GO:0004024 | alcohol dehydrogenase activity, zinc-dependent(GO:0004024) |
| 0.1 | 0.6 | GO:0008157 | protein phosphatase 1 binding(GO:0008157) |
| 0.1 | 1.9 | GO:0030276 | clathrin binding(GO:0030276) |
| 0.1 | 3.1 | GO:0005262 | calcium channel activity(GO:0005262) |
| 0.1 | 0.5 | GO:0046625 | sphingolipid binding(GO:0046625) ceramide binding(GO:0097001) |
| 0.1 | 8.8 | GO:0004252 | serine-type endopeptidase activity(GO:0004252) |
| 0.1 | 0.8 | GO:0009378 | four-way junction helicase activity(GO:0009378) |
| 0.1 | 1.9 | GO:0010427 | abscisic acid binding(GO:0010427) |
| 0.1 | 0.2 | GO:0004563 | beta-N-acetylhexosaminidase activity(GO:0004563) |
| 0.1 | 2.9 | GO:0008553 | hydrogen-exporting ATPase activity, phosphorylative mechanism(GO:0008553) |
| 0.1 | 0.7 | GO:0004526 | ribonuclease P activity(GO:0004526) |
| 0.1 | 0.3 | GO:0008395 | steroid hydroxylase activity(GO:0008395) |
| 0.1 | 0.4 | GO:0042085 | 5-methyltetrahydropteroyltriglutamate-homocysteine S-methyltransferase activity(GO:0003871) methionine synthase activity(GO:0008705) 5-methyltetrahydrofolate-dependent methyltransferase activity(GO:0042084) 5-methyltetrahydropteroyltri-L-glutamate-dependent methyltransferase activity(GO:0042085) |
| 0.1 | 1.9 | GO:0016837 | carbon-oxygen lyase activity, acting on polysaccharides(GO:0016837) pectate lyase activity(GO:0030570) |
| 0.1 | 0.5 | GO:0016161 | beta-amylase activity(GO:0016161) |
| 0.1 | 1.1 | GO:0015095 | magnesium ion transmembrane transporter activity(GO:0015095) |
| 0.1 | 0.3 | GO:0004475 | mannose-1-phosphate guanylyltransferase activity(GO:0004475) |
| 0.1 | 1.4 | GO:0004525 | ribonuclease III activity(GO:0004525) double-stranded RNA-specific ribonuclease activity(GO:0032296) |
| 0.1 | 0.2 | GO:0080102 | 3-methylthiopropyl glucosinolate S-oxygenase activity(GO:0080102) 5-methylthiopropyl glucosinolate S-oxygenase activity(GO:0080104) 7-methylthiopropyl glucosinolate S-oxygenase activity(GO:0080106) |
| 0.1 | 1.4 | GO:0060090 | binding, bridging(GO:0060090) |
| 0.1 | 0.7 | GO:1990757 | ubiquitin ligase activator activity(GO:1990757) |
| 0.1 | 0.3 | GO:0004549 | tRNA-intron endonuclease activity(GO:0000213) tRNA-specific ribonuclease activity(GO:0004549) |
| 0.1 | 2.2 | GO:0016655 | oxidoreductase activity, acting on NAD(P)H, quinone or similar compound as acceptor(GO:0016655) |
| 0.1 | 0.2 | GO:0004609 | phosphatidylserine decarboxylase activity(GO:0004609) |
| 0.1 | 5.0 | GO:0008017 | microtubule binding(GO:0008017) |
| 0.1 | 1.3 | GO:0004713 | protein tyrosine kinase activity(GO:0004713) |
| 0.1 | 2.4 | GO:0038023 | signaling receptor activity(GO:0038023) |
| 0.1 | 0.2 | GO:0008534 | oxidized purine nucleobase lesion DNA N-glycosylase activity(GO:0008534) |
| 0.1 | 0.4 | GO:0048027 | mRNA 5'-UTR binding(GO:0048027) |
| 0.1 | 0.3 | GO:0036440 | citrate (Si)-synthase activity(GO:0004108) citrate synthase activity(GO:0036440) |
| 0.1 | 0.3 | GO:0080025 | phosphatidylinositol-3,5-bisphosphate binding(GO:0080025) |
| 0.1 | 1.6 | GO:0031593 | polyubiquitin binding(GO:0031593) |
| 0.1 | 3.2 | GO:0043621 | protein self-association(GO:0043621) |
| 0.1 | 0.3 | GO:0036456 | L-methionine:thioredoxin-disulfide S-oxidoreductase activity(GO:0033744) L-methionine-(S)-S-oxide reductase activity(GO:0036456) |
| 0.1 | 0.7 | GO:0004708 | MAP kinase kinase activity(GO:0004708) |
| 0.1 | 1.2 | GO:0048029 | monosaccharide binding(GO:0048029) |
| 0.1 | 0.7 | GO:0004867 | serine-type endopeptidase inhibitor activity(GO:0004867) |
| 0.1 | 0.2 | GO:0008253 | 5'-nucleotidase activity(GO:0008253) |
| 0.0 | 0.6 | GO:0016538 | cyclin-dependent protein serine/threonine kinase regulator activity(GO:0016538) |
| 0.0 | 0.4 | GO:0008028 | monocarboxylic acid transmembrane transporter activity(GO:0008028) |
| 0.0 | 0.4 | GO:0008494 | translation activator activity(GO:0008494) mitochondrial ribosome binding(GO:0097177) |
| 0.0 | 2.2 | GO:0004523 | RNA-DNA hybrid ribonuclease activity(GO:0004523) |
| 0.0 | 0.2 | GO:0070182 | DNA polymerase binding(GO:0070182) |
| 0.0 | 0.2 | GO:0004820 | glycine-tRNA ligase activity(GO:0004820) |
| 0.0 | 0.9 | GO:0015248 | sterol transporter activity(GO:0015248) |
| 0.0 | 0.5 | GO:0097599 | endo-1,4-beta-xylanase activity(GO:0031176) xylanase activity(GO:0097599) |
| 0.0 | 0.9 | GO:0016868 | intramolecular transferase activity, phosphotransferases(GO:0016868) |
| 0.0 | 0.5 | GO:0015112 | nitrate transmembrane transporter activity(GO:0015112) |
| 0.0 | 0.5 | GO:0000254 | C-4 methylsterol oxidase activity(GO:0000254) |
| 0.0 | 0.5 | GO:0004430 | 1-phosphatidylinositol 4-kinase activity(GO:0004430) |
| 0.0 | 0.2 | GO:0047498 | calcium-dependent phospholipase A2 activity(GO:0047498) |
| 0.0 | 0.3 | GO:0015140 | malate transmembrane transporter activity(GO:0015140) |
| 0.0 | 0.8 | GO:0080031 | methyl salicylate esterase activity(GO:0080031) methyl jasmonate esterase activity(GO:0080032) |
| 0.0 | 0.2 | GO:0017077 | oxidative phosphorylation uncoupler activity(GO:0017077) |
| 0.0 | 0.2 | GO:1990269 | phosphoserine binding(GO:0050815) RNA polymerase II C-terminal domain phosphoserine binding(GO:1990269) |
| 0.0 | 0.7 | GO:0042300 | beta-amyrin synthase activity(GO:0042300) |
| 0.0 | 2.5 | GO:0046910 | pectinesterase inhibitor activity(GO:0046910) |
| 0.0 | 0.6 | GO:0008308 | voltage-gated anion channel activity(GO:0008308) |
| 0.0 | 0.2 | GO:1990825 | sequence-specific mRNA binding(GO:1990825) |
| 0.0 | 0.1 | GO:0004824 | lysine-tRNA ligase activity(GO:0004824) |
| 0.0 | 0.3 | GO:0004084 | branched-chain-amino-acid transaminase activity(GO:0004084) |
| 0.0 | 1.6 | GO:0016279 | lysine N-methyltransferase activity(GO:0016278) protein-lysine N-methyltransferase activity(GO:0016279) |
| 0.0 | 0.1 | GO:0042781 | 3'-tRNA processing endoribonuclease activity(GO:0042781) |
| 0.0 | 0.3 | GO:0008327 | methyl-CpG binding(GO:0008327) |
| 0.0 | 0.5 | GO:0017025 | TBP-class protein binding(GO:0017025) |
| 0.0 | 1.5 | GO:0016831 | carboxy-lyase activity(GO:0016831) |
| 0.0 | 2.1 | GO:0004857 | enzyme inhibitor activity(GO:0004857) |
| 0.0 | 0.4 | GO:0061608 | nuclear localization sequence binding(GO:0008139) nuclear import signal receptor activity(GO:0061608) |
| 0.0 | 16.7 | GO:0046983 | protein dimerization activity(GO:0046983) |
| 0.0 | 1.4 | GO:0004197 | cysteine-type endopeptidase activity(GO:0004197) |
| 0.0 | 1.4 | GO:0003993 | acid phosphatase activity(GO:0003993) |
| 0.0 | 1.2 | GO:0016413 | O-acetyltransferase activity(GO:0016413) |
| 0.0 | 0.3 | GO:0004022 | alcohol dehydrogenase (NAD) activity(GO:0004022) |
| 0.0 | 1.8 | GO:0101005 | ubiquitinyl hydrolase activity(GO:0101005) |
| 0.0 | 3.5 | GO:0016820 | hydrolase activity, acting on acid anhydrides, catalyzing transmembrane movement of substances(GO:0016820) ATPase activity, coupled to transmembrane movement of substances(GO:0042626) ATPase activity, coupled to movement of substances(GO:0043492) |
| 0.0 | 0.6 | GO:0015925 | beta-galactosidase activity(GO:0004565) galactosidase activity(GO:0015925) |
| 0.0 | 2.9 | GO:0008289 | lipid binding(GO:0008289) |
| 0.0 | 0.2 | GO:0004605 | phosphatidate cytidylyltransferase activity(GO:0004605) |
| 0.0 | 0.5 | GO:0031386 | protein tag(GO:0031386) |
| 0.0 | 0.1 | GO:0008460 | dTDP-glucose 4,6-dehydratase activity(GO:0008460) UDP-L-rhamnose synthase activity(GO:0010280) UDP-glucose 4,6-dehydratase activity(GO:0050377) |
| 0.0 | 0.1 | GO:0000035 | acyl binding(GO:0000035) |
| 0.0 | 0.3 | GO:0030983 | mismatched DNA binding(GO:0030983) |
| 0.0 | 0.4 | GO:0008234 | cysteine-type peptidase activity(GO:0008234) |
| 0.0 | 0.2 | GO:0008097 | 5S rRNA binding(GO:0008097) |
| 0.0 | 0.1 | GO:0047493 | sphingomyelin synthase activity(GO:0033188) ceramide cholinephosphotransferase activity(GO:0047493) |
| 0.0 | 0.4 | GO:0052716 | hydroquinone:oxygen oxidoreductase activity(GO:0052716) |
| 0.0 | 2.7 | GO:0008168 | methyltransferase activity(GO:0008168) |
| 0.0 | 0.1 | GO:0008442 | 3-hydroxyisobutyrate dehydrogenase activity(GO:0008442) |
| 0.0 | 0.1 | GO:0016646 | oxidoreductase activity, acting on the CH-NH group of donors, NAD or NADP as acceptor(GO:0016646) |
| 0.0 | 0.1 | GO:0005086 | ARF guanyl-nucleotide exchange factor activity(GO:0005086) |
| 0.0 | 0.1 | GO:0004506 | squalene monooxygenase activity(GO:0004506) |
| 0.0 | 0.1 | GO:0004348 | glucosylceramidase activity(GO:0004348) |
| 0.0 | 0.3 | GO:0030599 | pectinesterase activity(GO:0030599) |
| 0.0 | 0.5 | GO:0008422 | beta-glucosidase activity(GO:0008422) |
| 0.0 | 0.2 | GO:0008420 | CTD phosphatase activity(GO:0008420) |
| 0.0 | 0.1 | GO:0000285 | 1-phosphatidylinositol-3-phosphate 5-kinase activity(GO:0000285) |
| 0.0 | 2.3 | GO:0043531 | ADP binding(GO:0043531) |
Gene overrepresentation in curated gene sets: canonical pathways category:
| Log-likelihood per target | Total log-likelihood | Term | Description |
|---|---|---|---|
| 2.9 | 23.6 | PID CMYB PATHWAY | C-MYB transcription factor network |
| 0.4 | 2.3 | PID BARD1 PATHWAY | BARD1 signaling events |
| 0.2 | 1.0 | PID HDAC CLASSII PATHWAY | Signaling events mediated by HDAC Class II |
| 0.1 | 0.4 | PID IL8 CXCR1 PATHWAY | IL8- and CXCR1-mediated signaling events |
| 0.1 | 0.2 | PID HNF3B PATHWAY | FOXA2 and FOXA3 transcription factor networks |
Gene overrepresentation in curated gene sets: REACTOME pathways category:
| Log-likelihood per target | Total log-likelihood | Term | Description |
|---|---|---|---|
| 3.9 | 23.6 | REACTOME REVERSIBLE HYDRATION OF CARBON DIOXIDE | Genes involved in Reversible Hydration of Carbon Dioxide |
| 0.4 | 1.1 | REACTOME G2 M DNA DAMAGE CHECKPOINT | Genes involved in G2/M DNA damage checkpoint |
| 0.2 | 1.4 | REACTOME HOMOLOGOUS RECOMBINATION REPAIR OF REPLICATION INDEPENDENT DOUBLE STRAND BREAKS | Genes involved in Homologous recombination repair of replication-independent double-strand breaks |
| 0.2 | 1.1 | REACTOME PEROXISOMAL LIPID METABOLISM | Genes involved in Peroxisomal lipid metabolism |
| 0.2 | 1.8 | REACTOME CHEMOKINE RECEPTORS BIND CHEMOKINES | Genes involved in Chemokine receptors bind chemokines |
| 0.1 | 0.4 | REACTOME IL 6 SIGNALING | Genes involved in Interleukin-6 signaling |
| 0.1 | 0.4 | REACTOME LIPID DIGESTION MOBILIZATION AND TRANSPORT | Genes involved in Lipid digestion, mobilization, and transport |
| 0.0 | 0.2 | REACTOME PLATELET ACTIVATION SIGNALING AND AGGREGATION | Genes involved in Platelet activation, signaling and aggregation |
| 0.0 | 0.4 | REACTOME FACTORS INVOLVED IN MEGAKARYOCYTE DEVELOPMENT AND PLATELET PRODUCTION | Genes involved in Factors involved in megakaryocyte development and platelet production |
| 0.0 | 0.2 | REACTOME TRANSCRIPTIONAL REGULATION OF WHITE ADIPOCYTE DIFFERENTIATION | Genes involved in Transcriptional Regulation of White Adipocyte Differentiation |