Project
GSE43616: Time-course of wild-type Arabidopsis leaf
Navigation
Downloads
Results for AT4G01120
Z-value: 0.09
Transcription factors associated with AT4G01120
| Gene Symbol | Gene ID | Gene Info |
|---|---|---|
|
AT4G01120
|
AT4G01120 | G-box binding factor 2 |
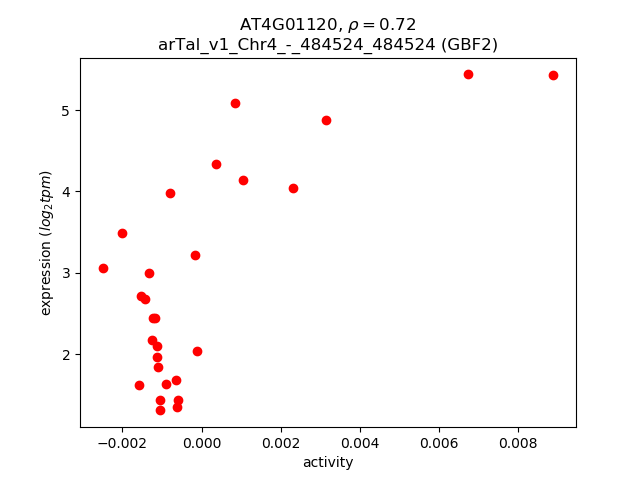
Activity-expression correlation:
| Gene | Promoter | Pearson corr. coef. | P-value | Plot |
|---|---|---|---|---|
| GBF2 | arTal_v1_Chr4_-_484524_484524 | 0.72 | 1.8e-05 | Click! |
Activity profile of AT4G01120 motif
Sorted Z-values of AT4G01120 motif
| Promoter | Log-likelihood | Transcript | Gene | Gene Info |
|---|---|---|---|---|
| arTal_v1_Chr1_+_22836327_22836327 | 0.32 |
AT1G61820.3
|
BGLU46
|
beta glucosidase 46 |
| arTal_v1_Chr1_+_22835078_22835078 | 0.30 |
AT1G61820.1
|
BGLU46
|
beta glucosidase 46 |
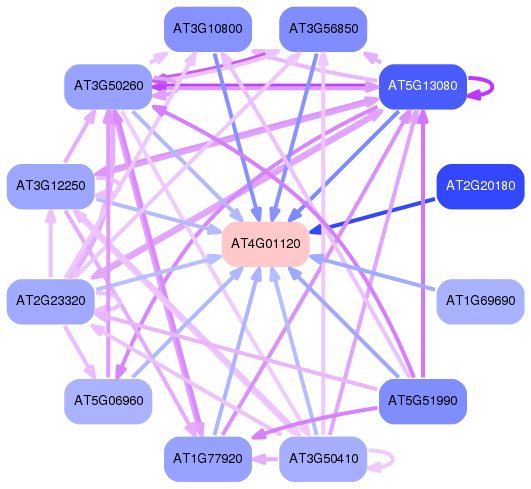
Network of associatons between targets according to the STRING database.

First level regulatory network of AT4G01120
Gene Ontology Analysis
Gene overrepresentation in molecular function category:
| Log-likelihood per target | Total log-likelihood | Term | Description |
|---|---|---|---|
| 0.2 | 0.6 | GO:0047782 | coniferin beta-glucosidase activity(GO:0047782) |