Project
GSE43616: Time-course of wild-type Arabidopsis leaf
Navigation
Downloads
Results for AT3G26620
Z-value: 0.82
Transcription factors associated with AT3G26620
| Gene Symbol | Gene ID | Gene Info |
|---|---|---|
|
AT3G26620
|
AT3G26620 | LOB domain-containing protein 23 |
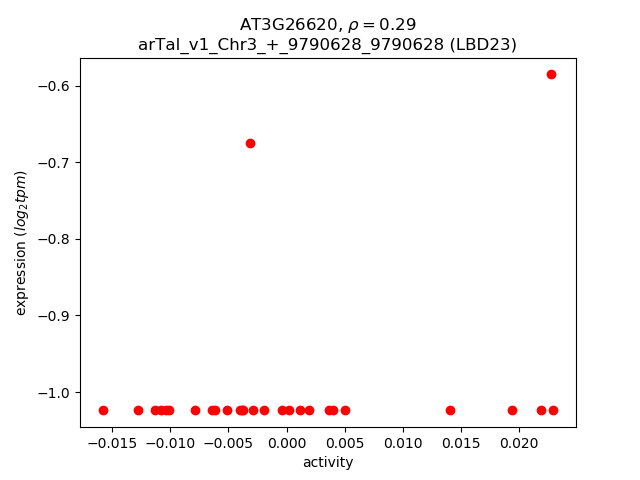
Activity-expression correlation:
| Gene | Promoter | Pearson corr. coef. | P-value | Plot |
|---|---|---|---|---|
| LBD23 | arTal_v1_Chr3_+_9790628_9790628 | 0.29 | 1.4e-01 | Click! |
Activity profile of AT3G26620 motif
Sorted Z-values of AT3G26620 motif
| Promoter | Log-likelihood | Transcript | Gene | Gene Info |
|---|---|---|---|---|
| arTal_v1_Chr4_-_12337599_12337599 | 3.19 |
AT4G23680.1
|
AT4G23680
|
Polyketide cyclase/dehydrase and lipid transport superfamily protein |
| arTal_v1_Chr1_+_25765718_25765718 | 3.18 |
AT1G68620.1
|
AT1G68620
|
alpha/beta-Hydrolases superfamily protein |
| arTal_v1_Chr4_-_9368852_9368852 | 2.96 |
AT4G16640.1
|
AT4G16640
|
Matrixin family protein |
| arTal_v1_Chr4_+_17597110_17597110 | 2.78 |
AT4G37430.1
|
CYP91A2
|
cytochrome P450, family 91, subfamily A, polypeptide 2 |
| arTal_v1_Chr1_+_5822309_5822309 | 2.76 |
AT1G17030.1
|
AT1G17030
|
hypothetical protein |
| arTal_v1_Chr5_-_26857086_26857086 | 2.72 |
AT5G67310.1
|
CYP81G1
|
cytochrome P450, family 81, subfamily G, polypeptide 1 |
| arTal_v1_Chr2_-_14541617_14541617 | 2.62 |
AT2G34500.1
|
CYP710A1
|
cytochrome P450, family 710, subfamily A, polypeptide 1 |
| arTal_v1_Chr1_+_1469541_1469541 | 2.56 |
AT1G05100.1
|
MAPKKK18
|
mitogen-activated protein kinase kinase kinase 18 |
| arTal_v1_Chr1_+_24763941_24763941 | 2.54 |
AT1G66390.1
|
MYB90
|
myb domain protein 90 |
| arTal_v1_Chr4_+_10398857_10398857 | 2.41 |
AT4G18980.1
|
AtS40-3
|
AtS40-3 |
| arTal_v1_Chr1_+_5389952_5389952 | 2.39 |
AT1G15670.1
|
AT1G15670
|
Galactose oxidase/kelch repeat superfamily protein |
| arTal_v1_Chr5_-_9000345_9000345 | 2.39 |
AT5G25820.1
|
AT5G25820
|
Exostosin family protein |
| arTal_v1_Chr5_+_24958125_24958125 | 2.29 |
AT5G62150.1
|
AT5G62150
|
peptidoglycan-binding LysM domain-containing protein |
| arTal_v1_Chr5_+_1153740_1153740 | 2.29 |
AT5G04200.1
|
MC9
|
metacaspase 9 |
| arTal_v1_Chr2_+_7845923_7845999 | 2.19 |
AT2G18050.2
AT2G18050.1 |
HIS1-3
|
histone H1-3 |
| arTal_v1_Chr2_-_19330197_19330197 | 2.02 |
AT2G47040.1
|
VGD1
|
Plant invertase/pectin methylesterase inhibitor superfamily |
| arTal_v1_Chr4_-_2234689_2234689 | 2.00 |
AT4G04490.1
|
CRK36
|
cysteine-rich RLK (RECEPTOR-like protein kinase) 36 |
| arTal_v1_Chr5_+_8082650_8082744 | 1.99 |
AT5G23950.2
AT5G23950.1 |
AT5G23950
|
Calcium-dependent lipid-binding (CaLB domain) family protein |
| arTal_v1_Chr4_+_131422_131422 | 1.97 |
AT4G00305.1
|
AT4G00305
|
RING/U-box superfamily protein |
| arTal_v1_Chr4_-_17571743_17571743 | 1.92 |
AT4G37370.1
|
CYP81D8
|
cytochrome P450, family 81, subfamily D, polypeptide 8 |
| arTal_v1_Chr1_+_4416315_4416315 | 1.90 |
AT1G12940.1
|
NRT2.5
|
nitrate transporter2.5 |
| arTal_v1_Chr3_+_4355138_4355138 | 1.81 |
AT3G13400.2
|
sks13
|
SKU5 similar 13 |
| arTal_v1_Chr3_+_4354923_4354923 | 1.77 |
AT3G13400.1
|
sks13
|
SKU5 similar 13 |
| arTal_v1_Chr3_-_17976774_17976774 | 1.74 |
AT3G48520.1
|
CYP94B3
|
cytochrome P450, family 94, subfamily B, polypeptide 3 |
| arTal_v1_Chr5_+_15501126_15501184 | 1.74 |
AT5G38710.1
AT5G38710.2 |
AT5G38710
|
Methylenetetrahydrofolate reductase family protein |
| arTal_v1_Chr3_-_8119490_8119490 | 1.72 |
AT3G22910.1
|
AT3G22910
|
ATPase E1-E2 type family protein / haloacid dehalogenase-like hydrolase family protein |
| arTal_v1_Chr2_-_19332659_19332659 | 1.67 |
AT2G47050.1
|
AT2G47050
|
Plant invertase/pectin methylesterase inhibitor superfamily protein |
| arTal_v1_Chr1_-_8967562_8967562 | 1.67 |
AT1G25530.1
|
AT1G25530
|
Transmembrane amino acid transporter family protein |
| arTal_v1_Chr2_-_13929763_13929763 | 1.67 |
AT2G32830.1
|
PHT1%3B5
|
phosphate transporter 1;5 |
| arTal_v1_Chr5_-_8547822_8547906 | 1.65 |
AT5G24870.2
AT5G24870.1 |
AT5G24870
|
RING/U-box superfamily protein |
| arTal_v1_Chr1_+_3945584_3945584 | 1.63 |
AT1G11700.1
|
AT1G11700
|
senescence regulator (Protein of unknown function, DUF584) |
| arTal_v1_Chr5_-_22236551_22236551 | 1.63 |
AT5G54730.2
|
G18F
|
yeast autophagy 18 F-like protein |
| arTal_v1_Chr5_-_17534796_17534796 | 1.63 |
AT5G43650.1
AT5G43650.2 |
BHLH92
|
basic helix-loop-helix (bHLH) DNA-binding superfamily protein |
| arTal_v1_Chr5_-_22237370_22237370 | 1.62 |
AT5G54730.1
|
G18F
|
yeast autophagy 18 F-like protein |
| arTal_v1_Chr4_+_12977192_12977341 | 1.62 |
AT4G25390.1
AT4G25390.2 |
AT4G25390
|
Protein kinase superfamily protein |
| arTal_v1_Chr4_-_14545310_14545310 | 1.61 |
AT4G29700.1
|
AT4G29700
|
Alkaline-phosphatase-like family protein |
| arTal_v1_Chr3_-_18116569_18116569 | 1.58 |
AT3G48850.1
|
PHT3%3B2
|
phosphate transporter 3;2 |
| arTal_v1_Chr5_-_8547423_8547423 | 1.57 |
AT5G24870.3
|
AT5G24870
|
RING/U-box superfamily protein |
| arTal_v1_Chr4_+_13236448_13236448 | 1.57 |
AT4G26120.1
|
AT4G26120
|
Ankyrin repeat family protein / BTB/POZ domain-containing protein |
| arTal_v1_Chr4_+_13236253_13236253 | 1.55 |
AT4G26120.2
|
AT4G26120
|
Ankyrin repeat family protein / BTB/POZ domain-containing protein |
| arTal_v1_Chr5_+_1176005_1176008 | 1.54 |
AT5G04250.2
AT5G04250.1 |
AT5G04250
|
Cysteine proteinases superfamily protein |
| arTal_v1_Chr4_+_9385119_9385180 | 1.53 |
AT4G16670.2
AT4G16670.3 AT4G16670.1 |
AT4G16670
|
auxin canalization protein (DUF828) |
| arTal_v1_Chr3_+_16466144_16466144 | 1.53 |
AT3G45010.1
|
scpl48
|
serine carboxypeptidase-like 48 |
| arTal_v1_Chr3_-_19165322_19165322 | 1.52 |
AT3G51660.1
|
AT3G51660
|
Tautomerase/MIF superfamily protein |
| arTal_v1_Chr1_-_4892332_4892332 | 1.52 |
AT1G14330.1
|
AT1G14330
|
Galactose oxidase/kelch repeat superfamily protein |
| arTal_v1_Chr4_+_1306313_1306313 | 1.52 |
AT4G02940.1
|
AT4G02940
|
oxidoreductase, 2OG-Fe(II) oxygenase family protein |
| arTal_v1_Chr2_-_9266393_9266393 | 1.52 |
AT2G21660.2
|
GRP7
|
cold, circadian rhythm, and rna binding 2 |
| arTal_v1_Chr4_+_5244865_5244865 | 1.50 |
AT4G08300.1
|
UMAMIT17
|
nodulin MtN21 /EamA-like transporter family protein |
| arTal_v1_Chr2_-_9266557_9266557 | 1.50 |
AT2G21660.1
|
GRP7
|
cold, circadian rhythm, and rna binding 2 |
| arTal_v1_Chr1_+_22893101_22893101 | 1.50 |
AT1G61930.1
|
AT1G61930
|
senescence regulator (Protein of unknown function, DUF584) |
| arTal_v1_Chr5_+_25322975_25322975 | 1.49 |
AT5G63130.2
AT5G63130.1 |
AT5G63130
|
Octicosapeptide/Phox/Bem1p family protein |
| arTal_v1_Chr5_-_315405_315405 | 1.48 |
AT5G01820.1
|
SR1
|
serine/threonine protein kinase 1 |
| arTal_v1_Chr1_-_10014256_10014256 | 1.46 |
AT1G28480.1
|
GRX480
|
Thioredoxin superfamily protein |
| arTal_v1_Chr4_-_17041131_17041131 | 1.46 |
AT4G36010.2
|
AT4G36010
|
Pathogenesis-related thaumatin superfamily protein |
| arTal_v1_Chr4_-_17041326_17041326 | 1.45 |
AT4G36010.1
|
AT4G36010
|
Pathogenesis-related thaumatin superfamily protein |
| arTal_v1_Chr2_-_16068615_16068615 | 1.44 |
AT2G38340.1
|
DREB19
|
Integrase-type DNA-binding superfamily protein |
| arTal_v1_Chr5_-_122507_122525 | 1.43 |
AT5G01300.2
AT5G01300.1 AT5G01300.3 |
AT5G01300
|
PEBP (phosphatidylethanolamine-binding protein) family protein |
| arTal_v1_Chr4_+_578028_578028 | 1.42 |
AT4G01410.1
|
AT4G01410
|
Late embryogenesis abundant (LEA) hydroxyproline-rich glycoprotein family |
| arTal_v1_Chr4_-_10567838_10567838 | 1.41 |
AT4G19370.1
|
AT4G19370
|
chitin synthase, putative (DUF1218) |
| arTal_v1_Chr1_-_1161982_1161982 | 1.40 |
AT1G04330.1
|
AT1G04330
|
hypothetical protein |
| arTal_v1_Chr5_-_25813620_25813648 | 1.39 |
AT5G64570.3
AT5G64570.2 AT5G64570.1 |
XYL4
|
beta-D-xylosidase 4 |
| arTal_v1_Chr3_-_1462917_1462963 | 1.33 |
AT3G05165.4
AT3G05165.1 AT3G05165.6 AT3G05165.3 AT3G05165.5 AT3G05165.2 |
AT3G05165
|
Major facilitator superfamily protein |
| arTal_v1_Chr3_-_17475274_17475274 | 1.33 |
AT3G47420.3
AT3G47420.1 AT3G47420.2 |
G3Pp1
|
putative glycerol-3-phosphate transporter 1 |
| arTal_v1_Chr3_-_20895634_20895634 | 1.33 |
AT3G56350.1
|
AT3G56350
|
Iron/manganese superoxide dismutase family protein |
| arTal_v1_Chr5_+_9553300_9553300 | 1.33 |
AT5G27150.1
|
NHX1
|
Na+/H+ exchanger 1 |
| arTal_v1_Chr3_+_19284339_19284339 | 1.31 |
AT3G51970.1
|
ASAT1
|
acyl-CoA sterol acyl transferase 1 |
| arTal_v1_Chr1_+_17874436_17874436 | 1.31 |
AT1G48370.1
|
YSL8
|
YELLOW STRIPE like 8 |
| arTal_v1_Chr1_+_22198266_22198266 | 1.31 |
AT1G60190.1
|
PUB19
|
ARM repeat superfamily protein |
| arTal_v1_Chr2_-_13549571_13549571 | 1.30 |
AT2G31865.3
AT2G31865.1 AT2G31865.2 |
PARG2
|
poly(ADP-ribose) glycohydrolase 2 |
| arTal_v1_Chr3_+_17885465_17885524 | 1.29 |
AT3G48300.2
AT3G48300.1 |
CYP71A23
|
cytochrome P450, family 71, subfamily A, polypeptide 23 |
| arTal_v1_Chr1_-_23818481_23818481 | 1.29 |
AT1G64170.1
|
CHX16
|
cation/H+ exchanger 16 |
| arTal_v1_Chr5_-_4573137_4573243 | 1.28 |
AT5G14180.4
AT5G14180.2 |
MPL1
|
Myzus persicae-induced lipase 1 |
| arTal_v1_Chr2_+_13658888_13659004 | 1.28 |
AT2G32150.1
AT2G32150.2 AT2G32150.3 |
AT2G32150
|
Haloacid dehalogenase-like hydrolase (HAD) superfamily protein |
| arTal_v1_Chr5_-_20139529_20139609 | 1.26 |
AT5G49620.2
AT5G49620.1 |
MYB78
|
myb domain protein 78 |
| arTal_v1_Chr1_+_28163344_28163344 | 1.26 |
AT1G75000.1
|
AT1G75000
|
GNS1/SUR4 membrane protein family |
| arTal_v1_Chr1_-_5957511_5957511 | 1.25 |
AT1G17380.1
AT1G17380.2 |
JAZ5
|
jasmonate-zim-domain protein 5 |
| arTal_v1_Chr5_+_20192159_20192159 | 1.25 |
AT5G49700.1
|
AT5G49700
|
Putative AT-hook DNA-binding family protein |
| arTal_v1_Chr5_-_25661007_25661007 | 1.24 |
AT5G64120.1
|
AT5G64120
|
Peroxidase superfamily protein |
| arTal_v1_Chr1_-_10647650_10647650 | 1.23 |
AT1G30250.1
|
AT1G30250
|
hypothetical protein |
| arTal_v1_Chr2_-_17263017_17263017 | 1.22 |
AT2G41410.1
|
AT2G41410
|
Calcium-binding EF-hand family protein |
| arTal_v1_Chr5_+_5087219_5087219 | 1.22 |
AT5G15640.1
AT5G15640.2 |
AT5G15640
|
Mitochondrial substrate carrier family protein |
| arTal_v1_Chr1_-_28587927_28587931 | 1.22 |
AT1G76180.1
AT1G76180.2 |
ERD14
|
Dehydrin family protein |
| arTal_v1_Chr3_+_241739_241758 | 1.22 |
AT3G01650.1
AT3G01650.2 |
RGLG1
|
RING domain ligase1 |
| arTal_v1_Chr2_-_13386392_13386392 | 1.21 |
AT2G31390.1
|
AT2G31390
|
pfkB-like carbohydrate kinase family protein |
| arTal_v1_Chr3_+_3239180_3239180 | 1.20 |
AT3G10420.1
|
SPD1
|
P-loop containing nucleoside triphosphate hydrolases superfamily protein |
| arTal_v1_Chr2_-_10835483_10835483 | 1.20 |
AT2G25460.1
|
AT2G25460
|
EEIG1/EHBP1 protein amino-terminal domain protein |
| arTal_v1_Chr3_+_3238996_3238996 | 1.20 |
AT3G10420.2
|
SPD1
|
P-loop containing nucleoside triphosphate hydrolases superfamily protein |
| arTal_v1_Chr2_-_9991526_9991526 | 1.19 |
AT2G23450.1
|
AT2G23450
|
Protein kinase superfamily protein |
| arTal_v1_Chr2_-_9992010_9992010 | 1.18 |
AT2G23450.2
|
AT2G23450
|
Protein kinase superfamily protein |
| arTal_v1_Chr1_-_3592580_3592580 | 1.18 |
AT1G10770.1
|
AT1G10770
|
Plant invertase/pectin methylesterase inhibitor superfamily protein |
| arTal_v1_Chr5_-_14256284_14256284 | 1.16 |
AT5G36220.2
AT5G36220.1 |
CYP81D1
|
cytochrome p450 81d1 |
| arTal_v1_Chr5_+_413952_413952 | 1.16 |
AT5G02100.3
|
UNE18
|
Oxysterol-binding family protein |
| arTal_v1_Chr4_+_10142255_10142255 | 1.16 |
AT4G18350.1
|
NCED2
|
nine-cis-epoxycarotenoid dioxygenase 2 |
| arTal_v1_Chr2_+_15592552_15592552 | 1.16 |
AT2G37110.1
|
AT2G37110
|
PLAC8 family protein |
| arTal_v1_Chr5_-_23925957_23925957 | 1.16 |
AT5G59310.1
|
LTP4
|
lipid transfer protein 4 |
| arTal_v1_Chr1_-_5957255_5957255 | 1.15 |
AT1G17380.3
|
JAZ5
|
jasmonate-zim-domain protein 5 |
| arTal_v1_Chr5_-_9944942_9944942 | 1.15 |
AT5G27920.1
|
AT5G27920
|
F-box family protein |
| arTal_v1_Chr2_-_10835660_10835660 | 1.14 |
AT2G25460.2
|
AT2G25460
|
EEIG1/EHBP1 protein amino-terminal domain protein |
| arTal_v1_Chr5_+_413479_413479 | 1.14 |
AT5G02100.2
|
UNE18
|
Oxysterol-binding family protein |
| arTal_v1_Chr3_-_4959704_4959704 | 1.13 |
AT3G14770.1
|
SWEET2
|
Nodulin MtN3 family protein |
| arTal_v1_Chr5_-_18747406_18747406 | 1.13 |
AT5G46240.1
|
KAT1
|
1 |
| arTal_v1_Chr2_+_18961283_18961283 | 1.12 |
AT2G46150.1
|
AT2G46150
|
Late embryogenesis abundant (LEA) hydroxyproline-rich glycoprotein family |
| arTal_v1_Chr5_-_25764420_25764420 | 1.12 |
AT5G64430.1
|
AT5G64430
|
Octicosapeptide/Phox/Bem1p family protein |
| arTal_v1_Chr2_+_18834011_18834149 | 1.12 |
AT2G45720.3
AT2G45720.2 AT2G45720.4 AT2G45720.5 |
AT2G45720
|
ARM repeat superfamily protein |
| arTal_v1_Chr5_+_413281_413281 | 1.11 |
AT5G02100.1
|
UNE18
|
Oxysterol-binding family protein |
| arTal_v1_Chr1_+_17875062_17875062 | 1.11 |
AT1G48370.2
|
YSL8
|
YELLOW STRIPE like 8 |
| arTal_v1_Chr1_-_1547798_1547849 | 1.11 |
AT1G05300.2
AT1G05300.1 |
ZIP5
|
zinc transporter 5 precursor |
| arTal_v1_Chr3_-_4591483_4591541 | 1.11 |
AT3G13910.2
AT3G13910.1 |
AT3G13910
|
hypothetical protein (DUF3511) |
| arTal_v1_Chr2_+_12814271_12814271 | 1.10 |
AT2G30020.1
|
AT2G30020
|
Protein phosphatase 2C family protein |
| arTal_v1_Chr2_+_19000180_19000191 | 1.09 |
AT2G46270.2
AT2G46270.1 AT2G46270.4 AT2G46270.3 |
GBF3
|
G-box binding factor 3 |
| arTal_v1_Chr5_-_4574541_4574679 | 1.08 |
AT5G14180.3
AT5G14180.5 AT5G14180.1 |
MPL1
|
Myzus persicae-induced lipase 1 |
| arTal_v1_Chr1_-_23669125_23669145 | 1.08 |
AT1G63800.1
AT1G63800.2 |
UBC5
|
ubiquitin-conjugating enzyme 5 |
| arTal_v1_Chr1_-_8957949_8957978 | 1.08 |
AT1G25500.1
AT1G25500.3 |
AT1G25500
|
Plasma-membrane choline transporter family protein |
| arTal_v1_Chr1_+_25763459_25763459 | 1.07 |
AT1G68610.1
|
PCR11
|
PLANT CADMIUM RESISTANCE 11 |
| arTal_v1_Chr1_-_25541740_25541823 | 1.06 |
AT1G68140.2
AT1G68140.3 AT1G68140.4 AT1G68140.1 |
AT1G68140
|
zinc finger/BTB domain protein, putative (DUF1644) |
| arTal_v1_Chr5_-_5726912_5726912 | 1.06 |
AT5G17380.1
|
AT5G17380
|
Thiamine pyrophosphate dependent pyruvate decarboxylase family protein |
| arTal_v1_Chr3_+_7644265_7644475 | 1.06 |
AT3G21700.3
AT3G21700.1 AT3G21700.2 |
SGP2
|
Ras-related small GTP-binding family protein |
| arTal_v1_Chr4_-_11201106_11201106 | 1.06 |
AT4G20930.2
AT4G20930.1 |
AT4G20930
|
6-phosphogluconate dehydrogenase family protein |
| arTal_v1_Chr5_+_3744980_3744980 | 1.06 |
AT5G11650.2
|
AT5G11650
|
alpha/beta-Hydrolases superfamily protein |
| arTal_v1_Chr5_+_3744698_3744698 | 1.05 |
AT5G11650.1
|
AT5G11650
|
alpha/beta-Hydrolases superfamily protein |
| arTal_v1_Chr1_-_2152541_2152541 | 1.04 |
AT1G07000.1
|
EXO70B2
|
exocyst subunit exo70 family protein B2 |
| arTal_v1_Chr2_+_15158561_15158561 | 1.01 |
AT2G36090.1
|
AT2G36090
|
F-box family protein |
| arTal_v1_Chr4_+_18149533_18149533 | 1.01 |
AT4G38930.3
AT4G38930.4 AT4G38930.2 AT4G38930.1 |
AT4G38930
|
Ubiquitin fusion degradation UFD1 family protein |
| arTal_v1_Chr1_+_26830603_26830603 | 1.00 |
AT1G71170.1
|
AT1G71170
|
6-phosphogluconate dehydrogenase family protein |
| arTal_v1_Chr1_-_3803695_3803695 | 1.00 |
AT1G11310.3
|
MLO2
|
Seven transmembrane MLO family protein |
| arTal_v1_Chr1_-_3804185_3804233 | 1.00 |
AT1G11310.2
AT1G11310.1 |
MLO2
|
Seven transmembrane MLO family protein |
| arTal_v1_Chr4_+_17955110_17955110 | 0.99 |
AT4G38340.2
|
AT4G38340
|
Plant regulator RWP-RK family protein |
| arTal_v1_Chr1_-_8537780_8537780 | 0.98 |
AT1G24140.1
|
AT1G24140
|
Matrixin family protein |
| arTal_v1_Chr1_+_954290_954290 | 0.98 |
AT1G03790.1
|
SOM
|
Zinc finger C-x8-C-x5-C-x3-H type family protein |
| arTal_v1_Chr1_-_27640643_27640643 | 0.97 |
AT1G73500.1
|
MKK9
|
MAP kinase kinase 9 |
| arTal_v1_Chr3_+_19996177_19996177 | 0.97 |
AT3G54000.1
AT3G54000.2 |
AT3G54000
|
TIP41-like protein |
| arTal_v1_Chr1_+_8962087_8962087 | 0.96 |
AT1G25520.1
|
AT1G25520
|
Uncharacterized protein family (UPF0016) |
| arTal_v1_Chr4_+_17954710_17954710 | 0.95 |
AT4G38340.1
|
AT4G38340
|
Plant regulator RWP-RK family protein |
| arTal_v1_Chr1_+_267993_267993 | 0.95 |
AT1G01720.1
|
ATAF1
|
NAC (No Apical Meristem) domain transcriptional regulator superfamily protein |
| arTal_v1_Chr1_+_18400003_18400066 | 0.95 |
AT1G49720.1
AT1G49720.2 AT1G49720.3 |
ABF1
|
abscisic acid responsive element-binding factor 1 |
| arTal_v1_Chr1_+_2964015_2964015 | 0.94 |
AT1G09176.1
|
AT1G09176
|
transmembrane protein |
| arTal_v1_Chr3_-_23299126_23299126 | 0.94 |
AT3G63052.1
|
AT3G63052
|
hypothetical protein |
| arTal_v1_Chr2_-_9564850_9564850 | 0.93 |
AT2G22500.1
|
UCP5
|
uncoupling protein 5 |
| arTal_v1_Chr4_-_8854706_8854706 | 0.93 |
AT4G15490.1
|
UGT84A3
|
UDP-Glycosyltransferase superfamily protein |
| arTal_v1_Chr4_-_9994433_9994524 | 0.93 |
AT4G18010.2
AT4G18010.1 |
IP5PII
|
myo-inositol polyphosphate 5-phosphatase 2 |
| arTal_v1_Chr2_-_14414788_14414788 | 0.92 |
AT2G34140.1
|
AT2G34140
|
Dof-type zinc finger DNA-binding family protein |
| arTal_v1_Chr5_-_21291928_21291928 | 0.92 |
AT5G52450.1
|
AT5G52450
|
MATE efflux family protein |
| arTal_v1_Chr2_-_11777529_11777553 | 0.92 |
AT2G27580.2
AT2G27580.1 |
AT2G27580
|
A20/AN1-like zinc finger family protein |
| arTal_v1_Chr5_-_2985509_2985509 | 0.91 |
AT5G09620.2
|
AT5G09620
|
Octicosapeptide/Phox/Bem1p family protein |
| arTal_v1_Chr5_-_2985760_2985760 | 0.91 |
AT5G09620.1
|
AT5G09620
|
Octicosapeptide/Phox/Bem1p family protein |
| arTal_v1_Chr2_-_11685342_11685342 | 0.89 |
AT2G27310.1
|
AT2G27310
|
F-box family protein |
| arTal_v1_Chr1_-_29239484_29239484 | 0.89 |
AT1G77760.1
|
NIA1
|
nitrate reductase 1 |
| arTal_v1_Chr5_-_4359692_4359692 | 0.89 |
AT5G13550.1
|
SULTR4%3B1
|
sulfate transporter 4.1 |
| arTal_v1_Chr2_+_18833086_18833086 | 0.89 |
AT2G45720.1
|
AT2G45720
|
ARM repeat superfamily protein |
| arTal_v1_Chr3_+_1035238_1035238 | 0.88 |
AT3G04000.1
|
AT3G04000
|
NAD(P)-binding Rossmann-fold superfamily protein |
| arTal_v1_Chr5_-_5351095_5351095 | 0.88 |
AT5G16340.1
|
AT5G16340
|
AMP-dependent synthetase and ligase family protein |
| arTal_v1_Chr4_+_9759203_9759203 | 0.88 |
AT4G17500.1
|
ERF-1
|
ethylene responsive element binding factor 1 |
| arTal_v1_Chr1_+_8098392_8098392 | 0.87 |
AT1G22882.1
|
AT1G22882
|
Galactose-binding protein |
| arTal_v1_Chr2_+_9006610_9006743 | 0.87 |
AT2G20960.3
AT2G20960.2 AT2G20960.1 AT2G20960.4 |
pEARLI4
|
phospholipase-like protein (PEARLI 4) family protein |
| arTal_v1_Chr5_-_4304315_4304315 | 0.86 |
AT5G13420.1
|
TRA2
|
Aldolase-type TIM barrel family protein |
| arTal_v1_Chr5_+_1243684_1243684 | 0.85 |
AT5G04410.1
|
NAC2
|
NAC domain containing protein 2 |
| arTal_v1_Chr1_-_9564031_9564031 | 0.85 |
AT1G27530.1
|
AT1G27530
|
ubiquitin-fold modifier-conjugating enzyme |
| arTal_v1_Chr1_+_24028830_24028830 | 0.85 |
AT1G64660.1
|
MGL
|
methionine gamma-lyase |
| arTal_v1_Chr4_-_11767422_11767422 | 0.85 |
AT4G22240.1
|
AT4G22240
|
Plastid-lipid associated protein PAP / fibrillin family protein |
| arTal_v1_Chr1_-_8958132_8958132 | 0.85 |
AT1G25500.2
|
AT1G25500
|
Plasma-membrane choline transporter family protein |
| arTal_v1_Chr1_-_7248423_7248494 | 0.84 |
AT1G20840.1
AT1G20840.2 |
TMT1
|
tonoplast monosaccharide transporter1 |
| arTal_v1_Chr2_-_11750488_11750488 | 0.84 |
AT2G27490.1
AT2G27490.2 AT2G27490.3 |
ATCOAE
|
dephospho-CoA kinase family |
| arTal_v1_Chr5_-_924728_924728 | 0.84 |
AT5G03630.1
|
ATMDAR2
|
Pyridine nucleotide-disulfide oxidoreductase family protein |
| arTal_v1_Chr3_-_4907954_4908067 | 0.83 |
AT3G14590.4
AT3G14590.3 AT3G14590.1 AT3G14590.2 |
NTMC2T6.2
|
Calcium-dependent lipid-binding (CaLB domain) family protein |
| arTal_v1_Chr1_+_2187776_2187776 | 0.82 |
AT1G07130.1
|
STN1
|
Nucleic acid-binding, OB-fold-like protein |
| arTal_v1_Chr2_+_315648_315712 | 0.81 |
AT2G01710.2
AT2G01710.1 |
AT2G01710
|
Chaperone DnaJ-domain superfamily protein |
| arTal_v1_Chr1_+_24748105_24748105 | 0.81 |
AT1G66350.1
|
RGL1
|
RGA-like 1 |
| arTal_v1_Chr3_-_12451556_12451556 | 0.81 |
AT3G30775.2
AT3G30775.1 |
ERD5
|
Methylenetetrahydrofolate reductase family protein |
| arTal_v1_Chr2_-_11749153_11749153 | 0.80 |
AT2G27490.4
|
ATCOAE
|
dephospho-CoA kinase family |
| arTal_v1_Chr1_+_345516_345516 | 0.80 |
AT1G02000.1
|
GAE2
|
UDP-D-glucuronate 4-epimerase 2 |
| arTal_v1_Chr1_+_7483781_7483782 | 0.80 |
AT1G21370.2
AT1G21370.1 |
AT1G21370
|
transmembrane protein |
| arTal_v1_Chr2_+_16976636_16976636 | 0.80 |
AT2G40700.1
|
AT2G40700
|
P-loop containing nucleoside triphosphate hydrolases superfamily protein |
| arTal_v1_Chr5_+_21307016_21307016 | 0.80 |
AT5G52510.1
|
SCL8
|
SCARECROW-like 8 |
| arTal_v1_Chr2_+_3618058_3618058 | 0.80 |
AT2G08986.1
|
AT2G08986
|
hypothetical protein |
| arTal_v1_Chr3_+_19996533_19996533 | 0.80 |
AT3G54000.3
|
AT3G54000
|
TIP41-like protein |
| arTal_v1_Chr4_+_16997091_16997091 | 0.79 |
AT4G35890.2
AT4G35890.1 |
LARP1c
|
winged-helix DNA-binding transcription factor family protein |
| arTal_v1_Chr3_+_3595694_3595694 | 0.78 |
AT3G11430.1
|
GPAT5
|
glycerol-3-phosphate acyltransferase 5 |
| arTal_v1_Chr3_-_2360549_2360549 | 0.78 |
AT3G07370.1
|
CHIP
|
carboxyl terminus of HSC70-interacting protein |
| arTal_v1_Chr2_-_9767_9767 | 0.78 |
AT2G01023.1
|
AT2G01023
|
hypothetical protein |
| arTal_v1_Chr4_-_11003010_11003010 | 0.78 |
AT4G20370.1
|
TSF
|
PEBP (phosphatidylethanolamine-binding protein) family protein |
| arTal_v1_Chr1_-_342040_342040 | 0.78 |
AT1G01980.1
|
AT1G01980
|
FAD-binding Berberine family protein |
| arTal_v1_Chr2_+_1025_1025 | 0.77 |
AT2G01008.1
|
AT2G01008
|
maternal effect embryo arrest protein |
| arTal_v1_Chr2_+_18061716_18061886 | 0.75 |
AT2G43500.1
AT2G43500.3 AT2G43500.4 AT2G43500.5 AT2G43500.6 AT2G43500.7 AT2G43500.2 AT2G43500.8 |
AT2G43500
|
Plant regulator RWP-RK family protein |
| arTal_v1_Chr1_+_16926297_16926297 | 0.75 |
AT1G44820.1
|
AT1G44820
|
Peptidase M20/M25/M40 family protein |
| arTal_v1_Chr5_-_6609799_6609799 | 0.75 |
AT5G19580.1
|
AT5G19580
|
glyoxal oxidase-related protein |
| arTal_v1_Chr3_+_3905423_3905686 | 0.75 |
AT3G12250.1
AT3G12250.2 AT3G12250.3 AT3G12250.5 AT3G12250.7 AT3G12250.6 |
TGA6
|
TGACG motif-binding factor 6 |
| arTal_v1_Chr1_-_2374439_2374439 | 0.74 |
AT1G07670.2
|
ECA4
|
endomembrane-type CA-ATPase 4 |
| arTal_v1_Chr3_+_10848241_10848241 | 0.74 |
AT3G28850.1
|
AT3G28850
|
Glutaredoxin family protein |
| arTal_v1_Chr1_-_2374607_2374607 | 0.74 |
AT1G07670.1
|
ECA4
|
endomembrane-type CA-ATPase 4 |
| arTal_v1_Chr2_-_18801383_18801471 | 0.74 |
AT2G45640.1
AT2G45640.2 |
SAP18
|
SIN3 associated polypeptide P18 |
| arTal_v1_Chr3_+_19013389_19013389 | 0.74 |
AT3G51180.1
|
AT3G51180
|
Zinc finger C-x8-C-x5-C-x3-H type family protein |
| arTal_v1_Chr1_-_27081641_27081641 | 0.74 |
AT1G71950.1
|
AT1G71950
|
Proteinase inhibitor, propeptide |
| arTal_v1_Chr1_+_4423540_4423540 | 0.74 |
AT1G12970.1
|
PIRL3
|
plant intracellular ras group-related LRR 3 |
| arTal_v1_Chr4_-_10731808_10731808 | 0.73 |
AT4G19720.1
|
AT4G19720
|
Glycosyl hydrolase family protein with chitinase insertion domain-containing protein |
| arTal_v1_Chr3_+_18210453_18210453 | 0.73 |
AT3G49130.1
|
AT3G49130
|
SWAP (Suppressor-of-White-APricot)/surp RNA-binding domain-containing protein |
| arTal_v1_Chr2_+_7564240_7564276 | 0.72 |
AT2G17420.1
AT2G17420.2 |
NTRA
|
NADPH-dependent thioredoxin reductase A |
| arTal_v1_Chr3_-_23301865_23301865 | 0.72 |
AT3G63060.1
|
EDL3
|
EID1-like 3 |
| arTal_v1_Chr5_+_17522486_17522486 | 0.70 |
AT5G43620.1
|
AT5G43620
|
Pre-mRNA cleavage complex II |
| arTal_v1_Chr5_-_26933286_26933352 | 0.70 |
AT5G67480.1
AT5G67480.3 |
BT4
|
BTB and TAZ domain protein 4 |
| arTal_v1_Chr1_+_6008437_6008437 | 0.70 |
AT1G17490.1
|
AT1G17490
|
epidermal patterning factor-like protein |
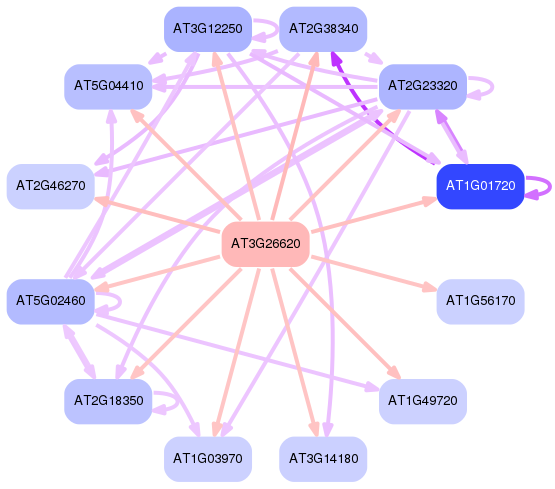
Network of associatons between targets according to the STRING database.

First level regulatory network of AT3G26620
Gene Ontology Analysis
Gene overrepresentation in biological process category:
| Log-likelihood per target | Total log-likelihood | Term | Description |
|---|---|---|---|
| 0.6 | 2.6 | GO:1902457 | negative regulation of stomatal opening(GO:1902457) |
| 0.4 | 1.5 | GO:0048480 | stigma development(GO:0048480) |
| 0.3 | 1.2 | GO:0010351 | lithium ion transport(GO:0010351) |
| 0.3 | 1.8 | GO:1900367 | positive regulation of defense response to insect(GO:1900367) |
| 0.3 | 1.4 | GO:0006809 | nitric oxide biosynthetic process(GO:0006809) |
| 0.3 | 0.9 | GO:0071569 | protein ufmylation(GO:0071569) |
| 0.3 | 0.8 | GO:0034247 | snoRNA splicing(GO:0034247) |
| 0.2 | 0.7 | GO:0006369 | termination of RNA polymerase II transcription(GO:0006369) |
| 0.2 | 2.2 | GO:0016584 | nucleosome positioning(GO:0016584) negative regulation of chromatin silencing(GO:0031936) |
| 0.2 | 0.9 | GO:0019343 | cysteine biosynthetic process via cystathionine(GO:0019343) |
| 0.2 | 1.0 | GO:0048464 | sepal development(GO:0048442) flower calyx development(GO:0048464) |
| 0.2 | 0.8 | GO:0015744 | succinate transport(GO:0015744) |
| 0.2 | 1.2 | GO:0080148 | negative regulation of response to water deprivation(GO:0080148) |
| 0.2 | 0.5 | GO:0019406 | hexitol metabolic process(GO:0006059) hexitol biosynthetic process(GO:0019406) mannitol biosynthetic process(GO:0019593) mannitol metabolic process(GO:0019594) |
| 0.2 | 0.9 | GO:0006106 | fumarate metabolic process(GO:0006106) |
| 0.2 | 0.5 | GO:0002188 | translation reinitiation(GO:0002188) |
| 0.2 | 0.6 | GO:0045332 | phospholipid translocation(GO:0045332) |
| 0.1 | 0.9 | GO:0071733 | establishment of mitotic sister chromatid cohesion(GO:0034087) establishment of protein localization to chromosome(GO:0070199) rDNA condensation(GO:0070550) establishment of protein localization to chromatin(GO:0071169) transcriptional activation by promoter-enhancer looping(GO:0071733) gene looping(GO:0090202) dsDNA loop formation(GO:0090579) |
| 0.1 | 0.9 | GO:0032957 | inositol trisphosphate metabolic process(GO:0032957) |
| 0.1 | 6.1 | GO:2000022 | regulation of jasmonic acid mediated signaling pathway(GO:2000022) |
| 0.1 | 0.9 | GO:0019632 | shikimate metabolic process(GO:0019632) |
| 0.1 | 1.1 | GO:0071249 | cellular response to nitrate(GO:0071249) |
| 0.1 | 0.5 | GO:0006655 | phosphatidylglycerol biosynthetic process(GO:0006655) |
| 0.1 | 0.3 | GO:0000730 | DNA recombinase assembly(GO:0000730) |
| 0.1 | 2.2 | GO:0002213 | defense response to insect(GO:0002213) |
| 0.1 | 0.4 | GO:0015853 | adenine transport(GO:0015853) guanine transport(GO:0015854) |
| 0.1 | 0.7 | GO:0048363 | mucilage pectin metabolic process(GO:0048363) |
| 0.1 | 1.0 | GO:1902290 | positive regulation of defense response to oomycetes(GO:1902290) |
| 0.1 | 0.3 | GO:0097033 | respiratory chain complex III assembly(GO:0017062) mitochondrial respiratory chain complex III assembly(GO:0034551) mitochondrial respiratory chain complex III biogenesis(GO:0097033) |
| 0.1 | 0.8 | GO:0016233 | telomere capping(GO:0016233) |
| 0.1 | 1.2 | GO:0009410 | response to xenobiotic stimulus(GO:0009410) |
| 0.1 | 0.7 | GO:0007187 | G-protein coupled receptor signaling pathway, coupled to cyclic nucleotide second messenger(GO:0007187) adenylate cyclase-modulating G-protein coupled receptor signaling pathway(GO:0007188) |
| 0.1 | 1.5 | GO:1902074 | response to salt(GO:1902074) |
| 0.1 | 0.5 | GO:0042149 | cellular response to glucose starvation(GO:0042149) |
| 0.1 | 0.3 | GO:0010246 | rhamnogalacturonan I biosynthetic process(GO:0010246) |
| 0.1 | 1.8 | GO:0071218 | cellular response to misfolded protein(GO:0071218) |
| 0.1 | 0.7 | GO:0035067 | histone H3-K9 demethylation(GO:0033169) negative regulation of histone acetylation(GO:0035067) negative regulation of protein acetylation(GO:1901984) negative regulation of peptidyl-lysine acetylation(GO:2000757) |
| 0.1 | 1.6 | GO:0015937 | coenzyme A biosynthetic process(GO:0015937) |
| 0.1 | 0.3 | GO:0080171 | lytic vacuole organization(GO:0080171) |
| 0.1 | 1.3 | GO:0055062 | phosphate ion homeostasis(GO:0055062) trivalent inorganic anion homeostasis(GO:0072506) |
| 0.1 | 0.3 | GO:0051972 | regulation of telomerase activity(GO:0051972) positive regulation of telomerase activity(GO:0051973) positive regulation of DNA biosynthetic process(GO:2000573) |
| 0.1 | 0.3 | GO:2000011 | regulation of adaxial/abaxial pattern formation(GO:2000011) |
| 0.1 | 1.0 | GO:0052317 | camalexin biosynthetic process(GO:0010120) camalexin metabolic process(GO:0052317) |
| 0.1 | 0.6 | GO:0006122 | mitochondrial electron transport, ubiquinol to cytochrome c(GO:0006122) |
| 0.1 | 0.5 | GO:0006552 | leucine catabolic process(GO:0006552) |
| 0.1 | 0.4 | GO:0019048 | modulation by virus of host morphology or physiology(GO:0019048) |
| 0.1 | 1.5 | GO:0042343 | indole glucosinolate metabolic process(GO:0042343) |
| 0.1 | 0.3 | GO:1902448 | regulation of shade avoidance(GO:1902446) positive regulation of shade avoidance(GO:1902448) |
| 0.1 | 0.3 | GO:0006361 | transcription initiation from RNA polymerase I promoter(GO:0006361) |
| 0.1 | 0.3 | GO:0034635 | glutathione transport(GO:0034635) tripeptide transport(GO:0042939) |
| 0.1 | 0.5 | GO:0048578 | positive regulation of long-day photoperiodism, flowering(GO:0048578) |
| 0.1 | 2.4 | GO:0007166 | cell surface receptor signaling pathway(GO:0007166) |
| 0.1 | 0.5 | GO:0080190 | lateral growth(GO:0080190) |
| 0.1 | 2.6 | GO:0016126 | sterol biosynthetic process(GO:0016126) |
| 0.1 | 0.9 | GO:0048317 | seed morphogenesis(GO:0048317) |
| 0.1 | 0.6 | GO:0046247 | carotene catabolic process(GO:0016121) terpene catabolic process(GO:0046247) |
| 0.1 | 0.9 | GO:0006574 | valine catabolic process(GO:0006574) |
| 0.1 | 0.5 | GO:0009435 | NAD biosynthetic process(GO:0009435) |
| 0.1 | 0.1 | GO:0008272 | sulfate transport(GO:0008272) |
| 0.1 | 0.8 | GO:0006560 | proline metabolic process(GO:0006560) |
| 0.1 | 0.7 | GO:0006513 | protein monoubiquitination(GO:0006513) |
| 0.1 | 0.5 | GO:0009819 | drought recovery(GO:0009819) |
| 0.1 | 0.3 | GO:0015846 | polyamine transport(GO:0015846) |
| 0.1 | 1.1 | GO:0016024 | CDP-diacylglycerol biosynthetic process(GO:0016024) CDP-diacylglycerol metabolic process(GO:0046341) |
| 0.1 | 0.5 | GO:1901002 | positive regulation of response to salt stress(GO:1901002) |
| 0.1 | 1.3 | GO:0006282 | regulation of DNA repair(GO:0006282) |
| 0.1 | 1.5 | GO:0010227 | floral organ abscission(GO:0010227) |
| 0.1 | 1.3 | GO:0090630 | activation of GTPase activity(GO:0090630) |
| 0.1 | 0.8 | GO:0010332 | response to gamma radiation(GO:0010332) |
| 0.1 | 0.2 | GO:0009945 | radial axis specification(GO:0009945) |
| 0.1 | 3.2 | GO:0009566 | fertilization(GO:0009566) double fertilization forming a zygote and endosperm(GO:0009567) |
| 0.0 | 0.1 | GO:0001736 | establishment of planar polarity(GO:0001736) morphogenesis of a polarized epithelium(GO:0001738) morphogenesis of an epithelium(GO:0002009) tissue morphogenesis(GO:0048729) |
| 0.0 | 0.5 | GO:0051131 | chaperone-mediated protein complex assembly(GO:0051131) |
| 0.0 | 0.9 | GO:0070816 | phosphorylation of RNA polymerase II C-terminal domain(GO:0070816) |
| 0.0 | 2.4 | GO:0010029 | regulation of seed germination(GO:0010029) |
| 0.0 | 0.2 | GO:0010117 | photoprotection(GO:0010117) |
| 0.0 | 0.2 | GO:0048863 | stem cell differentiation(GO:0048863) |
| 0.0 | 0.4 | GO:0006360 | transcription from RNA polymerase I promoter(GO:0006360) |
| 0.0 | 0.4 | GO:0009061 | anaerobic respiration(GO:0009061) |
| 0.0 | 0.4 | GO:0007205 | protein kinase C-activating G-protein coupled receptor signaling pathway(GO:0007205) |
| 0.0 | 0.4 | GO:0005513 | detection of calcium ion(GO:0005513) |
| 0.0 | 0.4 | GO:0006515 | misfolded or incompletely synthesized protein catabolic process(GO:0006515) |
| 0.0 | 2.0 | GO:0006874 | cellular calcium ion homeostasis(GO:0006874) |
| 0.0 | 1.2 | GO:0010187 | negative regulation of seed germination(GO:0010187) |
| 0.0 | 0.9 | GO:0009269 | response to desiccation(GO:0009269) |
| 0.0 | 0.6 | GO:0015743 | malate transport(GO:0015743) |
| 0.0 | 0.3 | GO:0043068 | positive regulation of programmed cell death(GO:0043068) |
| 0.0 | 0.4 | GO:0048572 | short-day photoperiodism(GO:0048572) short-day photoperiodism, flowering(GO:0048575) |
| 0.0 | 0.3 | GO:0016926 | protein desumoylation(GO:0016926) |
| 0.0 | 2.0 | GO:0009817 | defense response to fungus, incompatible interaction(GO:0009817) |
| 0.0 | 0.2 | GO:1900034 | regulation of cellular response to heat(GO:1900034) |
| 0.0 | 1.4 | GO:0010022 | meristem determinacy(GO:0010022) |
| 0.0 | 0.3 | GO:0006446 | regulation of translational initiation(GO:0006446) |
| 0.0 | 1.3 | GO:0048235 | pollen sperm cell differentiation(GO:0048235) |
| 0.0 | 0.1 | GO:0010107 | potassium ion import(GO:0010107) potassium ion import across plasma membrane(GO:1990573) |
| 0.0 | 0.3 | GO:0009864 | induced systemic resistance, jasmonic acid mediated signaling pathway(GO:0009864) |
| 0.0 | 0.5 | GO:1990069 | stomatal opening(GO:1990069) |
| 0.0 | 0.7 | GO:0000373 | Group II intron splicing(GO:0000373) |
| 0.0 | 0.7 | GO:0055046 | microgametogenesis(GO:0055046) |
| 0.0 | 5.0 | GO:0009751 | response to salicylic acid(GO:0009751) |
| 0.0 | 0.4 | GO:0006616 | SRP-dependent cotranslational protein targeting to membrane, translocation(GO:0006616) |
| 0.0 | 7.1 | GO:0071456 | cellular response to hypoxia(GO:0071456) |
| 0.0 | 1.0 | GO:0006334 | nucleosome assembly(GO:0006334) |
| 0.0 | 1.4 | GO:0009626 | plant-type hypersensitive response(GO:0009626) |
| 0.0 | 1.0 | GO:0006012 | galactose metabolic process(GO:0006012) |
| 0.0 | 2.2 | GO:0010431 | seed maturation(GO:0010431) |
| 0.0 | 0.3 | GO:0000478 | endonucleolytic cleavage involved in rRNA processing(GO:0000478) |
| 0.0 | 0.5 | GO:0009880 | embryonic pattern specification(GO:0009880) |
| 0.0 | 0.3 | GO:0045962 | positive regulation of development, heterochronic(GO:0045962) |
| 0.0 | 0.5 | GO:0009396 | folic acid-containing compound biosynthetic process(GO:0009396) |
| 0.0 | 1.4 | GO:0034605 | cellular response to heat(GO:0034605) |
| 0.0 | 0.1 | GO:0001887 | selenium compound metabolic process(GO:0001887) |
| 0.0 | 1.1 | GO:0016125 | sterol metabolic process(GO:0016125) |
| 0.0 | 2.0 | GO:0016579 | protein deubiquitination(GO:0016579) |
| 0.0 | 0.4 | GO:0018230 | peptidyl-L-cysteine S-palmitoylation(GO:0018230) peptidyl-S-diacylglycerol-L-cysteine biosynthetic process from peptidyl-cysteine(GO:0018231) |
| 0.0 | 0.7 | GO:0051781 | positive regulation of cell division(GO:0051781) |
| 0.0 | 0.3 | GO:0046348 | aminoglycan catabolic process(GO:0006026) chitin metabolic process(GO:0006030) chitin catabolic process(GO:0006032) amino sugar catabolic process(GO:0046348) glucosamine-containing compound catabolic process(GO:1901072) |
| 0.0 | 1.5 | GO:0009845 | seed germination(GO:0009845) |
| 0.0 | 0.0 | GO:0010269 | response to selenium ion(GO:0010269) |
| 0.0 | 1.0 | GO:0006885 | regulation of pH(GO:0006885) |
| 0.0 | 0.1 | GO:0046051 | UTP biosynthetic process(GO:0006228) UTP metabolic process(GO:0046051) |
| 0.0 | 0.4 | GO:0009306 | protein secretion(GO:0009306) |
| 0.0 | 0.1 | GO:0000455 | enzyme-directed rRNA pseudouridine synthesis(GO:0000455) |
| 0.0 | 0.5 | GO:0046470 | phosphatidylcholine metabolic process(GO:0046470) |
| 0.0 | 0.1 | GO:0006420 | arginyl-tRNA aminoacylation(GO:0006420) |
| 0.0 | 1.6 | GO:0000209 | protein polyubiquitination(GO:0000209) |
| 0.0 | 2.7 | GO:0042594 | response to starvation(GO:0042594) |
| 0.0 | 0.9 | GO:0016482 | cytosolic transport(GO:0016482) |
| 0.0 | 0.5 | GO:0009960 | endosperm development(GO:0009960) |
| 0.0 | 0.7 | GO:0006887 | exocytosis(GO:0006887) |
| 0.0 | 0.1 | GO:0060321 | acceptance of pollen(GO:0060321) |
| 0.0 | 0.2 | GO:0070828 | heterochromatin organization(GO:0070828) |
| 0.0 | 2.3 | GO:0009860 | pollen tube growth(GO:0009860) |
| 0.0 | 1.5 | GO:0010150 | leaf senescence(GO:0010150) organ senescence(GO:0010260) |
| 0.0 | 0.3 | GO:0097031 | mitochondrial respiratory chain complex I assembly(GO:0032981) mitochondrial respiratory chain complex I biogenesis(GO:0097031) |
| 0.0 | 0.6 | GO:0000038 | very long-chain fatty acid metabolic process(GO:0000038) |
| 0.0 | 0.2 | GO:0000727 | double-strand break repair via break-induced replication(GO:0000727) |
| 0.0 | 0.7 | GO:0006813 | potassium ion transport(GO:0006813) |
| 0.0 | 1.4 | GO:0010200 | response to chitin(GO:0010200) |
| 0.0 | 0.3 | GO:0009638 | phototropism(GO:0009638) |
| 0.0 | 1.8 | GO:0043413 | protein glycosylation(GO:0006486) macromolecule glycosylation(GO:0043413) |
| 0.0 | 1.0 | GO:0043086 | negative regulation of catalytic activity(GO:0043086) |
| 0.0 | 0.3 | GO:0042023 | DNA endoreduplication(GO:0042023) |
| 0.0 | 0.3 | GO:0071577 | zinc II ion transmembrane transport(GO:0071577) |
| 0.0 | 0.9 | GO:0006869 | lipid transport(GO:0006869) |
| 0.0 | 0.2 | GO:0048015 | phosphatidylinositol-mediated signaling(GO:0048015) inositol lipid-mediated signaling(GO:0048017) |
Gene overrepresentation in cellular component category:
| Log-likelihood per target | Total log-likelihood | Term | Description |
|---|---|---|---|
| 0.2 | 3.2 | GO:0000786 | nucleosome(GO:0000786) |
| 0.2 | 1.0 | GO:0034098 | VCP-NPL4-UFD1 AAA ATPase complex(GO:0034098) |
| 0.1 | 2.4 | GO:0031970 | organelle envelope lumen(GO:0031970) |
| 0.1 | 1.0 | GO:0070062 | extracellular organelle(GO:0043230) extracellular exosome(GO:0070062) extracellular vesicle(GO:1903561) |
| 0.1 | 0.7 | GO:0005834 | heterotrimeric G-protein complex(GO:0005834) |
| 0.1 | 0.3 | GO:0005846 | nuclear cap binding complex(GO:0005846) |
| 0.1 | 1.5 | GO:0030427 | site of polarized growth(GO:0030427) |
| 0.1 | 0.3 | GO:0048476 | Holliday junction resolvase complex(GO:0048476) |
| 0.1 | 1.2 | GO:0016602 | CCAAT-binding factor complex(GO:0016602) |
| 0.1 | 0.7 | GO:0005849 | mRNA cleavage factor complex(GO:0005849) |
| 0.1 | 0.5 | GO:0031588 | nucleotide-activated protein kinase complex(GO:0031588) |
| 0.1 | 0.3 | GO:0000408 | EKC/KEOPS complex(GO:0000408) |
| 0.0 | 0.1 | GO:0034702 | ion channel complex(GO:0034702) cation channel complex(GO:0034703) |
| 0.0 | 0.4 | GO:0009840 | chloroplastic endopeptidase Clp complex(GO:0009840) |
| 0.0 | 0.2 | GO:0000811 | GINS complex(GO:0000811) |
| 0.0 | 0.8 | GO:0005769 | early endosome(GO:0005769) |
| 0.0 | 0.5 | GO:0005844 | polysome(GO:0005844) |
| 0.0 | 0.6 | GO:0045275 | mitochondrial respiratory chain complex III(GO:0005750) respiratory chain complex III(GO:0045275) |
| 0.0 | 0.3 | GO:0005851 | eukaryotic translation initiation factor 2B complex(GO:0005851) |
| 0.0 | 0.8 | GO:0000784 | nuclear chromosome, telomeric region(GO:0000784) |
| 0.0 | 2.1 | GO:0090406 | pollen tube(GO:0090406) |
| 0.0 | 0.3 | GO:0005956 | protein kinase CK2 complex(GO:0005956) |
| 0.0 | 0.9 | GO:0045239 | tricarboxylic acid cycle enzyme complex(GO:0045239) |
| 0.0 | 0.4 | GO:0005786 | signal recognition particle, endoplasmic reticulum targeting(GO:0005786) |
| 0.0 | 0.2 | GO:0005682 | U5 snRNP(GO:0005682) |
| 0.0 | 0.9 | GO:0005686 | U2 snRNP(GO:0005686) |
| 0.0 | 0.2 | GO:0001405 | presequence translocase-associated import motor(GO:0001405) |
| 0.0 | 0.6 | GO:0031965 | nuclear membrane(GO:0031965) |
| 0.0 | 0.5 | GO:0030119 | AP-type membrane coat adaptor complex(GO:0030119) |
| 0.0 | 0.5 | GO:0071013 | catalytic step 2 spliceosome(GO:0071013) |
| 0.0 | 0.6 | GO:0000307 | cyclin-dependent protein kinase holoenzyme complex(GO:0000307) |
| 0.0 | 0.4 | GO:0000145 | exocyst(GO:0000145) |
| 0.0 | 0.2 | GO:0072546 | ER membrane protein complex(GO:0072546) |
| 0.0 | 0.5 | GO:0000159 | protein phosphatase type 2A complex(GO:0000159) |
| 0.0 | 0.5 | GO:0035097 | histone methyltransferase complex(GO:0035097) |
| 0.0 | 0.7 | GO:0031903 | peroxisomal membrane(GO:0005778) microbody membrane(GO:0031903) |
| 0.0 | 0.7 | GO:0005684 | U2-type spliceosomal complex(GO:0005684) |
| 0.0 | 0.4 | GO:0010494 | cytoplasmic stress granule(GO:0010494) |
| 0.0 | 0.1 | GO:0030688 | preribosome, small subunit precursor(GO:0030688) |
| 0.0 | 12.9 | GO:0005783 | endoplasmic reticulum(GO:0005783) |
| 0.0 | 0.1 | GO:0000276 | mitochondrial proton-transporting ATP synthase complex, coupling factor F(o)(GO:0000276) |
| 0.0 | 1.5 | GO:0000790 | nuclear chromatin(GO:0000790) |
| 0.0 | 0.7 | GO:0016607 | nuclear speck(GO:0016607) |
| 0.0 | 0.2 | GO:0008023 | transcription elongation factor complex(GO:0008023) |
Gene overrepresentation in molecular function category:
| Log-likelihood per target | Total log-likelihood | Term | Description |
|---|---|---|---|
| 0.9 | 2.6 | GO:0000249 | C-22 sterol desaturase activity(GO:0000249) |
| 0.5 | 1.6 | GO:0004140 | dephospho-CoA kinase activity(GO:0004140) |
| 0.4 | 1.4 | GO:0036218 | dTTP diphosphatase activity(GO:0036218) |
| 0.3 | 2.2 | GO:0031492 | nucleosomal DNA binding(GO:0031492) |
| 0.3 | 0.9 | GO:0050412 | cinnamate beta-D-glucosyltransferase activity(GO:0050412) |
| 0.3 | 0.9 | GO:0016661 | oxidoreductase activity, acting on other nitrogenous compounds as donors(GO:0016661) |
| 0.3 | 0.9 | GO:0008442 | 3-hydroxyisobutyrate dehydrogenase activity(GO:0008442) |
| 0.3 | 0.8 | GO:0004046 | aminoacylase activity(GO:0004046) |
| 0.2 | 2.4 | GO:0004806 | triglyceride lipase activity(GO:0004806) |
| 0.2 | 0.8 | GO:0015141 | succinate transmembrane transporter activity(GO:0015141) |
| 0.2 | 0.6 | GO:0080132 | fatty acid alpha-hydroxylase activity(GO:0080132) |
| 0.2 | 2.6 | GO:0004709 | MAP kinase kinase kinase activity(GO:0004709) |
| 0.2 | 0.5 | GO:0070678 | preprotein binding(GO:0070678) |
| 0.2 | 3.4 | GO:0015248 | sterol transporter activity(GO:0015248) |
| 0.2 | 0.9 | GO:0004333 | fumarate hydratase activity(GO:0004333) |
| 0.2 | 0.5 | GO:0000309 | nicotinamide-nucleotide adenylyltransferase activity(GO:0000309) |
| 0.2 | 1.3 | GO:0090447 | glycerol-3-phosphate 2-O-acyltransferase activity(GO:0090447) |
| 0.2 | 1.3 | GO:0001653 | peptide receptor activity(GO:0001653) |
| 0.2 | 1.1 | GO:0045549 | 9-cis-epoxycarotenoid dioxygenase activity(GO:0045549) |
| 0.2 | 0.6 | GO:0052743 | inositol-polyphosphate 5-phosphatase activity(GO:0004445) inositol-1,3,4,5-tetrakisphosphate 5-phosphatase activity(GO:0052659) inositol tetrakisphosphate phosphatase activity(GO:0052743) |
| 0.1 | 0.7 | GO:0031683 | G-protein coupled receptor binding(GO:0001664) G-protein beta/gamma-subunit complex binding(GO:0031683) |
| 0.1 | 0.9 | GO:0004123 | cystathionine gamma-lyase activity(GO:0004123) |
| 0.1 | 1.3 | GO:0016721 | superoxide dismutase activity(GO:0004784) oxidoreductase activity, acting on superoxide radicals as acceptor(GO:0016721) |
| 0.1 | 0.5 | GO:0016882 | cyclo-ligase activity(GO:0016882) |
| 0.1 | 0.5 | GO:0004679 | AMP-activated protein kinase activity(GO:0004679) |
| 0.1 | 1.1 | GO:0030976 | thiamine pyrophosphate binding(GO:0030976) |
| 0.1 | 0.5 | GO:0008253 | 5'-nucleotidase activity(GO:0008253) |
| 0.1 | 0.3 | GO:0008821 | crossover junction endodeoxyribonuclease activity(GO:0008821) |
| 0.1 | 1.5 | GO:0019209 | kinase activator activity(GO:0019209) protein kinase activator activity(GO:0030295) |
| 0.1 | 1.0 | GO:0047216 | inositol 3-alpha-galactosyltransferase activity(GO:0047216) |
| 0.1 | 1.0 | GO:0035198 | miRNA binding(GO:0035198) |
| 0.1 | 0.4 | GO:0030942 | endoplasmic reticulum signal peptide binding(GO:0030942) |
| 0.1 | 0.7 | GO:0015556 | C4-dicarboxylate transmembrane transporter activity(GO:0015556) |
| 0.1 | 0.7 | GO:0070696 | transmembrane receptor protein serine/threonine kinase binding(GO:0070696) |
| 0.1 | 0.3 | GO:0004839 | ubiquitin activating enzyme activity(GO:0004839) |
| 0.1 | 1.2 | GO:0005242 | inward rectifier potassium channel activity(GO:0005242) |
| 0.1 | 0.9 | GO:0017169 | CDP-alcohol phosphatidyltransferase activity(GO:0017169) |
| 0.1 | 0.9 | GO:0015112 | nitrate transmembrane transporter activity(GO:0015112) |
| 0.1 | 0.5 | GO:1990137 | plant seed peroxidase activity(GO:1990137) |
| 0.1 | 0.5 | GO:0047274 | galactinol-sucrose galactosyltransferase activity(GO:0047274) |
| 0.1 | 1.2 | GO:0015386 | potassium:proton antiporter activity(GO:0015386) |
| 0.1 | 0.3 | GO:0015203 | polyamine transmembrane transporter activity(GO:0015203) |
| 0.1 | 0.3 | GO:0097617 | annealing activity(GO:0097617) |
| 0.1 | 0.7 | GO:0032453 | histone demethylase activity (H3-K4 specific)(GO:0032453) histone demethylase activity (H3-trimethyl-K4 specific)(GO:0034647) |
| 0.1 | 0.2 | GO:0097157 | U2 snRNA binding(GO:0030620) pre-mRNA intronic binding(GO:0097157) |
| 0.1 | 0.3 | GO:0070139 | ubiquitin-like protein-specific endopeptidase activity(GO:0070137) SUMO-specific endopeptidase activity(GO:0070139) |
| 0.1 | 2.0 | GO:0008553 | hydrogen-exporting ATPase activity, phosphorylative mechanism(GO:0008553) |
| 0.0 | 0.7 | GO:0000993 | RNA polymerase II core binding(GO:0000993) |
| 0.0 | 0.9 | GO:0008353 | RNA polymerase II carboxy-terminal domain kinase activity(GO:0008353) |
| 0.0 | 0.4 | GO:0004143 | diacylglycerol kinase activity(GO:0004143) |
| 0.0 | 2.7 | GO:0001228 | transcriptional activator activity, RNA polymerase II transcription regulatory region sequence-specific binding(GO:0001228) |
| 0.0 | 1.8 | GO:0080030 | methyl indole-3-acetate esterase activity(GO:0080030) |
| 0.0 | 0.3 | GO:0004791 | thioredoxin-disulfide reductase activity(GO:0004791) |
| 0.0 | 0.5 | GO:0003950 | NAD+ ADP-ribosyltransferase activity(GO:0003950) |
| 0.0 | 0.3 | GO:0001046 | core promoter sequence-specific DNA binding(GO:0001046) core promoter binding(GO:0001047) |
| 0.0 | 0.3 | GO:0015391 | nucleobase:cation symporter activity(GO:0015391) |
| 0.0 | 5.4 | GO:0016709 | oxidoreductase activity, acting on paired donors, with incorporation or reduction of molecular oxygen, NAD(P)H as one donor, and incorporation of one atom of oxygen(GO:0016709) |
| 0.0 | 0.1 | GO:0003962 | cystathionine gamma-synthase activity(GO:0003962) |
| 0.0 | 1.0 | GO:0031593 | polyubiquitin binding(GO:0031593) |
| 0.0 | 2.0 | GO:0005096 | GTPase activator activity(GO:0005096) |
| 0.0 | 0.4 | GO:0033926 | glycopeptide alpha-N-acetylgalactosaminidase activity(GO:0033926) |
| 0.0 | 0.3 | GO:0048038 | quinone binding(GO:0048038) |
| 0.0 | 1.5 | GO:0015035 | protein disulfide oxidoreductase activity(GO:0015035) |
| 0.0 | 0.3 | GO:0032041 | NAD-dependent histone deacetylase activity(GO:0017136) histone deacetylase activity (H3-K14 specific)(GO:0031078) NAD-dependent histone deacetylase activity (H3-K14 specific)(GO:0032041) NAD-dependent protein deacetylase activity(GO:0034979) |
| 0.0 | 4.0 | GO:0008234 | cysteine-type peptidase activity(GO:0008234) |
| 0.0 | 0.1 | GO:0022841 | leak channel activity(GO:0022840) potassium ion leak channel activity(GO:0022841) narrow pore channel activity(GO:0022842) |
| 0.0 | 4.3 | GO:0061630 | ubiquitin protein ligase activity(GO:0061630) |
| 0.0 | 1.5 | GO:0004185 | serine-type carboxypeptidase activity(GO:0004185) |
| 0.0 | 1.6 | GO:0061631 | ubiquitin conjugating enzyme activity(GO:0061631) |
| 0.0 | 0.3 | GO:0008061 | chitin binding(GO:0008061) |
| 0.0 | 0.1 | GO:0016744 | transferase activity, transferring aldehyde or ketonic groups(GO:0016744) |
| 0.0 | 0.4 | GO:0051117 | ATPase binding(GO:0051117) |
| 0.0 | 0.4 | GO:0019707 | protein-cysteine S-palmitoyltransferase activity(GO:0019706) protein-cysteine S-acyltransferase activity(GO:0019707) |
| 0.0 | 0.3 | GO:0070300 | phosphatidic acid binding(GO:0070300) |
| 0.0 | 0.5 | GO:0008066 | glutamate receptor activity(GO:0008066) |
| 0.0 | 0.7 | GO:0043130 | ubiquitin binding(GO:0043130) |
| 0.0 | 4.0 | GO:0019787 | ubiquitin-like protein transferase activity(GO:0019787) |
| 0.0 | 0.1 | GO:0004535 | poly(A)-specific ribonuclease activity(GO:0004535) |
| 0.0 | 0.8 | GO:0005347 | ATP transmembrane transporter activity(GO:0005347) |
| 0.0 | 0.1 | GO:0004814 | arginine-tRNA ligase activity(GO:0004814) |
| 0.0 | 0.3 | GO:0005253 | anion channel activity(GO:0005253) |
| 0.0 | 0.3 | GO:0003978 | UDP-glucose 4-epimerase activity(GO:0003978) |
| 0.0 | 0.5 | GO:0015385 | sodium:proton antiporter activity(GO:0015385) |
| 0.0 | 0.1 | GO:0052622 | ATP dimethylallyltransferase activity(GO:0052622) ADP dimethylallyltransferase activity(GO:0052623) |
| 0.0 | 0.2 | GO:0000774 | adenyl-nucleotide exchange factor activity(GO:0000774) |
| 0.0 | 1.5 | GO:0019900 | kinase binding(GO:0019900) |
| 0.0 | 0.6 | GO:0035091 | phosphatidylinositol binding(GO:0035091) |
| 0.0 | 1.0 | GO:0003697 | single-stranded DNA binding(GO:0003697) |
| 0.0 | 0.8 | GO:0046910 | pectinesterase inhibitor activity(GO:0046910) |
| 0.0 | 0.4 | GO:0050135 | NAD(P)+ nucleosidase activity(GO:0050135) |
| 0.0 | 1.1 | GO:0008374 | O-acyltransferase activity(GO:0008374) |
| 0.0 | 0.2 | GO:0004427 | inorganic diphosphatase activity(GO:0004427) |
| 0.0 | 0.2 | GO:0043138 | 3'-5' DNA helicase activity(GO:0043138) |
| 0.0 | 6.9 | GO:0044212 | regulatory region DNA binding(GO:0000975) transcription regulatory region sequence-specific DNA binding(GO:0000976) regulatory region nucleic acid binding(GO:0001067) transcription regulatory region DNA binding(GO:0044212) |
Gene overrepresentation in curated gene sets: canonical pathways category:
| Log-likelihood per target | Total log-likelihood | Term | Description |
|---|---|---|---|
| 0.1 | 0.7 | PID SMAD2 3NUCLEAR PATHWAY | Regulation of nuclear SMAD2/3 signaling |
Gene overrepresentation in curated gene sets: REACTOME pathways category:
| Log-likelihood per target | Total log-likelihood | Term | Description |
|---|---|---|---|
| 0.1 | 0.5 | REACTOME RNA POL II TRANSCRIPTION PRE INITIATION AND PROMOTER OPENING | Genes involved in RNA Polymerase II Transcription Pre-Initiation And Promoter Opening |
| 0.0 | 0.3 | REACTOME ANTIGEN PROCESSING UBIQUITINATION PROTEASOME DEGRADATION | Genes involved in Antigen processing: Ubiquitination & Proteasome degradation |
| 0.0 | 0.3 | REACTOME FACTORS INVOLVED IN MEGAKARYOCYTE DEVELOPMENT AND PLATELET PRODUCTION | Genes involved in Factors involved in megakaryocyte development and platelet production |