Project
GSE43616: Time-course of wild-type Arabidopsis leaf
Navigation
Downloads
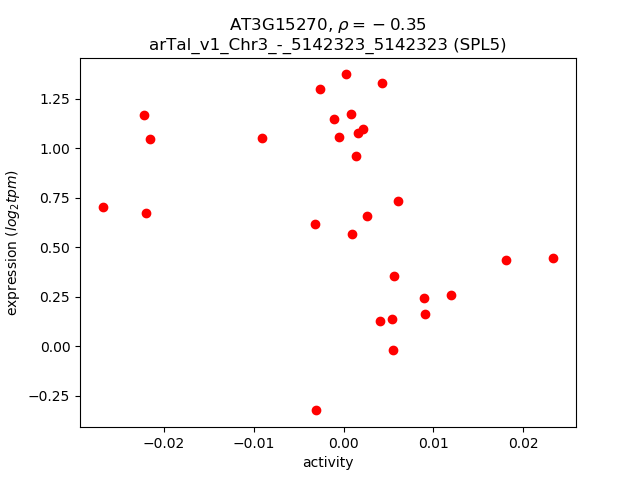
Results for AT3G15270
Z-value: 0.80
Transcription factors associated with AT3G15270
| Gene Symbol | Gene ID | Gene Info |
|---|---|---|
|
AT3G15270
|
AT3G15270 | squamosa promoter binding protein-like 5 |
Activity-expression correlation:
| Gene | Promoter | Pearson corr. coef. | P-value | Plot |
|---|---|---|---|---|
| SPL5 | arTal_v1_Chr3_-_5142323_5142323 | -0.35 | 6.9e-02 | Click! |
Activity profile of AT3G15270 motif
Sorted Z-values of AT3G15270 motif
| Promoter | Log-likelihood | Transcript | Gene | Gene Info |
|---|---|---|---|---|
| arTal_v1_Chr3_+_10255906_10255941 | 4.24 |
AT3G27690.2
AT3G27690.1 |
LHCB2.3
|
photosystem II light harvesting complex protein 2.3 |
| arTal_v1_Chr2_+_14524607_14524607 | 4.05 |
AT2G34430.1
|
LHB1B1
|
light-harvesting chlorophyll-protein complex II subunit B1 |
| arTal_v1_Chr4_-_18098633_18098633 | 3.84 |
AT4G38770.1
|
PRP4
|
proline-rich protein 4 |
| arTal_v1_Chr1_-_29635931_29635931 | 3.58 |
AT1G78820.1
|
AT1G78820
|
D-mannose binding lectin protein with Apple-like carbohydrate-binding domain-containing protein |
| arTal_v1_Chr4_-_17777445_17777445 | 3.34 |
AT4G37800.1
|
XTH7
|
xyloglucan endotransglucosylase/hydrolase 7 |
| arTal_v1_Chr3_+_17228642_17228642 | 2.99 |
AT3G46780.1
|
PTAC16
|
plastid transcriptionally active 16 |
| arTal_v1_Chr5_-_4392227_4392227 | 2.68 |
AT5G13630.2
|
GUN5
|
magnesium-chelatase subunit chlH, chloroplast, putative / Mg-protoporphyrin IX chelatase, putative (CHLH) |
| arTal_v1_Chr5_-_4392429_4392429 | 2.68 |
AT5G13630.1
|
GUN5
|
magnesium-chelatase subunit chlH, chloroplast, putative / Mg-protoporphyrin IX chelatase, putative (CHLH) |
| arTal_v1_Chr3_-_3357754_3357754 | 2.65 |
AT3G10720.2
|
AT3G10720
|
Plant invertase/pectin methylesterase inhibitor superfamily |
| arTal_v1_Chr5_-_25343369_25343369 | 2.64 |
AT5G63180.1
|
AT5G63180
|
Pectin lyase-like superfamily protein |
| arTal_v1_Chr3_+_1695156_1695156 | 2.64 |
AT3G05730.1
|
AT3G05730
|
defensin-like protein |
| arTal_v1_Chr1_+_10371675_10371675 | 2.62 |
AT1G29660.1
|
AT1G29660
|
GDSL-like Lipase/Acylhydrolase superfamily protein |
| arTal_v1_Chr3_+_23266227_23266227 | 2.62 |
AT3G62950.1
|
AT3G62950
|
Thioredoxin superfamily protein |
| arTal_v1_Chr3_-_19139423_19139423 | 2.57 |
AT3G51600.1
|
LTP5
|
lipid transfer protein 5 |
| arTal_v1_Chr4_-_12400231_12400231 | 2.56 |
AT4G23820.1
|
AT4G23820
|
Pectin lyase-like superfamily protein |
| arTal_v1_Chr1_-_27853233_27853269 | 2.51 |
AT1G74070.2
AT1G74070.1 |
AT1G74070
|
Cyclophilin-like peptidyl-prolyl cis-trans isomerase family protein |
| arTal_v1_Chr5_+_5237970_5238178 | 2.49 |
AT5G16030.1
AT5G16030.4 AT5G16030.2 AT5G16030.3 |
AT5G16030
|
mental retardation GTPase activating protein |
| arTal_v1_Chr3_-_4744263_4744263 | 2.46 |
AT3G14240.1
|
AT3G14240
|
Subtilase family protein |
| arTal_v1_Chr1_+_19454798_19454798 | 2.39 |
AT1G52230.1
|
PSAH2
|
photosystem I subunit H2 |
| arTal_v1_Chr5_+_26767599_26767599 | 2.36 |
AT5G67070.1
|
RALFL34
|
ralf-like 34 |
| arTal_v1_Chr5_-_18026077_18026077 | 2.34 |
AT5G44680.1
|
AT5G44680
|
DNA glycosylase superfamily protein |
| arTal_v1_Chr3_-_16448844_16448844 | 2.31 |
AT3G44990.1
|
XTH31
|
xyloglucan endo-transglycosylase-related 8 |
| arTal_v1_Chr1_+_20614573_20614610 | 2.29 |
AT1G55260.1
AT1G55260.2 |
AT1G55260
|
Bifunctional inhibitor/lipid-transfer protein/seed storage 2S albumin superfamily protein |
| arTal_v1_Chr2_-_12433796_12433796 | 2.29 |
AT2G28950.1
|
EXPA6
|
expansin A6 |
| arTal_v1_Chr1_+_10477885_10477885 | 2.27 |
AT1G29930.1
|
CAB1
|
chlorophyll A/B binding protein 1 |
| arTal_v1_Chr2_+_8940833_8940833 | 2.27 |
AT2G20750.2
AT2G20750.1 |
EXPB1
|
expansin B1 |
| arTal_v1_Chr1_-_4530222_4530222 | 2.26 |
AT1G13250.1
|
GATL3
|
galacturonosyltransferase-like 3 |
| arTal_v1_Chr1_+_907523_907651 | 2.26 |
AT1G03630.1
AT1G03630.2 |
POR C
|
protochlorophyllide oxidoreductase C |
| arTal_v1_Chr5_+_18634041_18634041 | 2.26 |
AT5G45950.1
|
AT5G45950
|
GDSL-like Lipase/Acylhydrolase superfamily protein |
| arTal_v1_Chr4_-_176870_176870 | 2.24 |
AT4G00400.1
|
GPAT8
|
glycerol-3-phosphate acyltransferase 8 |
| arTal_v1_Chr5_+_4087689_4087689 | 2.23 |
AT5G12940.1
|
AT5G12940
|
Leucine-rich repeat (LRR) family protein |
| arTal_v1_Chr5_-_6976036_6976036 | 2.22 |
AT5G20630.1
|
GER3
|
germin 3 |
| arTal_v1_Chr1_-_28419635_28419635 | 2.22 |
AT1G75680.1
|
GH9B7
|
glycosyl hydrolase 9B7 |
| arTal_v1_Chr3_-_3356811_3356811 | 2.22 |
AT3G10720.1
|
AT3G10720
|
Plant invertase/pectin methylesterase inhibitor superfamily |
| arTal_v1_Chr1_-_8183570_8183650 | 2.19 |
AT1G23080.2
AT1G23080.3 AT1G23080.4 AT1G23080.1 |
PIN7
|
Auxin efflux carrier family protein |
| arTal_v1_Chr3_-_1860797_1860797 | 2.18 |
AT3G06145.1
|
AT3G06145
|
RING zinc finger protein |
| arTal_v1_Chr3_-_7557969_7557969 | 2.16 |
AT3G21460.1
|
AT3G21460
|
Glutaredoxin family protein |
| arTal_v1_Chr3_-_4008018_4008018 | 2.15 |
AT3G12610.1
|
DRT100
|
Leucine-rich repeat (LRR) family protein |
| arTal_v1_Chr1_+_12851983_12851983 | 2.15 |
AT1G35140.1
|
PHI-1
|
Phosphate-responsive 1 family protein |
| arTal_v1_Chr4_-_17355891_17356037 | 2.14 |
AT4G36850.3
AT4G36850.4 AT4G36850.2 AT4G36850.1 |
AT4G36850
|
PQ-loop repeat family protein / transmembrane family protein |
| arTal_v1_Chr5_+_5238502_5238502 | 2.13 |
AT5G16030.5
|
AT5G16030
|
mental retardation GTPase activating protein |
| arTal_v1_Chr5_+_7502427_7502427 | 2.13 |
AT5G22580.1
|
AT5G22580
|
Stress responsive A/B Barrel Domain-containing protein |
| arTal_v1_Chr1_-_11216141_11216141 | 2.12 |
AT1G31330.1
|
PSAF
|
photosystem I subunit F |
| arTal_v1_Chr2_-_15137012_15137012 | 2.10 |
AT2G36050.1
|
OFP15
|
ovate family protein 15 |
| arTal_v1_Chr1_+_5489145_5489145 | 2.09 |
AT1G15980.1
|
PnsB1
|
NDH-dependent cyclic electron flow 1 |
| arTal_v1_Chr3_+_18049571_18049571 | 2.08 |
AT3G48730.1
|
GSA2
|
glutamate-1-semialdehyde 2,1-aminomutase 2 |
| arTal_v1_Chr5_-_7738535_7738535 | 2.07 |
AT5G23060.2
AT5G23060.1 |
CaS
|
calcium sensing receptor |
| arTal_v1_Chr2_-_12277417_12277417 | 2.06 |
AT2G28630.2
|
KCS12
|
3-ketoacyl-CoA synthase 12 |
| arTal_v1_Chr2_+_14384797_14384797 | 2.04 |
AT2G34060.1
|
AT2G34060
|
Peroxidase superfamily protein |
| arTal_v1_Chr3_-_8589754_8589754 | 2.03 |
AT3G23810.1
|
SAHH2
|
S-adenosyl-l-homocysteine (SAH) hydrolase 2 |
| arTal_v1_Chr3_+_23345754_23345754 | 2.03 |
AT3G63200.1
|
PLP9
|
PATATIN-like protein 9 |
| arTal_v1_Chr1_-_598657_598657 | 2.02 |
AT1G02730.1
|
CSLD5
|
cellulose synthase-like D5 |
| arTal_v1_Chr4_+_12876822_12876948 | 2.01 |
AT4G25080.6
AT4G25080.5 AT4G25080.2 AT4G25080.1 AT4G25080.3 AT4G25080.4 |
CHLM
|
magnesium-protoporphyrin IX methyltransferase |
| arTal_v1_Chr1_+_4868346_4868346 | 2.01 |
AT1G14250.1
|
AT1G14250
|
GDA1/CD39 nucleoside phosphatase family protein |
| arTal_v1_Chr2_-_12277245_12277245 | 1.99 |
AT2G28630.1
|
KCS12
|
3-ketoacyl-CoA synthase 12 |
| arTal_v1_Chr5_+_3889906_3889906 | 1.99 |
AT5G12050.1
|
AT5G12050
|
rho GTPase-activating protein |
| arTal_v1_Chr5_-_8338032_8338032 | 1.99 |
AT5G24420.1
|
PGL5
|
6-phosphogluconolactonase 5 |
| arTal_v1_Chr4_-_16583075_16583075 | 1.98 |
AT4G34760.1
|
AT4G34760
|
SAUR-like auxin-responsive protein family |
| arTal_v1_Chr1_+_17918207_17918207 | 1.97 |
AT1G48480.1
|
RKL1
|
receptor-like kinase 1 |
| arTal_v1_Chr1_+_4899045_4899045 | 1.97 |
AT1G14345.1
|
AT1G14345
|
NAD(P)-linked oxidoreductase superfamily protein |
| arTal_v1_Chr2_-_1824480_1824480 | 1.96 |
AT2G05100.1
AT2G05100.2 |
LHCB2.1
|
photosystem II light harvesting complex protein 2.1 |
| arTal_v1_Chr5_+_1919080_1919179 | 1.96 |
AT5G06290.1
AT5G06290.2 |
2-Cys Prx B
|
2-cysteine peroxiredoxin B |
| arTal_v1_Chr1_-_26515188_26515255 | 1.94 |
AT1G70370.2
AT1G70370.1 |
PG2
|
polygalacturonase 2 |
| arTal_v1_Chr4_+_620691_620697 | 1.94 |
AT4G01460.1
AT4G01460.2 |
AT4G01460
|
basic helix-loop-helix (bHLH) DNA-binding superfamily protein |
| arTal_v1_Chr3_-_2130451_2130451 | 1.94 |
AT3G06750.1
|
AT3G06750
|
hydroxyproline-rich glycoprotein family protein |
| arTal_v1_Chr5_-_3183984_3184110 | 1.94 |
AT5G10150.2
AT5G10150.1 |
AT5G10150
|
UPSTREAM OF FLC protein (DUF966) |
| arTal_v1_Chr1_+_12267808_12267808 | 1.93 |
AT1G33811.1
|
AT1G33811
|
GDSL-like Lipase/Acylhydrolase superfamily protein |
| arTal_v1_Chr1_-_1702749_1702749 | 1.92 |
AT1G05675.1
|
AT1G05675
|
UDP-Glycosyltransferase superfamily protein |
| arTal_v1_Chr1_+_7886323_7886323 | 1.92 |
AT1G22330.1
|
AT1G22330
|
RNA-binding (RRM/RBD/RNP motifs) family protein |
| arTal_v1_Chr5_+_208866_208866 | 1.90 |
AT5G01530.1
|
LHCB4.1
|
light harvesting complex photosystem II |
| arTal_v1_Chr3_-_19595834_19595834 | 1.89 |
AT3G52870.1
|
AT3G52870
|
IQ calmodulin-binding motif family protein |
| arTal_v1_Chr4_+_7521257_7521322 | 1.88 |
AT4G12800.2
AT4G12800.1 |
PSAL
|
photosystem I subunit l |
| arTal_v1_Chr5_-_23576084_23576084 | 1.86 |
AT5G58310.1
|
MES18
|
methyl esterase 18 |
| arTal_v1_Chr5_-_20940895_20940895 | 1.85 |
AT5G51550.1
|
EXL3
|
EXORDIUM like 3 |
| arTal_v1_Chr3_+_22902491_22902638 | 1.85 |
AT3G61870.1
AT3G61870.2 |
AT3G61870
|
plant/protein |
| arTal_v1_Chr2_-_12173951_12173991 | 1.84 |
AT2G28470.2
AT2G28470.4 AT2G28470.1 AT2G28470.3 |
BGAL8
|
beta-galactosidase 8 |
| arTal_v1_Chr5_-_3183484_3183484 | 1.84 |
AT5G10150.3
AT5G10150.4 |
AT5G10150
|
UPSTREAM OF FLC protein (DUF966) |
| arTal_v1_Chr1_+_7252111_7252111 | 1.84 |
AT1G20850.1
|
XCP2
|
xylem cysteine peptidase 2 |
| arTal_v1_Chr4_+_8925571_8925571 | 1.84 |
AT4G15660.1
|
AT4G15660
|
Thioredoxin superfamily protein |
| arTal_v1_Chr5_+_25969190_25969190 | 1.83 |
AT5G65010.2
|
ASN2
|
asparagine synthetase 2 |
| arTal_v1_Chr1_+_4839801_4839853 | 1.83 |
AT1G14150.1
AT1G14150.2 |
PnsL2
|
PsbQ-like 2 |
| arTal_v1_Chr5_+_25969035_25969035 | 1.82 |
AT5G65010.1
|
ASN2
|
asparagine synthetase 2 |
| arTal_v1_Chr5_+_21020014_21020014 | 1.82 |
AT5G51750.1
|
SBT1.3
|
subtilase 1.3 |
| arTal_v1_Chr5_-_7026533_7026533 | 1.81 |
AT5G20740.1
|
AT5G20740
|
Plant invertase/pectin methylesterase inhibitor superfamily protein |
| arTal_v1_Chr3_-_3277930_3277930 | 1.81 |
AT3G10520.1
|
HB2
|
hemoglobin 2 |
| arTal_v1_Chr4_+_14517393_14517393 | 1.81 |
AT4G29610.1
|
AT4G29610
|
Cytidine/deoxycytidylate deaminase family protein |
| arTal_v1_Chr4_+_13177356_13177356 | 1.81 |
AT4G25960.1
|
ABCB2
|
P-glycoprotein 2 |
| arTal_v1_Chr4_-_12772438_12772479 | 1.80 |
AT4G24780.1
AT4G24780.2 |
AT4G24780
|
Pectin lyase-like superfamily protein |
| arTal_v1_Chr5_-_1293723_1293723 | 1.79 |
AT5G04530.1
|
KCS19
|
3-ketoacyl-CoA synthase 19 |
| arTal_v1_Chr5_+_8365601_8365601 | 1.78 |
AT5G24490.1
|
AT5G24490
|
30S ribosomal protein |
| arTal_v1_Chr1_+_27991165_27991165 | 1.78 |
AT1G74470.1
|
AT1G74470
|
Pyridine nucleotide-disulfide oxidoreductase family protein |
| arTal_v1_Chr2_-_19563960_19563960 | 1.78 |
AT2G47750.1
|
GH3.9
|
putative indole-3-acetic acid-amido synthetase GH3.9 |
| arTal_v1_Chr2_+_19191247_19191247 | 1.78 |
AT2G46710.1
|
ROPGAP3
|
Rho GTPase activating protein with PAK-box/P21-Rho-binding domain-containing protein |
| arTal_v1_Chr2_-_7496292_7496292 | 1.77 |
AT2G17230.1
|
EXL5
|
EXORDIUM like 5 |
| arTal_v1_Chr1_-_28603932_28603932 | 1.77 |
AT1G76240.1
|
AT1G76240
|
DUF241 domain protein (DUF241) |
| arTal_v1_Chr1_+_25374072_25374222 | 1.77 |
AT1G67700.1
AT1G67700.2 AT1G67700.5 AT1G67700.4 AT1G67700.3 |
AT1G67700
|
multidrug resistance protein |
| arTal_v1_Chr2_+_14216771_14216771 | 1.76 |
AT2G33570.1
|
GALS1
|
glycosyltransferase family protein (DUF23) |
| arTal_v1_Chr3_-_3027961_3027961 | 1.74 |
AT3G09870.1
|
AT3G09870
|
SAUR-like auxin-responsive protein family |
| arTal_v1_Chr2_+_1033598_1033598 | 1.73 |
AT2G03410.1
|
AT2G03410
|
Mo25 family protein |
| arTal_v1_Chr4_-_7316871_7316871 | 1.73 |
AT4G12320.1
|
CYP706A6
|
cytochrome P450, family 706, subfamily A, polypeptide 6 |
| arTal_v1_Chr2_-_11727654_11727654 | 1.71 |
AT2G27420.1
|
AT2G27420
|
Cysteine proteinases superfamily protein |
| arTal_v1_Chr1_+_9421009_9421069 | 1.70 |
AT1G27120.1
AT1G27120.2 |
AT1G27120
|
Galactosyltransferase family protein |
| arTal_v1_Chr5_+_4974671_4974671 | 1.69 |
AT5G15310.2
AT5G15310.4 AT5G15310.3 AT5G15310.1 |
MYB16
|
myb domain protein 16 |
| arTal_v1_Chr2_+_6542166_6542166 | 1.69 |
AT2G15090.1
|
KCS8
|
3-ketoacyl-CoA synthase 8 |
| arTal_v1_Chr1_+_8027294_8027294 | 1.68 |
AT1G22690.3
AT1G22690.2 |
AT1G22690
|
Gibberellin-regulated family protein |
| arTal_v1_Chr5_-_7026753_7026753 | 1.68 |
AT5G20740.2
|
AT5G20740
|
Plant invertase/pectin methylesterase inhibitor superfamily protein |
| arTal_v1_Chr2_+_12254888_12254888 | 1.68 |
AT2G28605.1
|
AT2G28605
|
Photosystem II reaction center PsbP family protein |
| arTal_v1_Chr4_+_17986384_17986384 | 1.67 |
AT4G38430.1
|
ROPGEF1
|
rho guanyl-nucleotide exchange factor 1 |
| arTal_v1_Chr3_-_19467455_19467455 | 1.67 |
AT3G52500.1
|
AT3G52500
|
Eukaryotic aspartyl protease family protein |
| arTal_v1_Chr5_+_25016860_25016860 | 1.67 |
AT5G62280.1
|
AT5G62280
|
DUF1442 family protein (DUF1442) |
| arTal_v1_Chr5_-_7419335_7419335 | 1.66 |
AT5G22390.1
|
AT5G22390
|
FANTASTIC four-like protein (DUF3049) |
| arTal_v1_Chr2_+_1594588_1594588 | 1.66 |
AT2G04570.1
|
AT2G04570
|
GDSL-like Lipase/Acylhydrolase superfamily protein |
| arTal_v1_Chr1_-_15607966_15607966 | 1.66 |
AT1G41830.1
|
SKS6
|
SKU5-similar 6 |
| arTal_v1_Chr3_+_19845097_19845172 | 1.65 |
AT3G53530.2
AT3G53530.1 |
NAKR3
|
Chloroplast-targeted copper chaperone protein |
| arTal_v1_Chr1_-_26538437_26538437 | 1.64 |
AT1G70410.2
|
BCA4
|
beta carbonic anhydrase 4 |
| arTal_v1_Chr1_+_11396402_11396402 | 1.64 |
AT1G31800.1
|
CYP97A3
|
cytochrome P450, family 97, subfamily A, polypeptide 3 |
| arTal_v1_Chr5_-_24990331_24990331 | 1.64 |
AT5G62220.1
|
GT18
|
glycosyltransferase 18 |
| arTal_v1_Chr1_+_18802552_18802552 | 1.63 |
AT1G50732.1
|
AT1G50732
|
transmembrane protein |
| arTal_v1_Chr1_+_23911024_23911024 | 1.62 |
AT1G64390.1
|
GH9C2
|
glycosyl hydrolase 9C2 |
| arTal_v1_Chr1_-_28581315_28581315 | 1.62 |
AT1G76160.1
|
sks5
|
SKU5 similar 5 |
| arTal_v1_Chr1_+_19879405_19879405 | 1.61 |
AT1G53300.1
|
TTL1
|
tetratricopetide-repeat thioredoxin-like 1 |
| arTal_v1_Chr5_+_22474142_22474142 | 1.61 |
AT5G55480.1
|
SVL1
|
SHV3-like 1 |
| arTal_v1_Chr4_+_15819489_15819489 | 1.60 |
AT4G32800.1
|
AT4G32800
|
Integrase-type DNA-binding superfamily protein |
| arTal_v1_Chr2_-_19617681_19617681 | 1.60 |
AT2G47930.1
|
AGP26
|
arabinogalactan protein 26 |
| arTal_v1_Chr1_-_24023424_24023424 | 1.60 |
AT1G64640.1
|
ENODL8
|
early nodulin-like protein 8 |
| arTal_v1_Chr2_-_7727404_7727503 | 1.59 |
AT2G17780.2
AT2G17780.4 AT2G17780.5 AT2G17780.8 AT2G17780.10 AT2G17780.9 AT2G17780.1 AT2G17780.6 AT2G17780.3 AT2G17780.7 |
MCA2
|
PLAC8 family protein |
| arTal_v1_Chr5_+_23374873_23374874 | 1.58 |
AT5G57700.3
AT5G57700.2 AT5G57700.1 AT5G57700.5 |
AT5G57700
|
BNR/Asp-box repeat family protein |
| arTal_v1_Chr1_+_11343854_11343854 | 1.58 |
AT1G31690.1
|
AT1G31690
|
Copper amine oxidase family protein |
| arTal_v1_Chr3_-_20576249_20576249 | 1.58 |
AT3G55500.1
|
EXPA16
|
expansin A16 |
| arTal_v1_Chr4_-_947075_947085 | 1.57 |
AT4G02130.2
AT4G02130.3 |
GATL6
|
galacturonosyltransferase 6 |
| arTal_v1_Chr5_-_21092410_21092410 | 1.57 |
AT5G51890.1
|
AT5G51890
|
Peroxidase superfamily protein |
| arTal_v1_Chr5_-_19899301_19899301 | 1.57 |
AT5G49100.1
|
AT5G49100
|
vitellogenin-like protein |
| arTal_v1_Chr5_-_14199431_14199431 | 1.56 |
AT5G36120.1
|
CCB3
|
cofactor assembly, complex C (B6F) |
| arTal_v1_Chr4_-_7587099_7587099 | 1.56 |
AT4G12970.1
|
STOMAGEN
|
stomagen |
| arTal_v1_Chr3_+_5934033_5934064 | 1.55 |
AT3G17350.1
AT3G17350.2 |
AT3G17350
|
wall-associated receptor kinase carboxy-terminal protein |
| arTal_v1_Chr5_-_21724642_21724701 | 1.55 |
AT5G53490.3
AT5G53490.2 AT5G53490.1 AT5G53490.4 |
AT5G53490
|
Tetratricopeptide repeat (TPR)-like superfamily protein |
| arTal_v1_Chr3_-_9342223_9342223 | 1.54 |
AT3G25660.1
|
AT3G25660
|
Amidase family protein |
| arTal_v1_Chr1_-_26537422_26537426 | 1.54 |
AT1G70410.3
AT1G70410.1 |
BCA4
|
beta carbonic anhydrase 4 |
| arTal_v1_Chr4_+_160643_160643 | 1.54 |
AT4G00360.1
|
CYP86A2
|
cytochrome P450, family 86, subfamily A, polypeptide 2 |
| arTal_v1_Chr1_-_25649254_25649254 | 1.54 |
AT1G68400.1
|
AT1G68400
|
leucine-rich repeat transmembrane protein kinase family protein |
| arTal_v1_Chr1_-_1307973_1307973 | 1.53 |
AT1G04680.1
|
AT1G04680
|
Pectin lyase-like superfamily protein |
| arTal_v1_Chr1_+_1231452_1231452 | 1.53 |
AT1G04520.1
|
PDLP2
|
plasmodesmata-located protein 2 |
| arTal_v1_Chr3_+_8610979_8610979 | 1.53 |
AT3G23840.1
|
AT3G23840
|
HXXXD-type acyl-transferase family protein |
| arTal_v1_Chr1_+_9544410_9544410 | 1.53 |
AT1G27480.1
|
AT1G27480
|
alpha/beta-Hydrolases superfamily protein |
| arTal_v1_Chr2_-_183639_183764 | 1.52 |
AT2G01420.3
AT2G01420.1 AT2G01420.2 |
PIN4
|
Auxin efflux carrier family protein |
| arTal_v1_Chr5_+_7103384_7103419 | 1.52 |
AT5G20935.1
AT5G20935.2 |
CRR42
|
DUF3148 family protein |
| arTal_v1_Chr3_-_1136397_1136397 | 1.51 |
AT3G04290.1
|
LTL1
|
Li-tolerant lipase 1 |
| arTal_v1_Chr1_+_24057297_24057439 | 1.50 |
AT1G64770.1
AT1G64770.2 |
PnsB2
|
NDH-dependent cyclic electron flow 1 |
| arTal_v1_Chr2_+_11856571_11856571 | 1.50 |
AT2G27820.1
|
PD1
|
prephenate dehydratase 1 |
| arTal_v1_Chr4_-_18068293_18068293 | 1.49 |
AT4G38660.1
|
AT4G38660
|
Pathogenesis-related thaumatin superfamily protein |
| arTal_v1_Chr3_+_7280792_7280792 | 1.49 |
AT3G20820.1
|
AT3G20820
|
Leucine-rich repeat (LRR) family protein |
| arTal_v1_Chr4_+_17643110_17643110 | 1.49 |
AT4G37550.4
AT4G37550.1 AT4G37550.2 |
AT4G37550
|
Acetamidase/Formamidase family protein |
| arTal_v1_Chr3_-_23417119_23417119 | 1.49 |
AT3G63410.1
|
APG1
|
S-adenosyl-L-methionine-dependent methyltransferases superfamily protein |
| arTal_v1_Chr1_+_8027126_8027126 | 1.48 |
AT1G22690.1
|
AT1G22690
|
Gibberellin-regulated family protein |
| arTal_v1_Chr4_-_18067873_18067873 | 1.48 |
AT4G38660.2
|
AT4G38660
|
Pathogenesis-related thaumatin superfamily protein |
| arTal_v1_Chr3_-_9255083_9255083 | 1.47 |
AT3G25500.1
|
AFH1
|
formin homology 1 |
| arTal_v1_Chr2_+_2322215_2322222 | 1.47 |
AT2G05990.1
AT2G05990.2 |
MOD1
|
NAD(P)-binding Rossmann-fold superfamily protein |
| arTal_v1_Chr1_-_3443957_3443957 | 1.47 |
AT1G10470.3
AT1G10470.2 |
ARR4
|
response regulator 4 |
| arTal_v1_Chr4_-_8016582_8016582 | 1.46 |
AT4G13840.1
|
AT4G13840
|
HXXXD-type acyl-transferase family protein |
| arTal_v1_Chr4_+_17643548_17643570 | 1.46 |
AT4G37550.6
AT4G37550.3 |
AT4G37550
|
Acetamidase/Formamidase family protein |
| arTal_v1_Chr5_+_4535367_4535401 | 1.46 |
AT5G14060.1
AT5G14060.2 AT5G14060.3 |
CARAB-AK-LYS
|
Aspartate kinase family protein |
| arTal_v1_Chr1_-_18413016_18413016 | 1.45 |
AT1G49750.1
|
AT1G49750
|
Leucine-rich repeat (LRR) family protein |
| arTal_v1_Chr4_-_8454144_8454159 | 1.45 |
AT4G14740.4
AT4G14740.2 AT4G14740.1 |
AT4G14740
|
auxin canalization protein (DUF828) |
| arTal_v1_Chr2_+_15289975_15289975 | 1.45 |
AT2G36430.1
|
AT2G36430
|
transmembrane protein, putative (DUF247) |
| arTal_v1_Chr4_+_14566183_14566265 | 1.45 |
AT4G29740.3
AT4G29740.2 AT4G29740.1 |
CKX4
|
cytokinin oxidase 4 |
| arTal_v1_Chr1_-_3444360_3444360 | 1.44 |
AT1G10470.1
|
ARR4
|
response regulator 4 |
| arTal_v1_Chr4_+_14192569_14192569 | 1.44 |
AT4G28720.1
|
YUC8
|
Flavin-binding monooxygenase family protein |
| arTal_v1_Chr4_-_947249_947249 | 1.43 |
AT4G02130.1
|
GATL6
|
galacturonosyltransferase 6 |
| arTal_v1_Chr5_+_463073_463073 | 1.43 |
AT5G02260.1
|
EXPA9
|
expansin A9 |
| arTal_v1_Chr3_+_8194606_8194711 | 1.43 |
AT3G23050.1
AT3G23050.3 AT3G23050.2 |
IAA7
|
indole-3-acetic acid 7 |
| arTal_v1_Chr3_-_8902835_8902835 | 1.43 |
AT3G24480.1
|
AT3G24480
|
Leucine-rich repeat (LRR) family protein |
| arTal_v1_Chr2_+_10667898_10667898 | 1.41 |
AT2G25080.1
|
GPX1
|
glutathione peroxidase 1 |
| arTal_v1_Chr1_+_24057063_24057063 | 1.41 |
AT1G64770.3
|
PnsB2
|
NDH-dependent cyclic electron flow 1 |
| arTal_v1_Chr4_+_5740219_5740219 | 1.41 |
AT4G08950.1
|
EXO
|
Phosphate-responsive 1 family protein |
| arTal_v1_Chr1_-_6283348_6283348 | 1.41 |
AT1G18265.1
|
AT1G18265
|
zein-binding protein (Protein of unknown function, DUF593) |
| arTal_v1_Chr3_-_1855063_1855197 | 1.41 |
AT3G06130.2
AT3G06130.1 |
AT3G06130
|
Heavy metal transport/detoxification superfamily protein |
| arTal_v1_Chr5_-_23406479_23406479 | 1.41 |
AT5G57780.1
|
P1R1
|
transcription factor |
| arTal_v1_Chr1_-_3518035_3518035 | 1.40 |
AT1G10640.1
|
AT1G10640
|
Pectin lyase-like superfamily protein |
| arTal_v1_Chr2_+_417427_417427 | 1.40 |
AT2G01910.2
|
ATMAP65-6
|
Microtubule associated protein (MAP65/ASE1) family protein |
| arTal_v1_Chr5_-_24326827_24326827 | 1.40 |
AT5G60490.1
|
FLA12
|
FASCICLIN-like arabinogalactan-protein 12 |
| arTal_v1_Chr1_-_29638773_29638773 | 1.39 |
AT1G78830.1
|
AT1G78830
|
Curculin-like (mannose-binding) lectin family protein |
| arTal_v1_Chr3_-_2944457_2944457 | 1.39 |
AT3G09580.1
|
AT3G09580
|
FAD/NAD(P)-binding oxidoreductase family protein |
| arTal_v1_Chr3_+_288741_288741 | 1.39 |
AT3G01810.2
|
AT3G01810
|
EEIG1/EHBP1 protein amino-terminal domain protein |
| arTal_v1_Chr3_+_957112_957123 | 1.39 |
AT3G03780.1
AT3G03780.3 |
MS2
|
methionine synthase 2 |
| arTal_v1_Chr1_+_28078852_28078852 | 1.39 |
AT1G74730.1
|
AT1G74730
|
transmembrane protein, putative (DUF1118) |
| arTal_v1_Chr4_+_10949573_10949573 | 1.38 |
AT4G20270.1
|
BAM3
|
Leucine-rich receptor-like protein kinase family protein |
| arTal_v1_Chr3_-_6980523_6980523 | 1.38 |
AT3G20015.1
|
AT3G20015
|
Eukaryotic aspartyl protease family protein |
| arTal_v1_Chr3_+_4128334_4128334 | 1.38 |
AT3G12930.1
|
AT3G12930
|
Lojap-related protein |
| arTal_v1_Chr3_-_23261927_23261927 | 1.38 |
AT3G62930.1
|
AT3G62930
|
Thioredoxin superfamily protein |
| arTal_v1_Chr3_+_288538_288538 | 1.38 |
AT3G01810.3
|
AT3G01810
|
EEIG1/EHBP1 protein amino-terminal domain protein |
| arTal_v1_Chr1_-_8235019_8235019 | 1.38 |
AT1G23205.1
|
AT1G23205
|
Plant invertase/pectin methylesterase inhibitor superfamily protein |
| arTal_v1_Chr1_-_22317070_22317070 | 1.38 |
AT1G60590.1
|
AT1G60590
|
Pectin lyase-like superfamily protein |
| arTal_v1_Chr5_+_7168106_7168106 | 1.38 |
AT5G21100.1
|
AT5G21100
|
Plant L-ascorbate oxidase |
| arTal_v1_Chr2_-_15540139_15540139 | 1.37 |
AT2G36990.1
|
SIGF
|
RNApolymerase sigma-subunit F |
| arTal_v1_Chr2_-_12646057_12646057 | 1.37 |
AT2G29550.1
|
TUB7
|
tubulin beta-7 chain |
| arTal_v1_Chr3_+_956862_956862 | 1.37 |
AT3G03780.2
|
MS2
|
methionine synthase 2 |
| arTal_v1_Chr5_+_16151772_16151772 | 1.37 |
AT5G40380.3
AT5G40380.2 |
CRK42
|
cysteine-rich RLK (RECEPTOR-like protein kinase) 42 |
| arTal_v1_Chr2_+_8059106_8059106 | 1.37 |
AT2G18560.1
|
AT2G18560
|
UDP-Glycosyltransferase superfamily protein |
| arTal_v1_Chr4_+_17254290_17254290 | 1.37 |
AT4G36570.1
|
RL3
|
RAD-like 3 |
| arTal_v1_Chr5_+_26646900_26646900 | 1.36 |
AT5G66740.1
|
AT5G66740
|
spindle assembly abnormal protein (DUF620) |
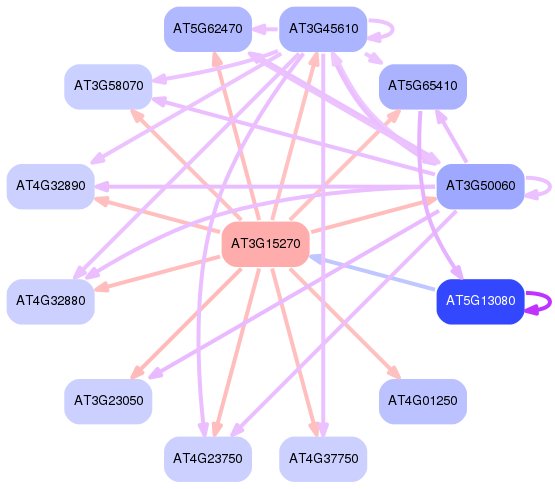
Network of associatons between targets according to the STRING database.

First level regulatory network of AT3G15270
Gene Ontology Analysis
Gene overrepresentation in biological process category:
| Log-likelihood per target | Total log-likelihood | Term | Description |
|---|---|---|---|
| 1.7 | 10.3 | GO:0009769 | photosynthesis, light harvesting in photosystem II(GO:0009769) |
| 0.7 | 2.2 | GO:0048872 | tissue homeostasis(GO:0001894) homeostasis of number of meristem cells(GO:0007639) homeostasis of number of cells(GO:0048872) homeostasis of number of cells within a tissue(GO:0048873) |
| 0.7 | 2.1 | GO:0042407 | cristae formation(GO:0042407) |
| 0.7 | 0.7 | GO:0009915 | phloem sucrose loading(GO:0009915) |
| 0.7 | 4.0 | GO:0070981 | L-asparagine biosynthetic process(GO:0070981) L-asparagine metabolic process(GO:0070982) |
| 0.6 | 1.8 | GO:0045900 | negative regulation of translational elongation(GO:0045900) |
| 0.6 | 1.7 | GO:0035017 | cuticle pattern formation(GO:0035017) |
| 0.6 | 2.8 | GO:1903175 | fatty alcohol biosynthetic process(GO:1903175) |
| 0.5 | 0.5 | GO:0042547 | cell wall modification involved in multidimensional cell growth(GO:0042547) |
| 0.5 | 2.0 | GO:0033353 | S-adenosylmethionine cycle(GO:0033353) S-adenosylhomocysteine metabolic process(GO:0046498) |
| 0.5 | 3.0 | GO:0031116 | positive regulation of microtubule polymerization(GO:0031116) |
| 0.5 | 2.0 | GO:0090308 | regulation of methylation-dependent chromatin silencing(GO:0090308) positive regulation of methylation-dependent chromatin silencing(GO:0090309) |
| 0.5 | 0.5 | GO:2000045 | regulation of G1/S transition of mitotic cell cycle(GO:2000045) |
| 0.5 | 8.8 | GO:0006949 | syncytium formation(GO:0006949) |
| 0.5 | 1.4 | GO:0050687 | negative regulation of immune effector process(GO:0002698) negative regulation of defense response to virus(GO:0050687) |
| 0.5 | 1.8 | GO:0015669 | gas transport(GO:0015669) |
| 0.4 | 3.1 | GO:0010623 | programmed cell death involved in cell development(GO:0010623) |
| 0.4 | 1.3 | GO:0015840 | urea transport(GO:0015840) one-carbon compound transport(GO:0019755) |
| 0.4 | 2.5 | GO:0009090 | homoserine biosynthetic process(GO:0009090) |
| 0.4 | 2.1 | GO:0071277 | cellular response to calcium ion(GO:0071277) |
| 0.4 | 3.3 | GO:0010189 | vitamin E biosynthetic process(GO:0010189) vitamin E metabolic process(GO:0042360) |
| 0.4 | 2.2 | GO:0046087 | cytidine catabolic process(GO:0006216) cytidine deamination(GO:0009972) cytidine metabolic process(GO:0046087) |
| 0.4 | 2.2 | GO:0009650 | UV protection(GO:0009650) |
| 0.3 | 5.4 | GO:0010315 | auxin efflux(GO:0010315) |
| 0.3 | 2.7 | GO:0010190 | cytochrome b6f complex assembly(GO:0010190) |
| 0.3 | 1.0 | GO:0019279 | L-methionine biosynthetic process from L-homoserine via cystathionine(GO:0019279) 'de novo' L-methionine biosynthetic process(GO:0071266) |
| 0.3 | 2.3 | GO:1904276 | regulation of wax biosynthetic process(GO:1904276) positive regulation of wax biosynthetic process(GO:1904278) |
| 0.3 | 1.0 | GO:0010275 | NAD(P)H dehydrogenase complex assembly(GO:0010275) |
| 0.3 | 1.0 | GO:0015755 | hexose transport(GO:0008645) fructose transport(GO:0015755) vacuolar transmembrane transport(GO:0034486) |
| 0.3 | 2.2 | GO:0010067 | procambium histogenesis(GO:0010067) |
| 0.3 | 1.0 | GO:0015709 | thiosulfate transport(GO:0015709) succinate transmembrane transport(GO:0071422) |
| 0.3 | 1.6 | GO:1901333 | positive regulation of lateral root development(GO:1901333) |
| 0.3 | 3.1 | GO:1902290 | positive regulation of defense response to oomycetes(GO:1902290) |
| 0.3 | 3.0 | GO:0007130 | synaptonemal complex assembly(GO:0007130) synaptonemal complex organization(GO:0070193) |
| 0.3 | 1.5 | GO:0010226 | response to lithium ion(GO:0010226) |
| 0.3 | 1.2 | GO:0010606 | positive regulation of cytoplasmic mRNA processing body assembly(GO:0010606) |
| 0.3 | 1.5 | GO:0006571 | tyrosine biosynthetic process(GO:0006571) |
| 0.3 | 0.9 | GO:1904667 | negative regulation of protein ubiquitination(GO:0031397) negative regulation of ligase activity(GO:0051352) negative regulation of ubiquitin-protein transferase activity(GO:0051444) negative regulation of ubiquitin protein ligase activity(GO:1904667) |
| 0.3 | 2.1 | GO:0045038 | protein import into chloroplast thylakoid membrane(GO:0045038) |
| 0.3 | 2.9 | GO:0010052 | guard cell differentiation(GO:0010052) |
| 0.3 | 1.5 | GO:0051016 | barbed-end actin filament capping(GO:0051016) |
| 0.3 | 1.2 | GO:0048657 | anther wall tapetum formation(GO:0048656) anther wall tapetum cell differentiation(GO:0048657) |
| 0.3 | 1.2 | GO:0010480 | microsporocyte differentiation(GO:0010480) |
| 0.3 | 5.2 | GO:0009768 | photosynthesis, light harvesting in photosystem I(GO:0009768) |
| 0.3 | 0.8 | GO:0010501 | RNA secondary structure unwinding(GO:0010501) |
| 0.3 | 1.4 | GO:0009647 | skotomorphogenesis(GO:0009647) |
| 0.3 | 0.8 | GO:0006557 | S-adenosylmethioninamine biosynthetic process(GO:0006557) S-adenosylmethioninamine metabolic process(GO:0046499) |
| 0.3 | 1.9 | GO:0080117 | secondary growth(GO:0080117) |
| 0.3 | 1.4 | GO:0006297 | nucleotide-excision repair, DNA gap filling(GO:0006297) |
| 0.3 | 1.4 | GO:0046713 | borate transport(GO:0046713) |
| 0.3 | 1.1 | GO:0055073 | cadmium ion homeostasis(GO:0055073) |
| 0.3 | 0.8 | GO:0031441 | negative regulation of mRNA 3'-end processing(GO:0031441) negative regulation of mRNA processing(GO:0050686) negative regulation of mRNA polyadenylation(GO:1900364) negative regulation of mRNA metabolic process(GO:1903312) |
| 0.3 | 1.0 | GO:0009660 | amyloplast organization(GO:0009660) |
| 0.3 | 1.6 | GO:0051098 | regulation of binding(GO:0051098) |
| 0.3 | 1.5 | GO:0010258 | NADH dehydrogenase complex (plastoquinone) assembly(GO:0010258) |
| 0.3 | 1.0 | GO:0050792 | regulation of viral process(GO:0050792) |
| 0.2 | 3.5 | GO:1902183 | regulation of shoot apical meristem development(GO:1902183) |
| 0.2 | 3.2 | GO:2000122 | negative regulation of stomatal complex development(GO:2000122) |
| 0.2 | 15.2 | GO:0015995 | chlorophyll biosynthetic process(GO:0015995) |
| 0.2 | 1.2 | GO:0042549 | photosystem II stabilization(GO:0042549) |
| 0.2 | 1.4 | GO:0090057 | root radial pattern formation(GO:0090057) |
| 0.2 | 1.6 | GO:0048354 | mucilage biosynthetic process involved in seed coat development(GO:0048354) |
| 0.2 | 2.9 | GO:0009750 | response to fructose(GO:0009750) |
| 0.2 | 2.0 | GO:0071249 | cellular response to nitrate(GO:0071249) |
| 0.2 | 1.3 | GO:0042447 | cytokinin catabolic process(GO:0009823) hormone catabolic process(GO:0042447) |
| 0.2 | 1.7 | GO:0031222 | arabinan catabolic process(GO:0031222) |
| 0.2 | 1.1 | GO:0043692 | monoterpene metabolic process(GO:0043692) |
| 0.2 | 3.9 | GO:0009773 | photosynthetic electron transport in photosystem I(GO:0009773) |
| 0.2 | 0.4 | GO:0007187 | G-protein coupled receptor signaling pathway, coupled to cyclic nucleotide second messenger(GO:0007187) adenylate cyclase-modulating G-protein coupled receptor signaling pathway(GO:0007188) |
| 0.2 | 17.4 | GO:0045490 | pectin catabolic process(GO:0045490) |
| 0.2 | 2.0 | GO:0046083 | adenine metabolic process(GO:0046083) adenine biosynthetic process(GO:0046084) |
| 0.2 | 0.8 | GO:0099636 | cytoplasmic streaming(GO:0099636) |
| 0.2 | 0.8 | GO:0044380 | protein localization to cytoskeleton(GO:0044380) protein localization to microtubule cytoskeleton(GO:0072698) |
| 0.2 | 0.4 | GO:0008295 | spermidine biosynthetic process(GO:0008295) |
| 0.2 | 0.8 | GO:0042450 | arginine biosynthetic process via ornithine(GO:0042450) |
| 0.2 | 1.5 | GO:0071585 | detoxification of cadmium ion(GO:0071585) |
| 0.2 | 0.6 | GO:0090549 | response to carbon starvation(GO:0090549) |
| 0.2 | 2.2 | GO:0007143 | female meiotic division(GO:0007143) |
| 0.2 | 8.5 | GO:0045489 | pectin biosynthetic process(GO:0045489) |
| 0.2 | 1.9 | GO:1902223 | L-phenylalanine biosynthetic process(GO:0009094) aromatic amino acid family biosynthetic process, prephenate pathway(GO:0009095) erythrose 4-phosphate/phosphoenolpyruvate family amino acid biosynthetic process(GO:1902223) |
| 0.2 | 1.6 | GO:0016123 | xanthophyll biosynthetic process(GO:0016123) |
| 0.2 | 0.5 | GO:0034389 | lipid particle organization(GO:0034389) |
| 0.2 | 0.8 | GO:1901703 | protein localization involved in auxin polar transport(GO:1901703) |
| 0.2 | 0.3 | GO:1990937 | xylan acetylation(GO:1990937) |
| 0.2 | 0.5 | GO:0033194 | response to hydroperoxide(GO:0033194) |
| 0.2 | 2.7 | GO:0016998 | cell wall macromolecule catabolic process(GO:0016998) |
| 0.2 | 0.5 | GO:1904215 | regulation of protein import into chloroplast stroma(GO:1904215) |
| 0.2 | 1.0 | GO:0072344 | rescue of stalled ribosome(GO:0072344) |
| 0.2 | 0.6 | GO:0015714 | phosphoenolpyruvate transport(GO:0015714) |
| 0.2 | 0.5 | GO:0036292 | DNA rewinding(GO:0036292) replication fork protection(GO:0048478) |
| 0.2 | 0.9 | GO:0010929 | positive regulation of auxin mediated signaling pathway(GO:0010929) |
| 0.2 | 2.3 | GO:0030497 | fatty acid elongation(GO:0030497) |
| 0.1 | 2.7 | GO:0048829 | root cap development(GO:0048829) |
| 0.1 | 2.2 | GO:0048497 | maintenance of organ identity(GO:0048496) maintenance of floral organ identity(GO:0048497) |
| 0.1 | 0.7 | GO:0006556 | S-adenosylmethionine biosynthetic process(GO:0006556) |
| 0.1 | 0.7 | GO:0090506 | axillary shoot meristem initiation(GO:0090506) |
| 0.1 | 1.1 | GO:0009854 | oxidative photosynthetic carbon pathway(GO:0009854) |
| 0.1 | 2.7 | GO:2000012 | regulation of auxin polar transport(GO:2000012) |
| 0.1 | 0.4 | GO:0010113 | negative regulation of systemic acquired resistance(GO:0010113) |
| 0.1 | 0.8 | GO:0019408 | dolichol biosynthetic process(GO:0019408) |
| 0.1 | 0.7 | GO:0019419 | sulfate reduction(GO:0019419) |
| 0.1 | 1.8 | GO:2000071 | regulation of defense response by callose deposition(GO:2000071) |
| 0.1 | 0.1 | GO:0006529 | asparagine biosynthetic process(GO:0006529) |
| 0.1 | 0.7 | GO:0019401 | alditol biosynthetic process(GO:0019401) |
| 0.1 | 0.4 | GO:0010338 | leaf formation(GO:0010338) |
| 0.1 | 1.9 | GO:0042761 | very long-chain fatty acid biosynthetic process(GO:0042761) |
| 0.1 | 3.8 | GO:0006284 | base-excision repair(GO:0006284) |
| 0.1 | 0.8 | GO:0015689 | molybdate ion transport(GO:0015689) |
| 0.1 | 0.8 | GO:0009635 | response to herbicide(GO:0009635) |
| 0.1 | 0.5 | GO:0043447 | alkane biosynthetic process(GO:0043447) |
| 0.1 | 0.8 | GO:0006013 | mannose metabolic process(GO:0006013) |
| 0.1 | 0.4 | GO:0010446 | response to alkaline pH(GO:0010446) |
| 0.1 | 0.5 | GO:0080140 | regulation of jasmonic acid metabolic process(GO:0080140) regulation of jasmonic acid biosynthetic process(GO:0080141) |
| 0.1 | 1.3 | GO:1902222 | L-phenylalanine catabolic process(GO:0006559) erythrose 4-phosphate/phosphoenolpyruvate family amino acid catabolic process(GO:1902222) |
| 0.1 | 0.4 | GO:1990532 | stress response to nickel ion(GO:1990532) |
| 0.1 | 0.7 | GO:1902969 | mitotic DNA replication(GO:1902969) |
| 0.1 | 1.5 | GO:0010021 | amylopectin biosynthetic process(GO:0010021) amylopectin metabolic process(GO:2000896) |
| 0.1 | 1.7 | GO:0045493 | xylan catabolic process(GO:0045493) |
| 0.1 | 0.8 | GO:0015837 | amine transport(GO:0015837) regulation of organic acid transport(GO:0032890) regulation of amine transport(GO:0051952) regulation of amino acid transport(GO:0051955) regulation of amino acid export(GO:0080143) |
| 0.1 | 0.6 | GO:0080175 | assembly of actomyosin apparatus involved in cytokinesis(GO:0000912) phragmoplast assembly(GO:0000914) phragmoplast microtubule organization(GO:0080175) assembly of actomyosin apparatus involved in mitotic cytokinesis(GO:1902407) |
| 0.1 | 0.4 | GO:0070150 | mitochondrial glycyl-tRNA aminoacylation(GO:0070150) |
| 0.1 | 4.6 | GO:0009827 | plant-type cell wall modification(GO:0009827) |
| 0.1 | 0.6 | GO:0010586 | miRNA metabolic process(GO:0010586) miRNA catabolic process(GO:0010587) |
| 0.1 | 4.1 | GO:0000413 | protein peptidyl-prolyl isomerization(GO:0000413) |
| 0.1 | 0.3 | GO:0000492 | box C/D snoRNP assembly(GO:0000492) |
| 0.1 | 2.0 | GO:0044070 | regulation of anion transport(GO:0044070) |
| 0.1 | 0.6 | GO:0061087 | positive regulation of histone H3-K27 methylation(GO:0061087) |
| 0.1 | 0.5 | GO:0030656 | regulation of vitamin metabolic process(GO:0030656) regulation of triglyceride metabolic process(GO:0090207) regulation of L-ascorbic acid biosynthetic process(GO:2000082) |
| 0.1 | 3.0 | GO:0009767 | photosynthetic electron transport chain(GO:0009767) |
| 0.1 | 0.7 | GO:0080187 | floral organ senescence(GO:0080187) |
| 0.1 | 6.1 | GO:0010411 | xyloglucan metabolic process(GO:0010411) |
| 0.1 | 0.3 | GO:0001560 | regulation of cell growth by extracellular stimulus(GO:0001560) |
| 0.1 | 0.3 | GO:1990110 | callus formation(GO:1990110) |
| 0.1 | 0.4 | GO:0090322 | regulation of superoxide metabolic process(GO:0090322) |
| 0.1 | 0.2 | GO:0090172 | attachment of spindle microtubules to kinetochore involved in meiotic chromosome segregation(GO:0051316) attachment of spindle microtubules to kinetochore involved in homologous chromosome segregation(GO:0051455) microtubule cytoskeleton organization involved in homologous chromosome segregation(GO:0090172) |
| 0.1 | 1.0 | GO:0006662 | glycerol ether metabolic process(GO:0006662) |
| 0.1 | 0.9 | GO:0031542 | positive regulation of anthocyanin biosynthetic process(GO:0031542) |
| 0.1 | 1.4 | GO:0033238 | regulation of cellular amino acid metabolic process(GO:0006521) regulation of cellular amine metabolic process(GO:0033238) |
| 0.1 | 4.9 | GO:0048825 | cotyledon development(GO:0048825) |
| 0.1 | 0.3 | GO:1990884 | rRNA acetylation involved in maturation of SSU-rRNA(GO:1904812) rRNA acetylation(GO:1990882) RNA acetylation(GO:1990884) |
| 0.1 | 1.4 | GO:0010274 | hydrotropism(GO:0010274) |
| 0.1 | 0.5 | GO:0043247 | telomere maintenance in response to DNA damage(GO:0043247) |
| 0.1 | 1.4 | GO:0052803 | histidine biosynthetic process(GO:0000105) histidine metabolic process(GO:0006547) imidazole-containing compound metabolic process(GO:0052803) |
| 0.1 | 1.0 | GO:0010199 | organ boundary specification between lateral organs and the meristem(GO:0010199) |
| 0.1 | 0.5 | GO:0006107 | oxaloacetate metabolic process(GO:0006107) |
| 0.1 | 1.9 | GO:0010152 | pollen maturation(GO:0010152) |
| 0.1 | 2.1 | GO:0010025 | wax biosynthetic process(GO:0010025) |
| 0.1 | 1.7 | GO:1905177 | tracheary element differentiation(GO:1905177) |
| 0.1 | 0.5 | GO:0035627 | ceramide transport(GO:0035627) |
| 0.1 | 3.7 | GO:0009851 | auxin biosynthetic process(GO:0009851) |
| 0.1 | 0.4 | GO:0000188 | inactivation of MAPK activity(GO:0000188) |
| 0.1 | 0.9 | GO:0010371 | regulation of gibberellin biosynthetic process(GO:0010371) |
| 0.1 | 0.5 | GO:0043100 | pyrimidine nucleobase salvage(GO:0043100) |
| 0.1 | 0.7 | GO:0010023 | proanthocyanidin biosynthetic process(GO:0010023) |
| 0.1 | 1.3 | GO:0015743 | malate transport(GO:0015743) |
| 0.1 | 0.5 | GO:0010358 | leaf shaping(GO:0010358) |
| 0.1 | 0.3 | GO:0071836 | nectar secretion(GO:0071836) |
| 0.1 | 0.3 | GO:0031120 | snRNA pseudouridine synthesis(GO:0031120) |
| 0.1 | 0.3 | GO:0033477 | S-methylmethionine metabolic process(GO:0033477) S-methylmethionine cycle(GO:0033528) |
| 0.1 | 0.4 | GO:1901332 | negative regulation of lateral root development(GO:1901332) |
| 0.1 | 1.0 | GO:0042793 | transcription from plastid promoter(GO:0042793) |
| 0.1 | 1.2 | GO:0000919 | cell plate assembly(GO:0000919) |
| 0.1 | 1.5 | GO:0006074 | (1->3)-beta-D-glucan metabolic process(GO:0006074) (1->3)-beta-D-glucan biosynthetic process(GO:0006075) |
| 0.1 | 0.3 | GO:0009759 | indole glucosinolate biosynthetic process(GO:0009759) |
| 0.1 | 1.2 | GO:0016109 | tetraterpenoid biosynthetic process(GO:0016109) carotenoid biosynthetic process(GO:0016117) |
| 0.1 | 1.0 | GO:0009086 | methionine biosynthetic process(GO:0009086) |
| 0.1 | 0.8 | GO:0046451 | lysine biosynthetic process(GO:0009085) lysine biosynthetic process via diaminopimelate(GO:0009089) diaminopimelate metabolic process(GO:0046451) |
| 0.1 | 0.5 | GO:0010047 | fruit dehiscence(GO:0010047) |
| 0.1 | 1.0 | GO:0009051 | pentose-phosphate shunt, oxidative branch(GO:0009051) |
| 0.1 | 1.4 | GO:0031425 | chloroplast RNA processing(GO:0031425) |
| 0.1 | 0.4 | GO:0006471 | protein ADP-ribosylation(GO:0006471) protein poly-ADP-ribosylation(GO:0070212) |
| 0.1 | 5.4 | GO:0009875 | pollen-pistil interaction(GO:0009875) |
| 0.1 | 1.7 | GO:0006722 | triterpenoid metabolic process(GO:0006722) |
| 0.1 | 0.2 | GO:0001672 | regulation of chromatin assembly or disassembly(GO:0001672) |
| 0.1 | 6.2 | GO:0009606 | tropism(GO:0009606) |
| 0.1 | 1.5 | GO:0080092 | regulation of pollen tube growth(GO:0080092) |
| 0.1 | 0.2 | GO:0071281 | cellular response to iron ion(GO:0071281) |
| 0.1 | 0.9 | GO:0000038 | very long-chain fatty acid metabolic process(GO:0000038) |
| 0.1 | 1.4 | GO:0071483 | cellular response to blue light(GO:0071483) |
| 0.1 | 1.4 | GO:0008360 | regulation of cell shape(GO:0008360) |
| 0.1 | 1.1 | GO:0000162 | tryptophan biosynthetic process(GO:0000162) indolalkylamine biosynthetic process(GO:0046219) |
| 0.1 | 4.3 | GO:0009736 | cytokinin-activated signaling pathway(GO:0009736) |
| 0.1 | 4.0 | GO:0007267 | cell-cell signaling(GO:0007267) |
| 0.1 | 1.4 | GO:0009944 | polarity specification of adaxial/abaxial axis(GO:0009944) specification of axis polarity(GO:0065001) |
| 0.1 | 0.3 | GO:2000574 | regulation of microtubule motor activity(GO:2000574) positive regulation of microtubule motor activity(GO:2000576) regulation of ATP-dependent microtubule motor activity, plus-end-directed(GO:2000580) positive regulation of ATP-dependent microtubule motor activity, plus-end-directed(GO:2000582) |
| 0.1 | 1.2 | GO:0000373 | Group II intron splicing(GO:0000373) |
| 0.1 | 2.0 | GO:0016129 | phytosteroid biosynthetic process(GO:0016129) brassinosteroid biosynthetic process(GO:0016132) |
| 0.1 | 0.2 | GO:0042149 | cellular response to glucose starvation(GO:0042149) |
| 0.1 | 0.7 | GO:1901259 | chloroplast rRNA processing(GO:1901259) |
| 0.1 | 0.9 | GO:0009299 | mRNA transcription(GO:0009299) |
| 0.1 | 0.2 | GO:0019427 | acetyl-CoA biosynthetic process from acetate(GO:0019427) |
| 0.1 | 0.8 | GO:0001709 | cell fate determination(GO:0001709) |
| 0.1 | 0.2 | GO:0072526 | pyridine-containing compound catabolic process(GO:0072526) |
| 0.1 | 1.7 | GO:0042744 | hydrogen peroxide catabolic process(GO:0042744) |
| 0.1 | 0.3 | GO:0016128 | phytosteroid metabolic process(GO:0016128) brassinosteroid metabolic process(GO:0016131) |
| 0.1 | 0.7 | GO:0006353 | DNA-templated transcription, termination(GO:0006353) |
| 0.1 | 1.0 | GO:0019853 | L-ascorbic acid biosynthetic process(GO:0019853) |
| 0.1 | 0.3 | GO:0009963 | positive regulation of flavonoid biosynthetic process(GO:0009963) |
| 0.1 | 0.5 | GO:0010417 | glucuronoxylan metabolic process(GO:0010413) glucuronoxylan biosynthetic process(GO:0010417) |
| 0.1 | 2.1 | GO:0035266 | meristem growth(GO:0035266) |
| 0.1 | 1.1 | GO:0015851 | purine nucleobase transport(GO:0006863) nucleobase transport(GO:0015851) |
| 0.1 | 0.4 | GO:0010158 | abaxial cell fate specification(GO:0010158) |
| 0.1 | 0.2 | GO:0009662 | etioplast organization(GO:0009662) |
| 0.0 | 0.3 | GO:0006032 | aminoglycan catabolic process(GO:0006026) chitin metabolic process(GO:0006030) chitin catabolic process(GO:0006032) amino sugar catabolic process(GO:0046348) glucosamine-containing compound catabolic process(GO:1901072) |
| 0.0 | 1.3 | GO:0016556 | mRNA modification(GO:0016556) |
| 0.0 | 0.7 | GO:1900865 | chloroplast RNA modification(GO:1900865) |
| 0.0 | 0.6 | GO:0009641 | shade avoidance(GO:0009641) |
| 0.0 | 0.0 | GO:0060964 | regulation of gene silencing by miRNA(GO:0060964) |
| 0.0 | 0.3 | GO:0045597 | positive regulation of cell differentiation(GO:0045597) |
| 0.0 | 0.1 | GO:0006432 | phenylalanyl-tRNA aminoacylation(GO:0006432) |
| 0.0 | 0.5 | GO:0051814 | movement in host(GO:0044000) transport of virus in multicellular host(GO:0046739) transport of virus(GO:0046794) movement in other organism involved in symbiotic interaction(GO:0051814) movement in host environment(GO:0052126) movement in environment of other organism involved in symbiotic interaction(GO:0052192) |
| 0.0 | 0.4 | GO:0015914 | phospholipid transport(GO:0015914) |
| 0.0 | 4.6 | GO:0015979 | photosynthesis(GO:0015979) |
| 0.0 | 0.2 | GO:0007155 | cell adhesion(GO:0007155) biological adhesion(GO:0022610) |
| 0.0 | 0.5 | GO:0048658 | anther wall tapetum development(GO:0048658) |
| 0.0 | 0.5 | GO:0032544 | plastid translation(GO:0032544) |
| 0.0 | 0.3 | GO:0007205 | protein kinase C-activating G-protein coupled receptor signaling pathway(GO:0007205) |
| 0.0 | 0.2 | GO:0009864 | induced systemic resistance, jasmonic acid mediated signaling pathway(GO:0009864) |
| 0.0 | 1.1 | GO:0010027 | thylakoid membrane organization(GO:0010027) |
| 0.0 | 0.2 | GO:0046683 | response to organophosphorus(GO:0046683) |
| 0.0 | 0.2 | GO:0031573 | intra-S DNA damage checkpoint(GO:0031573) |
| 0.0 | 0.2 | GO:0071323 | cellular response to chitin(GO:0071323) |
| 0.0 | 0.1 | GO:0009093 | cysteine catabolic process(GO:0009093) |
| 0.0 | 0.2 | GO:0010192 | mucilage biosynthetic process(GO:0010192) |
| 0.0 | 0.7 | GO:0030488 | tRNA methylation(GO:0030488) |
| 0.0 | 0.3 | GO:0018344 | protein geranylgeranylation(GO:0018344) |
| 0.0 | 0.1 | GO:0071244 | cellular response to carbon dioxide(GO:0071244) |
| 0.0 | 0.3 | GO:0032456 | endocytic recycling(GO:0032456) |
| 0.0 | 0.6 | GO:0009556 | microsporogenesis(GO:0009556) |
| 0.0 | 0.4 | GO:0015693 | magnesium ion transport(GO:0015693) |
| 0.0 | 1.6 | GO:0016485 | protein processing(GO:0016485) |
| 0.0 | 0.4 | GO:0006826 | iron ion transport(GO:0006826) |
| 0.0 | 0.2 | GO:0005980 | glycogen catabolic process(GO:0005980) |
| 0.0 | 1.5 | GO:0042127 | regulation of cell proliferation(GO:0042127) |
| 0.0 | 1.0 | GO:0006730 | one-carbon metabolic process(GO:0006730) |
| 0.0 | 1.0 | GO:0043622 | cortical microtubule organization(GO:0043622) |
| 0.0 | 0.2 | GO:0043406 | activation of MAPK activity(GO:0000187) positive regulation of MAP kinase activity(GO:0043406) |
| 0.0 | 0.0 | GO:0048448 | stamen morphogenesis(GO:0048448) |
| 0.0 | 0.3 | GO:0033674 | positive regulation of kinase activity(GO:0033674) |
| 0.0 | 0.4 | GO:0000712 | resolution of meiotic recombination intermediates(GO:0000712) |
| 0.0 | 0.3 | GO:0051555 | flavone metabolic process(GO:0051552) flavone biosynthetic process(GO:0051553) flavonol metabolic process(GO:0051554) flavonol biosynthetic process(GO:0051555) |
| 0.0 | 0.7 | GO:0071577 | zinc II ion transmembrane transport(GO:0071577) |
| 0.0 | 0.6 | GO:0019432 | triglyceride biosynthetic process(GO:0019432) |
| 0.0 | 0.5 | GO:0006574 | valine catabolic process(GO:0006574) |
| 0.0 | 0.2 | GO:0010106 | cellular response to iron ion starvation(GO:0010106) |
| 0.0 | 0.3 | GO:0009231 | riboflavin metabolic process(GO:0006771) riboflavin biosynthetic process(GO:0009231) |
| 0.0 | 0.2 | GO:0044375 | regulation of peroxisome size(GO:0044375) |
| 0.0 | 3.8 | GO:0009657 | plastid organization(GO:0009657) |
| 0.0 | 0.7 | GO:1903825 | organic acid transmembrane transport(GO:1903825) carboxylic acid transmembrane transport(GO:1905039) |
| 0.0 | 0.7 | GO:0000027 | ribosomal large subunit assembly(GO:0000027) |
| 0.0 | 0.1 | GO:0042218 | 1-aminocyclopropane-1-carboxylate metabolic process(GO:0018871) 1-aminocyclopropane-1-carboxylate biosynthetic process(GO:0042218) |
| 0.0 | 0.2 | GO:0050691 | regulation of defense response to virus by host(GO:0050691) |
| 0.0 | 0.3 | GO:0010215 | cellulose microfibril organization(GO:0010215) |
| 0.0 | 0.4 | GO:0010227 | floral organ abscission(GO:0010227) |
| 0.0 | 1.0 | GO:0009834 | plant-type secondary cell wall biogenesis(GO:0009834) |
| 0.0 | 0.4 | GO:0051762 | sesquiterpene biosynthetic process(GO:0051762) |
| 0.0 | 0.8 | GO:0006506 | GPI anchor metabolic process(GO:0006505) GPI anchor biosynthetic process(GO:0006506) |
| 0.0 | 2.5 | GO:0009860 | pollen tube growth(GO:0009860) |
| 0.0 | 1.9 | GO:0009741 | response to brassinosteroid(GO:0009741) |
| 0.0 | 0.1 | GO:0000012 | single strand break repair(GO:0000012) |
| 0.0 | 0.3 | GO:0042335 | cuticle development(GO:0042335) |
| 0.0 | 0.5 | GO:0010582 | floral meristem determinacy(GO:0010582) |
| 0.0 | 0.2 | GO:0070475 | rRNA base methylation(GO:0070475) |
| 0.0 | 0.6 | GO:0048506 | regulation of timing of meristematic phase transition(GO:0048506) regulation of timing of transition from vegetative to reproductive phase(GO:0048510) |
| 0.0 | 0.1 | GO:0031333 | negative regulation of protein complex assembly(GO:0031333) |
| 0.0 | 0.3 | GO:0098781 | ncRNA transcription(GO:0098781) |
| 0.0 | 1.3 | GO:0002181 | cytoplasmic translation(GO:0002181) |
| 0.0 | 0.2 | GO:0016925 | protein sumoylation(GO:0016925) |
| 0.0 | 2.5 | GO:0048511 | circadian rhythm(GO:0007623) rhythmic process(GO:0048511) |
| 0.0 | 0.3 | GO:0006270 | DNA replication initiation(GO:0006270) |
| 0.0 | 0.6 | GO:0009960 | endosperm development(GO:0009960) |
| 0.0 | 0.1 | GO:0007021 | tubulin complex assembly(GO:0007021) |
| 0.0 | 0.6 | GO:0006476 | protein deacetylation(GO:0006476) |
| 0.0 | 0.3 | GO:0080022 | primary root development(GO:0080022) |
| 0.0 | 0.1 | GO:0048194 | COPI-coated vesicle budding(GO:0035964) Golgi vesicle budding(GO:0048194) Golgi transport vesicle coating(GO:0048200) COPI coating of Golgi vesicle(GO:0048205) |
| 0.0 | 1.4 | GO:0048528 | post-embryonic root development(GO:0048528) |
| 0.0 | 0.6 | GO:0006368 | transcription elongation from RNA polymerase II promoter(GO:0006368) |
| 0.0 | 0.5 | GO:0000028 | ribosomal small subunit assembly(GO:0000028) |
| 0.0 | 1.1 | GO:0009561 | megagametogenesis(GO:0009561) |
| 0.0 | 0.3 | GO:0042330 | chemotaxis(GO:0006935) pollen tube guidance(GO:0010183) taxis(GO:0042330) positive chemotaxis(GO:0050918) |
| 0.0 | 0.3 | GO:0090630 | activation of GTPase activity(GO:0090630) |
| 0.0 | 0.1 | GO:0010231 | maintenance of seed dormancy(GO:0010231) maintenance of dormancy(GO:0097437) |
| 0.0 | 1.1 | GO:0006869 | lipid transport(GO:0006869) |
| 0.0 | 0.2 | GO:0009870 | defense response signaling pathway, resistance gene-dependent(GO:0009870) |
| 0.0 | 0.7 | GO:0006101 | tricarboxylic acid cycle(GO:0006099) citrate metabolic process(GO:0006101) |
| 0.0 | 0.2 | GO:0051123 | RNA polymerase II transcriptional preinitiation complex assembly(GO:0051123) |
| 0.0 | 0.3 | GO:0006367 | transcription initiation from RNA polymerase II promoter(GO:0006367) |
| 0.0 | 0.2 | GO:0010072 | primary shoot apical meristem specification(GO:0010072) |
| 0.0 | 1.0 | GO:0006633 | fatty acid biosynthetic process(GO:0006633) |
| 0.0 | 1.8 | GO:0045944 | positive regulation of transcription from RNA polymerase II promoter(GO:0045944) |
| 0.0 | 0.2 | GO:0010091 | trichome branching(GO:0010091) |
| 0.0 | 0.1 | GO:0031365 | N-terminal protein amino acid modification(GO:0031365) |
| 0.0 | 0.4 | GO:0010043 | response to zinc ion(GO:0010043) |
| 0.0 | 0.1 | GO:0048766 | root hair initiation(GO:0048766) |
| 0.0 | 0.1 | GO:0022616 | DNA strand elongation involved in DNA replication(GO:0006271) DNA strand elongation(GO:0022616) |
| 0.0 | 0.3 | GO:0006891 | intra-Golgi vesicle-mediated transport(GO:0006891) |
Gene overrepresentation in cellular component category:
| Log-likelihood per target | Total log-likelihood | Term | Description |
|---|---|---|---|
| 1.1 | 5.4 | GO:0010007 | magnesium chelatase complex(GO:0010007) |
| 0.8 | 6.4 | GO:0009538 | photosystem I reaction center(GO:0009538) |
| 0.7 | 6.6 | GO:0009503 | thylakoid light-harvesting complex(GO:0009503) PSII associated light-harvesting complex II(GO:0009517) light-harvesting complex(GO:0030076) |
| 0.5 | 1.4 | GO:0043674 | lateral plasma membrane(GO:0016328) pollen wall(GO:0043667) exine(GO:0043668) sexine(GO:0043673) columella(GO:0043674) |
| 0.4 | 1.8 | GO:0044420 | extracellular matrix component(GO:0044420) |
| 0.4 | 2.0 | GO:0034425 | etioplast envelope(GO:0034425) etioplast membrane(GO:0034426) |
| 0.4 | 2.6 | GO:0030893 | nuclear cohesin complex(GO:0000798) mitotic cohesin complex(GO:0030892) meiotic cohesin complex(GO:0030893) nuclear mitotic cohesin complex(GO:0034990) nuclear meiotic cohesin complex(GO:0034991) |
| 0.3 | 5.0 | GO:0010598 | NAD(P)H dehydrogenase complex (plastoquinone)(GO:0010598) |
| 0.3 | 3.8 | GO:0045298 | tubulin complex(GO:0045298) |
| 0.3 | 0.8 | GO:0045178 | basal plasma membrane(GO:0009925) basolateral plasma membrane(GO:0016323) basal part of cell(GO:0045178) |
| 0.3 | 1.1 | GO:0032807 | DNA ligase IV complex(GO:0032807) |
| 0.3 | 2.4 | GO:0010369 | chromocenter(GO:0010369) |
| 0.2 | 1.0 | GO:0010316 | pyrophosphate-dependent phosphofructokinase complex(GO:0010316) |
| 0.2 | 5.9 | GO:0009654 | photosystem II oxygen evolving complex(GO:0009654) |
| 0.2 | 0.7 | GO:0009501 | amyloplast(GO:0009501) |
| 0.2 | 1.2 | GO:1990124 | messenger ribonucleoprotein complex(GO:1990124) |
| 0.2 | 1.0 | GO:0009533 | chloroplast stromal thylakoid(GO:0009533) |
| 0.2 | 11.3 | GO:0010287 | plastoglobule(GO:0010287) |
| 0.2 | 0.5 | GO:0005656 | nuclear pre-replicative complex(GO:0005656) pre-replicative complex(GO:0036387) |
| 0.2 | 0.5 | GO:0005775 | vacuolar lumen(GO:0005775) |
| 0.1 | 8.7 | GO:0009528 | plastid inner membrane(GO:0009528) |
| 0.1 | 0.6 | GO:0032044 | DSIF complex(GO:0032044) |
| 0.1 | 6.2 | GO:0042644 | chloroplast nucleoid(GO:0042644) |
| 0.1 | 3.3 | GO:0009574 | preprophase band(GO:0009574) |
| 0.1 | 0.5 | GO:0030130 | clathrin coat of trans-Golgi network vesicle(GO:0030130) |
| 0.1 | 2.1 | GO:0009531 | secondary cell wall(GO:0009531) |
| 0.1 | 20.7 | GO:0009505 | plant-type cell wall(GO:0009505) |
| 0.1 | 2.0 | GO:0010319 | stromule(GO:0010319) |
| 0.1 | 2.3 | GO:0016324 | apical plasma membrane(GO:0016324) |
| 0.1 | 0.7 | GO:0031379 | RNA-directed RNA polymerase complex(GO:0031379) nuclear RNA-directed RNA polymerase complex(GO:0031380) |
| 0.1 | 0.5 | GO:0030126 | COPI vesicle coat(GO:0030126) COPI-coated vesicle membrane(GO:0030663) |
| 0.1 | 0.3 | GO:0031429 | box H/ACA snoRNP complex(GO:0031429) box H/ACA RNP complex(GO:0072588) |
| 0.1 | 12.5 | GO:0099503 | secretory vesicle(GO:0099503) |
| 0.1 | 0.2 | GO:0042646 | plastid nucleoid(GO:0042646) |
| 0.1 | 1.2 | GO:0048500 | signal recognition particle(GO:0048500) |
| 0.1 | 0.6 | GO:0000322 | storage vacuole(GO:0000322) protein storage vacuole(GO:0000326) |
| 0.1 | 1.5 | GO:0000148 | 1,3-beta-D-glucan synthase complex(GO:0000148) |
| 0.1 | 0.9 | GO:0005763 | mitochondrial small ribosomal subunit(GO:0005763) |
| 0.1 | 0.7 | GO:0042555 | MCM complex(GO:0042555) |
| 0.1 | 0.3 | GO:0008622 | epsilon DNA polymerase complex(GO:0008622) |
| 0.1 | 21.6 | GO:0009534 | chloroplast thylakoid(GO:0009534) |
| 0.1 | 0.2 | GO:0005674 | transcription factor TFIIF complex(GO:0005674) |
| 0.1 | 0.3 | GO:0030286 | dynein complex(GO:0030286) |
| 0.1 | 1.5 | GO:0000307 | cyclin-dependent protein kinase holoenzyme complex(GO:0000307) |
| 0.1 | 0.7 | GO:0030125 | clathrin vesicle coat(GO:0030125) |
| 0.1 | 0.3 | GO:0005664 | origin recognition complex(GO:0000808) nuclear origin of replication recognition complex(GO:0005664) |
| 0.1 | 0.8 | GO:0072686 | mitotic spindle(GO:0072686) |
| 0.1 | 0.2 | GO:0030896 | checkpoint clamp complex(GO:0030896) |
| 0.1 | 0.8 | GO:0030687 | preribosome, large subunit precursor(GO:0030687) |
| 0.0 | 0.3 | GO:0005968 | Rab-protein geranylgeranyltransferase complex(GO:0005968) |
| 0.0 | 1.9 | GO:0005764 | lysosome(GO:0005764) |
| 0.0 | 0.3 | GO:0009360 | DNA polymerase III complex(GO:0009360) |
| 0.0 | 0.3 | GO:0044545 | NSL complex(GO:0044545) |
| 0.0 | 0.6 | GO:1902554 | serine/threonine protein kinase complex(GO:1902554) |
| 0.0 | 9.6 | GO:0005618 | cell wall(GO:0005618) external encapsulating structure(GO:0030312) |
| 0.0 | 0.4 | GO:0005720 | nuclear heterochromatin(GO:0005720) |
| 0.0 | 17.9 | GO:0009570 | chloroplast stroma(GO:0009570) |
| 0.0 | 0.4 | GO:0000127 | transcription factor TFIIIC complex(GO:0000127) |
| 0.0 | 0.2 | GO:0000795 | synaptonemal complex(GO:0000795) |
| 0.0 | 8.5 | GO:0031225 | anchored component of membrane(GO:0031225) |
| 0.0 | 3.4 | GO:0009705 | plant-type vacuole membrane(GO:0009705) |
| 0.0 | 0.3 | GO:0035619 | root hair tip(GO:0035619) |
| 0.0 | 3.2 | GO:0022627 | cytosolic small ribosomal subunit(GO:0022627) |
| 0.0 | 5.0 | GO:0048046 | apoplast(GO:0048046) |
| 0.0 | 0.2 | GO:0031588 | nucleotide-activated protein kinase complex(GO:0031588) |
| 0.0 | 2.7 | GO:0031226 | intrinsic component of plasma membrane(GO:0031226) |
| 0.0 | 0.8 | GO:0009504 | cell plate(GO:0009504) |
| 0.0 | 0.2 | GO:0055038 | recycling endosome membrane(GO:0055038) |
| 0.0 | 2.7 | GO:0005874 | microtubule(GO:0005874) |
| 0.0 | 0.3 | GO:0009986 | cell surface(GO:0009986) |
| 0.0 | 0.3 | GO:0005801 | cis-Golgi network(GO:0005801) |
| 0.0 | 52.8 | GO:0005576 | extracellular region(GO:0005576) |
| 0.0 | 0.1 | GO:0000275 | mitochondrial proton-transporting ATP synthase complex, catalytic core F(1)(GO:0000275) |
| 0.0 | 0.5 | GO:0005669 | transcription factor TFIID complex(GO:0005669) |
| 0.0 | 1.3 | GO:0042995 | cell projection(GO:0042995) |
| 0.0 | 0.2 | GO:0071014 | post-mRNA release spliceosomal complex(GO:0071014) |
| 0.0 | 0.1 | GO:0000276 | mitochondrial proton-transporting ATP synthase complex, coupling factor F(o)(GO:0000276) proton-transporting ATP synthase complex, coupling factor F(o)(GO:0045263) |
| 0.0 | 0.3 | GO:0000418 | DNA-directed RNA polymerase IV complex(GO:0000418) |
| 0.0 | 0.2 | GO:0001401 | mitochondrial sorting and assembly machinery complex(GO:0001401) |
| 0.0 | 0.1 | GO:0005844 | polysome(GO:0005844) |
| 0.0 | 0.1 | GO:0017119 | Golgi transport complex(GO:0017119) |
| 0.0 | 1.1 | GO:0022625 | cytosolic large ribosomal subunit(GO:0022625) |
Gene overrepresentation in molecular function category:
| Log-likelihood per target | Total log-likelihood | Term | Description |
|---|---|---|---|
| 1.3 | 4.0 | GO:0004071 | aspartate-ammonia ligase activity(GO:0004071) |
| 1.1 | 3.4 | GO:0016630 | protochlorophyllide reductase activity(GO:0016630) |
| 0.9 | 5.4 | GO:0051002 | magnesium chelatase activity(GO:0016851) ligase activity, forming nitrogen-metal bonds(GO:0051002) ligase activity, forming nitrogen-metal bonds, forming coordination complexes(GO:0051003) |
| 0.7 | 2.2 | GO:0015026 | coreceptor activity(GO:0015026) |
| 0.7 | 2.0 | GO:0004013 | adenosylhomocysteinase activity(GO:0004013) trialkylsulfonium hydrolase activity(GO:0016802) |
| 0.6 | 1.9 | GO:0003838 | sterol 24-C-methyltransferase activity(GO:0003838) |
| 0.6 | 2.5 | GO:0050162 | oxalate oxidase activity(GO:0050162) |
| 0.6 | 1.8 | GO:0005344 | oxygen transporter activity(GO:0005344) |
| 0.6 | 2.4 | GO:0047158 | sinapoylglucose-sinapoylglucose O-sinapoyltransferase activity(GO:0047158) |
| 0.6 | 15.5 | GO:0016168 | chlorophyll binding(GO:0016168) |
| 0.6 | 2.8 | GO:0042084 | 5-methyltetrahydropteroyltriglutamate-homocysteine S-methyltransferase activity(GO:0003871) methionine synthase activity(GO:0008705) 5-methyltetrahydrofolate-dependent methyltransferase activity(GO:0042084) 5-methyltetrahydropteroyltri-L-glutamate-dependent methyltransferase activity(GO:0042085) |
| 0.5 | 1.6 | GO:0010291 | carotene beta-ring hydroxylase activity(GO:0010291) |
| 0.5 | 2.1 | GO:0004817 | cysteine-tRNA ligase activity(GO:0004817) |
| 0.5 | 1.5 | GO:0050567 | glutaminyl-tRNA synthase (glutamine-hydrolyzing) activity(GO:0050567) |
| 0.5 | 2.5 | GO:0004072 | aspartate kinase activity(GO:0004072) |
| 0.4 | 1.3 | GO:0015204 | urea transmembrane transporter activity(GO:0015204) |
| 0.4 | 2.1 | GO:0031957 | very long-chain fatty acid-CoA ligase activity(GO:0031957) |
| 0.4 | 1.2 | GO:0010242 | oxygen evolving activity(GO:0010242) |
| 0.4 | 2.3 | GO:0047769 | prephenate dehydratase activity(GO:0004664) arogenate dehydratase activity(GO:0047769) |
| 0.4 | 9.0 | GO:0102336 | 3-oxo-arachidoyl-CoA synthase activity(GO:0102336) 3-oxo-cerotoyl-CoA synthase activity(GO:0102337) 3-oxo-lignoceronyl-CoA synthase activity(GO:0102338) |
| 0.4 | 1.9 | GO:0010277 | chlorophyllide a oxygenase [overall] activity(GO:0010277) |
| 0.4 | 1.5 | GO:0070330 | oxidoreductase activity, acting on paired donors, with incorporation or reduction of molecular oxygen, reduced flavin or flavoprotein as one donor, and incorporation of one atom of oxygen(GO:0016712) aromatase activity(GO:0070330) |
| 0.4 | 3.0 | GO:0033946 | xyloglucan-specific endo-beta-1,4-glucanase activity(GO:0033946) |
| 0.4 | 2.2 | GO:0017057 | 6-phosphogluconolactonase activity(GO:0017057) |
| 0.4 | 2.2 | GO:0004126 | cytidine deaminase activity(GO:0004126) |
| 0.4 | 1.8 | GO:0043024 | ribosomal small subunit binding(GO:0043024) |
| 0.4 | 1.1 | GO:0071614 | linoleic acid epoxygenase activity(GO:0071614) |
| 0.3 | 7.5 | GO:0080161 | auxin transmembrane transporter activity(GO:0080161) |
| 0.3 | 1.0 | GO:0047804 | cysteine-S-conjugate beta-lyase activity(GO:0047804) |
| 0.3 | 2.0 | GO:0015288 | porin activity(GO:0015288) wide pore channel activity(GO:0022829) |
| 0.3 | 1.0 | GO:0015117 | thiosulfate transmembrane transporter activity(GO:0015117) |
| 0.3 | 1.0 | GO:0035591 | MAP-kinase scaffold activity(GO:0005078) protein kinase C binding(GO:0005080) protein complex scaffold(GO:0032947) signaling adaptor activity(GO:0035591) |
| 0.3 | 0.9 | GO:0004462 | lactoylglutathione lyase activity(GO:0004462) |
| 0.3 | 1.8 | GO:0045156 | electron transporter, transferring electrons within the cyclic electron transport pathway of photosynthesis activity(GO:0045156) |
| 0.3 | 7.3 | GO:0016837 | carbon-oxygen lyase activity, acting on polysaccharides(GO:0016837) pectate lyase activity(GO:0030570) |
| 0.3 | 0.9 | GO:0016418 | dihydrolipoyllysine-residue acetyltransferase activity(GO:0004742) S-acetyltransferase activity(GO:0016418) |
| 0.3 | 1.1 | GO:0042132 | fructose 1,6-bisphosphate 1-phosphatase activity(GO:0042132) |
| 0.3 | 0.8 | GO:0004014 | adenosylmethionine decarboxylase activity(GO:0004014) |
| 0.3 | 6.8 | GO:0016762 | xyloglucan:xyloglucosyl transferase activity(GO:0016762) |
| 0.3 | 1.4 | GO:0046715 | borate transmembrane transporter activity(GO:0046715) borate efflux transmembrane transporter activity(GO:0080139) |
| 0.3 | 3.0 | GO:0008725 | alkylbase DNA N-glycosylase activity(GO:0003905) DNA-3-methyladenine glycosylase activity(GO:0008725) DNA-3-methylbase glycosylase activity(GO:0043733) |
| 0.3 | 0.8 | GO:0008839 | 4-hydroxy-tetrahydrodipicolinate reductase(GO:0008839) |
| 0.2 | 1.0 | GO:0005353 | fructose transmembrane transporter activity(GO:0005353) |
| 0.2 | 1.2 | GO:0050113 | inositol oxygenase activity(GO:0050113) |
| 0.2 | 1.0 | GO:0047334 | diphosphate-fructose-6-phosphate 1-phosphotransferase activity(GO:0047334) |
| 0.2 | 0.7 | GO:1990518 | ATP-dependent 3'-5' DNA helicase activity(GO:0043140) single-stranded DNA-dependent ATP-dependent 3'-5' DNA helicase activity(GO:1990518) |
| 0.2 | 0.7 | GO:0004359 | glutaminase activity(GO:0004359) |
| 0.2 | 0.5 | GO:0036381 | pyridoxal 5'-phosphate synthase (glutamine hydrolysing) activity(GO:0036381) |
| 0.2 | 2.9 | GO:0103075 | indole-3-pyruvate monooxygenase activity(GO:0103075) |
| 0.2 | 3.0 | GO:0042389 | omega-3 fatty acid desaturase activity(GO:0042389) |
| 0.2 | 2.0 | GO:0010428 | methyl-CpNpG binding(GO:0010428) methyl-CpNpN binding(GO:0010429) |
| 0.2 | 6.4 | GO:0047262 | polygalacturonate 4-alpha-galacturonosyltransferase activity(GO:0047262) |
| 0.2 | 1.3 | GO:0016841 | ammonia-lyase activity(GO:0016841) |
| 0.2 | 5.9 | GO:0008810 | cellulase activity(GO:0008810) |
| 0.2 | 1.7 | GO:0043539 | protein serine/threonine kinase activator activity(GO:0043539) |
| 0.2 | 0.9 | GO:0052739 | phosphatidylserine 1-acylhydrolase activity(GO:0052739) 1-acyl-2-lysophosphatidylserine acylhydrolase activity(GO:0052740) |
| 0.2 | 1.7 | GO:0009011 | starch synthase activity(GO:0009011) alpha-1,4-glucan synthase activity(GO:0033201) |
| 0.2 | 1.9 | GO:0008131 | primary amine oxidase activity(GO:0008131) |
| 0.2 | 1.6 | GO:0052622 | ATP dimethylallyltransferase activity(GO:0052622) ADP dimethylallyltransferase activity(GO:0052623) |
| 0.2 | 0.8 | GO:0050734 | hydroxycinnamoyltransferase activity(GO:0050734) |
| 0.2 | 2.0 | GO:0008379 | thioredoxin peroxidase activity(GO:0008379) peroxiredoxin activity(GO:0051920) |
| 0.2 | 1.6 | GO:0004566 | beta-glucuronidase activity(GO:0004566) |
| 0.2 | 0.8 | GO:0080097 | L-tryptophan:pyruvate aminotransferase activity(GO:0080097) |
| 0.2 | 3.0 | GO:0016018 | cyclosporin A binding(GO:0016018) |
| 0.2 | 0.8 | GO:0016882 | cyclo-ligase activity(GO:0016882) |
| 0.2 | 1.1 | GO:0003909 | DNA ligase activity(GO:0003909) DNA ligase (ATP) activity(GO:0003910) |
| 0.2 | 2.0 | GO:0016723 | ferric-chelate reductase activity(GO:0000293) oxidoreductase activity, oxidizing metal ions, NAD or NADP as acceptor(GO:0016723) |
| 0.2 | 1.1 | GO:0004567 | beta-mannosidase activity(GO:0004567) |
| 0.2 | 0.7 | GO:0004400 | histidinol-phosphate transaminase activity(GO:0004400) |
| 0.2 | 1.7 | GO:0047134 | protein-disulfide reductase activity(GO:0047134) |
| 0.2 | 0.5 | GO:0017077 | oxidative phosphorylation uncoupler activity(GO:0017077) |
| 0.2 | 0.7 | GO:0080116 | glucuronoxylan glucuronosyltransferase activity(GO:0080116) |
| 0.2 | 0.5 | GO:1990465 | octadecanal decarbonylase activity(GO:0009924) aldehyde decarbonylase activity(GO:0071771) aldehyde oxygenase (deformylating) activity(GO:1990465) |
| 0.2 | 1.4 | GO:0016987 | core DNA-dependent RNA polymerase binding promoter specificity activity(GO:0000996) sigma factor activity(GO:0016987) |
| 0.2 | 11.2 | GO:0046910 | pectinesterase inhibitor activity(GO:0046910) |
| 0.2 | 0.7 | GO:0004640 | phosphoribosylanthranilate isomerase activity(GO:0004640) |
| 0.2 | 1.0 | GO:0050105 | L-gulonolactone oxidase activity(GO:0050105) |
| 0.2 | 3.6 | GO:0052716 | hydroquinone:oxygen oxidoreductase activity(GO:0052716) |
| 0.2 | 1.1 | GO:0052852 | very-long-chain-(S)-2-hydroxy-acid oxidase activity(GO:0052852) long-chain-(S)-2-hydroxy-long-chain-acid oxidase activity(GO:0052853) medium-chain-(S)-2-hydroxy-acid oxidase activity(GO:0052854) |
| 0.2 | 3.2 | GO:0005089 | Rho guanyl-nucleotide exchange factor activity(GO:0005089) |
| 0.2 | 0.5 | GO:0097617 | annealing helicase activity(GO:0036310) annealing activity(GO:0097617) |
| 0.2 | 0.6 | GO:0004729 | oxygen-dependent protoporphyrinogen oxidase activity(GO:0004729) protoporphyrinogen oxidase activity(GO:0070818) |
| 0.2 | 1.2 | GO:0003999 | adenine phosphoribosyltransferase activity(GO:0003999) |
| 0.1 | 1.5 | GO:0004312 | fatty acid synthase activity(GO:0004312) |
| 0.1 | 0.4 | GO:1990404 | protein ADP-ribosylase activity(GO:1990404) |
| 0.1 | 0.7 | GO:0004478 | methionine adenosyltransferase activity(GO:0004478) |
| 0.1 | 1.8 | GO:0015112 | nitrate transmembrane transporter activity(GO:0015112) |
| 0.1 | 0.3 | GO:0004484 | mRNA guanylyltransferase activity(GO:0004484) polynucleotide 5'-phosphatase activity(GO:0004651) RNA guanylyltransferase activity(GO:0008192) |
| 0.1 | 0.4 | GO:0004134 | 4-alpha-glucanotransferase activity(GO:0004134) |
| 0.1 | 1.7 | GO:0031176 | endo-1,4-beta-xylanase activity(GO:0031176) |
| 0.1 | 0.8 | GO:0045547 | dehydrodolichyl diphosphate synthase activity(GO:0045547) |
| 0.1 | 4.5 | GO:0005200 | structural constituent of cytoskeleton(GO:0005200) |
| 0.1 | 0.5 | GO:0004075 | biotin carboxylase activity(GO:0004075) |
| 0.1 | 0.7 | GO:0008835 | diaminohydroxyphosphoribosylaminopyrimidine deaminase activity(GO:0008835) |
| 0.1 | 4.3 | GO:0004089 | carbonate dehydratase activity(GO:0004089) |
| 0.1 | 1.7 | GO:0097599 | xylan 1,4-beta-xylosidase activity(GO:0009044) alpha-L-arabinofuranosidase activity(GO:0046556) xylanase activity(GO:0097599) |
| 0.1 | 0.7 | GO:0005354 | galactose transmembrane transporter activity(GO:0005354) |
| 0.1 | 1.2 | GO:0016646 | oxidoreductase activity, acting on the CH-NH group of donors, NAD or NADP as acceptor(GO:0016646) |
| 0.1 | 0.9 | GO:0048487 | beta-tubulin binding(GO:0048487) |
| 0.1 | 0.8 | GO:0009884 | cytokinin receptor activity(GO:0009884) |
| 0.1 | 0.4 | GO:0004353 | glutamate dehydrogenase [NAD(P)+] activity(GO:0004353) |
| 0.1 | 0.4 | GO:0034596 | phosphatidylinositol phosphate 4-phosphatase activity(GO:0034596) phosphatidylinositol-4-phosphate phosphatase activity(GO:0043812) |
| 0.1 | 0.4 | GO:0008330 | protein tyrosine/threonine phosphatase activity(GO:0008330) |
| 0.1 | 0.8 | GO:0032977 | membrane insertase activity(GO:0032977) |
| 0.1 | 0.5 | GO:0001227 | transcriptional repressor activity, RNA polymerase II transcription regulatory region sequence-specific binding(GO:0001227) |
| 0.1 | 0.6 | GO:0008964 | phosphoenolpyruvate carboxylase activity(GO:0008964) |
| 0.1 | 0.8 | GO:0015098 | molybdate ion transmembrane transporter activity(GO:0015098) |
| 0.1 | 0.5 | GO:0050664 | NAD(P)H oxidase activity(GO:0016174) oxidoreductase activity, acting on NAD(P)H, oxygen as acceptor(GO:0050664) |
| 0.1 | 0.3 | GO:0052635 | C-20 gibberellin 2-beta-dioxygenase activity(GO:0052635) |
| 0.1 | 1.0 | GO:0008506 | sucrose:proton symporter activity(GO:0008506) |
| 0.1 | 0.6 | GO:0042879 | phosphoglycerate transmembrane transporter activity(GO:0015120) aldonate transmembrane transporter activity(GO:0042879) |
| 0.1 | 1.1 | GO:0016161 | beta-amylase activity(GO:0016161) |
| 0.1 | 2.0 | GO:0005199 | structural constituent of cell wall(GO:0005199) |
| 0.1 | 4.1 | GO:0000156 | phosphorelay response regulator activity(GO:0000156) |
| 0.1 | 0.5 | GO:0015446 | arsenite secondary active transmembrane transporter activity(GO:0008490) arsenite-transmembrane transporting ATPase activity(GO:0015446) anion transmembrane-transporting ATPase activity(GO:0043225) cadmium ion binding(GO:0046870) |
| 0.1 | 0.4 | GO:0004048 | anthranilate phosphoribosyltransferase activity(GO:0004048) |
| 0.1 | 0.7 | GO:0010011 | auxin binding(GO:0010011) |
| 0.1 | 0.3 | GO:1990883 | rRNA cytidine N-acetyltransferase activity(GO:1990883) |
| 0.1 | 0.8 | GO:0015923 | alpha-mannosidase activity(GO:0004559) mannosidase activity(GO:0015923) |
| 0.1 | 0.7 | GO:0003968 | RNA-directed RNA polymerase activity(GO:0003968) |
| 0.1 | 0.5 | GO:1902388 | ceramide transporter activity(GO:0035620) sphingolipid transporter activity(GO:0046624) ceramide 1-phosphate binding(GO:1902387) ceramide 1-phosphate transporter activity(GO:1902388) |
| 0.1 | 0.4 | GO:0004820 | glycine-tRNA ligase activity(GO:0004820) |
| 0.1 | 3.8 | GO:0008171 | O-methyltransferase activity(GO:0008171) |
| 0.1 | 5.7 | GO:0004650 | polygalacturonase activity(GO:0004650) |
| 0.1 | 0.3 | GO:0019789 | SUMO transferase activity(GO:0019789) |
| 0.1 | 0.4 | GO:1990825 | sequence-specific mRNA binding(GO:1990825) |
| 0.1 | 0.3 | GO:0016707 | gibberellin 3-beta-dioxygenase activity(GO:0016707) |
| 0.1 | 0.3 | GO:0047150 | S-adenosylmethionine-homocysteine S-methyltransferase activity(GO:0008898) betaine-homocysteine S-methyltransferase activity(GO:0047150) |
| 0.1 | 0.3 | GO:0015018 | galactosylgalactosylxylosylprotein 3-beta-glucuronosyltransferase activity(GO:0015018) |
| 0.1 | 1.1 | GO:0000822 | inositol hexakisphosphate binding(GO:0000822) |
| 0.1 | 0.5 | GO:0004663 | Rab geranylgeranyltransferase activity(GO:0004663) |
| 0.1 | 1.5 | GO:0016251 | obsolete general RNA polymerase II transcription factor activity(GO:0016251) |
| 0.1 | 0.6 | GO:0051185 | S-adenosyl-L-methionine transmembrane transporter activity(GO:0000095) coenzyme transporter activity(GO:0051185) |
| 0.1 | 1.1 | GO:0050308 | sugar-phosphatase activity(GO:0050308) |
| 0.1 | 1.1 | GO:0016872 | intramolecular lyase activity(GO:0016872) |
| 0.1 | 1.9 | GO:0004565 | beta-galactosidase activity(GO:0004565) |
| 0.1 | 1.5 | GO:0003843 | 1,3-beta-D-glucan synthase activity(GO:0003843) |
| 0.1 | 0.3 | GO:0008297 | single-stranded DNA exodeoxyribonuclease activity(GO:0008297) |
| 0.1 | 0.2 | GO:0051377 | mannose-ethanolamine phosphotransferase activity(GO:0051377) |
| 0.1 | 0.5 | GO:0005047 | signal recognition particle binding(GO:0005047) |
| 0.1 | 0.5 | GO:0005452 | inorganic anion exchanger activity(GO:0005452) |
| 0.1 | 0.4 | GO:0015181 | arginine transmembrane transporter activity(GO:0015181) L-lysine transmembrane transporter activity(GO:0015189) |
| 0.1 | 0.9 | GO:0070567 | cytidylyltransferase activity(GO:0070567) |
| 0.1 | 0.5 | GO:0016774 | phosphotransferase activity, carboxyl group as acceptor(GO:0016774) |
| 0.1 | 0.5 | GO:0015035 | protein disulfide oxidoreductase activity(GO:0015035) |
| 0.1 | 0.3 | GO:0002151 | G-quadruplex RNA binding(GO:0002151) |
| 0.1 | 0.2 | GO:0000225 | N-acetylglucosaminylphosphatidylinositol deacetylase activity(GO:0000225) |
| 0.1 | 1.3 | GO:0035250 | UDP-galactosyltransferase activity(GO:0035250) |
| 0.1 | 0.3 | GO:0045502 | dynein binding(GO:0045502) dynein intermediate chain binding(GO:0045505) dynein light intermediate chain binding(GO:0051959) |
| 0.1 | 1.0 | GO:0042300 | beta-amyrin synthase activity(GO:0042300) |
| 0.1 | 0.9 | GO:0004029 | aldehyde dehydrogenase (NAD) activity(GO:0004029) |
| 0.1 | 0.5 | GO:1904680 | oligopeptide transmembrane transporter activity(GO:0035673) peptide transmembrane transporter activity(GO:1904680) |
| 0.1 | 1.3 | GO:0008143 | poly(A) binding(GO:0008143) |
| 0.1 | 0.6 | GO:0008574 | ATP-dependent microtubule motor activity, plus-end-directed(GO:0008574) |
| 0.1 | 2.4 | GO:0033612 | receptor serine/threonine kinase binding(GO:0033612) |
| 0.1 | 0.4 | GO:0015145 | monosaccharide transmembrane transporter activity(GO:0015145) |
| 0.1 | 0.5 | GO:0000285 | 1-phosphatidylinositol-3-phosphate 5-kinase activity(GO:0000285) |
| 0.1 | 0.5 | GO:0000774 | adenyl-nucleotide exchange factor activity(GO:0000774) |
| 0.1 | 1.7 | GO:0015205 | nucleobase transmembrane transporter activity(GO:0015205) |
| 0.1 | 0.5 | GO:0004096 | catalase activity(GO:0004096) |
| 0.1 | 2.3 | GO:0003727 | single-stranded RNA binding(GO:0003727) |
| 0.1 | 0.3 | GO:0016731 | oxidoreductase activity, acting on iron-sulfur proteins as donors, NAD or NADP as acceptor(GO:0016731) |
| 0.0 | 0.3 | GO:0015140 | malate transmembrane transporter activity(GO:0015140) |
| 0.0 | 0.2 | GO:0004679 | AMP-activated protein kinase activity(GO:0004679) |
| 0.0 | 0.5 | GO:0016682 | oxidoreductase activity, acting on diphenols and related substances as donors, oxygen as acceptor(GO:0016682) |
| 0.0 | 1.8 | GO:0043022 | ribosome binding(GO:0043022) |
| 0.0 | 0.2 | GO:0016436 | rRNA (uridine) methyltransferase activity(GO:0016436) rRNA (uridine-N3-)-methyltransferase activity(GO:0070042) |
| 0.0 | 0.2 | GO:0003987 | acetate-CoA ligase activity(GO:0003987) |
| 0.0 | 1.0 | GO:0080031 | methyl salicylate esterase activity(GO:0080031) methyl jasmonate esterase activity(GO:0080032) |
| 0.0 | 0.2 | GO:0080042 | ADP-glucose pyrophosphohydrolase activity(GO:0080042) |
| 0.0 | 2.0 | GO:0003755 | peptidyl-prolyl cis-trans isomerase activity(GO:0003755) |
| 0.0 | 0.3 | GO:1990538 | xylan O-acetyltransferase activity(GO:1990538) |
| 0.0 | 0.2 | GO:0003680 | AT DNA binding(GO:0003680) |
| 0.0 | 0.4 | GO:0016884 | carbon-nitrogen ligase activity, with glutamine as amido-N-donor(GO:0016884) |
| 0.0 | 0.1 | GO:0004826 | phenylalanine-tRNA ligase activity(GO:0004826) |
| 0.0 | 0.2 | GO:0034432 | bis(5'-adenosyl)-pentaphosphatase activity(GO:0034432) |
| 0.0 | 0.6 | GO:0016844 | strictosidine synthase activity(GO:0016844) |
| 0.0 | 0.8 | GO:0042973 | glucan endo-1,3-beta-D-glucosidase activity(GO:0042973) |
| 0.0 | 0.2 | GO:0019825 | oxygen binding(GO:0019825) |
| 0.0 | 0.6 | GO:0004144 | diacylglycerol O-acyltransferase activity(GO:0004144) |
| 0.0 | 0.4 | GO:0016538 | cyclin-dependent protein serine/threonine kinase regulator activity(GO:0016538) |
| 0.0 | 0.3 | GO:0004143 | diacylglycerol kinase activity(GO:0004143) |
| 0.0 | 0.4 | GO:0000210 | NAD+ diphosphatase activity(GO:0000210) |
| 0.0 | 1.3 | GO:0005179 | hormone activity(GO:0005179) |
| 0.0 | 0.6 | GO:0016157 | sucrose synthase activity(GO:0016157) |
| 0.0 | 0.6 | GO:0070628 | proteasome binding(GO:0070628) |
| 0.0 | 0.4 | GO:0047938 | glucose-6-phosphate 1-epimerase activity(GO:0047938) |
| 0.0 | 0.7 | GO:0008175 | tRNA methyltransferase activity(GO:0008175) |
| 0.0 | 2.1 | GO:0016866 | intramolecular transferase activity(GO:0016866) |
| 0.0 | 4.0 | GO:0004252 | serine-type endopeptidase activity(GO:0004252) |
| 0.0 | 0.7 | GO:0030276 | clathrin binding(GO:0030276) |
| 0.0 | 4.8 | GO:0008017 | microtubule binding(GO:0008017) |
| 0.0 | 0.2 | GO:0033836 | flavonol 7-O-beta-glucosyltransferase activity(GO:0033836) |
| 0.0 | 0.4 | GO:0016274 | arginine N-methyltransferase activity(GO:0016273) protein-arginine N-methyltransferase activity(GO:0016274) |
| 0.0 | 0.4 | GO:0004930 | G-protein coupled receptor activity(GO:0004930) |
| 0.0 | 0.2 | GO:0052658 | inositol-1,4,5-trisphosphate 5-phosphatase activity(GO:0052658) |
| 0.0 | 0.1 | GO:0070259 | tyrosyl-DNA phosphodiesterase activity(GO:0070259) |
| 0.0 | 0.2 | GO:0033897 | ribonuclease T2 activity(GO:0033897) |
| 0.0 | 3.1 | GO:0004857 | enzyme inhibitor activity(GO:0004857) |
| 0.0 | 0.4 | GO:0015095 | magnesium ion transmembrane transporter activity(GO:0015095) |
| 0.0 | 0.2 | GO:0016621 | cinnamoyl-CoA reductase activity(GO:0016621) |
| 0.0 | 0.4 | GO:0008327 | methyl-CpG binding(GO:0008327) |
| 0.0 | 0.4 | GO:0030060 | L-malate dehydrogenase activity(GO:0030060) |
| 0.0 | 1.1 | GO:0050135 | NAD(P)+ nucleosidase activity(GO:0050135) |
| 0.0 | 0.3 | GO:0035198 | miRNA binding(GO:0035198) |
| 0.0 | 0.1 | GO:0004362 | glutathione-disulfide reductase activity(GO:0004362) |
| 0.0 | 0.5 | GO:0003688 | DNA replication origin binding(GO:0003688) |
| 0.0 | 0.5 | GO:0043295 | glutathione binding(GO:0043295) oligopeptide binding(GO:1900750) |
| 0.0 | 1.4 | GO:0008080 | N-acetyltransferase activity(GO:0008080) |
| 0.0 | 0.2 | GO:0016863 | intramolecular oxidoreductase activity, transposing C=C bonds(GO:0016863) |
| 0.0 | 0.6 | GO:0031490 | chromatin DNA binding(GO:0031490) |
| 0.0 | 1.1 | GO:0004523 | RNA-DNA hybrid ribonuclease activity(GO:0004523) |
| 0.0 | 0.4 | GO:0030983 | mismatched DNA binding(GO:0030983) |
| 0.0 | 0.2 | GO:0008453 | alanine-glyoxylate transaminase activity(GO:0008453) |
| 0.0 | 0.4 | GO:0008641 | small protein activating enzyme activity(GO:0008641) |
| 0.0 | 0.1 | GO:0008661 | 1-deoxy-D-xylulose-5-phosphate synthase activity(GO:0008661) |
| 0.0 | 0.7 | GO:0005385 | zinc ion transmembrane transporter activity(GO:0005385) |
| 0.0 | 5.9 | GO:0000981 | RNA polymerase II transcription factor activity, sequence-specific DNA binding(GO:0000981) |
| 0.0 | 0.1 | GO:0036440 | citrate (Si)-synthase activity(GO:0004108) citrate synthase activity(GO:0036440) |
| 0.0 | 0.2 | GO:0016308 | 1-phosphatidylinositol-4-phosphate 5-kinase activity(GO:0016308) |
| 0.0 | 0.2 | GO:0009815 | 1-aminocyclopropane-1-carboxylate oxidase activity(GO:0009815) |
| 0.0 | 2.1 | GO:0009055 | electron carrier activity(GO:0009055) |
| 0.0 | 0.8 | GO:0003993 | acid phosphatase activity(GO:0003993) |
| 0.0 | 0.1 | GO:0015631 | tubulin binding(GO:0015631) |
| 0.0 | 0.7 | GO:0016759 | cellulose synthase activity(GO:0016759) |
| 0.0 | 2.0 | GO:0030246 | carbohydrate binding(GO:0030246) |
| 0.0 | 2.3 | GO:0042803 | protein homodimerization activity(GO:0042803) |
| 0.0 | 0.2 | GO:0015174 | basic amino acid transmembrane transporter activity(GO:0015174) |
| 0.0 | 0.0 | GO:0047364 | desulfoglucosinolate sulfotransferase activity(GO:0047364) |
| 0.0 | 0.2 | GO:0008375 | acetylglucosaminyltransferase activity(GO:0008375) |
| 0.0 | 0.1 | GO:0003918 | DNA topoisomerase type II (ATP-hydrolyzing) activity(GO:0003918) DNA topoisomerase II activity(GO:0061505) |
| 0.0 | 0.1 | GO:0003689 | DNA clamp loader activity(GO:0003689) protein-DNA loading ATPase activity(GO:0033170) |
| 0.0 | 3.3 | GO:0003735 | structural constituent of ribosome(GO:0003735) |
| 0.0 | 0.1 | GO:0004714 | transmembrane receptor protein tyrosine kinase activity(GO:0004714) |
Gene overrepresentation in curated gene sets: canonical pathways category:
| Log-likelihood per target | Total log-likelihood | Term | Description |
|---|---|---|---|
| 0.3 | 1.0 | PID IL8 CXCR1 PATHWAY | IL8- and CXCR1-mediated signaling events |
| 0.3 | 0.9 | PID IL12 2PATHWAY | IL12-mediated signaling events |
| 0.2 | 1.1 | PID P53 REGULATION PATHWAY | p53 pathway |
| 0.2 | 1.2 | NABA MATRISOME ASSOCIATED | Ensemble of genes encoding ECM-associated proteins including ECM-affilaited proteins, ECM regulators and secreted factors |
| 0.2 | 1.5 | PID MYC ACTIV PATHWAY | Validated targets of C-MYC transcriptional activation |
| 0.2 | 1.4 | PID HIF1 TFPATHWAY | HIF-1-alpha transcription factor network |
| 0.1 | 0.4 | SA CASPASE CASCADE | Apoptosis is mediated by caspases, cysteine proteases arranged in a proteolytic cascade. |
| 0.1 | 0.5 | PID ERA GENOMIC PATHWAY | Validated nuclear estrogen receptor alpha network |
| 0.1 | 0.5 | ST FAS SIGNALING PATHWAY | Fas Signaling Pathway |
| 0.1 | 0.8 | NABA CORE MATRISOME | Ensemble of genes encoding core extracellular matrix including ECM glycoproteins, collagens and proteoglycans |
| 0.1 | 0.6 | PID P53 DOWNSTREAM PATHWAY | Direct p53 effectors |
Gene overrepresentation in curated gene sets: REACTOME pathways category:
| Log-likelihood per target | Total log-likelihood | Term | Description |
|---|---|---|---|
| 0.5 | 2.4 | REACTOME DOPAMINE NEUROTRANSMITTER RELEASE CYCLE | Genes involved in Dopamine Neurotransmitter Release Cycle |
| 0.5 | 1.4 | REACTOME PURINE METABOLISM | Genes involved in Purine metabolism |
| 0.3 | 1.0 | REACTOME IL 6 SIGNALING | Genes involved in Interleukin-6 signaling |
| 0.3 | 0.9 | REACTOME MHC CLASS II ANTIGEN PRESENTATION | Genes involved in MHC class II antigen presentation |
| 0.3 | 1.5 | REACTOME G1 S SPECIFIC TRANSCRIPTION | Genes involved in G1/S-Specific Transcription |
| 0.2 | 0.6 | REACTOME ABACAVIR TRANSPORT AND METABOLISM | Genes involved in Abacavir transport and metabolism |
| 0.2 | 1.0 | REACTOME GOLGI ASSOCIATED VESICLE BIOGENESIS | Genes involved in Golgi Associated Vesicle Biogenesis |
| 0.2 | 1.5 | REACTOME RNA POL II PRE TRANSCRIPTION EVENTS | Genes involved in RNA Polymerase II Pre-transcription Events |
| 0.2 | 0.5 | REACTOME G2 M DNA DAMAGE CHECKPOINT | Genes involved in G2/M DNA damage checkpoint |
| 0.2 | 0.8 | REACTOME GLUCOSE TRANSPORT | Genes involved in Glucose transport |
| 0.1 | 0.4 | REACTOME TRANSCRIPTIONAL ACTIVITY OF SMAD2 SMAD3 SMAD4 HETEROTRIMER | Genes involved in Transcriptional activity of SMAD2/SMAD3:SMAD4 heterotrimer |
| 0.1 | 1.1 | REACTOME ASPARAGINE N LINKED GLYCOSYLATION | Genes involved in Asparagine N-linked glycosylation |
| 0.1 | 0.7 | REACTOME UNWINDING OF DNA | Genes involved in Unwinding of DNA |
| 0.1 | 0.6 | REACTOME ANTIVIRAL MECHANISM BY IFN STIMULATED GENES | Genes involved in Antiviral mechanism by IFN-stimulated genes |
| 0.1 | 0.3 | REACTOME E2F ENABLED INHIBITION OF PRE REPLICATION COMPLEX FORMATION | Genes involved in E2F-enabled inhibition of pre-replication complex formation |
| 0.1 | 1.0 | REACTOME ABCA TRANSPORTERS IN LIPID HOMEOSTASIS | Genes involved in ABCA transporters in lipid homeostasis |
| 0.1 | 0.3 | REACTOME GENERIC TRANSCRIPTION PATHWAY | Genes involved in Generic Transcription Pathway |
| 0.0 | 0.2 | REACTOME CHEMOKINE RECEPTORS BIND CHEMOKINES | Genes involved in Chemokine receptors bind chemokines |
| 0.0 | 0.2 | REACTOME ACTIVATION OF THE MRNA UPON BINDING OF THE CAP BINDING COMPLEX AND EIFS AND SUBSEQUENT BINDING TO 43S | Genes involved in Activation of the mRNA upon binding of the cap-binding complex and eIFs, and subsequent binding to 43S |
| 0.0 | 0.1 | REACTOME MEIOTIC RECOMBINATION | Genes involved in Meiotic Recombination |