Project
GSE43616: Time-course of wild-type Arabidopsis leaf
Navigation
Downloads
Results for AT3G14180
Z-value: 0.04
Transcription factors associated with AT3G14180
| Gene Symbol | Gene ID | Gene Info |
|---|---|---|
|
AT3G14180
|
AT3G14180 | sequence-specific DNA binding transcription factor |
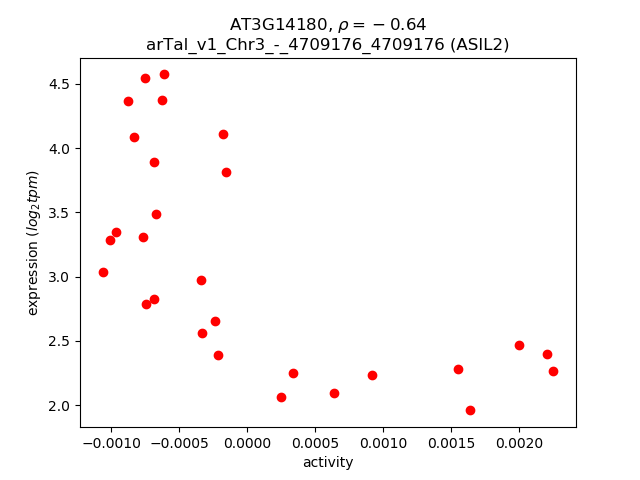
Activity-expression correlation:
| Gene | Promoter | Pearson corr. coef. | P-value | Plot |
|---|---|---|---|---|
| ASIL2 | arTal_v1_Chr3_-_4709176_4709176 | -0.64 | 2.2e-04 | Click! |
Activity profile of AT3G14180 motif
Sorted Z-values of AT3G14180 motif
| Promoter | Log-likelihood | Transcript | Gene | Gene Info |
|---|---|---|---|---|
| arTal_v1_Chr1_+_27076020_27076020 | 0.04 |
AT1G71930.1
|
VND7
|
vascular related NAC-domain protein 7 |
| arTal_v1_Chr1_+_27074702_27074702 | 0.03 |
AT1G71930.2
|
VND7
|
vascular related NAC-domain protein 7 |
| arTal_v1_Chr2_-_12996012_12996012 | 0.02 |
AT2G30490.1
|
C4H
|
cinnamate-4-hydroxylase |
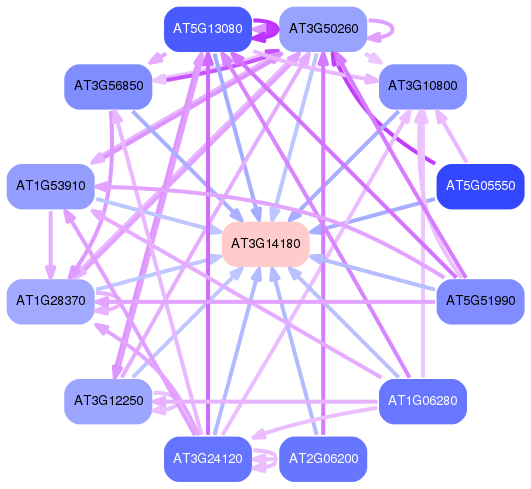
Network of associatons between targets according to the STRING database.
