Project
GSE43616: Time-course of wild-type Arabidopsis leaf
Navigation
Downloads
Results for AT3G10113
Z-value: 1.01
Transcription factors associated with AT3G10113
| Gene Symbol | Gene ID | Gene Info |
|---|---|---|
|
AT3G10113
|
AT3G10113 | Homeodomain-like superfamily protein |
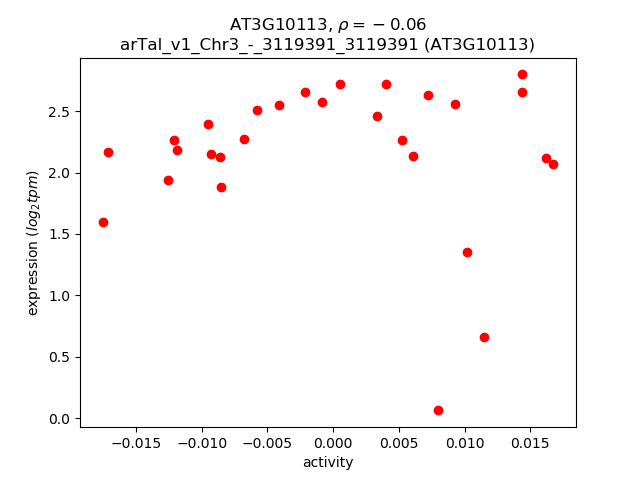
Activity-expression correlation:
| Gene | Promoter | Pearson corr. coef. | P-value | Plot |
|---|---|---|---|---|
| AT3G10113 | arTal_v1_Chr3_-_3119391_3119391 | -0.06 | 7.4e-01 | Click! |
Activity profile of AT3G10113 motif
Sorted Z-values of AT3G10113 motif
| Promoter | Log-likelihood | Transcript | Gene | Gene Info |
|---|---|---|---|---|
| arTal_v1_Chr3_-_21189859_21189967 | 4.23 |
AT3G57260.1
AT3G57260.2 |
BGL2
|
beta-1,3-glucanase 2 |
| arTal_v1_Chr1_+_20387058_20387058 | 4.09 |
AT1G54575.1
|
AT1G54575
|
hypothetical protein |
| arTal_v1_Chr3_-_6258426_6258426 | 4.06 |
AT3G18250.1
|
AT3G18250
|
Putative membrane lipoprotein |
| arTal_v1_Chr1_+_20386809_20386809 | 3.93 |
AT1G54575.2
|
AT1G54575
|
hypothetical protein |
| arTal_v1_Chr2_+_7845923_7845999 | 3.92 |
AT2G18050.2
AT2G18050.1 |
HIS1-3
|
histone H1-3 |
| arTal_v1_Chr4_+_8392825_8392825 | 3.79 |
AT4G14630.1
|
GLP9
|
germin-like protein 9 |
| arTal_v1_Chr2_-_6242541_6242541 | 3.78 |
AT2G14610.1
|
PR1
|
pathogenesis-related protein 1 |
| arTal_v1_Chr3_-_20769324_20769410 | 3.66 |
AT3G55970.2
AT3G55970.1 |
JRG21
|
jasmonate-regulated gene 21 |
| arTal_v1_Chr4_+_8908763_8908879 | 3.54 |
AT4G15610.1
AT4G15610.2 |
AT4G15610
|
Uncharacterized protein family (UPF0497) |
| arTal_v1_Chr1_-_27548282_27548282 | 3.50 |
AT1G73260.1
|
KTI1
|
kunitz trypsin inhibitor 1 |
| arTal_v1_Chr2_+_12600914_12601033 | 3.48 |
AT2G29350.2
AT2G29350.1 AT2G29350.3 |
SAG13
|
senescence-associated gene 13 |
| arTal_v1_Chr1_+_30150897_30151006 | 3.48 |
AT1G80160.3
AT1G80160.1 AT1G80160.2 |
GLYI7
|
Lactoylglutathione lyase / glyoxalase I family protein |
| arTal_v1_Chr4_+_285876_285876 | 3.43 |
AT4G00700.2
AT4G00700.1 |
AT4G00700
|
C2 calcium/lipid-binding plant phosphoribosyltransferase family protein |
| arTal_v1_Chr4_-_12337599_12337599 | 3.37 |
AT4G23680.1
|
AT4G23680
|
Polyketide cyclase/dehydrase and lipid transport superfamily protein |
| arTal_v1_Chr2_+_18641563_18641563 | 3.34 |
AT2G45210.1
|
SAUR36
|
SAUR-like auxin-responsive protein family |
| arTal_v1_Chr3_-_2849686_2849686 | 3.31 |
AT3G09270.1
|
GSTU8
|
glutathione S-transferase TAU 8 |
| arTal_v1_Chr1_-_11668690_11668690 | 3.30 |
AT1G32350.1
AT1G32350.2 |
AOX1D
|
alternative oxidase 1D |
| arTal_v1_Chr2_-_13101371_13101371 | 3.30 |
AT2G30750.1
|
CYP71A12
|
cytochrome P450 family 71 polypeptide |
| arTal_v1_Chr3_+_9208861_9208941 | 3.30 |
AT3G25290.1
AT3G25290.2 |
AT3G25290
|
Auxin-responsive family protein |
| arTal_v1_Chr4_+_17855637_17855637 | 3.29 |
AT4G37990.1
|
ELI3-2
|
cinnamyl alcohol dehydrogenase 8 |
| arTal_v1_Chr4_+_6491017_6491017 | 3.28 |
AT4G10500.1
|
AT4G10500
|
2-oxoglutarate (2OG) and Fe(II)-dependent oxygenase superfamily protein |
| arTal_v1_Chr5_+_3358787_3358787 | 3.26 |
AT5G10625.1
|
AT5G10625
|
flowering-promoting factor-like protein |
| arTal_v1_Chr1_+_2984829_2984829 | 3.26 |
AT1G09240.1
|
NAS3
|
nicotianamine synthase 3 |
| arTal_v1_Chr2_+_6213972_6213972 | 3.24 |
AT2G14560.2
AT2G14560.1 |
LURP1
|
LURP-one-like protein (DUF567) |
| arTal_v1_Chr1_-_17076417_17076417 | 3.22 |
AT1G45145.1
|
TRX5
|
thioredoxin H-type 5 |
| arTal_v1_Chr3_-_16923299_16923299 | 3.20 |
AT3G46080.1
|
AT3G46080
|
C2H2-type zinc finger family protein |
| arTal_v1_Chr3_+_5234457_5234457 | 3.18 |
AT3G15500.1
|
NAC3
|
NAC domain containing protein 3 |
| arTal_v1_Chr1_-_24433165_24433165 | 3.18 |
AT1G65690.1
|
AT1G65690
|
Late embryogenesis abundant (LEA) hydroxyproline-rich glycoprotein family |
| arTal_v1_Chr2_-_18781973_18781973 | 3.17 |
AT2G45570.1
|
CYP76C2
|
cytochrome P450, family 76, subfamily C, polypeptide 2 |
| arTal_v1_Chr2_+_6213617_6213676 | 3.16 |
AT2G14560.3
AT2G14560.4 |
LURP1
|
LURP-one-like protein (DUF567) |
| arTal_v1_Chr5_-_15859911_15859911 | 3.15 |
AT5G39610.1
|
NAC6
|
NAC domain containing protein 6 |
| arTal_v1_Chr3_+_19239305_19239412 | 3.14 |
AT3G51860.1
AT3G51860.2 |
CAX3
|
cation exchanger 3 |
| arTal_v1_Chr1_-_1559917_1559917 | 3.13 |
AT1G05340.1
|
AT1G05340
|
cysteine-rich TM module stress tolerance protein |
| arTal_v1_Chr4_-_12853845_12853845 | 3.11 |
AT4G25000.1
|
AMY1
|
alpha-amylase-like protein |
| arTal_v1_Chr2_+_7606728_7606905 | 3.05 |
AT2G17500.2
AT2G17500.1 AT2G17500.3 AT2G17500.4 |
AT2G17500
|
Auxin efflux carrier family protein |
| arTal_v1_Chr5_-_2176446_2176446 | 3.03 |
AT5G07010.1
|
ST2A
|
sulfotransferase 2A |
| arTal_v1_Chr3_+_11033665_11033665 | 3.01 |
AT3G29035.1
|
NAC3
|
NAC domain containing protein 3 |
| arTal_v1_Chr1_+_25426234_25426234 | 3.01 |
AT1G67810.1
|
SUFE2
|
sulfur E2 |
| arTal_v1_Chr3_-_4762457_4762457 | 3.01 |
AT3G14280.1
|
AT3G14280
|
LL-diaminopimelate aminotransferase |
| arTal_v1_Chr2_-_18646606_18646606 | 2.98 |
AT2G45220.1
|
AT2G45220
|
Plant invertase/pectin methylesterase inhibitor superfamily |
| arTal_v1_Chr3_+_4374214_4374214 | 2.98 |
AT3G13433.1
|
AT3G13433
|
transmembrane protein |
| arTal_v1_Chr3_-_2699257_2699257 | 2.97 |
AT3G08860.2
|
PYD4
|
PYRIMIDINE 4 |
| arTal_v1_Chr4_+_15828228_15828228 | 2.93 |
AT4G32810.1
AT4G32810.2 |
CCD8
|
carotenoid cleavage dioxygenase 8 |
| arTal_v1_Chr2_-_11295918_11295918 | 2.89 |
AT2G26560.1
|
PLA2A
|
phospholipase A 2A |
| arTal_v1_Chr3_-_2699420_2699420 | 2.88 |
AT3G08860.1
|
PYD4
|
PYRIMIDINE 4 |
| arTal_v1_Chr2_+_19375985_19375985 | 2.87 |
AT2G47190.1
|
MYB2
|
myb domain protein 2 |
| arTal_v1_Chr5_-_8659352_8659352 | 2.85 |
AT5G25110.1
|
CIPK25
|
CBL-interacting protein kinase 25 |
| arTal_v1_Chr3_-_9575215_9575215 | 2.85 |
AT3G26170.1
|
CYP71B19
|
cytochrome P450, family 71, subfamily B, polypeptide 19 |
| arTal_v1_Chr2_+_13674255_13674398 | 2.84 |
AT2G32190.2
AT2G32190.1 |
AT2G32190
|
cysteine-rich/transmembrane domain A-like protein |
| arTal_v1_Chr2_+_18289824_18289824 | 2.78 |
AT2G44240.1
|
AT2G44240
|
NEP-interacting protein (DUF239) |
| arTal_v1_Chr3_-_23410360_23410360 | 2.76 |
AT3G63380.1
|
AT3G63380
|
ATPase E1-E2 type family protein / haloacid dehalogenase-like hydrolase family protein |
| arTal_v1_Chr3_-_826585_826585 | 2.75 |
AT3G03470.1
|
CYP89A9
|
cytochrome P450, family 87, subfamily A, polypeptide 9 |
| arTal_v1_Chr5_-_216773_216773 | 2.74 |
AT5G01550.1
|
LECRKA4.2
|
lectin receptor kinase a4.1 |
| arTal_v1_Chr3_+_4603885_4603885 | 2.74 |
AT3G13950.1
|
AT3G13950
|
ankyrin |
| arTal_v1_Chr5_-_6042938_6043014 | 2.74 |
AT5G18270.2
AT5G18270.1 |
ANAC087
|
NAC domain containing protein 87 |
| arTal_v1_Chr4_+_10974456_10974510 | 2.73 |
AT4G20320.2
AT4G20320.4 AT4G20320.3 AT4G20320.1 AT4G20320.5 AT4G20320.6 |
AT4G20320
|
CTP synthase family protein |
| arTal_v1_Chr1_+_10892445_10892445 | 2.73 |
AT1G30700.1
|
AT1G30700
|
FAD-binding Berberine family protein |
| arTal_v1_Chr1_-_5133860_5133860 | 2.73 |
AT1G14880.1
|
PCR1
|
PLANT CADMIUM RESISTANCE 1 |
| arTal_v1_Chr2_+_8097420_8097420 | 2.72 |
AT2G18690.2
AT2G18690.1 |
AT2G18690
|
transmembrane protein |
| arTal_v1_Chr1_-_16789436_16789436 | 2.72 |
AT1G44130.1
|
AT1G44130
|
Eukaryotic aspartyl protease family protein |
| arTal_v1_Chr1_+_5290747_5290747 | 2.71 |
AT1G15380.2
|
GLYI4
|
Lactoylglutathione lyase / glyoxalase I family protein |
| arTal_v1_Chr5_-_21265460_21265460 | 2.70 |
AT5G52390.1
|
AT5G52390
|
PAR1 protein |
| arTal_v1_Chr5_-_23896702_23896702 | 2.70 |
AT5G59220.2
|
HAI1
|
PP2C protein (Clade A protein phosphatases type 2C) |
| arTal_v1_Chr5_+_2204206_2204248 | 2.70 |
AT5G07100.5
AT5G07100.3 AT5G07100.4 AT5G07100.2 AT5G07100.1 |
WRKY26
|
WRKY DNA-binding protein 26 |
| arTal_v1_Chr4_-_7406994_7406994 | 2.70 |
AT4G12480.1
|
EARLI1
|
Bifunctional inhibitor/lipid-transfer protein/seed storage 2S albumin superfamily protein |
| arTal_v1_Chr3_-_7999552_7999552 | 2.69 |
AT3G22560.1
|
AT3G22560
|
Acyl-CoA N-acyltransferases (NAT) superfamily protein |
| arTal_v1_Chr1_-_19698482_19698482 | 2.69 |
AT1G52890.1
|
NAC019
|
NAC domain containing protein 19 |
| arTal_v1_Chr5_+_5658416_5658416 | 2.68 |
AT5G17220.1
|
GSTF12
|
glutathione S-transferase phi 12 |
| arTal_v1_Chr1_+_28177670_28177670 | 2.68 |
AT1G75040.1
|
PR5
|
pathogenesis-related protein 5 |
| arTal_v1_Chr3_+_18940643_18940643 | 2.67 |
AT3G50970.1
|
LTI30
|
dehydrin family protein |
| arTal_v1_Chr5_-_25089603_25089626 | 2.66 |
AT5G62480.3
AT5G62480.2 AT5G62480.1 |
GSTU9
|
glutathione S-transferase tau 9 |
| arTal_v1_Chr5_+_5995479_5995479 | 2.66 |
AT5G18130.2
|
AT5G18130
|
transmembrane protein |
| arTal_v1_Chr2_-_19166949_19166967 | 2.66 |
AT2G46680.2
AT2G46680.1 |
HB-7
|
homeobox 7 |
| arTal_v1_Chr3_-_4657723_4657723 | 2.65 |
AT3G14060.1
|
AT3G14060
|
hypothetical protein |
| arTal_v1_Chr1_+_3066674_3066753 | 2.65 |
AT1G09500.1
AT1G09500.2 AT1G09500.3 |
AT1G09500
|
NAD(P)-binding Rossmann-fold superfamily protein |
| arTal_v1_Chr4_-_7026224_7026224 | 2.65 |
AT4G11650.1
|
OSM34
|
osmotin 34 |
| arTal_v1_Chr5_+_5995323_5995323 | 2.64 |
AT5G18130.1
|
AT5G18130
|
transmembrane protein |
| arTal_v1_Chr5_-_23896939_23896939 | 2.64 |
AT5G59220.1
|
HAI1
|
PP2C protein (Clade A protein phosphatases type 2C) |
| arTal_v1_Chr2_-_11980003_11980003 | 2.64 |
AT2G28110.1
|
FRA8
|
Exostosin family protein |
| arTal_v1_Chr1_+_5290582_5290582 | 2.63 |
AT1G15380.1
|
GLYI4
|
Lactoylglutathione lyase / glyoxalase I family protein |
| arTal_v1_Chr1_-_460696_460831 | 2.62 |
AT1G02310.1
AT1G02310.2 |
MAN1
|
Glycosyl hydrolase superfamily protein |
| arTal_v1_Chr5_-_9247540_9247540 | 2.60 |
AT5G26340.1
|
MSS1
|
Major facilitator superfamily protein |
| arTal_v1_Chr2_-_14541617_14541617 | 2.60 |
AT2G34500.1
|
CYP710A1
|
cytochrome P450, family 710, subfamily A, polypeptide 1 |
| arTal_v1_Chr3_+_9892791_9892791 | 2.59 |
AT3G26840.1
|
PES2
|
Esterase/lipase/thioesterase family protein |
| arTal_v1_Chr2_+_6244772_6244772 | 2.59 |
AT2G14620.2
AT2G14620.3 AT2G14620.1 |
XTH10
|
xyloglucan endotransglucosylase/hydrolase 10 |
| arTal_v1_Chr2_+_7693596_7693596 | 2.59 |
AT2G17710.1
|
AT2G17710
|
Big1 |
| arTal_v1_Chr3_-_1055196_1055196 | 2.58 |
AT3G04060.1
|
NAC046
|
NAC domain containing protein 46 |
| arTal_v1_Chr5_-_4183354_4183354 | 2.56 |
AT5G13170.1
|
SAG29
|
senescence-associated gene 29 |
| arTal_v1_Chr4_+_12461907_12461907 | 2.55 |
AT4G24000.1
|
CSLG2
|
cellulose synthase like G2 |
| arTal_v1_Chr5_-_3402389_3402389 | 2.55 |
AT5G10760.1
|
AT5G10760
|
Eukaryotic aspartyl protease family protein |
| arTal_v1_Chr1_+_26651840_26651840 | 2.53 |
AT1G70690.1
|
HWI1
|
Receptor-like protein kinase-related family protein |
| arTal_v1_Chr3_-_9597927_9597927 | 2.53 |
AT3G26220.1
|
CYP71B3
|
cytochrome P450, family 71, subfamily B, polypeptide 3 |
| arTal_v1_Chr4_-_12018492_12018492 | 2.52 |
AT4G22920.1
|
NYE1
|
non-yellowing 1 |
| arTal_v1_Chr3_+_19089026_19089026 | 2.52 |
AT3G51440.1
|
AT3G51440
|
Calcium-dependent phosphotriesterase superfamily protein |
| arTal_v1_Chr4_-_12018643_12018643 | 2.51 |
AT4G22920.2
|
NYE1
|
non-yellowing 1 |
| arTal_v1_Chr3_+_22680960_22680960 | 2.50 |
AT3G61280.1
AT3G61280.2 |
AT3G61280
|
O-glucosyltransferase rumi-like protein (DUF821) |
| arTal_v1_Chr5_+_4213955_4213955 | 2.49 |
AT5G13210.1
|
AT5G13210
|
Uncharacterized conserved protein UCP015417, vWA |
| arTal_v1_Chr1_-_20385380_20385380 | 2.49 |
AT1G54570.1
|
PES1
|
Esterase/lipase/thioesterase family protein |
| arTal_v1_Chr3_-_1063103_1063234 | 2.48 |
AT3G04070.2
AT3G04070.1 |
NAC047
|
NAC domain containing protein 47 |
| arTal_v1_Chr1_-_21235292_21235292 | 2.47 |
AT1G56650.1
|
PAP1
|
production of anthocyanin pigment 1 |
| arTal_v1_Chr5_+_2938193_2938193 | 2.47 |
AT5G09440.1
|
EXL4
|
EXORDIUM like 4 |
| arTal_v1_Chr2_-_1548999_1548999 | 2.47 |
AT2G04460.1
|
AT2G04460
|
|
| arTal_v1_Chr3_+_18634546_18634546 | 2.47 |
AT3G50260.1
|
CEJ1
|
cooperatively regulated by ethylene and jasmonate 1 |
| arTal_v1_Chr1_+_9378404_9378404 | 2.46 |
AT1G27020.1
|
AT1G27020
|
plant/protein |
| arTal_v1_Chr1_-_3756998_3756998 | 2.45 |
AT1G11210.1
|
AT1G11210
|
cotton fiber protein, putative (DUF761) |
| arTal_v1_Chr3_-_7576623_7576721 | 2.45 |
AT3G21500.1
AT3G21500.3 AT3G21500.2 |
DXPS1
|
1-deoxy-D-xylulose 5-phosphate synthase 1 |
| arTal_v1_Chr4_-_15903523_15903523 | 2.45 |
AT4G32940.1
|
GAMMA-VPE
|
gamma vacuolar processing enzyme |
| arTal_v1_Chr4_+_11269985_11270040 | 2.44 |
AT4G21120.1
AT4G21120.2 |
AAT1
|
amino acid transporter 1 |
| arTal_v1_Chr2_+_17251819_17251819 | 2.43 |
AT2G41380.1
|
AT2G41380
|
S-adenosyl-L-methionine-dependent methyltransferases superfamily protein |
| arTal_v1_Chr4_-_7410406_7410406 | 2.43 |
AT4G12490.1
|
AT4G12490
|
Bifunctional inhibitor/lipid-transfer protein/seed storage 2S albumin superfamily protein |
| arTal_v1_Chr1_+_5389952_5389952 | 2.43 |
AT1G15670.1
|
AT1G15670
|
Galactose oxidase/kelch repeat superfamily protein |
| arTal_v1_Chr5_-_14935885_14935885 | 2.43 |
AT5G37600.1
|
GSR 1
|
hypothetical protein |
| arTal_v1_Chr5_+_5710910_5710910 | 2.42 |
AT5G17330.1
|
GAD
|
glutamate decarboxylase |
| arTal_v1_Chr1_+_3288087_3288087 | 2.41 |
AT1G10070.3
AT1G10070.2 AT1G10070.1 |
BCAT-2
|
branched-chain amino acid transaminase 2 |
| arTal_v1_Chr1_-_27755297_27755297 | 2.41 |
AT1G73810.1
|
AT1G73810
|
Core-2/I-branching beta-1,6-N-acetylglucosaminyltransferase family protein |
| arTal_v1_Chr2_+_14783254_14783254 | 2.40 |
AT2G35070.1
AT2G35070.2 |
AT2G35070
|
transmembrane protein |
| arTal_v1_Chr2_-_11800928_11800928 | 2.40 |
AT2G27660.1
|
AT2G27660
|
Cysteine/Histidine-rich C1 domain family protein |
| arTal_v1_Chr2_-_12627891_12627891 | 2.40 |
AT2G29460.1
|
GSTU4
|
glutathione S-transferase tau 4 |
| arTal_v1_Chr5_-_2652535_2652535 | 2.40 |
AT5G08240.1
|
AT5G08240
|
transmembrane protein |
| arTal_v1_Chr3_-_18375784_18375784 | 2.39 |
AT3G49580.3
AT3G49580.2 |
LSU1
|
response to low sulfur 1 |
| arTal_v1_Chr1_+_29298243_29298243 | 2.37 |
AT1G77920.1
|
TGA7
|
bZIP transcription factor family protein |
| arTal_v1_Chr2_-_12149072_12149072 | 2.36 |
AT2G28400.1
|
AT2G28400
|
senescence regulator (Protein of unknown function, DUF584) |
| arTal_v1_Chr3_-_10790553_10790553 | 2.35 |
AT3G28740.1
|
CYP81D11
|
Cytochrome P450 superfamily protein |
| arTal_v1_Chr1_-_7553975_7553975 | 2.35 |
AT1G21550.1
|
AT1G21550
|
Calcium-binding EF-hand family protein |
| arTal_v1_Chr3_-_1286760_1286760 | 2.35 |
AT3G04720.1
|
PR4
|
pathogenesis-related 4 |
| arTal_v1_Chr3_+_9887917_9887917 | 2.34 |
AT3G26830.1
|
PAD3
|
Cytochrome P450 superfamily protein |
| arTal_v1_Chr4_+_2224422_2224427 | 2.34 |
AT4G04460.2
AT4G04460.1 |
AT4G04460
|
Saposin-like aspartyl protease family protein |
| arTal_v1_Chr3_-_18294621_18294621 | 2.34 |
AT3G49340.1
|
AT3G49340
|
Cysteine proteinases superfamily protein |
| arTal_v1_Chr4_-_15941493_15941493 | 2.34 |
AT4G33040.1
|
AT4G33040
|
Thioredoxin superfamily protein |
| arTal_v1_Chr5_+_3839316_3839391 | 2.33 |
AT5G11920.3
AT5G11920.1 AT5G11920.2 |
cwINV6
|
6-&1-fructan exohydrolase |
| arTal_v1_Chr3_+_18207651_18207651 | 2.33 |
AT3G49120.1
|
PRXCB
|
peroxidase CB |
| arTal_v1_Chr1_-_4621585_4621585 | 2.32 |
AT1G13470.1
|
AT1G13470
|
hypothetical protein (DUF1262) |
| arTal_v1_Chr1_-_9128568_9128568 | 2.32 |
AT1G26380.1
|
AT1G26380
|
FAD-binding Berberine family protein |
| arTal_v1_Chr4_+_7304323_7304323 | 2.31 |
AT4G12290.2
|
AT4G12290
|
Copper amine oxidase family protein |
| arTal_v1_Chr5_+_8749680_8749680 | 2.31 |
AT5G25250.1
|
FLOT1
|
SPFH/Band 7/PHB domain-containing membrane-associated protein family |
| arTal_v1_Chr3_-_7676519_7676519 | 2.31 |
AT3G21780.1
|
UGT71B6
|
UDP-glucosyl transferase 71B6 |
| arTal_v1_Chr3_-_4079627_4079627 | 2.30 |
AT3G12830.1
|
AT3G12830
|
SAUR-like auxin-responsive protein family |
| arTal_v1_Chr5_-_9000345_9000345 | 2.30 |
AT5G25820.1
|
AT5G25820
|
Exostosin family protein |
| arTal_v1_Chr1_-_659980_659980 | 2.29 |
AT1G02920.1
|
GSTF7
|
glutathione S-transferase 7 |
| arTal_v1_Chr4_+_7303985_7303985 | 2.29 |
AT4G12290.1
|
AT4G12290
|
Copper amine oxidase family protein |
| arTal_v1_Chr1_-_3323735_3323735 | 2.27 |
AT1G10140.1
|
AT1G10140
|
Uncharacterized conserved protein UCP031279 |
| arTal_v1_Chr5_+_1672070_1672096 | 2.27 |
AT5G05600.1
AT5G05600.2 |
AT5G05600
|
2-oxoglutarate (2OG) and Fe(II)-dependent oxygenase superfamily protein |
| arTal_v1_Chr2_-_10585216_10585216 | 2.25 |
AT2G24850.1
|
TAT3
|
tyrosine aminotransferase 3 |
| arTal_v1_Chr4_+_7148124_7148386 | 2.25 |
AT4G11890.3
AT4G11890.1 AT4G11890.4 |
ARCK1
|
Protein kinase superfamily protein |
| arTal_v1_Chr5_+_8202919_8203003 | 2.23 |
AT5G24200.1
AT5G24200.2 AT5G24200.3 |
AT5G24200
|
alpha/beta-Hydrolases superfamily protein |
| arTal_v1_Chr4_-_17494279_17494279 | 2.23 |
AT4G37150.1
|
MES9
|
methyl esterase 9 |
| arTal_v1_Chr1_-_9848015_9848015 | 2.23 |
AT1G28190.1
|
AT1G28190
|
hypothetical protein |
| arTal_v1_Chr3_-_7818985_7818985 | 2.23 |
AT3G22160.1
|
AT3G22160
|
VQ motif-containing protein |
| arTal_v1_Chr1_-_28024860_28024860 | 2.21 |
AT1G74590.1
|
GSTU10
|
glutathione S-transferase TAU 10 |
| arTal_v1_Chr5_-_763322_763322 | 2.21 |
AT5G03210.1
|
DIP2
|
E3 ubiquitin-protein ligase |
| arTal_v1_Chr1_-_25662276_25662276 | 2.20 |
AT1G68450.1
|
PDE337
|
VQ motif-containing protein |
| arTal_v1_Chr1_-_20949281_20949281 | 2.20 |
AT1G56010.2
|
NAC1
|
NAC domain containing protein 1 |
| arTal_v1_Chr4_-_6718550_6718550 | 2.20 |
AT4G10960.1
|
UGE5
|
UDP-D-glucose/UDP-D-galactose 4-epimerase 5 |
| arTal_v1_Chr3_-_11194897_11194993 | 2.19 |
AT3G29250.2
AT3G29250.1 |
SDR4
|
NAD(P)-binding Rossmann-fold superfamily protein |
| arTal_v1_Chr3_-_19699392_19699392 | 2.18 |
AT3G53150.1
|
UGT73D1
|
UDP-glucosyl transferase 73D1 |
| arTal_v1_Chr2_+_17640546_17640546 | 2.18 |
AT2G42360.1
|
AT2G42360
|
RING/U-box superfamily protein |
| arTal_v1_Chr2_+_1966806_1966816 | 2.17 |
AT2G05380.1
AT2G05380.2 |
GRP3S
|
glycine-rich protein 3 short isoform |
| arTal_v1_Chr4_+_13653579_13653579 | 2.16 |
AT4G27260.1
|
WES1
|
Auxin-responsive GH3 family protein |
| arTal_v1_Chr1_+_8164959_8164959 | 2.15 |
AT1G23040.3
AT1G23040.2 |
AT1G23040
|
hydroxyproline-rich glycoprotein family protein |
| arTal_v1_Chr1_-_23690807_23690807 | 2.15 |
AT1G63840.1
|
AT1G63840
|
RING/U-box superfamily protein |
| arTal_v1_Chr1_+_28740540_28740540 | 2.15 |
AT1G76590.1
|
AT1G76590
|
PLATZ transcription factor family protein |
| arTal_v1_Chr3_-_10047453_10047453 | 2.14 |
AT3G27210.1
|
AT3G27210
|
hypothetical protein |
| arTal_v1_Chr2_-_9538963_9538963 | 2.14 |
AT2G22470.1
|
AGP2
|
arabinogalactan protein 2 |
| arTal_v1_Chr4_+_10398857_10398857 | 2.14 |
AT4G18980.1
|
AtS40-3
|
AtS40-3 |
| arTal_v1_Chr1_+_12917070_12917070 | 2.13 |
AT1G35230.1
|
AGP5
|
arabinogalactan protein 5 |
| arTal_v1_Chr4_+_12463312_12463312 | 2.11 |
AT4G24000.2
|
CSLG2
|
cellulose synthase like G2 |
| arTal_v1_Chr5_-_5759817_5759817 | 2.11 |
AT5G17460.3
AT5G17460.2 AT5G17460.1 |
AT5G17460
|
glutamyl-tRNA (Gln) amidotransferase subunit C |
| arTal_v1_Chr3_-_18375940_18375940 | 2.11 |
AT3G49580.1
|
LSU1
|
response to low sulfur 1 |
| arTal_v1_Chr5_-_552827_552827 | 2.11 |
AT5G02490.1
|
Hsp70-2
|
Heat shock protein 70 (Hsp 70) family protein |
| arTal_v1_Chr1_+_27538190_27538190 | 2.11 |
AT1G73220.1
|
OCT1
|
organic cation/carnitine transporter1 |
| arTal_v1_Chr4_-_8095749_8095749 | 2.10 |
AT4G14020.1
|
AT4G14020
|
Rapid alkalinization factor (RALF) family protein |
| arTal_v1_Chr1_-_977761_977911 | 2.10 |
AT1G03850.1
AT1G03850.2 AT1G03850.3 |
GRXS13
|
Glutaredoxin family protein |
| arTal_v1_Chr4_-_14820595_14820595 | 2.09 |
AT4G30270.1
|
XTH24
|
xyloglucan endotransglucosylase/hydrolase 24 |
| arTal_v1_Chr1_-_26338818_26338818 | 2.09 |
AT1G69930.1
|
GSTU11
|
glutathione S-transferase TAU 11 |
| arTal_v1_Chr3_+_18465318_18465318 | 2.09 |
AT3G49780.1
|
PSK4
|
phytosulfokine 4 precursor |
| arTal_v1_Chr1_+_22824414_22824414 | 2.08 |
AT1G61800.2
AT1G61800.1 |
GPT2
|
glucose-6-phosphate/phosphate translocator 2 |
| arTal_v1_Chr3_+_22925742_22925742 | 2.08 |
AT3G61900.1
|
AT3G61900
|
SAUR-like auxin-responsive protein family |
| arTal_v1_Chr3_+_22216540_22216540 | 2.08 |
AT3G60140.2
AT3G60140.1 |
DIN2
|
Glycosyl hydrolase superfamily protein |
| arTal_v1_Chr5_+_15578749_15578763 | 2.08 |
AT5G38910.2
AT5G38910.1 |
AT5G38910
|
RmlC-like cupins superfamily protein |
| arTal_v1_Chr2_+_18558885_18558938 | 2.07 |
AT2G44990.2
AT2G44990.3 AT2G44990.1 |
CCD7
|
carotenoid cleavage dioxygenase 7 |
| arTal_v1_Chr3_+_4346330_4346330 | 2.07 |
AT3G13380.1
|
BRL3
|
BRI1-like 3 |
| arTal_v1_Chr5_-_5862462_5862475 | 2.07 |
AT5G17760.2
AT5G17760.1 |
AT5G17760
|
P-loop containing nucleoside triphosphate hydrolases superfamily protein |
| arTal_v1_Chr1_-_17706460_17706460 | 2.07 |
AT1G48000.1
|
MYB112
|
myb domain protein 112 |
| arTal_v1_Chr2_-_15419391_15419391 | 2.06 |
AT2G36780.1
|
AT2G36780
|
UDP-Glycosyltransferase superfamily protein |
| arTal_v1_Chr1_-_27837443_27837443 | 2.06 |
AT1G74020.1
|
SS2
|
strictosidine synthase 2 |
| arTal_v1_Chr5_+_22468579_22468579 | 2.06 |
AT5G55460.1
|
AT5G55460
|
Bifunctional inhibitor/lipid-transfer protein/seed storage 2S albumin superfamily protein |
| arTal_v1_Chr4_+_11655562_11655613 | 2.06 |
AT4G21980.1
AT4G21980.2 |
APG8A
|
Ubiquitin-like superfamily protein |
| arTal_v1_Chr3_+_5243432_5243432 | 2.05 |
AT3G15510.1
|
NAC2
|
NAC domain containing protein 2 |
| arTal_v1_Chr5_+_26772644_26772644 | 2.05 |
AT5G67080.1
|
MAPKKK19
|
mitogen-activated protein kinase kinase kinase 19 |
| arTal_v1_Chr3_+_21380648_21380648 | 2.05 |
AT3G57680.1
AT3G57680.2 |
AT3G57680
|
Peptidase S41 family protein |
| arTal_v1_Chr3_-_1776840_1776840 | 2.05 |
AT3G05937.1
|
AT3G05937
|
hypothetical protein |
| arTal_v1_Chr1_-_8711578_8711578 | 2.05 |
AT1G24575.1
|
AT1G24575
|
DEAD-box ATP-dependent RNA helicase-like protein |
| arTal_v1_Chr2_-_17882636_17882636 | 2.05 |
AT2G43000.1
AT2G43000.2 |
NAC042
|
NAC domain containing protein 42 |
| arTal_v1_Chr2_+_16298110_16298110 | 2.04 |
AT2G39030.1
|
NATA1
|
Acyl-CoA N-acyltransferases (NAT) superfamily protein |
| arTal_v1_Chr1_+_4567935_4567935 | 2.04 |
AT1G13330.1
|
AHP2
|
Tat-binding protein 1(Tbp-1)-interacting protein (TBPIP) |
| arTal_v1_Chr5_-_5904380_5904380 | 2.04 |
AT5G17860.2
|
CAX7
|
calcium exchanger 7 |
| arTal_v1_Chr3_-_7063372_7063372 | 2.03 |
AT3G20250.2
AT3G20250.1 |
PUM5
|
pumilio 5 |
| arTal_v1_Chr3_-_8119490_8119490 | 2.03 |
AT3G22910.1
|
AT3G22910
|
ATPase E1-E2 type family protein / haloacid dehalogenase-like hydrolase family protein |
| arTal_v1_Chr1_-_23460884_23460884 | 2.03 |
AT1G63245.1
|
CLE14
|
CLAVATA3/ESR-RELATED 14 |
| arTal_v1_Chr1_+_8164782_8164782 | 2.03 |
AT1G23040.1
|
AT1G23040
|
hydroxyproline-rich glycoprotein family protein |
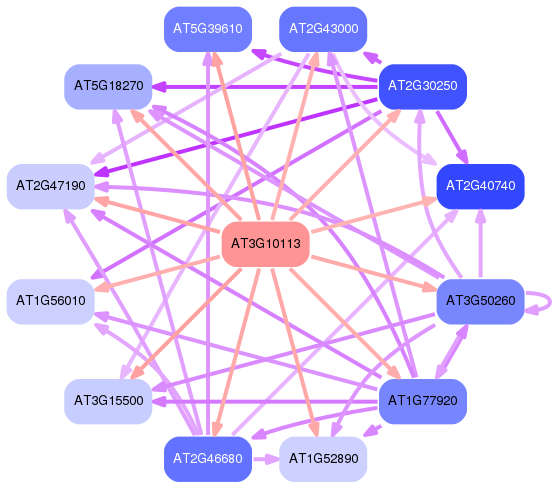
Network of associatons between targets according to the STRING database.

First level regulatory network of AT3G10113
Gene Ontology Analysis
Gene overrepresentation in biological process category:
| Log-likelihood per target | Total log-likelihood | Term | Description |
|---|---|---|---|
| 2.1 | 10.7 | GO:0051091 | positive regulation of sequence-specific DNA binding transcription factor activity(GO:0051091) |
| 1.7 | 5.0 | GO:0016118 | tetraterpenoid catabolic process(GO:0016110) carotenoid catabolic process(GO:0016118) xanthophyll catabolic process(GO:0016124) |
| 1.5 | 4.5 | GO:0010266 | response to vitamin B1(GO:0010266) |
| 1.5 | 4.4 | GO:0015802 | basic amino acid transport(GO:0015802) |
| 1.4 | 8.4 | GO:0051176 | positive regulation of sulfur metabolic process(GO:0051176) |
| 1.3 | 5.1 | GO:0097438 | release of seed from dormancy(GO:0048838) exit from dormancy(GO:0097438) |
| 1.3 | 5.1 | GO:0033306 | phytol metabolic process(GO:0033306) |
| 1.2 | 3.7 | GO:0031115 | negative regulation of microtubule polymerization(GO:0031115) |
| 1.1 | 5.5 | GO:1900367 | positive regulation of defense response to insect(GO:1900367) |
| 1.1 | 5.4 | GO:0010201 | response to continuous far red light stimulus by the high-irradiance response system(GO:0010201) |
| 1.0 | 3.1 | GO:0072708 | response to sorbitol(GO:0072708) |
| 1.0 | 2.9 | GO:0015696 | ammonium transport(GO:0015696) |
| 0.9 | 3.7 | GO:0045332 | phospholipid translocation(GO:0045332) |
| 0.9 | 3.6 | GO:0015720 | allantoin transport(GO:0015720) |
| 0.8 | 0.8 | GO:0032196 | transposition(GO:0032196) |
| 0.8 | 7.5 | GO:0010188 | response to microbial phytotoxin(GO:0010188) |
| 0.8 | 2.5 | GO:1902347 | response to strigolactone(GO:1902347) |
| 0.8 | 4.8 | GO:0043090 | amino acid import(GO:0043090) |
| 0.8 | 3.1 | GO:0010351 | lithium ion transport(GO:0010351) |
| 0.8 | 10.2 | GO:1900057 | positive regulation of leaf senescence(GO:1900057) |
| 0.8 | 3.1 | GO:0046440 | lysine catabolic process(GO:0006554) L-lysine catabolic process to acetyl-CoA(GO:0019474) L-lysine catabolic process(GO:0019477) L-lysine catabolic process to acetyl-CoA via saccharopine(GO:0033512) L-lysine metabolic process(GO:0046440) |
| 0.8 | 3.8 | GO:1902418 | (+)-abscisic acid D-glucopyranosyl ester transmembrane transport(GO:1902418) |
| 0.7 | 8.2 | GO:0052317 | camalexin biosynthetic process(GO:0010120) camalexin metabolic process(GO:0052317) |
| 0.7 | 3.7 | GO:0080024 | indolebutyric acid metabolic process(GO:0080024) |
| 0.7 | 5.1 | GO:0006597 | spermine biosynthetic process(GO:0006597) |
| 0.7 | 2.2 | GO:1902065 | response to L-glutamate(GO:1902065) |
| 0.7 | 2.2 | GO:0090213 | regulation of radial pattern formation(GO:0090213) |
| 0.7 | 2.9 | GO:0019567 | pentose biosynthetic process(GO:0019322) arabinose biosynthetic process(GO:0019567) |
| 0.7 | 4.2 | GO:0006624 | vacuolar protein processing(GO:0006624) |
| 0.7 | 2.8 | GO:0010324 | membrane invagination(GO:0010324) |
| 0.7 | 3.5 | GO:0006809 | nitric oxide biosynthetic process(GO:0006809) |
| 0.7 | 4.2 | GO:0010438 | cellular response to sulfur starvation(GO:0010438) |
| 0.7 | 2.1 | GO:0015717 | triose phosphate transport(GO:0015717) triose phosphate transmembrane transport(GO:0035436) |
| 0.7 | 6.2 | GO:0010230 | alternative respiration(GO:0010230) |
| 0.7 | 1.4 | GO:0035865 | cellular response to potassium ion(GO:0035865) |
| 0.7 | 2.0 | GO:1902289 | negative regulation of defense response to oomycetes(GO:1902289) |
| 0.7 | 3.3 | GO:0060151 | peroxisome localization(GO:0060151) |
| 0.7 | 8.6 | GO:0002758 | immune response-activating signal transduction(GO:0002757) innate immune response-activating signal transduction(GO:0002758) |
| 0.7 | 4.6 | GO:0006542 | glutamine biosynthetic process(GO:0006542) |
| 0.7 | 1.3 | GO:1900378 | positive regulation of secondary metabolite biosynthetic process(GO:1900378) |
| 0.6 | 1.9 | GO:0016107 | sesquiterpenoid catabolic process(GO:0016107) apocarotenoid catabolic process(GO:0043290) abscisic acid catabolic process(GO:0046345) |
| 0.6 | 1.9 | GO:0010446 | response to alkaline pH(GO:0010446) |
| 0.6 | 3.1 | GO:1900384 | regulation of flavonol biosynthetic process(GO:1900384) |
| 0.6 | 3.1 | GO:0051090 | regulation of sequence-specific DNA binding transcription factor activity(GO:0051090) |
| 0.6 | 1.2 | GO:0009413 | response to flooding(GO:0009413) |
| 0.6 | 1.8 | GO:1902066 | regulation of cell wall pectin metabolic process(GO:1902066) |
| 0.6 | 0.6 | GO:1902464 | histone H3-K27 trimethylation(GO:0098532) regulation of histone H3-K27 trimethylation(GO:1902464) |
| 0.6 | 1.2 | GO:0042744 | hydrogen peroxide catabolic process(GO:0042744) |
| 0.6 | 1.8 | GO:0033530 | raffinose metabolic process(GO:0033530) |
| 0.6 | 1.8 | GO:0071569 | protein ufmylation(GO:0071569) |
| 0.6 | 9.2 | GO:0015996 | chlorophyll catabolic process(GO:0015996) |
| 0.6 | 1.7 | GO:0032963 | collagen metabolic process(GO:0032963) multicellular organism metabolic process(GO:0044236) multicellular organismal macromolecule metabolic process(GO:0044259) |
| 0.6 | 1.1 | GO:0009061 | anaerobic respiration(GO:0009061) |
| 0.6 | 3.9 | GO:0009745 | sucrose mediated signaling(GO:0009745) |
| 0.5 | 1.6 | GO:0061014 | positive regulation of mRNA catabolic process(GO:0061014) |
| 0.5 | 1.6 | GO:0017014 | protein nitrosylation(GO:0017014) peptidyl-cysteine S-nitrosylation(GO:0018119) peptidyl-cysteine S-trans-nitrosylation(GO:0035606) |
| 0.5 | 1.6 | GO:2000058 | protein ubiquitination involved in ubiquitin-dependent protein catabolic process(GO:0042787) regulation of protein ubiquitination involved in ubiquitin-dependent protein catabolic process(GO:2000058) |
| 0.5 | 3.7 | GO:0090059 | protoxylem development(GO:0090059) |
| 0.5 | 5.3 | GO:0070534 | protein K63-linked ubiquitination(GO:0070534) |
| 0.5 | 1.1 | GO:0019336 | phenol-containing compound catabolic process(GO:0019336) |
| 0.5 | 4.2 | GO:0071216 | cellular response to biotic stimulus(GO:0071216) |
| 0.5 | 1.6 | GO:0009945 | radial axis specification(GO:0009945) |
| 0.5 | 1.6 | GO:1990116 | ribosome-associated ubiquitin-dependent protein catabolic process(GO:1990116) |
| 0.5 | 4.7 | GO:0050691 | regulation of defense response to virus by host(GO:0050691) |
| 0.5 | 0.5 | GO:0010618 | aerenchyma formation(GO:0010618) |
| 0.5 | 4.7 | GO:0009819 | drought recovery(GO:0009819) |
| 0.5 | 1.5 | GO:0010124 | phenylacetate catabolic process(GO:0010124) |
| 0.5 | 2.0 | GO:0035494 | SNARE complex disassembly(GO:0035494) |
| 0.5 | 2.0 | GO:0009557 | antipodal cell differentiation(GO:0009557) |
| 0.5 | 2.5 | GO:0019323 | pentose catabolic process(GO:0019323) |
| 0.5 | 1.0 | GO:0015857 | pyrimidine nucleobase transport(GO:0015855) uracil transport(GO:0015857) |
| 0.5 | 4.5 | GO:0051410 | detoxification of nitrogen compound(GO:0051410) |
| 0.5 | 3.9 | GO:0070370 | cellular heat acclimation(GO:0070370) |
| 0.5 | 1.5 | GO:0046521 | sphingoid catabolic process(GO:0046521) |
| 0.5 | 1.5 | GO:0033528 | S-methylmethionine metabolic process(GO:0033477) S-methylmethionine cycle(GO:0033528) |
| 0.5 | 1.5 | GO:0030970 | retrograde protein transport, ER to cytosol(GO:0030970) endoplasmic reticulum to cytosol transport(GO:1903513) |
| 0.5 | 1.9 | GO:0016098 | monoterpenoid metabolic process(GO:0016098) monoterpenoid biosynthetic process(GO:0016099) |
| 0.5 | 1.5 | GO:0030242 | pexophagy(GO:0030242) |
| 0.5 | 6.2 | GO:0010555 | response to mannitol(GO:0010555) |
| 0.5 | 5.3 | GO:0006646 | phosphatidylethanolamine biosynthetic process(GO:0006646) phosphatidylethanolamine metabolic process(GO:0046337) |
| 0.5 | 1.9 | GO:0046477 | glycosylceramide metabolic process(GO:0006677) glucosylceramide metabolic process(GO:0006678) glucosylceramide catabolic process(GO:0006680) glycosphingolipid metabolic process(GO:0006687) glycolipid catabolic process(GO:0019377) glycosylceramide catabolic process(GO:0046477) glycosphingolipid catabolic process(GO:0046479) ceramide catabolic process(GO:0046514) |
| 0.5 | 7.4 | GO:0006538 | glutamate catabolic process(GO:0006538) |
| 0.5 | 8.2 | GO:0019374 | galactolipid metabolic process(GO:0019374) |
| 0.4 | 1.3 | GO:0071596 | ubiquitin-dependent protein catabolic process via the N-end rule pathway(GO:0071596) |
| 0.4 | 4.5 | GO:0016584 | nucleosome positioning(GO:0016584) |
| 0.4 | 1.3 | GO:0097033 | respiratory chain complex III assembly(GO:0017062) mitochondrial respiratory chain complex III assembly(GO:0034551) mitochondrial respiratory chain complex III biogenesis(GO:0097033) |
| 0.4 | 0.4 | GO:0016578 | histone deubiquitination(GO:0016578) |
| 0.4 | 3.9 | GO:0009920 | cell plate formation involved in plant-type cell wall biogenesis(GO:0009920) |
| 0.4 | 1.7 | GO:0034720 | histone H3-K4 demethylation(GO:0034720) |
| 0.4 | 2.6 | GO:0009065 | glutamine family amino acid catabolic process(GO:0009065) |
| 0.4 | 1.3 | GO:1902457 | negative regulation of stomatal opening(GO:1902457) |
| 0.4 | 5.1 | GO:1900457 | regulation of brassinosteroid mediated signaling pathway(GO:1900457) |
| 0.4 | 4.6 | GO:0071712 | ER-associated misfolded protein catabolic process(GO:0071712) |
| 0.4 | 8.0 | GO:0002238 | response to molecule of fungal origin(GO:0002238) |
| 0.4 | 0.8 | GO:0046218 | tryptophan catabolic process(GO:0006569) indolalkylamine catabolic process(GO:0046218) |
| 0.4 | 0.8 | GO:0009727 | detection of ethylene stimulus(GO:0009727) |
| 0.4 | 4.2 | GO:0000304 | response to singlet oxygen(GO:0000304) |
| 0.4 | 2.5 | GO:0071733 | establishment of mitotic sister chromatid cohesion(GO:0034087) establishment of protein localization to chromosome(GO:0070199) rDNA condensation(GO:0070550) establishment of protein localization to chromatin(GO:0071169) transcriptional activation by promoter-enhancer looping(GO:0071733) gene looping(GO:0090202) dsDNA loop formation(GO:0090579) |
| 0.4 | 1.2 | GO:0010184 | cytokinin transport(GO:0010184) |
| 0.4 | 3.3 | GO:0097034 | respiratory chain complex IV assembly(GO:0008535) mitochondrial respiratory chain complex IV assembly(GO:0033617) mitochondrial respiratory chain complex IV biogenesis(GO:0097034) |
| 0.4 | 2.1 | GO:0031929 | TOR signaling(GO:0031929) |
| 0.4 | 4.5 | GO:0006878 | cellular copper ion homeostasis(GO:0006878) |
| 0.4 | 1.2 | GO:0017196 | N-terminal protein amino acid acetylation(GO:0006474) N-terminal peptidyl-methionine acetylation(GO:0017196) |
| 0.4 | 1.6 | GO:0000082 | G1/S transition of mitotic cell cycle(GO:0000082) |
| 0.4 | 0.4 | GO:1990573 | potassium ion import across plasma membrane(GO:1990573) |
| 0.4 | 2.0 | GO:0010336 | gibberellic acid homeostasis(GO:0010336) |
| 0.4 | 3.2 | GO:0044375 | regulation of peroxisome size(GO:0044375) |
| 0.4 | 2.4 | GO:0015969 | guanosine tetraphosphate metabolic process(GO:0015969) purine ribonucleoside bisphosphate metabolic process(GO:0034035) |
| 0.4 | 1.2 | GO:2000653 | regulation of genetic imprinting(GO:2000653) |
| 0.4 | 4.0 | GO:0009970 | cellular response to sulfate starvation(GO:0009970) |
| 0.4 | 0.8 | GO:0015783 | GDP-fucose transport(GO:0015783) |
| 0.4 | 1.2 | GO:0055047 | generative cell mitosis(GO:0055047) |
| 0.4 | 1.2 | GO:0046705 | CDP metabolic process(GO:0046704) CDP biosynthetic process(GO:0046705) |
| 0.4 | 1.2 | GO:0010792 | DNA double-strand break processing involved in repair via single-strand annealing(GO:0010792) double-strand break repair via single-strand annealing(GO:0045002) |
| 0.4 | 16.5 | GO:1901421 | positive regulation of abscisic acid-activated signaling pathway(GO:0009789) positive regulation of response to alcohol(GO:1901421) |
| 0.4 | 0.4 | GO:0043902 | positive regulation of multi-organism process(GO:0043902) |
| 0.4 | 2.7 | GO:0046900 | tetrahydrofolylpolyglutamate metabolic process(GO:0046900) |
| 0.4 | 0.8 | GO:1901379 | regulation of potassium ion transmembrane transport(GO:1901379) regulation of cation transmembrane transport(GO:1904062) |
| 0.4 | 2.3 | GO:0015785 | UDP-galactose transport(GO:0015785) UDP-galactose transmembrane transport(GO:0072334) |
| 0.4 | 3.4 | GO:0045836 | positive regulation of meiotic nuclear division(GO:0045836) |
| 0.4 | 1.5 | GO:0034051 | negative regulation of plant-type hypersensitive response(GO:0034051) |
| 0.4 | 1.5 | GO:0071836 | nectar secretion(GO:0071836) |
| 0.4 | 1.1 | GO:0051601 | exocyst localization(GO:0051601) |
| 0.4 | 1.1 | GO:0009107 | lipoate biosynthetic process(GO:0009107) |
| 0.4 | 1.9 | GO:0006788 | heme oxidation(GO:0006788) |
| 0.4 | 2.3 | GO:0048578 | positive regulation of long-day photoperiodism, flowering(GO:0048578) |
| 0.4 | 0.7 | GO:1903313 | positive regulation of mRNA metabolic process(GO:1903313) |
| 0.4 | 2.9 | GO:0010112 | regulation of systemic acquired resistance(GO:0010112) |
| 0.4 | 1.1 | GO:0048832 | specification of organ number(GO:0048832) specification of floral organ number(GO:0048833) |
| 0.4 | 1.1 | GO:0055064 | chloride ion homeostasis(GO:0055064) |
| 0.4 | 1.4 | GO:0030417 | nicotianamine metabolic process(GO:0030417) nicotianamine biosynthetic process(GO:0030418) tricarboxylic acid biosynthetic process(GO:0072351) |
| 0.4 | 1.1 | GO:0045931 | positive regulation of mitotic cell cycle(GO:0045931) |
| 0.4 | 0.4 | GO:0034058 | endosomal vesicle fusion(GO:0034058) |
| 0.4 | 5.3 | GO:0072506 | phosphate ion homeostasis(GO:0055062) trivalent inorganic anion homeostasis(GO:0072506) |
| 0.4 | 2.1 | GO:1900425 | negative regulation of defense response to bacterium(GO:1900425) |
| 0.4 | 2.1 | GO:0003400 | regulation of COPII vesicle coating(GO:0003400) regulation of ER to Golgi vesicle-mediated transport by GTP hydrolysis(GO:0090113) |
| 0.4 | 3.9 | GO:0015749 | monosaccharide transport(GO:0015749) |
| 0.4 | 1.4 | GO:1900912 | negative regulation of ethylene biosynthetic process(GO:0010366) negative regulation of sulfur amino acid metabolic process(GO:0031336) negative regulation of cellular amine metabolic process(GO:0033239) negative regulation of cellular amino acid metabolic process(GO:0045763) negative regulation of sulfur metabolic process(GO:0051175) negative regulation of olefin metabolic process(GO:1900909) negative regulation of olefin biosynthetic process(GO:1900912) |
| 0.4 | 1.4 | GO:0071963 | establishment or maintenance of cell polarity regulating cell shape(GO:0071963) regulation of establishment or maintenance of cell polarity regulating cell shape(GO:2000769) |
| 0.4 | 1.1 | GO:2000693 | positive regulation of seed maturation(GO:2000693) |
| 0.4 | 6.3 | GO:0015770 | sucrose transport(GO:0015770) |
| 0.3 | 2.4 | GO:0000184 | nuclear-transcribed mRNA catabolic process, nonsense-mediated decay(GO:0000184) |
| 0.3 | 1.0 | GO:0080040 | positive regulation of cellular response to phosphate starvation(GO:0080040) |
| 0.3 | 0.3 | GO:0071422 | thiosulfate transport(GO:0015709) succinate transmembrane transport(GO:0071422) |
| 0.3 | 4.2 | GO:0080027 | response to herbivore(GO:0080027) |
| 0.3 | 9.7 | GO:0006914 | autophagy(GO:0006914) |
| 0.3 | 1.0 | GO:0031539 | positive regulation of anthocyanin metabolic process(GO:0031539) |
| 0.3 | 2.0 | GO:0019264 | L-serine catabolic process(GO:0006565) glycine biosynthetic process from serine(GO:0019264) response to tetrahydrofolate(GO:1904481) cellular response to tetrahydrofolate(GO:1904482) |
| 0.3 | 0.7 | GO:0002164 | nematode larval development(GO:0002119) larval development(GO:0002164) regulation of nematode larval development(GO:0061062) |
| 0.3 | 13.2 | GO:2000022 | regulation of jasmonic acid mediated signaling pathway(GO:2000022) |
| 0.3 | 0.7 | GO:0048439 | flower morphogenesis(GO:0048439) |
| 0.3 | 1.4 | GO:0000256 | allantoin catabolic process(GO:0000256) |
| 0.3 | 3.7 | GO:0048587 | regulation of short-day photoperiodism, flowering(GO:0048587) |
| 0.3 | 2.0 | GO:0009823 | cytokinin catabolic process(GO:0009823) hormone catabolic process(GO:0042447) |
| 0.3 | 1.0 | GO:0048281 | inflorescence morphogenesis(GO:0048281) |
| 0.3 | 0.7 | GO:0060628 | regulation of ER to Golgi vesicle-mediated transport(GO:0060628) |
| 0.3 | 1.0 | GO:0006210 | thymine catabolic process(GO:0006210) thymine metabolic process(GO:0019859) |
| 0.3 | 1.0 | GO:0060967 | negative regulation of gene silencing by RNA(GO:0060967) negative regulation of RNA interference(GO:1900369) |
| 0.3 | 2.0 | GO:0009303 | rRNA transcription(GO:0009303) |
| 0.3 | 1.0 | GO:0090143 | nucleoid organization(GO:0090143) |
| 0.3 | 1.9 | GO:0070536 | protein K63-linked deubiquitination(GO:0070536) |
| 0.3 | 14.9 | GO:0009407 | toxin catabolic process(GO:0009407) secondary metabolite catabolic process(GO:0090487) |
| 0.3 | 1.0 | GO:0090224 | regulation of mitotic spindle organization(GO:0060236) regulation of spindle organization(GO:0090224) |
| 0.3 | 1.6 | GO:0048442 | sepal development(GO:0048442) flower calyx development(GO:0048464) |
| 0.3 | 9.2 | GO:0009682 | induced systemic resistance(GO:0009682) |
| 0.3 | 1.3 | GO:0055073 | cadmium ion homeostasis(GO:0055073) |
| 0.3 | 1.2 | GO:0071398 | response to fatty acid(GO:0070542) cellular response to fatty acid(GO:0071398) |
| 0.3 | 11.2 | GO:0043562 | cellular response to nitrogen levels(GO:0043562) |
| 0.3 | 1.2 | GO:0070509 | calcium ion import(GO:0070509) |
| 0.3 | 2.2 | GO:0070813 | hydrogen sulfide metabolic process(GO:0070813) |
| 0.3 | 2.8 | GO:0010603 | regulation of cytoplasmic mRNA processing body assembly(GO:0010603) |
| 0.3 | 1.9 | GO:0043102 | L-methionine biosynthetic process from methylthioadenosine(GO:0019509) amino acid salvage(GO:0043102) L-methionine salvage(GO:0071267) |
| 0.3 | 4.6 | GO:0032511 | late endosome to vacuole transport via multivesicular body sorting pathway(GO:0032511) |
| 0.3 | 0.9 | GO:0045900 | negative regulation of translational elongation(GO:0045900) |
| 0.3 | 2.1 | GO:0051365 | cellular response to potassium ion starvation(GO:0051365) |
| 0.3 | 1.5 | GO:0007041 | lysosomal transport(GO:0007041) endosome to lysosome transport(GO:0008333) |
| 0.3 | 3.9 | GO:0009697 | salicylic acid biosynthetic process(GO:0009697) |
| 0.3 | 0.6 | GO:0006896 | Golgi to vacuole transport(GO:0006896) |
| 0.3 | 1.2 | GO:0031086 | nuclear-transcribed mRNA catabolic process, deadenylation-independent decay(GO:0031086) deadenylation-independent decapping of nuclear-transcribed mRNA(GO:0031087) |
| 0.3 | 1.2 | GO:0048480 | stigma development(GO:0048480) |
| 0.3 | 0.3 | GO:0048209 | regulation of vesicle targeting, to, from or within Golgi(GO:0048209) |
| 0.3 | 3.0 | GO:0031204 | posttranslational protein targeting to membrane, translocation(GO:0031204) |
| 0.3 | 5.3 | GO:1900424 | regulation of defense response to bacterium(GO:1900424) |
| 0.3 | 16.1 | GO:0009626 | plant-type hypersensitive response(GO:0009626) |
| 0.3 | 0.9 | GO:0019048 | modulation by virus of host morphology or physiology(GO:0019048) |
| 0.3 | 1.2 | GO:0006182 | cGMP biosynthetic process(GO:0006182) cGMP metabolic process(GO:0046068) |
| 0.3 | 1.2 | GO:0035305 | negative regulation of dephosphorylation(GO:0035305) negative regulation of protein dephosphorylation(GO:0035308) |
| 0.3 | 0.3 | GO:0006723 | cuticle hydrocarbon biosynthetic process(GO:0006723) |
| 0.3 | 1.1 | GO:0070676 | intralumenal vesicle formation(GO:0070676) |
| 0.3 | 2.5 | GO:0080036 | regulation of cytokinin-activated signaling pathway(GO:0080036) |
| 0.3 | 1.7 | GO:0043617 | cellular response to sucrose starvation(GO:0043617) |
| 0.3 | 2.3 | GO:0007205 | protein kinase C-activating G-protein coupled receptor signaling pathway(GO:0007205) |
| 0.3 | 0.8 | GO:0046203 | spermidine catabolic process(GO:0046203) |
| 0.3 | 2.8 | GO:0090158 | endoplasmic reticulum membrane organization(GO:0090158) |
| 0.3 | 0.8 | GO:0048232 | male gamete generation(GO:0048232) |
| 0.3 | 1.4 | GO:0046822 | regulation of nucleocytoplasmic transport(GO:0046822) |
| 0.3 | 2.2 | GO:0097428 | protein maturation by iron-sulfur cluster transfer(GO:0097428) |
| 0.3 | 1.1 | GO:0006531 | 2-oxoglutarate metabolic process(GO:0006103) aspartate metabolic process(GO:0006531) |
| 0.3 | 0.3 | GO:0050777 | negative regulation of immune response(GO:0050777) |
| 0.3 | 0.8 | GO:0006884 | cell volume homeostasis(GO:0006884) |
| 0.3 | 2.2 | GO:0052482 | defense response by cell wall thickening(GO:0052482) |
| 0.3 | 2.7 | GO:1904030 | negative regulation of cyclin-dependent protein serine/threonine kinase activity(GO:0045736) negative regulation of cyclin-dependent protein kinase activity(GO:1904030) |
| 0.3 | 0.8 | GO:0000973 | posttranscriptional tethering of RNA polymerase II gene DNA at nuclear periphery(GO:0000973) |
| 0.3 | 8.1 | GO:0035304 | regulation of protein dephosphorylation(GO:0035304) |
| 0.3 | 0.8 | GO:0080182 | histone H3-K4 trimethylation(GO:0080182) |
| 0.3 | 0.8 | GO:0006972 | hyperosmotic response(GO:0006972) |
| 0.3 | 0.3 | GO:0010269 | response to selenium ion(GO:0010269) |
| 0.3 | 1.3 | GO:0010039 | response to iron ion(GO:0010039) |
| 0.3 | 1.3 | GO:1902626 | assembly of large subunit precursor of preribosome(GO:1902626) |
| 0.3 | 1.9 | GO:0030007 | cellular potassium ion homeostasis(GO:0030007) |
| 0.3 | 2.7 | GO:1902074 | response to salt(GO:1902074) |
| 0.3 | 1.8 | GO:0032456 | endocytic recycling(GO:0032456) |
| 0.3 | 1.0 | GO:0060149 | negative regulation of posttranscriptional gene silencing(GO:0060149) |
| 0.3 | 1.0 | GO:0010226 | response to lithium ion(GO:0010226) |
| 0.3 | 1.3 | GO:0010142 | farnesyl diphosphate biosynthetic process, mevalonate pathway(GO:0010142) isoprenoid biosynthetic process via mevalonate(GO:1902767) |
| 0.3 | 0.8 | GO:1904580 | regulation of vacuolar transport(GO:1903335) regulation of intracellular mRNA localization(GO:1904580) |
| 0.3 | 6.4 | GO:0009816 | defense response to bacterium, incompatible interaction(GO:0009816) |
| 0.3 | 8.2 | GO:0010286 | heat acclimation(GO:0010286) |
| 0.3 | 1.3 | GO:0015824 | proline transport(GO:0015824) |
| 0.3 | 4.8 | GO:0006826 | iron ion transport(GO:0006826) |
| 0.3 | 0.5 | GO:0051512 | positive regulation of unidimensional cell growth(GO:0051512) |
| 0.3 | 0.5 | GO:0035246 | peptidyl-arginine methylation, to asymmetrical-dimethyl arginine(GO:0019919) peptidyl-arginine N-methylation(GO:0035246) peptidyl-arginine omega-N-methylation(GO:0035247) |
| 0.3 | 1.0 | GO:0009268 | response to pH(GO:0009268) |
| 0.2 | 2.2 | GO:0009410 | response to xenobiotic stimulus(GO:0009410) |
| 0.2 | 1.5 | GO:0010387 | COP9 signalosome assembly(GO:0010387) |
| 0.2 | 4.7 | GO:0010072 | primary shoot apical meristem specification(GO:0010072) |
| 0.2 | 1.7 | GO:0045903 | positive regulation of translational fidelity(GO:0045903) |
| 0.2 | 0.7 | GO:0060860 | regulation of floral organ abscission(GO:0060860) negative regulation of floral organ abscission(GO:0060862) |
| 0.2 | 1.0 | GO:0034059 | response to anoxia(GO:0034059) |
| 0.2 | 1.7 | GO:0045899 | regulation of RNA polymerase II transcriptional preinitiation complex assembly(GO:0045898) positive regulation of RNA polymerase II transcriptional preinitiation complex assembly(GO:0045899) |
| 0.2 | 1.2 | GO:0010439 | regulation of glucosinolate biosynthetic process(GO:0010439) |
| 0.2 | 3.1 | GO:0001676 | long-chain fatty acid metabolic process(GO:0001676) |
| 0.2 | 4.3 | GO:0009962 | regulation of flavonoid biosynthetic process(GO:0009962) |
| 0.2 | 0.7 | GO:0044277 | cell wall modification involved in abscission(GO:0009830) cell wall disassembly(GO:0044277) |
| 0.2 | 2.6 | GO:0010262 | somatic embryogenesis(GO:0010262) |
| 0.2 | 0.7 | GO:0046740 | transport of virus in host, cell to cell(GO:0046740) multi-organism intercellular transport(GO:1902586) |
| 0.2 | 0.7 | GO:0046473 | phosphatidic acid biosynthetic process(GO:0006654) phosphatidic acid metabolic process(GO:0046473) |
| 0.2 | 1.4 | GO:0016444 | somatic cell DNA recombination(GO:0016444) |
| 0.2 | 6.7 | GO:0002239 | response to oomycetes(GO:0002239) |
| 0.2 | 0.9 | GO:0033273 | response to vitamin(GO:0033273) |
| 0.2 | 0.9 | GO:0009610 | response to symbiotic fungus(GO:0009610) |
| 0.2 | 0.7 | GO:0006369 | termination of RNA polymerase II transcription(GO:0006369) |
| 0.2 | 44.5 | GO:0071456 | cellular response to hypoxia(GO:0071456) |
| 0.2 | 0.7 | GO:0045912 | negative regulation of cellular carbohydrate metabolic process(GO:0010677) negative regulation of carbohydrate metabolic process(GO:0045912) |
| 0.2 | 0.7 | GO:0048451 | petal formation(GO:0048451) |
| 0.2 | 1.8 | GO:0045851 | pH reduction(GO:0045851) |
| 0.2 | 23.2 | GO:0009751 | response to salicylic acid(GO:0009751) |
| 0.2 | 0.4 | GO:0071494 | cellular response to UV-C(GO:0071494) |
| 0.2 | 0.7 | GO:0006611 | protein export from nucleus(GO:0006611) |
| 0.2 | 0.2 | GO:0071280 | cellular response to copper ion(GO:0071280) |
| 0.2 | 0.9 | GO:0030259 | lipid glycosylation(GO:0030259) |
| 0.2 | 0.2 | GO:0032260 | response to jasmonic acid stimulus involved in jasmonic acid and ethylene-dependent systemic resistance(GO:0032260) |
| 0.2 | 1.3 | GO:0006469 | negative regulation of protein kinase activity(GO:0006469) negative regulation of kinase activity(GO:0033673) |
| 0.2 | 0.9 | GO:0060145 | viral gene silencing in virus induced gene silencing(GO:0060145) |
| 0.2 | 0.9 | GO:0042149 | cellular response to glucose starvation(GO:0042149) |
| 0.2 | 1.1 | GO:0080009 | mRNA methylation(GO:0080009) |
| 0.2 | 0.7 | GO:0010213 | non-photoreactive DNA repair(GO:0010213) |
| 0.2 | 2.0 | GO:0048363 | mucilage pectin metabolic process(GO:0048363) |
| 0.2 | 0.9 | GO:0010731 | protein glutathionylation(GO:0010731) |
| 0.2 | 0.9 | GO:0007584 | response to nutrient(GO:0007584) |
| 0.2 | 1.1 | GO:0032950 | regulation of beta-glucan metabolic process(GO:0032950) regulation of beta-glucan biosynthetic process(GO:0032951) regulation of cellulose biosynthetic process(GO:2001006) |
| 0.2 | 9.1 | GO:0072329 | monocarboxylic acid catabolic process(GO:0072329) |
| 0.2 | 0.6 | GO:0006990 | positive regulation of transcription from RNA polymerase II promoter involved in unfolded protein response(GO:0006990) positive regulation of transcription from RNA polymerase II promoter involved in cellular response to chemical stimulus(GO:1901522) |
| 0.2 | 11.6 | GO:0000380 | alternative mRNA splicing, via spliceosome(GO:0000380) |
| 0.2 | 0.4 | GO:2000072 | regulation of defense response to fungus, incompatible interaction(GO:2000072) |
| 0.2 | 1.1 | GO:0080144 | amino acid homeostasis(GO:0080144) |
| 0.2 | 1.1 | GO:0008608 | attachment of spindle microtubules to kinetochore(GO:0008608) |
| 0.2 | 8.4 | GO:0009788 | negative regulation of abscisic acid-activated signaling pathway(GO:0009788) |
| 0.2 | 0.8 | GO:0016598 | protein arginylation(GO:0016598) |
| 0.2 | 2.5 | GO:0009051 | pentose-phosphate shunt, oxidative branch(GO:0009051) |
| 0.2 | 1.4 | GO:0006591 | ornithine metabolic process(GO:0006591) |
| 0.2 | 1.0 | GO:1901001 | negative regulation of response to salt stress(GO:1901001) |
| 0.2 | 3.1 | GO:0009098 | leucine biosynthetic process(GO:0009098) |
| 0.2 | 0.8 | GO:0090065 | regulation of production of siRNA involved in RNA interference(GO:0090065) |
| 0.2 | 2.2 | GO:0023014 | signal transduction by protein phosphorylation(GO:0023014) |
| 0.2 | 2.8 | GO:0019511 | protein hydroxylation(GO:0018126) peptidyl-proline hydroxylation to 4-hydroxy-L-proline(GO:0018401) 4-hydroxyproline metabolic process(GO:0019471) peptidyl-proline hydroxylation(GO:0019511) |
| 0.2 | 0.6 | GO:0048446 | petal morphogenesis(GO:0048446) |
| 0.2 | 1.6 | GO:0033523 | histone H2B ubiquitination(GO:0033523) |
| 0.2 | 0.8 | GO:0052542 | defense response by callose deposition(GO:0052542) |
| 0.2 | 0.6 | GO:0016560 | protein import into peroxisome matrix, docking(GO:0016560) protein to membrane docking(GO:0022615) |
| 0.2 | 0.4 | GO:0043132 | NAD transport(GO:0043132) |
| 0.2 | 0.6 | GO:0010481 | epidermal cell division(GO:0010481) regulation of epidermal cell division(GO:0010482) |
| 0.2 | 0.4 | GO:0006348 | chromatin silencing at telomere(GO:0006348) |
| 0.2 | 1.3 | GO:0015691 | cadmium ion transport(GO:0015691) |
| 0.2 | 2.6 | GO:0000103 | sulfate assimilation(GO:0000103) |
| 0.2 | 2.4 | GO:0015833 | oligopeptide transport(GO:0006857) peptide transport(GO:0015833) |
| 0.2 | 2.2 | GO:0009593 | detection of chemical stimulus(GO:0009593) |
| 0.2 | 0.7 | GO:0043901 | negative regulation of multi-organism process(GO:0043901) |
| 0.2 | 0.9 | GO:0035066 | positive regulation of histone acetylation(GO:0035066) positive regulation of protein acetylation(GO:1901985) positive regulation of peptidyl-lysine acetylation(GO:2000758) |
| 0.2 | 0.4 | GO:0060776 | simple leaf morphogenesis(GO:0060776) |
| 0.2 | 0.9 | GO:0015938 | purine ribonucleotide catabolic process(GO:0009154) ribonucleotide catabolic process(GO:0009261) coenzyme A catabolic process(GO:0015938) nucleoside bisphosphate catabolic process(GO:0033869) ribonucleoside bisphosphate catabolic process(GO:0034031) purine nucleoside bisphosphate catabolic process(GO:0034034) |
| 0.2 | 2.9 | GO:0061157 | RNA destabilization(GO:0050779) mRNA destabilization(GO:0061157) |
| 0.2 | 1.1 | GO:0016121 | carotene catabolic process(GO:0016121) terpene catabolic process(GO:0046247) |
| 0.2 | 1.8 | GO:0009861 | jasmonic acid and ethylene-dependent systemic resistance(GO:0009861) |
| 0.2 | 2.7 | GO:0033356 | UDP-L-arabinose metabolic process(GO:0033356) |
| 0.2 | 1.1 | GO:0006072 | glycerol-3-phosphate metabolic process(GO:0006072) |
| 0.2 | 1.6 | GO:0033683 | nucleotide-excision repair, DNA incision(GO:0033683) |
| 0.2 | 1.9 | GO:0000266 | mitochondrial fission(GO:0000266) |
| 0.2 | 1.1 | GO:0010222 | stem vascular tissue pattern formation(GO:0010222) |
| 0.2 | 0.5 | GO:0045948 | positive regulation of translational initiation(GO:0045948) |
| 0.2 | 0.9 | GO:0001732 | formation of cytoplasmic translation initiation complex(GO:0001732) |
| 0.2 | 4.2 | GO:0090630 | activation of GTPase activity(GO:0090630) |
| 0.2 | 3.1 | GO:0043631 | RNA polyadenylation(GO:0043631) |
| 0.2 | 2.4 | GO:0043248 | proteasome assembly(GO:0043248) |
| 0.2 | 12.4 | GO:0016579 | protein deubiquitination(GO:0016579) |
| 0.2 | 0.5 | GO:0055078 | sodium ion homeostasis(GO:0055078) |
| 0.2 | 0.7 | GO:0042256 | mature ribosome assembly(GO:0042256) |
| 0.2 | 0.8 | GO:0015846 | polyamine transport(GO:0015846) |
| 0.2 | 1.3 | GO:0000731 | DNA synthesis involved in DNA repair(GO:0000731) |
| 0.2 | 0.8 | GO:0071786 | endoplasmic reticulum tubular network organization(GO:0071786) |
| 0.2 | 0.5 | GO:0071763 | nuclear membrane organization(GO:0071763) |
| 0.2 | 3.0 | GO:0006012 | galactose metabolic process(GO:0006012) |
| 0.2 | 1.1 | GO:0009229 | thiamine diphosphate biosynthetic process(GO:0009229) thiamine diphosphate metabolic process(GO:0042357) |
| 0.2 | 0.6 | GO:0031573 | intra-S DNA damage checkpoint(GO:0031573) |
| 0.2 | 0.6 | GO:0048639 | positive regulation of developmental growth(GO:0048639) |
| 0.2 | 0.9 | GO:0010019 | chloroplast-nucleus signaling pathway(GO:0010019) |
| 0.2 | 0.8 | GO:2000306 | positive regulation of photomorphogenesis(GO:2000306) |
| 0.2 | 0.5 | GO:2000082 | regulation of vitamin metabolic process(GO:0030656) regulation of L-ascorbic acid biosynthetic process(GO:2000082) |
| 0.2 | 0.9 | GO:0006122 | mitochondrial electron transport, ubiquinol to cytochrome c(GO:0006122) |
| 0.2 | 3.4 | GO:0042542 | response to hydrogen peroxide(GO:0042542) |
| 0.2 | 1.2 | GO:2000756 | regulation of histone acetylation(GO:0035065) regulation of protein acetylation(GO:1901983) regulation of peptidyl-lysine acetylation(GO:2000756) |
| 0.2 | 0.5 | GO:0046365 | monosaccharide catabolic process(GO:0046365) |
| 0.2 | 4.4 | GO:0009833 | plant-type primary cell wall biogenesis(GO:0009833) |
| 0.2 | 1.1 | GO:2001022 | positive regulation of response to DNA damage stimulus(GO:2001022) |
| 0.2 | 1.7 | GO:0051220 | maintenance of protein localization in endoplasmic reticulum(GO:0035437) cytoplasmic sequestering of protein(GO:0051220) |
| 0.2 | 0.2 | GO:0009759 | indole glucosinolate biosynthetic process(GO:0009759) |
| 0.1 | 0.3 | GO:0043970 | histone H3-K9 acetylation(GO:0043970) |
| 0.1 | 2.5 | GO:0030968 | endoplasmic reticulum unfolded protein response(GO:0030968) |
| 0.1 | 1.3 | GO:0009901 | anther dehiscence(GO:0009901) |
| 0.1 | 0.4 | GO:1903725 | regulation of isopentenyl diphosphate biosynthetic process, methylerythritol 4-phosphate pathway(GO:0010322) regulation of phospholipid biosynthetic process(GO:0071071) regulation of phospholipid metabolic process(GO:1903725) |
| 0.1 | 1.9 | GO:0007031 | peroxisome organization(GO:0007031) |
| 0.1 | 0.4 | GO:0006513 | protein monoubiquitination(GO:0006513) |
| 0.1 | 0.4 | GO:0030322 | stabilization of membrane potential(GO:0030322) |
| 0.1 | 1.6 | GO:0098869 | cellular oxidant detoxification(GO:0098869) |
| 0.1 | 1.7 | GO:0034620 | cellular response to unfolded protein(GO:0034620) |
| 0.1 | 0.7 | GO:0015866 | ADP transport(GO:0015866) ATP transport(GO:0015867) |
| 0.1 | 2.8 | GO:0006904 | vesicle docking involved in exocytosis(GO:0006904) |
| 0.1 | 0.6 | GO:0009939 | positive regulation of gibberellic acid mediated signaling pathway(GO:0009939) |
| 0.1 | 1.3 | GO:0006121 | mitochondrial electron transport, succinate to ubiquinone(GO:0006121) |
| 0.1 | 6.2 | GO:0009631 | cold acclimation(GO:0009631) |
| 0.1 | 4.2 | GO:0071804 | cellular potassium ion transport(GO:0071804) potassium ion transmembrane transport(GO:0071805) |
| 0.1 | 2.8 | GO:0042631 | cellular response to water deprivation(GO:0042631) |
| 0.1 | 2.5 | GO:0006863 | purine nucleobase transport(GO:0006863) |
| 0.1 | 0.6 | GO:0018315 | molybdenum incorporation into molybdenum-molybdopterin complex(GO:0018315) metal incorporation into metallo-molybdopterin complex(GO:0042040) |
| 0.1 | 0.6 | GO:0001120 | DNA-templated transcriptional open complex formation(GO:0001112) transcriptional open complex formation at RNA polymerase II promoter(GO:0001113) protein-DNA complex remodeling(GO:0001120) macromolecular complex remodeling(GO:0034367) |
| 0.1 | 0.7 | GO:0016255 | attachment of GPI anchor to protein(GO:0016255) |
| 0.1 | 0.7 | GO:0060919 | auxin influx(GO:0060919) |
| 0.1 | 1.9 | GO:0006535 | cysteine biosynthetic process from serine(GO:0006535) |
| 0.1 | 0.8 | GO:0006814 | sodium ion transport(GO:0006814) |
| 0.1 | 6.1 | GO:0006888 | ER to Golgi vesicle-mediated transport(GO:0006888) |
| 0.1 | 0.4 | GO:0034080 | CENP-A containing nucleosome assembly(GO:0034080) CENP-A containing chromatin organization(GO:0061641) |
| 0.1 | 0.4 | GO:0034067 | protein localization to Golgi apparatus(GO:0034067) |
| 0.1 | 1.2 | GO:0016575 | histone deacetylation(GO:0016575) |
| 0.1 | 0.4 | GO:0006493 | protein O-linked glycosylation(GO:0006493) |
| 0.1 | 0.4 | GO:0010255 | glucose mediated signaling pathway(GO:0010255) |
| 0.1 | 3.0 | GO:0060548 | negative regulation of cell death(GO:0060548) |
| 0.1 | 0.1 | GO:1900036 | positive regulation of cellular response to heat(GO:1900036) |
| 0.1 | 0.9 | GO:0090356 | negative regulation of auxin metabolic process(GO:0090356) |
| 0.1 | 1.3 | GO:0050879 | circumnutation(GO:0010031) multicellular organismal movement(GO:0050879) |
| 0.1 | 1.1 | GO:0009938 | negative regulation of gibberellic acid mediated signaling pathway(GO:0009938) |
| 0.1 | 0.5 | GO:0010599 | production of lsiRNA involved in RNA interference(GO:0010599) |
| 0.1 | 1.1 | GO:1903830 | magnesium ion transmembrane transport(GO:1903830) |
| 0.1 | 0.5 | GO:0006598 | polyamine catabolic process(GO:0006598) |
| 0.1 | 2.4 | GO:0007033 | vacuole organization(GO:0007033) |
| 0.1 | 0.3 | GO:0006821 | chloride transport(GO:0006821) |
| 0.1 | 0.4 | GO:0034473 | U1 snRNA 3'-end processing(GO:0034473) U5 snRNA 3'-end processing(GO:0034476) nuclear polyadenylation-dependent mRNA catabolic process(GO:0071042) polyadenylation-dependent mRNA catabolic process(GO:0071047) |
| 0.1 | 1.1 | GO:0046685 | response to arsenic-containing substance(GO:0046685) |
| 0.1 | 0.6 | GO:0006749 | glutathione metabolic process(GO:0006749) |
| 0.1 | 0.1 | GO:0018216 | peptidyl-arginine methylation(GO:0018216) histone arginine methylation(GO:0034969) |
| 0.1 | 0.7 | GO:0017006 | protein-tetrapyrrole linkage(GO:0017006) |
| 0.1 | 0.4 | GO:0006336 | DNA replication-independent nucleosome assembly(GO:0006336) |
| 0.1 | 0.9 | GO:0019632 | shikimate metabolic process(GO:0019632) |
| 0.1 | 0.4 | GO:1990258 | box C/D snoRNA 3'-end processing(GO:0000494) peptidyl-glutamine methylation(GO:0018364) box C/D snoRNA metabolic process(GO:0033967) box C/D snoRNA processing(GO:0034963) histone glutamine methylation(GO:1990258) |
| 0.1 | 0.4 | GO:0050792 | regulation of symbiosis, encompassing mutualism through parasitism(GO:0043903) regulation of viral process(GO:0050792) |
| 0.1 | 1.2 | GO:0018202 | peptidyl-diphthamide metabolic process(GO:0017182) peptidyl-diphthamide biosynthetic process from peptidyl-histidine(GO:0017183) peptidyl-histidine modification(GO:0018202) |
| 0.1 | 0.4 | GO:0034308 | primary alcohol metabolic process(GO:0034308) |
| 0.1 | 0.7 | GO:0071586 | CAAX-box protein processing(GO:0071586) CAAX-box protein maturation(GO:0080120) |
| 0.1 | 0.6 | GO:0006891 | intra-Golgi vesicle-mediated transport(GO:0006891) |
| 0.1 | 0.4 | GO:0046865 | isoprenoid transport(GO:0046864) terpenoid transport(GO:0046865) |
| 0.1 | 4.4 | GO:0006874 | cellular calcium ion homeostasis(GO:0006874) calcium ion homeostasis(GO:0055074) |
| 0.1 | 0.7 | GO:0043484 | regulation of RNA splicing(GO:0043484) |
| 0.1 | 0.4 | GO:0010394 | homogalacturonan biosynthetic process(GO:0010289) homogalacturonan metabolic process(GO:0010394) |
| 0.1 | 0.5 | GO:0046416 | D-amino acid metabolic process(GO:0046416) |
| 0.1 | 0.6 | GO:0006285 | base-excision repair, AP site formation(GO:0006285) DNA dealkylation involved in DNA repair(GO:0006307) |
| 0.1 | 0.9 | GO:0015914 | phospholipid transport(GO:0015914) |
| 0.1 | 1.5 | GO:0034976 | response to endoplasmic reticulum stress(GO:0034976) |
| 0.1 | 5.2 | GO:0009615 | response to virus(GO:0009615) |
| 0.1 | 3.6 | GO:0006333 | chromatin assembly or disassembly(GO:0006333) |
| 0.1 | 2.5 | GO:0006568 | tryptophan metabolic process(GO:0006568) indolalkylamine metabolic process(GO:0006586) |
| 0.1 | 0.9 | GO:0016925 | protein sumoylation(GO:0016925) |
| 0.1 | 1.3 | GO:0042753 | positive regulation of circadian rhythm(GO:0042753) |
| 0.1 | 0.7 | GO:0006552 | leucine catabolic process(GO:0006552) |
| 0.1 | 0.4 | GO:0070601 | centromeric sister chromatid cohesion(GO:0070601) |
| 0.1 | 0.4 | GO:0046051 | UTP biosynthetic process(GO:0006228) UTP metabolic process(GO:0046051) |
| 0.1 | 0.6 | GO:0042343 | indole glucosinolate metabolic process(GO:0042343) |
| 0.1 | 0.4 | GO:0001173 | DNA-templated transcriptional start site selection(GO:0001173) |
| 0.1 | 0.3 | GO:0033615 | mitochondrial proton-transporting ATP synthase complex assembly(GO:0033615) |
| 0.1 | 3.0 | GO:0010941 | regulation of cell death(GO:0010941) |
| 0.1 | 0.5 | GO:0098876 | vesicle-mediated transport to the plasma membrane(GO:0098876) |
| 0.1 | 0.4 | GO:0055070 | copper ion homeostasis(GO:0055070) |
| 0.1 | 0.3 | GO:0051211 | anisotropic cell growth(GO:0051211) |
| 0.1 | 2.6 | GO:0032786 | positive regulation of DNA-templated transcription, elongation(GO:0032786) |
| 0.1 | 5.6 | GO:0031347 | regulation of defense response(GO:0031347) |
| 0.1 | 0.2 | GO:1901600 | lactone metabolic process(GO:1901334) lactone biosynthetic process(GO:1901336) strigolactone metabolic process(GO:1901600) strigolactone biosynthetic process(GO:1901601) |
| 0.1 | 0.9 | GO:0006491 | N-glycan processing(GO:0006491) |
| 0.1 | 0.6 | GO:0006379 | mRNA cleavage(GO:0006379) |
| 0.1 | 2.7 | GO:0007166 | cell surface receptor signaling pathway(GO:0007166) |
| 0.1 | 1.0 | GO:0006406 | mRNA export from nucleus(GO:0006406) mRNA transport(GO:0051028) mRNA-containing ribonucleoprotein complex export from nucleus(GO:0071427) |
| 0.1 | 0.3 | GO:0045905 | positive regulation of translational elongation(GO:0045901) positive regulation of translational termination(GO:0045905) |
| 0.1 | 7.8 | GO:0000209 | protein polyubiquitination(GO:0000209) |
| 0.1 | 1.0 | GO:0007186 | G-protein coupled receptor signaling pathway(GO:0007186) |
| 0.1 | 0.7 | GO:0080186 | developmental vegetative growth(GO:0080186) |
| 0.1 | 2.5 | GO:0006623 | protein targeting to vacuole(GO:0006623) protein localization to vacuole(GO:0072665) establishment of protein localization to vacuole(GO:0072666) |
| 0.1 | 0.2 | GO:0034472 | snRNA processing(GO:0016180) snRNA 3'-end processing(GO:0034472) |
| 0.1 | 6.5 | GO:0031146 | SCF-dependent proteasomal ubiquitin-dependent protein catabolic process(GO:0031146) |
| 0.1 | 0.7 | GO:0006000 | fructose metabolic process(GO:0006000) |
| 0.1 | 0.4 | GO:0046786 | viral replication complex formation and maintenance(GO:0046786) |
| 0.1 | 0.5 | GO:0070125 | mitochondrial translational elongation(GO:0070125) |
| 0.1 | 0.7 | GO:0018107 | peptidyl-threonine phosphorylation(GO:0018107) peptidyl-threonine modification(GO:0018210) |
| 0.1 | 0.2 | GO:0009747 | hexokinase-dependent signaling(GO:0009747) |
| 0.1 | 0.5 | GO:0090355 | positive regulation of auxin biosynthetic process(GO:0010601) positive regulation of auxin metabolic process(GO:0090355) |
| 0.1 | 0.5 | GO:0048530 | fruit morphogenesis(GO:0048530) |
| 0.1 | 0.7 | GO:0051262 | protein tetramerization(GO:0051262) |
| 0.1 | 1.2 | GO:0035196 | production of miRNAs involved in gene silencing by miRNA(GO:0035196) |
| 0.1 | 0.8 | GO:0006488 | dolichol-linked oligosaccharide biosynthetic process(GO:0006488) |
| 0.1 | 0.8 | GO:0006086 | acetyl-CoA biosynthetic process from pyruvate(GO:0006086) |
| 0.1 | 0.5 | GO:0015074 | DNA integration(GO:0015074) |
| 0.1 | 0.8 | GO:0043462 | regulation of ATPase activity(GO:0043462) |
| 0.1 | 0.7 | GO:0010193 | response to ozone(GO:0010193) |
| 0.1 | 34.8 | GO:0016567 | protein ubiquitination(GO:0016567) |
| 0.1 | 0.4 | GO:0009560 | embryo sac egg cell differentiation(GO:0009560) |
| 0.1 | 0.4 | GO:0006446 | regulation of translational initiation(GO:0006446) |
| 0.1 | 4.8 | GO:0008037 | cell recognition(GO:0008037) recognition of pollen(GO:0048544) |
| 0.1 | 0.4 | GO:0033674 | positive regulation of kinase activity(GO:0033674) positive regulation of protein kinase activity(GO:0045860) |
| 0.1 | 0.2 | GO:0051973 | positive regulation of telomerase activity(GO:0051973) |
| 0.1 | 2.8 | GO:0000122 | negative regulation of transcription from RNA polymerase II promoter(GO:0000122) |
| 0.1 | 3.7 | GO:0009694 | jasmonic acid metabolic process(GO:0009694) |
| 0.1 | 1.3 | GO:0006465 | signal peptide processing(GO:0006465) |
| 0.1 | 0.1 | GO:0015744 | succinate transport(GO:0015744) |
| 0.1 | 0.3 | GO:0006435 | threonyl-tRNA aminoacylation(GO:0006435) |
| 0.1 | 0.5 | GO:0042360 | vitamin E biosynthetic process(GO:0010189) vitamin E metabolic process(GO:0042360) |
| 0.1 | 2.2 | GO:0010499 | proteasomal ubiquitin-independent protein catabolic process(GO:0010499) |
| 0.1 | 0.2 | GO:0034728 | nucleosome organization(GO:0034728) |
| 0.1 | 2.5 | GO:0006367 | transcription initiation from RNA polymerase II promoter(GO:0006367) |
| 0.1 | 0.6 | GO:0006522 | alanine metabolic process(GO:0006522) alanine catabolic process(GO:0006524) pyruvate family amino acid metabolic process(GO:0009078) pyruvate family amino acid catabolic process(GO:0009080) L-alanine metabolic process(GO:0042851) L-alanine catabolic process(GO:0042853) |
| 0.1 | 2.8 | GO:0034605 | cellular response to heat(GO:0034605) |
| 0.1 | 0.9 | GO:0046513 | ceramide biosynthetic process(GO:0046513) |
| 0.1 | 0.1 | GO:0000478 | endonucleolytic cleavage involved in rRNA processing(GO:0000478) |
| 0.1 | 11.6 | GO:0051603 | proteolysis involved in cellular protein catabolic process(GO:0051603) |
| 0.1 | 3.1 | GO:0019722 | calcium-mediated signaling(GO:0019722) |
| 0.1 | 0.1 | GO:0000469 | cleavage involved in rRNA processing(GO:0000469) |
| 0.1 | 0.5 | GO:0010100 | negative regulation of photomorphogenesis(GO:0010100) |
| 0.1 | 0.3 | GO:0030308 | negative regulation of cell growth(GO:0030308) |
| 0.1 | 0.5 | GO:0009554 | megasporogenesis(GO:0009554) |
| 0.1 | 0.9 | GO:0000387 | spliceosomal snRNP assembly(GO:0000387) |
| 0.1 | 0.3 | GO:0072503 | cellular divalent inorganic cation homeostasis(GO:0072503) |
| 0.1 | 17.3 | GO:0009651 | response to salt stress(GO:0009651) |
| 0.1 | 0.8 | GO:0050821 | protein stabilization(GO:0050821) |
| 0.1 | 0.6 | GO:0016233 | telomere capping(GO:0016233) |
| 0.1 | 0.8 | GO:0046688 | response to copper ion(GO:0046688) |
| 0.1 | 0.2 | GO:0072388 | FAD biosynthetic process(GO:0006747) flavin adenine dinucleotide biosynthetic process(GO:0072388) |
| 0.1 | 0.2 | GO:0043547 | positive regulation of GTPase activity(GO:0043547) |
| 0.1 | 2.9 | GO:0006897 | endocytosis(GO:0006897) |
| 0.1 | 0.7 | GO:0042439 | ethanolamine-containing compound metabolic process(GO:0042439) |
| 0.1 | 1.3 | GO:0003333 | amino acid transmembrane transport(GO:0003333) |
| 0.1 | 0.3 | GO:0070072 | proton-transporting V-type ATPase complex assembly(GO:0070070) vacuolar proton-transporting V-type ATPase complex assembly(GO:0070072) |
| 0.1 | 0.4 | GO:0080190 | lateral growth(GO:0080190) |
| 0.1 | 0.3 | GO:1901271 | lipid A biosynthetic process(GO:0009245) lipid A metabolic process(GO:0046493) lipooligosaccharide metabolic process(GO:1901269) lipooligosaccharide biosynthetic process(GO:1901271) |
| 0.1 | 0.3 | GO:0051131 | chaperone-mediated protein complex assembly(GO:0051131) |
| 0.1 | 0.8 | GO:0018393 | internal protein amino acid acetylation(GO:0006475) histone acetylation(GO:0016573) internal peptidyl-lysine acetylation(GO:0018393) peptidyl-lysine acetylation(GO:0018394) |
| 0.1 | 0.2 | GO:0009662 | etioplast organization(GO:0009662) |
| 0.1 | 1.1 | GO:0009867 | jasmonic acid mediated signaling pathway(GO:0009867) |
| 0.1 | 7.0 | GO:0006470 | protein dephosphorylation(GO:0006470) |
| 0.1 | 0.6 | GO:0045927 | positive regulation of growth(GO:0045927) |
| 0.1 | 0.6 | GO:0033319 | UDP-D-xylose metabolic process(GO:0033319) UDP-D-xylose biosynthetic process(GO:0033320) |
| 0.1 | 1.9 | GO:0000462 | maturation of SSU-rRNA from tricistronic rRNA transcript (SSU-rRNA, 5.8S rRNA, LSU-rRNA)(GO:0000462) |
| 0.1 | 0.3 | GO:0006120 | mitochondrial electron transport, NADH to ubiquinone(GO:0006120) |
| 0.1 | 0.4 | GO:0032957 | inositol trisphosphate metabolic process(GO:0032957) |
| 0.1 | 0.5 | GO:0045039 | protein import into mitochondrial inner membrane(GO:0045039) |
| 0.1 | 0.8 | GO:0010821 | regulation of mitochondrion organization(GO:0010821) |
| 0.1 | 1.9 | GO:0034599 | cellular response to oxidative stress(GO:0034599) |
| 0.1 | 0.4 | GO:0018344 | protein geranylgeranylation(GO:0018344) |
| 0.1 | 0.2 | GO:1905157 | positive regulation of photosynthesis(GO:1905157) |
| 0.1 | 0.7 | GO:0032366 | intracellular sterol transport(GO:0032366) |
| 0.1 | 0.2 | GO:0019344 | cysteine biosynthetic process(GO:0019344) |
| 0.1 | 0.4 | GO:0048317 | seed morphogenesis(GO:0048317) |
| 0.1 | 0.2 | GO:0032844 | regulation of homeostatic process(GO:0032844) |
| 0.1 | 2.8 | GO:0009561 | megagametogenesis(GO:0009561) |
| 0.1 | 0.8 | GO:0045040 | outer mitochondrial membrane organization(GO:0007008) protein import into mitochondrial outer membrane(GO:0045040) |
| 0.1 | 0.6 | GO:0006890 | retrograde vesicle-mediated transport, Golgi to ER(GO:0006890) |
| 0.1 | 0.9 | GO:0006075 | (1->3)-beta-D-glucan metabolic process(GO:0006074) (1->3)-beta-D-glucan biosynthetic process(GO:0006075) |
| 0.1 | 0.3 | GO:0000395 | mRNA 5'-splice site recognition(GO:0000395) |
| 0.1 | 0.5 | GO:0007064 | mitotic sister chromatid cohesion(GO:0007064) |
| 0.1 | 0.2 | GO:0000012 | single strand break repair(GO:0000012) |
| 0.1 | 0.5 | GO:0015706 | nitrate transport(GO:0015706) |
| 0.1 | 0.2 | GO:0071431 | tRNA export from nucleus(GO:0006409) tRNA transport(GO:0051031) tRNA-containing ribonucleoprotein complex export from nucleus(GO:0071431) |
| 0.1 | 0.2 | GO:0000455 | enzyme-directed rRNA pseudouridine synthesis(GO:0000455) |
| 0.1 | 0.4 | GO:0010332 | response to gamma radiation(GO:0010332) |
| 0.1 | 0.3 | GO:0043966 | histone H3 acetylation(GO:0043966) |
| 0.1 | 2.2 | GO:0006913 | nucleocytoplasmic transport(GO:0006913) nuclear transport(GO:0051169) |
| 0.0 | 0.1 | GO:0019720 | Mo-molybdopterin cofactor biosynthetic process(GO:0006777) response to lead ion(GO:0010288) Mo-molybdopterin cofactor metabolic process(GO:0019720) molybdopterin cofactor biosynthetic process(GO:0032324) molybdopterin cofactor metabolic process(GO:0043545) prosthetic group metabolic process(GO:0051189) |
| 0.0 | 0.6 | GO:0009396 | folic acid-containing compound biosynthetic process(GO:0009396) |
| 0.0 | 0.3 | GO:0070298 | negative regulation of ethylene-activated signaling pathway(GO:0010105) negative regulation of phosphorelay signal transduction system(GO:0070298) negative regulation of intracellular signal transduction(GO:1902532) |
| 0.0 | 0.3 | GO:0006368 | transcription elongation from RNA polymerase II promoter(GO:0006368) |
| 0.0 | 0.2 | GO:0010344 | seed oilbody biogenesis(GO:0010344) |
| 0.0 | 2.1 | GO:0009624 | response to nematode(GO:0009624) |
| 0.0 | 0.1 | GO:0006651 | diacylglycerol biosynthetic process(GO:0006651) |
| 0.0 | 0.3 | GO:0031119 | tRNA pseudouridine synthesis(GO:0031119) |
| 0.0 | 0.6 | GO:0009395 | phospholipid catabolic process(GO:0009395) |
| 0.0 | 0.4 | GO:0043044 | ATP-dependent chromatin remodeling(GO:0043044) |
| 0.0 | 0.6 | GO:0000460 | maturation of 5.8S rRNA(GO:0000460) |
| 0.0 | 0.8 | GO:0046283 | anthocyanin-containing compound metabolic process(GO:0046283) |
| 0.0 | 1.3 | GO:0006352 | DNA-templated transcription, initiation(GO:0006352) |
| 0.0 | 0.3 | GO:0010187 | negative regulation of seed germination(GO:0010187) |
| 0.0 | 0.4 | GO:0006574 | valine catabolic process(GO:0006574) |
| 0.0 | 0.1 | GO:0006427 | histidyl-tRNA aminoacylation(GO:0006427) |
| 0.0 | 0.4 | GO:0080156 | mitochondrial mRNA modification(GO:0080156) |
| 0.0 | 4.3 | GO:0000398 | mRNA splicing, via spliceosome(GO:0000398) |
| 0.0 | 7.7 | GO:0006979 | response to oxidative stress(GO:0006979) |
| 0.0 | 0.3 | GO:0010396 | rhamnogalacturonan II biosynthetic process(GO:0010306) rhamnogalacturonan II metabolic process(GO:0010396) |
| 0.0 | 0.3 | GO:0051596 | lactate metabolic process(GO:0006089) methylglyoxal metabolic process(GO:0009438) methylglyoxal catabolic process to D-lactate via S-lactoyl-glutathione(GO:0019243) ketone catabolic process(GO:0042182) methylglyoxal catabolic process(GO:0051596) methylglyoxal catabolic process to lactate(GO:0061727) |
| 0.0 | 0.6 | GO:0071577 | zinc II ion transmembrane transport(GO:0071577) |
| 0.0 | 0.5 | GO:0031048 | chromatin silencing by small RNA(GO:0031048) |
| 0.0 | 1.7 | GO:0055046 | microgametogenesis(GO:0055046) |
| 0.0 | 0.1 | GO:0009855 | determination of bilateral symmetry(GO:0009855) |
| 0.0 | 0.4 | GO:0016554 | base conversion or substitution editing(GO:0016553) cytidine to uridine editing(GO:0016554) |
| 0.0 | 0.2 | GO:0001682 | tRNA 5'-leader removal(GO:0001682) |
| 0.0 | 1.2 | GO:0009911 | positive regulation of flower development(GO:0009911) |
| 0.0 | 0.7 | GO:0032981 | mitochondrial respiratory chain complex I assembly(GO:0032981) mitochondrial respiratory chain complex I biogenesis(GO:0097031) |
| 0.0 | 0.5 | GO:0010030 | positive regulation of seed germination(GO:0010030) |
| 0.0 | 0.5 | GO:0002097 | tRNA wobble base modification(GO:0002097) |
| 0.0 | 0.2 | GO:0052386 | cell wall thickening(GO:0052386) |
| 0.0 | 0.1 | GO:0006430 | lysyl-tRNA aminoacylation(GO:0006430) |
| 0.0 | 0.3 | GO:0006102 | isocitrate metabolic process(GO:0006102) |
| 0.0 | 1.1 | GO:0010224 | response to UV-B(GO:0010224) |
| 0.0 | 0.6 | GO:0034394 | protein localization to cell surface(GO:0034394) |
| 0.0 | 0.2 | GO:0006616 | SRP-dependent cotranslational protein targeting to membrane, translocation(GO:0006616) |
| 0.0 | 0.2 | GO:0006370 | 7-methylguanosine mRNA capping(GO:0006370) |
| 0.0 | 0.1 | GO:1901006 | ubiquinone-6 metabolic process(GO:1901004) ubiquinone-6 biosynthetic process(GO:1901006) |
| 0.0 | 0.1 | GO:0035627 | ceramide transport(GO:0035627) |
| 0.0 | 0.1 | GO:0090481 | pyrimidine-containing compound transmembrane transport(GO:0072531) pyrimidine nucleotide-sugar transmembrane transport(GO:0090481) |
| 0.0 | 0.6 | GO:0090332 | stomatal closure(GO:0090332) |
| 0.0 | 0.2 | GO:0045740 | positive regulation of DNA replication(GO:0045740) |
| 0.0 | 0.3 | GO:0010050 | vegetative phase change(GO:0010050) |
| 0.0 | 0.7 | GO:0030042 | actin filament depolymerization(GO:0030042) |
| 0.0 | 0.4 | GO:0006383 | transcription from RNA polymerase III promoter(GO:0006383) |
| 0.0 | 0.2 | GO:0009954 | proximal/distal pattern formation(GO:0009954) |
| 0.0 | 0.6 | GO:0016197 | endosomal transport(GO:0016197) |
| 0.0 | 0.2 | GO:0009068 | aspartate family amino acid catabolic process(GO:0009068) |
| 0.0 | 0.0 | GO:0051340 | regulation of ligase activity(GO:0051340) positive regulation of ligase activity(GO:0051351) |
| 0.0 | 0.5 | GO:0010252 | auxin homeostasis(GO:0010252) |
| 0.0 | 0.0 | GO:0032351 | negative regulation of hormone metabolic process(GO:0032351) |
| 0.0 | 0.1 | GO:0046512 | sphingosine metabolic process(GO:0006670) diol metabolic process(GO:0034311) diol biosynthetic process(GO:0034312) sphingosine biosynthetic process(GO:0046512) |
| 0.0 | 0.4 | GO:1900673 | ethylene metabolic process(GO:0009692) ethylene biosynthetic process(GO:0009693) cellular alkene metabolic process(GO:0043449) alkene biosynthetic process(GO:0043450) olefin metabolic process(GO:1900673) olefin biosynthetic process(GO:1900674) |
| 0.0 | 0.1 | GO:0019566 | arabinose metabolic process(GO:0019566) |
| 0.0 | 0.4 | GO:0006875 | cellular metal ion homeostasis(GO:0006875) |
| 0.0 | 0.0 | GO:0019321 | pentose metabolic process(GO:0019321) |
| 0.0 | 0.0 | GO:0015800 | acidic amino acid transport(GO:0015800) |
| 0.0 | 0.3 | GO:0000105 | histidine biosynthetic process(GO:0000105) histidine metabolic process(GO:0006547) imidazole-containing compound metabolic process(GO:0052803) |
| 0.0 | 0.0 | GO:0055122 | response to very low light intensity stimulus(GO:0055122) |
| 0.0 | 0.2 | GO:0002183 | cytoplasmic translational initiation(GO:0002183) |
| 0.0 | 0.1 | GO:0016075 | rRNA catabolic process(GO:0016075) |
| 0.0 | 0.1 | GO:0010500 | transmitting tissue development(GO:0010500) |
| 0.0 | 0.2 | GO:0031123 | RNA 3'-end processing(GO:0031123) |
| 0.0 | 0.1 | GO:0009957 | epidermal cell fate specification(GO:0009957) |
| 0.0 | 0.1 | GO:0000463 | maturation of LSU-rRNA from tricistronic rRNA transcript (SSU-rRNA, 5.8S rRNA, LSU-rRNA)(GO:0000463) |
| 0.0 | 0.0 | GO:0000289 | nuclear-transcribed mRNA poly(A) tail shortening(GO:0000289) |
| 0.0 | 0.1 | GO:0006312 | mitotic recombination(GO:0006312) |
| 0.0 | 0.0 | GO:0000379 | tRNA-type intron splice site recognition and cleavage(GO:0000379) |
| 0.0 | 0.1 | GO:0045859 | regulation of kinase activity(GO:0043549) regulation of protein kinase activity(GO:0045859) |
| 0.0 | 0.2 | GO:0006413 | translational initiation(GO:0006413) |
| 0.0 | 0.1 | GO:1990937 | xylan acetylation(GO:1990937) |
| 0.0 | 0.7 | GO:0018105 | peptidyl-serine phosphorylation(GO:0018105) peptidyl-serine modification(GO:0018209) |
Gene overrepresentation in cellular component category:
| Log-likelihood per target | Total log-likelihood | Term | Description |
|---|---|---|---|
| 0.8 | 5.0 | GO:0005776 | autophagosome(GO:0005776) |
| 0.6 | 3.6 | GO:0034098 | VCP-NPL4-UFD1 AAA ATPase complex(GO:0034098) |
| 0.6 | 3.4 | GO:0031205 | endoplasmic reticulum Sec complex(GO:0031205) |
| 0.5 | 1.6 | GO:1990112 | RQC complex(GO:1990112) |
| 0.5 | 3.7 | GO:0031372 | ubiquitin conjugating enzyme complex(GO:0031371) UBC13-MMS2 complex(GO:0031372) |
| 0.5 | 1.5 | GO:0005674 | transcription factor TFIIF complex(GO:0005674) |
| 0.5 | 3.0 | GO:0055038 | recycling endosome membrane(GO:0055038) |
| 0.5 | 1.5 | GO:0034703 | ion channel complex(GO:0034702) cation channel complex(GO:0034703) |
| 0.5 | 9.1 | GO:0016602 | CCAAT-binding factor complex(GO:0016602) |
| 0.4 | 2.2 | GO:0035061 | interchromatin granule(GO:0035061) |
| 0.4 | 1.7 | GO:0000220 | vacuolar proton-transporting V-type ATPase, V0 domain(GO:0000220) |
| 0.4 | 1.2 | GO:0031417 | N-terminal protein acetyltransferase complex(GO:0031414) NatC complex(GO:0031417) |
| 0.4 | 0.4 | GO:0031021 | interphase microtubule organizing center(GO:0031021) |
| 0.4 | 2.7 | GO:0000153 | cytoplasmic ubiquitin ligase complex(GO:0000153) |
| 0.4 | 1.1 | GO:0005712 | chiasma(GO:0005712) |
| 0.4 | 1.5 | GO:0097550 | transcriptional preinitiation complex(GO:0097550) |
| 0.4 | 1.1 | GO:0045334 | clathrin-coated endocytic vesicle(GO:0045334) |
| 0.4 | 5.6 | GO:0005779 | integral component of peroxisomal membrane(GO:0005779) intrinsic component of peroxisomal membrane(GO:0031231) |
| 0.4 | 5.6 | GO:0005801 | cis-Golgi network(GO:0005801) |
| 0.4 | 1.5 | GO:0035032 | phosphatidylinositol 3-kinase complex(GO:0005942) phosphatidylinositol 3-kinase complex, class III, type I(GO:0034271) phosphatidylinositol 3-kinase complex, class III, type II(GO:0034272) phosphatidylinositol 3-kinase complex, class III(GO:0035032) |
| 0.4 | 0.4 | GO:0000439 | core TFIIH complex(GO:0000439) |
| 0.4 | 3.2 | GO:0045252 | oxoglutarate dehydrogenase complex(GO:0045252) |
| 0.4 | 2.1 | GO:0017053 | transcriptional repressor complex(GO:0017053) |
| 0.3 | 0.3 | GO:0030906 | retromer, cargo-selective complex(GO:0030906) |
| 0.3 | 8.0 | GO:0010494 | cytoplasmic stress granule(GO:0010494) |
| 0.3 | 1.9 | GO:0030127 | COPII vesicle coat(GO:0030127) |
| 0.3 | 1.6 | GO:0001673 | male germ cell nucleus(GO:0001673) |
| 0.3 | 1.6 | GO:0034657 | GID complex(GO:0034657) |
| 0.3 | 1.8 | GO:0043076 | megasporocyte nucleus(GO:0043076) polar nucleus(GO:0043078) |
| 0.3 | 0.3 | GO:0030131 | clathrin adaptor complex(GO:0030131) |
| 0.3 | 3.3 | GO:0000322 | storage vacuole(GO:0000322) protein storage vacuole(GO:0000326) |
| 0.3 | 2.4 | GO:0070390 | transcription export complex 2(GO:0070390) |
| 0.3 | 1.5 | GO:0048188 | Set1C/COMPASS complex(GO:0048188) |
| 0.3 | 2.7 | GO:0017119 | Golgi transport complex(GO:0017119) |
| 0.3 | 0.9 | GO:0031080 | nuclear pore outer ring(GO:0031080) |
| 0.3 | 2.3 | GO:0005834 | heterotrimeric G-protein complex(GO:0005834) |
| 0.3 | 0.3 | GO:0030689 | Noc complex(GO:0030689) |
| 0.3 | 4.5 | GO:0000786 | nucleosome(GO:0000786) |
| 0.3 | 2.1 | GO:0005956 | protein kinase CK2 complex(GO:0005956) |
| 0.3 | 1.1 | GO:0043625 | delta DNA polymerase complex(GO:0043625) |
| 0.3 | 0.8 | GO:0034457 | Mpp10 complex(GO:0034457) |
| 0.3 | 4.9 | GO:0031965 | nuclear membrane(GO:0031965) |
| 0.3 | 5.9 | GO:0005771 | multivesicular body(GO:0005771) |
| 0.3 | 2.6 | GO:0030014 | CCR4-NOT complex(GO:0030014) |
| 0.3 | 1.0 | GO:0035102 | PRC1 complex(GO:0035102) |
| 0.2 | 1.7 | GO:0042406 | extrinsic component of endoplasmic reticulum membrane(GO:0042406) |
| 0.2 | 1.5 | GO:0070552 | BRISC complex(GO:0070552) |
| 0.2 | 2.9 | GO:0005849 | mRNA cleavage factor complex(GO:0005849) |
| 0.2 | 1.7 | GO:0030897 | HOPS complex(GO:0030897) |
| 0.2 | 1.2 | GO:0035861 | site of double-strand break(GO:0035861) |
| 0.2 | 1.4 | GO:0005947 | mitochondrial alpha-ketoglutarate dehydrogenase complex(GO:0005947) mitochondrial tricarboxylic acid cycle enzyme complex(GO:0030062) |
| 0.2 | 1.4 | GO:0000164 | protein phosphatase type 1 complex(GO:0000164) |
| 0.2 | 3.2 | GO:0030125 | clathrin vesicle coat(GO:0030125) |
| 0.2 | 3.9 | GO:0005750 | mitochondrial respiratory chain complex III(GO:0005750) respiratory chain complex III(GO:0045275) |
| 0.2 | 1.4 | GO:0038201 | TORC1 complex(GO:0031931) TOR complex(GO:0038201) |
| 0.2 | 0.4 | GO:0016471 | vacuolar proton-transporting V-type ATPase complex(GO:0016471) |
| 0.2 | 14.9 | GO:0019005 | SCF ubiquitin ligase complex(GO:0019005) |
| 0.2 | 2.6 | GO:0070062 | extracellular organelle(GO:0043230) extracellular exosome(GO:0070062) extracellular vesicle(GO:1903561) |
| 0.2 | 7.1 | GO:0030173 | integral component of Golgi membrane(GO:0030173) intrinsic component of Golgi membrane(GO:0031228) |
| 0.2 | 0.8 | GO:0034715 | pICln-Sm protein complex(GO:0034715) |
| 0.2 | 2.3 | GO:0005765 | lysosomal membrane(GO:0005765) lytic vacuole membrane(GO:0098852) |
| 0.2 | 1.6 | GO:0005697 | telomerase holoenzyme complex(GO:0005697) |
| 0.2 | 1.4 | GO:0071012 | U2-type catalytic step 1 spliceosome(GO:0071006) catalytic step 1 spliceosome(GO:0071012) |
| 0.2 | 4.1 | GO:0031307 | intrinsic component of mitochondrial outer membrane(GO:0031306) integral component of mitochondrial outer membrane(GO:0031307) |
| 0.2 | 1.9 | GO:0031597 | cytosolic proteasome complex(GO:0031597) |
| 0.2 | 5.3 | GO:1903293 | protein serine/threonine phosphatase complex(GO:0008287) phosphatase complex(GO:1903293) |
| 0.2 | 0.8 | GO:0005967 | mitochondrial pyruvate dehydrogenase complex(GO:0005967) |
| 0.2 | 1.9 | GO:0005793 | endoplasmic reticulum-Golgi intermediate compartment(GO:0005793) |
| 0.2 | 3.0 | GO:0070461 | SAGA-type complex(GO:0070461) |
| 0.2 | 1.4 | GO:0016593 | Cdc73/Paf1 complex(GO:0016593) |
| 0.2 | 1.3 | GO:0005798 | Golgi-associated vesicle(GO:0005798) |
| 0.2 | 1.8 | GO:0010168 | ER body(GO:0010168) |
| 0.2 | 2.1 | GO:0005682 | U5 snRNP(GO:0005682) |
| 0.2 | 5.3 | GO:0005764 | lysosome(GO:0005764) |
| 0.2 | 8.3 | GO:0016592 | mediator complex(GO:0016592) |
| 0.2 | 2.1 | GO:0019774 | proteasome core complex, beta-subunit complex(GO:0019774) |
| 0.2 | 0.9 | GO:0005677 | chromatin silencing complex(GO:0005677) |
| 0.2 | 1.0 | GO:0030140 | trans-Golgi network transport vesicle(GO:0030140) |
| 0.2 | 1.7 | GO:0072546 | ER membrane protein complex(GO:0072546) |
| 0.2 | 0.8 | GO:0030141 | secretory granule(GO:0030141) |
| 0.2 | 5.6 | GO:0009504 | cell plate(GO:0009504) |
| 0.2 | 3.3 | GO:0098562 | cytoplasmic side of membrane(GO:0098562) |
| 0.2 | 23.2 | GO:0000325 | plant-type vacuole(GO:0000325) |
| 0.2 | 1.4 | GO:0010445 | nuclear dicing body(GO:0010445) |
| 0.2 | 0.6 | GO:0031357 | intrinsic component of plastid inner membrane(GO:0031352) integral component of plastid inner membrane(GO:0031353) intrinsic component of chloroplast inner membrane(GO:0031356) integral component of chloroplast inner membrane(GO:0031357) |
| 0.2 | 0.8 | GO:0044545 | NSL complex(GO:0044545) |
| 0.2 | 9.9 | GO:0005635 | nuclear envelope(GO:0005635) |
| 0.2 | 1.5 | GO:0008180 | COP9 signalosome(GO:0008180) |
| 0.1 | 2.4 | GO:0071011 | precatalytic spliceosome(GO:0071011) |
| 0.1 | 0.3 | GO:0071541 | eukaryotic translation initiation factor 3 complex, eIF3m(GO:0071541) |
| 0.1 | 0.9 | GO:0005688 | U6 snRNP(GO:0005688) |
| 0.1 | 3.0 | GO:0031903 | peroxisomal membrane(GO:0005778) microbody membrane(GO:0031903) |
| 0.1 | 0.7 | GO:0042765 | GPI-anchor transamidase complex(GO:0042765) |
| 0.1 | 0.3 | GO:0055037 | recycling endosome(GO:0055037) |
| 0.1 | 0.6 | GO:0005672 | transcription factor TFIIA complex(GO:0005672) |
| 0.1 | 1.6 | GO:0005786 | signal recognition particle, endoplasmic reticulum targeting(GO:0005786) |
| 0.1 | 1.4 | GO:0005832 | chaperonin-containing T-complex(GO:0005832) |
| 0.1 | 0.5 | GO:0005853 | eukaryotic translation elongation factor 1 complex(GO:0005853) |
| 0.1 | 0.4 | GO:0042709 | succinate-CoA ligase complex(GO:0042709) |
| 0.1 | 0.3 | GO:0005846 | nuclear cap binding complex(GO:0005846) |
| 0.1 | 1.1 | GO:0000813 | ESCRT I complex(GO:0000813) |
| 0.1 | 0.4 | GO:0034518 | mRNA cap binding complex(GO:0005845) RNA cap binding complex(GO:0034518) |
| 0.1 | 1.3 | GO:0005788 | endoplasmic reticulum lumen(GO:0005788) |
| 0.1 | 3.1 | GO:0000781 | chromosome, telomeric region(GO:0000781) |
| 0.1 | 2.3 | GO:0031304 | intrinsic component of mitochondrial inner membrane(GO:0031304) |
| 0.1 | 4.4 | GO:0000137 | Golgi cis cisterna(GO:0000137) |
| 0.1 | 1.4 | GO:0008278 | cohesin complex(GO:0008278) |
| 0.1 | 0.6 | GO:0019897 | extrinsic component of plasma membrane(GO:0019897) |
| 0.1 | 1.4 | GO:0005758 | mitochondrial intermembrane space(GO:0005758) |
| 0.1 | 0.4 | GO:0030874 | nucleolar chromatin(GO:0030874) |
| 0.1 | 0.5 | GO:0098573 | intrinsic component of mitochondrial membrane(GO:0098573) |
| 0.1 | 1.5 | GO:0005742 | mitochondrial outer membrane translocase complex(GO:0005742) |
| 0.1 | 0.9 | GO:0035619 | root hair tip(GO:0035619) |
| 0.1 | 5.9 | GO:0000139 | Golgi membrane(GO:0000139) |
| 0.1 | 0.7 | GO:0031312 | extrinsic component of organelle membrane(GO:0031312) |
| 0.1 | 1.4 | GO:0005769 | early endosome(GO:0005769) |
| 0.1 | 1.4 | GO:0033179 | proton-transporting V-type ATPase, V0 domain(GO:0033179) |
| 0.1 | 3.1 | GO:0000932 | cytoplasmic mRNA processing body(GO:0000932) |
| 0.1 | 0.7 | GO:0035145 | exon-exon junction complex(GO:0035145) |
| 0.1 | 0.6 | GO:0009331 | glycerol-3-phosphate dehydrogenase complex(GO:0009331) |
| 0.1 | 0.3 | GO:0000110 | nucleotide-excision repair factor 1 complex(GO:0000110) |
| 0.1 | 0.4 | GO:0009569 | chloroplast starch grain(GO:0009569) starch grain(GO:0043036) |
| 0.1 | 0.9 | GO:0031588 | nucleotide-activated protein kinase complex(GO:0031588) |
| 0.1 | 0.4 | GO:0001401 | mitochondrial sorting and assembly machinery complex(GO:0001401) |
| 0.1 | 0.3 | GO:0000243 | commitment complex(GO:0000243) |
| 0.1 | 0.2 | GO:0031351 | intrinsic component of plastid membrane(GO:0031350) integral component of plastid membrane(GO:0031351) |
| 0.1 | 7.9 | GO:0016604 | nuclear body(GO:0016604) |
| 0.1 | 1.0 | GO:0090544 | SWI/SNF complex(GO:0016514) BAF-type complex(GO:0090544) |
| 0.1 | 1.0 | GO:0089701 | U2AF(GO:0089701) |
| 0.1 | 2.3 | GO:0005736 | DNA-directed RNA polymerase I complex(GO:0005736) |
| 0.1 | 0.8 | GO:0030688 | preribosome, small subunit precursor(GO:0030688) |
| 0.1 | 2.3 | GO:0005770 | late endosome(GO:0005770) |
| 0.1 | 0.9 | GO:0035267 | NuA4 histone acetyltransferase complex(GO:0035267) H4/H2A histone acetyltransferase complex(GO:0043189) H4 histone acetyltransferase complex(GO:1902562) |
| 0.1 | 1.8 | GO:0030427 | site of polarized growth(GO:0030427) |
| 0.1 | 2.2 | GO:0022624 | proteasome regulatory particle(GO:0005838) proteasome accessory complex(GO:0022624) |
| 0.1 | 0.5 | GO:0042721 | mitochondrial inner membrane protein insertion complex(GO:0042721) |
| 0.1 | 1.2 | GO:0030687 | preribosome, large subunit precursor(GO:0030687) |
| 0.1 | 0.4 | GO:0044439 | microbody part(GO:0044438) peroxisomal part(GO:0044439) |
| 0.1 | 1.3 | GO:0045281 | respiratory chain complex II(GO:0045273) succinate dehydrogenase complex(GO:0045281) |
| 0.1 | 0.6 | GO:0005673 | transcription factor TFIIE complex(GO:0005673) |
| 0.1 | 0.3 | GO:0034274 | Atg12-Atg5-Atg16 complex(GO:0034274) |
| 0.1 | 17.2 | GO:0000151 | ubiquitin ligase complex(GO:0000151) |
| 0.1 | 2.8 | GO:0010008 | endosome membrane(GO:0010008) |
| 0.1 | 0.8 | GO:0005844 | polysome(GO:0005844) |
| 0.1 | 0.4 | GO:0033176 | proton-transporting V-type ATPase complex(GO:0033176) |
| 0.1 | 0.2 | GO:1902493 | protein acetyltransferase complex(GO:0031248) acetyltransferase complex(GO:1902493) |
| 0.1 | 1.5 | GO:0005669 | transcription factor TFIID complex(GO:0005669) |
| 0.1 | 0.7 | GO:0005675 | holo TFIIH complex(GO:0005675) carboxy-terminal domain protein kinase complex(GO:0032806) |
| 0.1 | 34.4 | GO:0005774 | vacuolar membrane(GO:0005774) |
| 0.1 | 1.4 | GO:0005666 | DNA-directed RNA polymerase III complex(GO:0005666) |
| 0.1 | 6.3 | GO:0005887 | integral component of plasma membrane(GO:0005887) |
| 0.1 | 0.5 | GO:0000312 | plastid small ribosomal subunit(GO:0000312) |
| 0.1 | 0.1 | GO:0008274 | gamma-tubulin large complex(GO:0000931) gamma-tubulin ring complex(GO:0008274) |
| 0.1 | 0.5 | GO:0033588 | Elongator holoenzyme complex(GO:0033588) |
| 0.1 | 0.5 | GO:0000407 | pre-autophagosomal structure(GO:0000407) |
| 0.1 | 0.5 | GO:0009840 | chloroplastic endopeptidase Clp complex(GO:0009840) |
| 0.1 | 0.3 | GO:0033185 | mannosyltransferase complex(GO:0031501) dolichol-phosphate-mannose synthase complex(GO:0033185) |
| 0.1 | 1.3 | GO:0000145 | exocyst(GO:0000145) |
| 0.1 | 0.3 | GO:0008250 | oligosaccharyltransferase complex(GO:0008250) |
| 0.1 | 0.9 | GO:0035097 | histone methyltransferase complex(GO:0035097) |
| 0.1 | 3.1 | GO:0098803 | respiratory chain complex(GO:0098803) |
| 0.1 | 0.4 | GO:0005968 | Rab-protein geranylgeranyltransferase complex(GO:0005968) |
| 0.1 | 1.2 | GO:0000502 | proteasome complex(GO:0000502) |
| 0.1 | 13.9 | GO:0005777 | peroxisome(GO:0005777) microbody(GO:0042579) |
| 0.0 | 3.0 | GO:0005615 | extracellular space(GO:0005615) |
| 0.0 | 0.7 | GO:0000176 | nuclear exosome (RNase complex)(GO:0000176) |
| 0.0 | 3.6 | GO:0005681 | spliceosomal complex(GO:0005681) |
| 0.0 | 2.1 | GO:0090406 | pollen tube(GO:0090406) |
| 0.0 | 3.9 | GO:0018995 | host(GO:0018995) host cell part(GO:0033643) host intracellular part(GO:0033646) host intracellular organelle(GO:0033647) host intracellular membrane-bounded organelle(GO:0033648) host cell nucleus(GO:0042025) intracellular region of host(GO:0043656) host cell(GO:0043657) other organism(GO:0044215) other organism cell(GO:0044216) other organism part(GO:0044217) |
| 0.0 | 2.1 | GO:0009707 | chloroplast outer membrane(GO:0009707) |
| 0.0 | 0.2 | GO:0000346 | transcription export complex(GO:0000346) THO complex part of transcription export complex(GO:0000445) |
| 0.0 | 0.4 | GO:0000127 | transcription factor TFIIIC complex(GO:0000127) |
| 0.0 | 0.4 | GO:0031011 | Ino80 complex(GO:0031011) DNA helicase complex(GO:0033202) |
| 0.0 | 2.8 | GO:0005654 | nucleoplasm(GO:0005654) |
| 0.0 | 96.0 | GO:0005886 | plasma membrane(GO:0005886) |
| 0.0 | 0.4 | GO:0005768 | endosome(GO:0005768) |
| 0.0 | 0.2 | GO:0031082 | BLOC complex(GO:0031082) BLOC-1 complex(GO:0031083) |
| 0.0 | 1.3 | GO:0005667 | transcription factor complex(GO:0005667) |
| 0.0 | 3.9 | GO:0098791 | Golgi subcompartment(GO:0098791) |
| 0.0 | 0.5 | GO:0032040 | small-subunit processome(GO:0032040) |
| 0.0 | 0.0 | GO:0000177 | cytoplasmic exosome (RNase complex)(GO:0000177) |
| 0.0 | 0.1 | GO:0032541 | cortical endoplasmic reticulum(GO:0032541) |
| 0.0 | 2.4 | GO:0000785 | chromatin(GO:0000785) |
| 0.0 | 0.3 | GO:0005762 | mitochondrial large ribosomal subunit(GO:0005762) |
| 0.0 | 0.0 | GO:0032807 | DNA ligase IV complex(GO:0032807) |
| 0.0 | 0.2 | GO:0005852 | eukaryotic translation initiation factor 3 complex(GO:0005852) |
Gene overrepresentation in molecular function category:
| Log-likelihood per target | Total log-likelihood | Term | Description |
|---|---|---|---|
| 1.3 | 5.2 | GO:0052596 | tryptamine:oxygen oxidoreductase (deaminating) activity(GO:0052593) aminoacetone:oxygen oxidoreductase(deaminating) activity(GO:0052594) aliphatic-amine oxidase activity(GO:0052595) phenethylamine:oxygen oxidoreductase (deaminating) activity(GO:0052596) |
| 1.2 | 4.9 | GO:0005432 | calcium:sodium antiporter activity(GO:0005432) |
| 1.1 | 7.9 | GO:0010279 | indole-3-acetic acid amido synthetase activity(GO:0010279) |
| 1.0 | 5.1 | GO:0016768 | spermine synthase activity(GO:0016768) |
| 1.0 | 5.9 | GO:0070547 | L-tyrosine:2-oxoglutarate aminotransferase activity(GO:0004838) L-tyrosine aminotransferase activity(GO:0070547) |
| 1.0 | 2.9 | GO:0003995 | acyl-CoA dehydrogenase activity(GO:0003995) |
| 1.0 | 2.9 | GO:0008519 | ammonium transmembrane transporter activity(GO:0008519) |
| 1.0 | 2.9 | GO:0004353 | glutamate dehydrogenase [NAD(P)+] activity(GO:0004353) |
| 1.0 | 2.9 | GO:0019776 | Atg8 ligase activity(GO:0019776) |
| 1.0 | 1.9 | GO:0047635 | L-alanine:2-oxoglutarate aminotransferase activity(GO:0004021) alanine-oxo-acid transaminase activity(GO:0047635) |
| 0.9 | 2.8 | GO:0008909 | isochorismate synthase activity(GO:0008909) |
| 0.9 | 5.5 | GO:0015368 | calcium:cation antiporter activity(GO:0015368) calcium:proton antiporter activity(GO:0015369) |
| 0.9 | 2.7 | GO:0004557 | alpha-galactosidase activity(GO:0004557) raffinose alpha-galactosidase activity(GO:0052692) |
| 0.9 | 3.5 | GO:0034722 | gamma-glutamyl-peptidase activity(GO:0034722) |
| 0.9 | 3.5 | GO:0070401 | NADP+ binding(GO:0070401) |
| 0.8 | 3.4 | GO:0047782 | coniferin beta-glucosidase activity(GO:0047782) |
| 0.8 | 2.4 | GO:0050736 | O-malonyltransferase activity(GO:0050736) |
| 0.8 | 0.8 | GO:0004352 | glutamate dehydrogenase (NAD+) activity(GO:0004352) |
| 0.8 | 3.1 | GO:0004149 | dihydrolipoyllysine-residue succinyltransferase activity(GO:0004149) succinyltransferase activity(GO:0016748) S-succinyltransferase activity(GO:0016751) |
| 0.8 | 3.8 | GO:1902417 | (+)-abscisic acid D-glucopyranosyl ester transmembrane transporter activity(GO:1902417) |
| 0.8 | 2.3 | GO:0031219 | levanase activity(GO:0031219) fructan beta-fructosidase activity(GO:0051669) |
| 0.8 | 3.8 | GO:0003857 | 3-hydroxyacyl-CoA dehydrogenase activity(GO:0003857) |
| 0.7 | 3.0 | GO:0004556 | alpha-amylase activity(GO:0004556) |
| 0.7 | 2.2 | GO:0000249 | C-22 sterol desaturase activity(GO:0000249) |
| 0.7 | 2.2 | GO:0018488 | aryl-aldehyde oxidase activity(GO:0018488) indole-3-acetaldehyde oxidase activity(GO:0050302) |
| 0.7 | 2.1 | GO:0015152 | hexose phosphate transmembrane transporter activity(GO:0015119) glucose-6-phosphate transmembrane transporter activity(GO:0015152) |
| 0.7 | 2.1 | GO:0046524 | sucrose-phosphate synthase activity(GO:0046524) |
| 0.7 | 6.1 | GO:0010436 | carotenoid dioxygenase activity(GO:0010436) |
| 0.7 | 4.7 | GO:0016781 | phosphotransferase activity, paired acceptors(GO:0016781) |
| 0.7 | 2.0 | GO:0043325 | phosphatidylinositol-3,4-bisphosphate binding(GO:0043325) |
| 0.7 | 2.6 | GO:0016985 | mannan endo-1,4-beta-mannosidase activity(GO:0016985) |
| 0.7 | 4.6 | GO:0004356 | glutamate-ammonia ligase activity(GO:0004356) |
| 0.6 | 1.9 | GO:0050403 | trans-zeatin O-beta-D-glucosyltransferase activity(GO:0050403) cis-zeatin O-beta-D-glucosyltransferase activity(GO:0050502) |
| 0.6 | 1.9 | GO:0016262 | protein N-acetylglucosaminyltransferase activity(GO:0016262) |
| 0.6 | 4.5 | GO:0018822 | nitrilase activity(GO:0000257) hydrolase activity, acting on carbon-nitrogen (but not peptide) bonds, in nitriles(GO:0016815) nitrile hydratase activity(GO:0018822) indole-3-acetonitrile nitrilase activity(GO:0080061) |
| 0.6 | 1.9 | GO:0016504 | peptidase activator activity(GO:0016504) |
| 0.6 | 1.8 | GO:0010354 | homogentisate prenyltransferase activity(GO:0010354) |
| 0.6 | 3.6 | GO:0005274 | allantoin uptake transmembrane transporter activity(GO:0005274) uracil:cation symporter activity(GO:0015505) uptake transmembrane transporter activity(GO:0015563) |
| 0.6 | 1.8 | GO:0047209 | coniferyl-alcohol glucosyltransferase activity(GO:0047209) |
| 0.6 | 4.1 | GO:0031492 | nucleosomal DNA binding(GO:0031492) |
| 0.6 | 3.5 | GO:0030527 | structural constituent of chromatin(GO:0030527) |
| 0.6 | 2.9 | GO:0015186 | L-glutamine transmembrane transporter activity(GO:0015186) |
| 0.6 | 2.8 | GO:0010295 | (+)-abscisic acid 8'-hydroxylase activity(GO:0010295) |
| 0.6 | 2.2 | GO:0046423 | allene-oxide cyclase activity(GO:0046423) |
| 0.5 | 2.7 | GO:0005355 | glucose transmembrane transporter activity(GO:0005355) |
| 0.5 | 1.6 | GO:0035605 | peptidyl-cysteine S-nitrosylase activity(GO:0035605) |
| 0.5 | 1.6 | GO:0015089 | high-affinity copper ion transmembrane transporter activity(GO:0015089) |
| 0.5 | 2.1 | GO:0051980 | iron chelate transmembrane transporter activity(GO:0015603) iron-nicotianamine transmembrane transporter activity(GO:0051980) |
| 0.5 | 4.2 | GO:0009916 | alternative oxidase activity(GO:0009916) |
| 0.5 | 2.1 | GO:0004385 | guanylate kinase activity(GO:0004385) |
| 0.5 | 5.8 | GO:0008453 | alanine-glyoxylate transaminase activity(GO:0008453) |
| 0.5 | 3.6 | GO:0050551 | myrcene synthase activity(GO:0050551) |
| 0.5 | 0.5 | GO:0016277 | [myelin basic protein]-arginine N-methyltransferase activity(GO:0016277) |
| 0.5 | 2.5 | GO:0036440 | citrate (Si)-synthase activity(GO:0004108) citrate synthase activity(GO:0036440) |
| 0.5 | 1.0 | GO:0015210 | pyrimidine nucleobase transmembrane transporter activity(GO:0005350) uracil transmembrane transporter activity(GO:0015210) |
| 0.5 | 1.0 | GO:0030742 | GTP-dependent protein binding(GO:0030742) |
| 0.5 | 1.5 | GO:0008898 | S-adenosylmethionine-homocysteine S-methyltransferase activity(GO:0008898) betaine-homocysteine S-methyltransferase activity(GO:0047150) |
| 0.5 | 5.3 | GO:0003691 | double-stranded telomeric DNA binding(GO:0003691) |
| 0.5 | 2.9 | GO:0001102 | RNA polymerase II activating transcription factor binding(GO:0001102) |
| 0.5 | 1.9 | GO:0004348 | glucosylceramidase activity(GO:0004348) |
| 0.5 | 1.9 | GO:0032791 | lead ion binding(GO:0032791) |
| 0.5 | 3.3 | GO:0008157 | protein phosphatase 1 binding(GO:0008157) |
| 0.5 | 7.0 | GO:0003978 | UDP-glucose 4-epimerase activity(GO:0003978) |
| 0.4 | 4.5 | GO:0047372 | acylglycerol lipase activity(GO:0047372) |
| 0.4 | 1.8 | GO:1990137 | plant seed peroxidase activity(GO:1990137) |
| 0.4 | 3.5 | GO:0015172 | acidic amino acid transmembrane transporter activity(GO:0015172) |
| 0.4 | 1.3 | GO:0008661 | 1-deoxy-D-xylulose-5-phosphate synthase activity(GO:0008661) |
| 0.4 | 1.3 | GO:0001054 | RNA polymerase I activity(GO:0001054) RNA polymerase III activity(GO:0001056) |
| 0.4 | 1.7 | GO:0004534 | 5'-3' exoribonuclease activity(GO:0004534) |
| 0.4 | 5.6 | GO:0052747 | sinapyl alcohol dehydrogenase activity(GO:0052747) |
| 0.4 | 1.7 | GO:0080042 | ADP-glucose pyrophosphohydrolase activity(GO:0080042) |
| 0.4 | 2.1 | GO:0003680 | AT DNA binding(GO:0003680) |
| 0.4 | 1.7 | GO:0043916 | DNA-7-methylguanine glycosylase activity(GO:0043916) |
| 0.4 | 1.6 | GO:0070034 | telomerase RNA binding(GO:0070034) |
| 0.4 | 1.6 | GO:0003852 | 2-isopropylmalate synthase activity(GO:0003852) |
| 0.4 | 2.4 | GO:0008728 | GTP diphosphokinase activity(GO:0008728) |
| 0.4 | 1.6 | GO:0031516 | far-red light photoreceptor activity(GO:0031516) |
| 0.4 | 1.2 | GO:0070336 | Y-form DNA binding(GO:0000403) flap-structured DNA binding(GO:0070336) |
| 0.4 | 1.6 | GO:0004307 | ethanolaminephosphotransferase activity(GO:0004307) |
| 0.4 | 4.3 | GO:0033743 | peptide-methionine (R)-S-oxide reductase activity(GO:0033743) |
| 0.4 | 1.2 | GO:0036402 | proteasome-activating ATPase activity(GO:0036402) |
| 0.4 | 1.2 | GO:0046480 | galactolipid galactosyltransferase activity(GO:0046480) |
| 0.4 | 0.4 | GO:0015391 | nucleobase:cation symporter activity(GO:0015391) |
| 0.4 | 2.3 | GO:0001653 | peptide receptor activity(GO:0001653) |
| 0.4 | 5.0 | GO:0019902 | phosphatase binding(GO:0019902) |
| 0.4 | 0.4 | GO:0016713 | oxidoreductase activity, acting on paired donors, with incorporation or reduction of molecular oxygen, reduced iron-sulfur protein as one donor, and incorporation of one atom of oxygen(GO:0016713) |
| 0.4 | 1.1 | GO:0016992 | lipoate-protein ligase activity(GO:0016979) lipoate synthase activity(GO:0016992) |
| 0.4 | 1.1 | GO:0035671 | enone reductase activity(GO:0035671) |
| 0.4 | 1.1 | GO:0030975 | thiamine diphosphokinase activity(GO:0004788) thiamine binding(GO:0030975) |
| 0.4 | 2.6 | GO:0003872 | 6-phosphofructokinase activity(GO:0003872) |
| 0.4 | 2.6 | GO:0017112 | Rab guanyl-nucleotide exchange factor activity(GO:0017112) |
| 0.4 | 2.6 | GO:0030332 | cyclin binding(GO:0030332) |
| 0.4 | 3.3 | GO:0000285 | 1-phosphatidylinositol-3-phosphate 5-kinase activity(GO:0000285) |
| 0.4 | 1.4 | GO:0030410 | nicotianamine synthase activity(GO:0030410) |
| 0.4 | 2.5 | GO:0004345 | glucose-6-phosphate dehydrogenase activity(GO:0004345) |
| 0.4 | 0.7 | GO:0019144 | ADP-sugar diphosphatase activity(GO:0019144) ADP-ribose pyrophosphohydrolase activity(GO:0080041) |
| 0.4 | 1.8 | GO:0001664 | G-protein coupled receptor binding(GO:0001664) G-protein beta/gamma-subunit complex binding(GO:0031683) |
| 0.4 | 21.8 | GO:0004364 | glutathione transferase activity(GO:0004364) |
| 0.4 | 1.1 | GO:0004438 | phosphatidylinositol-3-phosphatase activity(GO:0004438) phosphatidylinositol-3,5-bisphosphate 3-phosphatase activity(GO:0052629) |
| 0.3 | 2.8 | GO:0004383 | guanylate cyclase activity(GO:0004383) |
| 0.3 | 1.0 | GO:0052901 | spermine:oxygen oxidoreductase (spermidine-forming) activity(GO:0052901) |
| 0.3 | 1.7 | GO:0003863 | 3-methyl-2-oxobutanoate dehydrogenase (2-methylpropanoyl-transferring) activity(GO:0003863) |
| 0.3 | 3.0 | GO:0043023 | ribosomal large subunit binding(GO:0043023) |
| 0.3 | 1.0 | GO:0098748 | clathrin adaptor activity(GO:0035615) endocytic adaptor activity(GO:0098748) |
| 0.3 | 1.0 | GO:0034596 | phosphatidylinositol phosphate 4-phosphatase activity(GO:0034596) phosphatidylinositol-4-phosphate phosphatase activity(GO:0043812) phosphatidylinositol monophosphate phosphatase activity(GO:0052744) |
| 0.3 | 3.3 | GO:0005086 | ARF guanyl-nucleotide exchange factor activity(GO:0005086) |
| 0.3 | 1.3 | GO:0036218 | dTTP diphosphatase activity(GO:0036218) |
| 0.3 | 2.6 | GO:0017169 | CDP-alcohol phosphatidyltransferase activity(GO:0017169) |
| 0.3 | 2.0 | GO:0004652 | polynucleotide adenylyltransferase activity(GO:0004652) |
| 0.3 | 3.9 | GO:0004714 | transmembrane receptor protein tyrosine kinase activity(GO:0004714) |
| 0.3 | 5.8 | GO:0004022 | alcohol dehydrogenase (NAD) activity(GO:0004022) |
| 0.3 | 1.3 | GO:0008251 | adenosine deaminase activity(GO:0004000) tRNA-specific adenosine deaminase activity(GO:0008251) |
| 0.3 | 4.8 | GO:0016411 | acylglycerol O-acyltransferase activity(GO:0016411) |
| 0.3 | 2.2 | GO:0004834 | tryptophan synthase activity(GO:0004834) |
| 0.3 | 1.3 | GO:0017017 | MAP kinase tyrosine/serine/threonine phosphatase activity(GO:0017017) |
| 0.3 | 3.5 | GO:0008107 | galactoside 2-alpha-L-fucosyltransferase activity(GO:0008107) alpha-(1,2)-fucosyltransferase activity(GO:0031127) |
| 0.3 | 2.5 | GO:0004566 | beta-glucuronidase activity(GO:0004566) |
| 0.3 | 2.8 | GO:0071617 | lysophospholipid acyltransferase activity(GO:0071617) |
| 0.3 | 1.9 | GO:0005546 | phosphatidylinositol-4,5-bisphosphate binding(GO:0005546) |
| 0.3 | 1.5 | GO:0046509 | 1,2-diacylglycerol 3-beta-galactosyltransferase activity(GO:0046509) |
| 0.3 | 1.2 | GO:0016920 | pyroglutamyl-peptidase activity(GO:0016920) |
| 0.3 | 0.9 | GO:0003986 | acetyl-CoA hydrolase activity(GO:0003986) |
| 0.3 | 2.7 | GO:0009882 | blue light photoreceptor activity(GO:0009882) |
| 0.3 | 1.2 | GO:0070006 | metalloaminopeptidase activity(GO:0070006) |
| 0.3 | 1.2 | GO:1990381 | ubiquitin-specific protease binding(GO:1990381) |
| 0.3 | 1.8 | GO:0005483 | soluble NSF attachment protein activity(GO:0005483) |
| 0.3 | 1.2 | GO:0080103 | 4-methylthiopropyl glucosinolate S-oxygenase activity(GO:0080103) |
| 0.3 | 0.9 | GO:0016906 | sterol 3-beta-glucosyltransferase activity(GO:0016906) |
| 0.3 | 0.9 | GO:0015292 | uniporter activity(GO:0015292) |
| 0.3 | 1.2 | GO:0033862 | UMP kinase activity(GO:0033862) |
| 0.3 | 0.9 | GO:0019003 | GDP binding(GO:0019003) |
| 0.3 | 0.9 | GO:0046409 | p-coumarate 3-hydroxylase activity(GO:0046409) |
| 0.3 | 0.9 | GO:0000179 | rRNA (adenine-N6,N6-)-dimethyltransferase activity(GO:0000179) |
| 0.3 | 2.0 | GO:0005459 | UDP-galactose transmembrane transporter activity(GO:0005459) |
| 0.3 | 0.6 | GO:0010857 | calcium-dependent protein serine/threonine kinase activity(GO:0009931) calcium-dependent protein kinase activity(GO:0010857) |
| 0.3 | 0.9 | GO:0047134 | protein-disulfide reductase activity(GO:0047134) |
| 0.3 | 2.0 | GO:0019139 | cytokinin dehydrogenase activity(GO:0019139) |
| 0.3 | 0.9 | GO:0030275 | LRR domain binding(GO:0030275) |
| 0.3 | 0.8 | GO:0045140 | inositol phosphoceramide synthase activity(GO:0045140) |
| 0.3 | 2.3 | GO:0004143 | diacylglycerol kinase activity(GO:0004143) |
| 0.3 | 3.1 | GO:0030674 | protein binding, bridging(GO:0030674) |
| 0.3 | 2.8 | GO:0004351 | glutamate decarboxylase activity(GO:0004351) |
| 0.3 | 1.7 | GO:0016312 | inositol bisphosphate phosphatase activity(GO:0016312) |
| 0.3 | 4.2 | GO:0008195 | phosphatidate phosphatase activity(GO:0008195) |
| 0.3 | 1.1 | GO:0097157 | U2 snRNA binding(GO:0030620) pre-mRNA intronic binding(GO:0097157) |
| 0.3 | 0.8 | GO:0004424 | imidazoleglycerol-phosphate dehydratase activity(GO:0004424) |
| 0.3 | 0.8 | GO:0016767 | geranylgeranyl-diphosphate geranylgeranyltransferase activity(GO:0016767) |
| 0.3 | 0.8 | GO:0008174 | mRNA methyltransferase activity(GO:0008174) |
| 0.3 | 1.6 | GO:0052691 | UDP-arabinopyranose mutase activity(GO:0052691) |
| 0.3 | 1.1 | GO:0019784 | NEDD8-specific protease activity(GO:0019784) |
| 0.3 | 2.7 | GO:0035198 | miRNA binding(GO:0035198) |
| 0.3 | 1.8 | GO:0005254 | voltage-gated chloride channel activity(GO:0005247) chloride channel activity(GO:0005254) |
| 0.3 | 3.9 | GO:0031543 | peptidyl-proline dioxygenase activity(GO:0031543) |
| 0.3 | 0.5 | GO:0051019 | mitogen-activated protein kinase binding(GO:0051019) |
| 0.3 | 14.3 | GO:0061631 | ubiquitin conjugating enzyme activity(GO:0061631) |
| 0.3 | 1.3 | GO:0015193 | L-proline transmembrane transporter activity(GO:0015193) |
| 0.3 | 4.3 | GO:0008515 | sucrose transmembrane transporter activity(GO:0008515) |
| 0.3 | 0.8 | GO:0008686 | GTP cyclohydrolase II activity(GO:0003935) 3,4-dihydroxy-2-butanone-4-phosphate synthase activity(GO:0008686) |
| 0.3 | 0.8 | GO:0005458 | GDP-mannose transmembrane transporter activity(GO:0005458) |
| 0.3 | 1.0 | GO:0004861 | cyclin-dependent protein serine/threonine kinase inhibitor activity(GO:0004861) protein serine/threonine kinase inhibitor activity(GO:0030291) |
| 0.3 | 1.3 | GO:0004535 | poly(A)-specific ribonuclease activity(GO:0004535) |
| 0.2 | 1.7 | GO:0080115 | myosin tail binding(GO:0032029) myosin heavy chain binding(GO:0032036) myosin XI tail binding(GO:0080115) |
| 0.2 | 3.4 | GO:0004709 | MAP kinase kinase kinase activity(GO:0004709) |
| 0.2 | 0.7 | GO:0052635 | C-20 gibberellin 2-beta-dioxygenase activity(GO:0052635) |
| 0.2 | 3.2 | GO:1901981 | phosphatidylinositol phosphate binding(GO:1901981) |
| 0.2 | 1.9 | GO:0016812 | hydrolase activity, acting on carbon-nitrogen (but not peptide) bonds, in cyclic amides(GO:0016812) |
| 0.2 | 2.9 | GO:0016157 | sucrose synthase activity(GO:0016157) |
| 0.2 | 0.9 | GO:0043546 | molybdopterin cofactor binding(GO:0043546) |
| 0.2 | 0.5 | GO:0000702 | oxidized base lesion DNA N-glycosylase activity(GO:0000702) |
| 0.2 | 1.6 | GO:0008022 | protein C-terminus binding(GO:0008022) |
| 0.2 | 0.7 | GO:1990247 | N6-methyladenosine-containing RNA binding(GO:1990247) |
| 0.2 | 0.9 | GO:0052659 | inositol-polyphosphate 5-phosphatase activity(GO:0004445) inositol-1,3,4,5-tetrakisphosphate 5-phosphatase activity(GO:0052659) inositol tetrakisphosphate phosphatase activity(GO:0052743) |
| 0.2 | 1.1 | GO:0047780 | citrate dehydratase activity(GO:0047780) |
| 0.2 | 1.8 | GO:0070696 | transmembrane receptor protein serine/threonine kinase binding(GO:0070696) |
| 0.2 | 2.9 | GO:0009927 | histidine phosphotransfer kinase activity(GO:0009927) |
| 0.2 | 4.2 | GO:0016844 | strictosidine synthase activity(GO:0016844) |
| 0.2 | 0.7 | GO:0004046 | aminoacylase activity(GO:0004046) |
| 0.2 | 0.9 | GO:0004679 | AMP-activated protein kinase activity(GO:0004679) |
| 0.2 | 1.1 | GO:0010011 | auxin binding(GO:0010011) |
| 0.2 | 3.9 | GO:0005504 | fatty acid binding(GO:0005504) |
| 0.2 | 14.1 | GO:0042910 | xenobiotic transporter activity(GO:0042910) |
| 0.2 | 0.6 | GO:0030941 | chloroplast targeting sequence binding(GO:0030941) |
| 0.2 | 2.1 | GO:0008865 | fructokinase activity(GO:0008865) |
| 0.2 | 0.8 | GO:0004057 | arginyltransferase activity(GO:0004057) |
| 0.2 | 1.5 | GO:0008177 | succinate dehydrogenase (ubiquinone) activity(GO:0008177) |
| 0.2 | 3.1 | GO:0031491 | nucleosome binding(GO:0031491) |
| 0.2 | 2.1 | GO:0010294 | abscisic acid glucosyltransferase activity(GO:0010294) |
| 0.2 | 1.0 | GO:0004765 | shikimate kinase activity(GO:0004765) |
| 0.2 | 9.4 | GO:0017137 | Rab GTPase binding(GO:0017137) |
| 0.2 | 13.9 | GO:0036459 | thiol-dependent ubiquitin-specific protease activity(GO:0004843) thiol-dependent ubiquitinyl hydrolase activity(GO:0036459) |
| 0.2 | 0.6 | GO:0004359 | glutaminase activity(GO:0004359) |
| 0.2 | 0.6 | GO:0070003 | threonine-type endopeptidase activity(GO:0004298) threonine-type peptidase activity(GO:0070003) |
| 0.2 | 0.8 | GO:0050291 | sphingosine N-acyltransferase activity(GO:0050291) |
| 0.2 | 3.4 | GO:0035064 | methylated histone binding(GO:0035064) |
| 0.2 | 0.4 | GO:0008131 | primary amine oxidase activity(GO:0008131) |
| 0.2 | 1.6 | GO:0009815 | 1-aminocyclopropane-1-carboxylate oxidase activity(GO:0009815) |
| 0.2 | 9.3 | GO:0050897 | cobalt ion binding(GO:0050897) |
| 0.2 | 0.4 | GO:0097363 | protein O-GlcNAc transferase activity(GO:0097363) |
| 0.2 | 0.6 | GO:0016229 | steroid dehydrogenase activity(GO:0016229) |
| 0.2 | 0.8 | GO:0004737 | pyruvate decarboxylase activity(GO:0004737) |
| 0.2 | 1.3 | GO:0008239 | dipeptidyl-peptidase activity(GO:0008239) |
| 0.2 | 1.3 | GO:0004806 | triglyceride lipase activity(GO:0004806) |
| 0.2 | 0.8 | GO:0015018 | galactosylgalactosylxylosylprotein 3-beta-glucuronosyltransferase activity(GO:0015018) |
| 0.2 | 1.0 | GO:0016629 | 12-oxophytodienoate reductase activity(GO:0016629) |
| 0.2 | 2.6 | GO:0019209 | kinase activator activity(GO:0019209) protein kinase activator activity(GO:0030295) |
| 0.2 | 0.9 | GO:0030371 | translation repressor activity(GO:0030371) |
| 0.2 | 1.5 | GO:0004715 | non-membrane spanning protein tyrosine kinase activity(GO:0004715) |
| 0.2 | 0.6 | GO:0008963 | phospho-N-acetylmuramoyl-pentapeptide-transferase activity(GO:0008963) |
| 0.2 | 0.7 | GO:0010309 | acireductone dioxygenase [iron(II)-requiring] activity(GO:0010309) |
| 0.2 | 0.6 | GO:0008265 | Mo-molybdopterin cofactor sulfurase activity(GO:0008265) |
| 0.2 | 3.0 | GO:0016018 | drug binding(GO:0008144) cyclosporin A binding(GO:0016018) |
| 0.2 | 0.9 | GO:0038199 | ethylene receptor activity(GO:0038199) ethylene binding(GO:0051740) alkene binding(GO:0072328) |
| 0.2 | 7.2 | GO:0004707 | MAP kinase activity(GO:0004707) |
| 0.2 | 1.3 | GO:0015179 | L-amino acid transmembrane transporter activity(GO:0015179) |
| 0.2 | 0.9 | GO:0016724 | ferroxidase activity(GO:0004322) oxidoreductase activity, oxidizing metal ions, oxygen as acceptor(GO:0016724) |
| 0.2 | 2.0 | GO:0047617 | acyl-CoA hydrolase activity(GO:0047617) |
| 0.2 | 3.0 | GO:0015217 | ADP transmembrane transporter activity(GO:0015217) |
| 0.2 | 0.5 | GO:0004609 | phosphatidylserine decarboxylase activity(GO:0004609) |
| 0.2 | 0.9 | GO:1902387 | ceramide transporter activity(GO:0035620) sphingolipid transporter activity(GO:0046624) ceramide 1-phosphate binding(GO:1902387) ceramide 1-phosphate transporter activity(GO:1902388) |
| 0.2 | 0.9 | GO:1901618 | myo-inositol transmembrane transporter activity(GO:0005365) myo-inositol:proton symporter activity(GO:0005366) polyol transmembrane transporter activity(GO:0015166) alcohol transmembrane transporter activity(GO:0015665) organic hydroxy compound transmembrane transporter activity(GO:1901618) |
| 0.2 | 1.4 | GO:0017091 | AU-rich element binding(GO:0017091) |
| 0.2 | 4.2 | GO:0031386 | protein tag(GO:0031386) |
| 0.2 | 2.9 | GO:0003725 | double-stranded RNA binding(GO:0003725) |
| 0.2 | 3.2 | GO:0030276 | clathrin binding(GO:0030276) |
| 0.2 | 2.0 | GO:0008061 | chitin binding(GO:0008061) |
| 0.2 | 1.3 | GO:0070122 | isopeptidase activity(GO:0070122) |
| 0.2 | 7.9 | GO:0003713 | transcription coactivator activity(GO:0003713) |
| 0.2 | 24.9 | GO:0061630 | ubiquitin protein ligase activity(GO:0061630) |
| 0.2 | 0.8 | GO:0015203 | polyamine transmembrane transporter activity(GO:0015203) |
| 0.2 | 18.6 | GO:0004722 | protein serine/threonine phosphatase activity(GO:0004722) |
| 0.2 | 2.3 | GO:0008234 | cysteine-type peptidase activity(GO:0008234) |
| 0.2 | 0.8 | GO:0098599 | palmitoyl hydrolase activity(GO:0098599) |
| 0.2 | 1.3 | GO:0004069 | L-aspartate:2-oxoglutarate aminotransferase activity(GO:0004069) |
| 0.2 | 2.4 | GO:0051879 | Hsp90 protein binding(GO:0051879) |
| 0.2 | 2.4 | GO:0000993 | RNA polymerase II core binding(GO:0000993) |
| 0.2 | 0.5 | GO:0008821 | crossover junction endodeoxyribonuclease activity(GO:0008821) |
| 0.2 | 0.8 | GO:0042800 | histone methyltransferase activity (H3-K4 specific)(GO:0042800) |
| 0.2 | 7.6 | GO:0004197 | cysteine-type endopeptidase activity(GO:0004197) |
| 0.2 | 0.5 | GO:0060090 | binding, bridging(GO:0060090) |
| 0.2 | 3.4 | GO:0005345 | purine nucleobase transmembrane transporter activity(GO:0005345) |
| 0.2 | 2.3 | GO:0051117 | ATPase binding(GO:0051117) |
| 0.2 | 2.1 | GO:0004675 | transmembrane receptor protein serine/threonine kinase activity(GO:0004675) |
| 0.2 | 1.7 | GO:0004713 | protein tyrosine kinase activity(GO:0004713) |
| 0.2 | 1.4 | GO:0003988 | acetyl-CoA C-acyltransferase activity(GO:0003988) |
| 0.2 | 0.5 | GO:0019781 | NEDD8 activating enzyme activity(GO:0019781) |
| 0.2 | 1.7 | GO:0015145 | monosaccharide transmembrane transporter activity(GO:0015145) |
| 0.2 | 0.2 | GO:0015175 | neutral amino acid transmembrane transporter activity(GO:0015175) |
| 0.2 | 0.5 | GO:0050412 | cinnamate beta-D-glucosyltransferase activity(GO:0050412) |
| 0.1 | 0.4 | GO:0008428 | ribonuclease inhibitor activity(GO:0008428) 4-hydroxy-4-methyl-2-oxoglutarate aldolase activity(GO:0047443) |
| 0.1 | 0.6 | GO:0000268 | peroxisome targeting sequence binding(GO:0000268) |
| 0.1 | 0.6 | GO:0004792 | thiosulfate sulfurtransferase activity(GO:0004792) |
| 0.1 | 0.6 | GO:0004367 | glycerol-3-phosphate dehydrogenase [NAD+] activity(GO:0004367) |
| 0.1 | 5.5 | GO:0005096 | GTPase activator activity(GO:0005096) |
| 0.1 | 1.2 | GO:0004602 | glutathione peroxidase activity(GO:0004602) |
| 0.1 | 0.3 | GO:0035242 | protein-arginine omega-N asymmetric methyltransferase activity(GO:0035242) |
| 0.1 | 2.3 | GO:0031369 | translation initiation factor binding(GO:0031369) |
| 0.1 | 0.4 | GO:0070405 | phosphatidylcholine binding(GO:0031210) quaternary ammonium group binding(GO:0050997) ammonium ion binding(GO:0070405) |
| 0.1 | 1.3 | GO:0070300 | phosphatidic acid binding(GO:0070300) |
| 0.1 | 1.3 | GO:0015112 | nitrate transmembrane transporter activity(GO:0015112) |
| 0.1 | 1.0 | GO:0010178 | IAA-amino acid conjugate hydrolase activity(GO:0010178) |
| 0.1 | 2.0 | GO:0017056 | structural constituent of nuclear pore(GO:0017056) |
| 0.1 | 1.0 | GO:0001047 | core promoter sequence-specific DNA binding(GO:0001046) core promoter binding(GO:0001047) |
| 0.1 | 0.7 | GO:0005223 | intracellular cGMP activated cation channel activity(GO:0005223) |
| 0.1 | 17.0 | GO:0000978 | RNA polymerase II core promoter proximal region sequence-specific DNA binding(GO:0000978) |
| 0.1 | 5.4 | GO:0019208 | phosphatase regulator activity(GO:0019208) |
| 0.1 | 0.4 | GO:0004775 | succinate-CoA ligase activity(GO:0004774) succinate-CoA ligase (ADP-forming) activity(GO:0004775) succinate-CoA ligase (GDP-forming) activity(GO:0004776) |
| 0.1 | 25.5 | GO:0019787 | ubiquitin-like protein transferase activity(GO:0019787) |
| 0.1 | 0.5 | GO:0008948 | oxaloacetate decarboxylase activity(GO:0008948) |
| 0.1 | 0.5 | GO:0016889 | endodeoxyribonuclease activity, producing 3'-phosphomonoesters(GO:0016889) |
| 0.1 | 1.8 | GO:0015020 | glucuronosyltransferase activity(GO:0015020) |
| 0.1 | 9.2 | GO:0051213 | dioxygenase activity(GO:0051213) |
| 0.1 | 1.2 | GO:0034979 | NAD-dependent histone deacetylase activity(GO:0017136) histone deacetylase activity (H3-K14 specific)(GO:0031078) NAD-dependent histone deacetylase activity (H3-K14 specific)(GO:0032041) NAD-dependent protein deacetylase activity(GO:0034979) |
| 0.1 | 0.6 | GO:0050664 | NAD(P)H oxidase activity(GO:0016174) oxidoreductase activity, acting on NAD(P)H, oxygen as acceptor(GO:0050664) |
| 0.1 | 2.4 | GO:0003843 | 1,3-beta-D-glucan synthase activity(GO:0003843) |
| 0.1 | 1.9 | GO:0004124 | cysteine synthase activity(GO:0004124) |
| 0.1 | 2.4 | GO:0015248 | sterol transporter activity(GO:0015248) |
| 0.1 | 0.8 | GO:0004739 | pyruvate dehydrogenase (acetyl-transferring) activity(GO:0004739) |
| 0.1 | 0.7 | GO:0017070 | U6 snRNA binding(GO:0017070) |
| 0.1 | 0.5 | GO:1990269 | phosphoserine binding(GO:0050815) RNA polymerase II C-terminal domain phosphoserine binding(GO:1990269) |
| 0.1 | 0.7 | GO:0052656 | L-leucine transaminase activity(GO:0052654) L-valine transaminase activity(GO:0052655) L-isoleucine transaminase activity(GO:0052656) |
| 0.1 | 0.6 | GO:0001727 | lipid kinase activity(GO:0001727) |
| 0.1 | 0.5 | GO:0016882 | cyclo-ligase activity(GO:0016882) |
| 0.1 | 0.4 | GO:1990259 | protein-glutamine N-methyltransferase activity(GO:0036009) histone-glutamine methyltransferase activity(GO:1990259) |
| 0.1 | 0.4 | GO:0052725 | inositol-1,3,4-trisphosphate 6-kinase activity(GO:0052725) |
| 0.1 | 0.8 | GO:0060229 | phospholipase activator activity(GO:0016004) lipase activator activity(GO:0060229) |
| 0.1 | 1.2 | GO:0010385 | double-stranded methylated DNA binding(GO:0010385) |
| 0.1 | 0.3 | GO:0017077 | oxidative phosphorylation uncoupler activity(GO:0017077) |
| 0.1 | 0.6 | GO:0016819 | hydrolase activity, acting on acid anhydrides, in sulfonyl-containing anhydrides(GO:0016819) adenylylsulfatase activity(GO:0047627) |
| 0.1 | 2.1 | GO:0016861 | intramolecular oxidoreductase activity, interconverting aldoses and ketoses(GO:0016861) |
| 0.1 | 1.0 | GO:0019905 | syntaxin binding(GO:0019905) |
| 0.1 | 0.8 | GO:0016681 | ubiquinol-cytochrome-c reductase activity(GO:0008121) oxidoreductase activity, acting on diphenols and related substances as donors, cytochrome as acceptor(GO:0016681) |
| 0.1 | 0.3 | GO:0004106 | chorismate mutase activity(GO:0004106) |
| 0.1 | 6.1 | GO:0015171 | amino acid transmembrane transporter activity(GO:0015171) |
| 0.1 | 1.4 | GO:0052742 | phosphatidylinositol kinase activity(GO:0052742) |
| 0.1 | 1.0 | GO:0004084 | branched-chain-amino-acid transaminase activity(GO:0004084) |
| 0.1 | 5.9 | GO:0004683 | calmodulin-dependent protein kinase activity(GO:0004683) |
| 0.1 | 5.6 | GO:0043130 | ubiquitin binding(GO:0043130) |
| 0.1 | 0.4 | GO:0002151 | G-quadruplex RNA binding(GO:0002151) |
| 0.1 | 0.3 | GO:0004488 | methenyltetrahydrofolate cyclohydrolase activity(GO:0004477) methylenetetrahydrofolate dehydrogenase (NADP+) activity(GO:0004488) |
| 0.1 | 1.8 | GO:0046961 | proton-transporting ATPase activity, rotational mechanism(GO:0046961) |
| 0.1 | 0.5 | GO:0034511 | U3 snoRNA binding(GO:0034511) |
| 0.1 | 0.4 | GO:0004821 | histidine-tRNA ligase activity(GO:0004821) |
| 0.1 | 0.6 | GO:0004449 | isocitrate dehydrogenase (NAD+) activity(GO:0004449) |
| 0.1 | 5.3 | GO:0008080 | N-acetyltransferase activity(GO:0008080) |
| 0.1 | 14.3 | GO:0005516 | calmodulin binding(GO:0005516) |
| 0.1 | 0.8 | GO:0008318 | protein prenyltransferase activity(GO:0008318) |
| 0.1 | 0.5 | GO:0016775 | protein histidine kinase activity(GO:0004673) phosphotransferase activity, nitrogenous group as acceptor(GO:0016775) |
| 0.1 | 3.2 | GO:0016760 | cellulose synthase (UDP-forming) activity(GO:0016760) |
| 0.1 | 0.4 | GO:0033741 | adenylyl-sulfate reductase activity(GO:0009973) adenylyl-sulfate reductase (glutathione) activity(GO:0033741) |
| 0.1 | 0.6 | GO:0016530 | metallochaperone activity(GO:0016530) copper chaperone activity(GO:0016531) |
| 0.1 | 0.9 | GO:0005381 | iron ion transmembrane transporter activity(GO:0005381) |
| 0.1 | 2.8 | GO:0016671 | oxidoreductase activity, acting on a sulfur group of donors, disulfide as acceptor(GO:0016671) |
| 0.1 | 1.1 | GO:0043878 | glyceraldehyde-3-phosphate dehydrogenase (NAD+) (non-phosphorylating) activity(GO:0043878) |
| 0.1 | 0.5 | GO:0030943 | mitochondrion targeting sequence binding(GO:0030943) |
| 0.1 | 1.1 | GO:0003950 | NAD+ ADP-ribosyltransferase activity(GO:0003950) |
| 0.1 | 2.4 | GO:0005388 | calcium-transporting ATPase activity(GO:0005388) |
| 0.1 | 0.3 | GO:0016972 | flavin-linked sulfhydryl oxidase activity(GO:0016971) thiol oxidase activity(GO:0016972) |
| 0.1 | 2.1 | GO:0051787 | misfolded protein binding(GO:0051787) |
| 0.1 | 0.3 | GO:0048038 | quinone binding(GO:0048038) |
| 0.1 | 9.6 | GO:0046982 | protein heterodimerization activity(GO:0046982) |
| 0.1 | 0.3 | GO:0031071 | cysteine desulfurase activity(GO:0031071) |
| 0.1 | 2.0 | GO:0035091 | phosphatidylinositol binding(GO:0035091) |
| 0.1 | 0.5 | GO:0050378 | UDP-glucuronate 4-epimerase activity(GO:0050378) |
| 0.1 | 0.5 | GO:0016426 | tRNA (adenine) methyltransferase activity(GO:0016426) |
| 0.1 | 0.3 | GO:0010331 | gibberellin binding(GO:0010331) |
| 0.1 | 1.7 | GO:0019887 | protein kinase regulator activity(GO:0019887) |
| 0.1 | 0.3 | GO:0004829 | threonine-tRNA ligase activity(GO:0004829) |
| 0.1 | 0.8 | GO:0016847 | 1-aminocyclopropane-1-carboxylate synthase activity(GO:0016847) |
| 0.1 | 0.8 | GO:0035252 | UDP-xylosyltransferase activity(GO:0035252) |
| 0.1 | 0.9 | GO:0032453 | histone demethylase activity (H3-K4 specific)(GO:0032453) histone demethylase activity (H3-trimethyl-K4 specific)(GO:0034647) |
| 0.1 | 0.4 | GO:0022841 | leak channel activity(GO:0022840) potassium ion leak channel activity(GO:0022841) narrow pore channel activity(GO:0022842) |
| 0.1 | 0.3 | GO:0046592 | polyamine oxidase activity(GO:0046592) |
| 0.1 | 1.0 | GO:0030628 | pre-mRNA 3'-splice site binding(GO:0030628) |
| 0.1 | 0.6 | GO:0016621 | cinnamoyl-CoA reductase activity(GO:0016621) |
| 0.1 | 1.0 | GO:0015095 | magnesium ion transmembrane transporter activity(GO:0015095) |
| 0.1 | 3.3 | GO:0042393 | histone binding(GO:0042393) |
| 0.1 | 0.7 | GO:0003860 | 3-hydroxyisobutyryl-CoA hydrolase activity(GO:0003860) |
| 0.1 | 0.2 | GO:0047364 | desulfoglucosinolate sulfotransferase activity(GO:0047364) |
| 0.1 | 1.0 | GO:0008536 | Ran GTPase binding(GO:0008536) |
| 0.1 | 0.4 | GO:0030942 | endoplasmic reticulum signal peptide binding(GO:0030942) |
| 0.1 | 0.2 | GO:0015367 | oxoglutarate:malate antiporter activity(GO:0015367) |
| 0.1 | 0.2 | GO:0004165 | dodecenoyl-CoA delta-isomerase activity(GO:0004165) |
| 0.1 | 0.2 | GO:0004571 | mannosyl-oligosaccharide 1,2-alpha-mannosidase activity(GO:0004571) |
| 0.1 | 0.5 | GO:0048029 | monosaccharide binding(GO:0048029) |
| 0.1 | 0.3 | GO:0043024 | ribosomal small subunit binding(GO:0043024) |
| 0.1 | 3.5 | GO:0004712 | protein serine/threonine/tyrosine kinase activity(GO:0004712) |
| 0.1 | 0.3 | GO:0004582 | dolichyl-phosphate beta-D-mannosyltransferase activity(GO:0004582) |
| 0.1 | 0.3 | GO:0004335 | galactokinase activity(GO:0004335) |
| 0.1 | 0.8 | GO:0030515 | snoRNA binding(GO:0030515) |
| 0.1 | 3.9 | GO:0016407 | acetyltransferase activity(GO:0016407) |
| 0.1 | 0.2 | GO:0004181 | metallocarboxypeptidase activity(GO:0004181) |
| 0.1 | 0.4 | GO:0017108 | 5'-flap endonuclease activity(GO:0017108) flap endonuclease activity(GO:0048256) |
| 0.1 | 0.3 | GO:0004416 | hydroxyacylglutathione hydrolase activity(GO:0004416) |
| 0.1 | 0.2 | GO:0004121 | cystathionine beta-lyase activity(GO:0004121) |
| 0.1 | 0.3 | GO:0005544 | calcium-dependent phospholipid binding(GO:0005544) |
| 0.1 | 0.7 | GO:0070403 | NAD+ binding(GO:0070403) |
| 0.1 | 1.2 | GO:0004866 | endopeptidase inhibitor activity(GO:0004866) |
| 0.1 | 0.2 | GO:0032182 | ubiquitin-like protein binding(GO:0032182) |
| 0.1 | 1.8 | GO:0005262 | calcium channel activity(GO:0005262) |
| 0.1 | 0.2 | GO:0003919 | FMN adenylyltransferase activity(GO:0003919) |
| 0.1 | 3.7 | GO:0019900 | kinase binding(GO:0019900) |
| 0.1 | 0.2 | GO:0016641 | oxidoreductase activity, acting on the CH-NH2 group of donors, oxygen as acceptor(GO:0016641) |
| 0.1 | 1.9 | GO:0015385 | sodium:proton antiporter activity(GO:0015385) |
| 0.1 | 0.4 | GO:0004392 | heme oxygenase (decyclizing) activity(GO:0004392) |
| 0.1 | 0.3 | GO:0004848 | ureidoglycolate hydrolase activity(GO:0004848) |
| 0.0 | 0.0 | GO:0050284 | sinapate 1-glucosyltransferase activity(GO:0050284) |
| 0.0 | 0.7 | GO:0004743 | pyruvate kinase activity(GO:0004743) potassium ion binding(GO:0030955) alkali metal ion binding(GO:0031420) |
| 0.0 | 0.3 | GO:0004362 | glutathione-disulfide reductase activity(GO:0004362) |
| 0.0 | 1.9 | GO:0001228 | transcriptional activator activity, RNA polymerase II transcription regulatory region sequence-specific binding(GO:0001228) |
| 0.0 | 0.6 | GO:0070290 | phospholipase D activity(GO:0004630) N-acylphosphatidylethanolamine-specific phospholipase D activity(GO:0070290) |
| 0.0 | 0.2 | GO:0016863 | intramolecular oxidoreductase activity, transposing C=C bonds(GO:0016863) |
| 0.0 | 0.6 | GO:0017069 | snRNA binding(GO:0017069) |
| 0.0 | 1.4 | GO:0080044 | quercetin 7-O-glucosyltransferase activity(GO:0080044) |
| 0.0 | 0.4 | GO:0016208 | AMP binding(GO:0016208) |
| 0.0 | 1.0 | GO:0004805 | trehalose-phosphatase activity(GO:0004805) |
| 0.0 | 0.4 | GO:0004020 | adenylylsulfate kinase activity(GO:0004020) |
| 0.0 | 0.8 | GO:0022839 | calcium activated cation channel activity(GO:0005227) ion gated channel activity(GO:0022839) |
| 0.0 | 0.9 | GO:0016776 | phosphotransferase activity, phosphate group as acceptor(GO:0016776) |
| 0.0 | 0.5 | GO:0070567 | cytidylyltransferase activity(GO:0070567) |
| 0.0 | 0.3 | GO:0042562 | hormone binding(GO:0042562) |
| 0.0 | 0.8 | GO:0008353 | RNA polymerase II carboxy-terminal domain kinase activity(GO:0008353) |
| 0.0 | 1.0 | GO:0051219 | protein phosphorylated amino acid binding(GO:0045309) phosphoprotein binding(GO:0051219) |
| 0.0 | 0.6 | GO:0003746 | translation elongation factor activity(GO:0003746) |
| 0.0 | 0.6 | GO:0004629 | phospholipase C activity(GO:0004629) |
| 0.0 | 0.3 | GO:0042500 | aspartic endopeptidase activity, intramembrane cleaving(GO:0042500) |
| 0.0 | 0.1 | GO:0004824 | lysine-tRNA ligase activity(GO:0004824) |
| 0.0 | 0.3 | GO:0000339 | RNA cap binding(GO:0000339) |
| 0.0 | 0.1 | GO:0046537 | 2,3-bisphosphoglycerate-independent phosphoglycerate mutase activity(GO:0046537) |
| 0.0 | 0.6 | GO:0003684 | damaged DNA binding(GO:0003684) |
| 0.0 | 0.2 | GO:1990825 | sequence-specific mRNA binding(GO:1990825) |
| 0.0 | 0.2 | GO:0048027 | mRNA 5'-UTR binding(GO:0048027) |
| 0.0 | 0.1 | GO:0015136 | sialic acid transmembrane transporter activity(GO:0015136) |
| 0.0 | 0.5 | GO:0004427 | inorganic diphosphatase activity(GO:0004427) |
| 0.0 | 0.3 | GO:0005496 | steroid binding(GO:0005496) |
| 0.0 | 0.2 | GO:0008732 | threonine aldolase activity(GO:0004793) L-allo-threonine aldolase activity(GO:0008732) |
| 0.0 | 8.0 | GO:0004674 | protein serine/threonine kinase activity(GO:0004674) |
| 0.0 | 0.1 | GO:0004634 | phosphopyruvate hydratase activity(GO:0004634) |
| 0.0 | 0.4 | GO:0097602 | cullin family protein binding(GO:0097602) |
| 0.0 | 0.2 | GO:0008641 | small protein activating enzyme activity(GO:0008641) |
| 0.0 | 0.4 | GO:0005384 | manganese ion transmembrane transporter activity(GO:0005384) |
| 0.0 | 0.1 | GO:0000035 | acyl binding(GO:0000035) |
| 0.0 | 9.2 | GO:0020037 | heme binding(GO:0020037) |
| 0.0 | 0.2 | GO:0043015 | gamma-tubulin binding(GO:0043015) |
| 0.0 | 1.2 | GO:0015079 | potassium ion transmembrane transporter activity(GO:0015079) |
| 0.0 | 0.2 | GO:0016722 | oxidoreductase activity, oxidizing metal ions(GO:0016722) |
| 0.0 | 0.8 | GO:0016667 | oxidoreductase activity, acting on a sulfur group of donors(GO:0016667) |
| 0.0 | 0.9 | GO:0030145 | manganese ion binding(GO:0030145) |
| 0.0 | 0.3 | GO:0031072 | heat shock protein binding(GO:0031072) |
| 0.0 | 0.2 | GO:0004526 | ribonuclease P activity(GO:0004526) |
| 0.0 | 0.3 | GO:0070180 | large ribosomal subunit rRNA binding(GO:0070180) |
| 0.0 | 0.1 | GO:0032977 | membrane insertase activity(GO:0032977) |
| 0.0 | 0.4 | GO:0009982 | pseudouridine synthase activity(GO:0009982) |
| 0.0 | 0.1 | GO:0080046 | quercetin 4'-O-glucosyltransferase activity(GO:0080046) |
| 0.0 | 0.7 | GO:0043021 | ribonucleoprotein complex binding(GO:0043021) |
| 0.0 | 0.1 | GO:0033925 | mannosyl-glycoprotein endo-beta-N-acetylglucosaminidase activity(GO:0033925) |
| 0.0 | 0.1 | GO:0046923 | ER retention sequence binding(GO:0046923) |
| 0.0 | 0.1 | GO:0004326 | tetrahydrofolylpolyglutamate synthase activity(GO:0004326) |
| 0.0 | 0.1 | GO:0001671 | ATPase activator activity(GO:0001671) |
| 0.0 | 0.0 | GO:0000406 | double-strand/single-strand DNA junction binding(GO:0000406) |
| 0.0 | 0.3 | GO:0003887 | DNA-directed DNA polymerase activity(GO:0003887) |
| 0.0 | 0.1 | GO:0016251 | obsolete general RNA polymerase II transcription factor activity(GO:0016251) |
| 0.0 | 0.2 | GO:0032440 | 2-alkenal reductase [NAD(P)] activity(GO:0032440) |
| 0.0 | 0.1 | GO:0051011 | microtubule minus-end binding(GO:0051011) |
| 0.0 | 0.8 | GO:0000989 | transcription factor activity, transcription factor binding(GO:0000989) transcription cofactor activity(GO:0003712) |
| 0.0 | 0.0 | GO:0004549 | tRNA-specific ribonuclease activity(GO:0004549) |
| 0.0 | 9.6 | GO:0043565 | sequence-specific DNA binding(GO:0043565) |
| 0.0 | 0.0 | GO:0097617 | annealing activity(GO:0097617) |
| 0.0 | 0.1 | GO:0101005 | ubiquitinyl hydrolase activity(GO:0101005) |
Gene overrepresentation in curated gene sets: canonical pathways category:
| Log-likelihood per target | Total log-likelihood | Term | Description |
|---|---|---|---|
| 0.6 | 0.6 | PID RET PATHWAY | Signaling events regulated by Ret tyrosine kinase |
| 0.5 | 2.7 | PID PLK1 PATHWAY | PLK1 signaling events |
| 0.4 | 2.2 | PID CIRCADIAN PATHWAY | Circadian rhythm pathway |
| 0.4 | 3.1 | SIG BCR SIGNALING PATHWAY | Members of the BCR signaling pathway |
| 0.4 | 1.8 | PID ECADHERIN NASCENT AJ PATHWAY | E-cadherin signaling in the nascent adherens junction |
| 0.3 | 2.4 | PID MTOR 4PATHWAY | mTOR signaling pathway |
| 0.3 | 1.5 | PID SMAD2 3NUCLEAR PATHWAY | Regulation of nuclear SMAD2/3 signaling |
| 0.3 | 0.5 | PID ARF6 DOWNSTREAM PATHWAY | Arf6 downstream pathway |
| 0.2 | 1.1 | PID AP1 PATHWAY | AP-1 transcription factor network |
| 0.2 | 0.6 | PID HNF3B PATHWAY | FOXA2 and FOXA3 transcription factor networks |
| 0.2 | 0.8 | PID IL4 2PATHWAY | IL4-mediated signaling events |
| 0.2 | 1.4 | PID RAC1 PATHWAY | RAC1 signaling pathway |
| 0.2 | 0.9 | PID S1P META PATHWAY | Sphingosine 1-phosphate (S1P) pathway |
| 0.2 | 0.7 | PID REG GR PATHWAY | Glucocorticoid receptor regulatory network |
| 0.2 | 0.5 | PID TAP63 PATHWAY | Validated transcriptional targets of TAp63 isoforms |
| 0.1 | 0.6 | PID NOTCH PATHWAY | Notch signaling pathway |
| 0.1 | 0.4 | PID AMB2 NEUTROPHILS PATHWAY | amb2 Integrin signaling |
| 0.1 | 0.1 | PID FCER1 PATHWAY | Fc-epsilon receptor I signaling in mast cells |
| 0.1 | 0.1 | PID IL2 PI3K PATHWAY | IL2 signaling events mediated by PI3K |
| 0.1 | 0.2 | PID VEGFR1 PATHWAY | VEGFR1 specific signals |
| 0.1 | 0.3 | ST FAS SIGNALING PATHWAY | Fas Signaling Pathway |
| 0.0 | 0.2 | NABA ECM GLYCOPROTEINS | Genes encoding structural ECM glycoproteins |
| 0.0 | 0.1 | PID HDAC CLASSII PATHWAY | Signaling events mediated by HDAC Class II |
| 0.0 | 0.1 | PID HIF1A PATHWAY | Hypoxic and oxygen homeostasis regulation of HIF-1-alpha |
Gene overrepresentation in curated gene sets: REACTOME pathways category:
| Log-likelihood per target | Total log-likelihood | Term | Description |
|---|---|---|---|
| 0.9 | 2.8 | REACTOME AMINO ACID SYNTHESIS AND INTERCONVERSION TRANSAMINATION | Genes involved in Amino acid synthesis and interconversion (transamination) |
| 0.7 | 3.6 | REACTOME RECYCLING OF BILE ACIDS AND SALTS | Genes involved in Recycling of bile acids and salts |
| 0.6 | 2.5 | REACTOME BMAL1 CLOCK NPAS2 ACTIVATES CIRCADIAN EXPRESSION | Genes involved in BMAL1:CLOCK/NPAS2 Activates Circadian Expression |
| 0.5 | 1.4 | REACTOME NOTCH1 INTRACELLULAR DOMAIN REGULATES TRANSCRIPTION | Genes involved in NOTCH1 Intracellular Domain Regulates Transcription |
| 0.5 | 1.4 | REACTOME APOPTOTIC EXECUTION PHASE | Genes involved in Apoptotic execution phase |
| 0.4 | 0.4 | REACTOME ABACAVIR TRANSPORT AND METABOLISM | Genes involved in Abacavir transport and metabolism |
| 0.4 | 1.8 | REACTOME L1CAM INTERACTIONS | Genes involved in L1CAM interactions |
| 0.3 | 1.0 | REACTOME HDL MEDIATED LIPID TRANSPORT | Genes involved in HDL-mediated lipid transport |
| 0.3 | 1.0 | REACTOME NRAGE SIGNALS DEATH THROUGH JNK | Genes involved in NRAGE signals death through JNK |
| 0.3 | 1.2 | REACTOME LOSS OF NLP FROM MITOTIC CENTROSOMES | Genes involved in Loss of Nlp from mitotic centrosomes |
| 0.3 | 3.6 | REACTOME FATTY ACID TRIACYLGLYCEROL AND KETONE BODY METABOLISM | Genes involved in Fatty acid, triacylglycerol, and ketone body metabolism |
| 0.3 | 1.5 | REACTOME METABOLISM OF AMINO ACIDS AND DERIVATIVES | Genes involved in Metabolism of amino acids and derivatives |
| 0.3 | 0.6 | REACTOME FRS2 MEDIATED CASCADE | Genes involved in FRS2-mediated cascade |
| 0.3 | 1.5 | REACTOME METABOLISM OF VITAMINS AND COFACTORS | Genes involved in Metabolism of vitamins and cofactors |
| 0.2 | 0.7 | REACTOME NEUROTRANSMITTER RECEPTOR BINDING AND DOWNSTREAM TRANSMISSION IN THE POSTSYNAPTIC CELL | Genes involved in Neurotransmitter Receptor Binding And Downstream Transmission In The Postsynaptic Cell |
| 0.2 | 0.7 | REACTOME POTASSIUM CHANNELS | Genes involved in Potassium Channels |
| 0.2 | 0.6 | REACTOME MRNA DECAY BY 5 TO 3 EXORIBONUCLEASE | Genes involved in mRNA Decay by 5' to 3' Exoribonuclease |
| 0.2 | 0.9 | REACTOME PEROXISOMAL LIPID METABOLISM | Genes involved in Peroxisomal lipid metabolism |
| 0.2 | 0.5 | REACTOME APOPTOSIS | Genes involved in Apoptosis |
| 0.2 | 0.5 | REACTOME SYNTHESIS OF PIPS AT THE GOLGI MEMBRANE | Genes involved in Synthesis of PIPs at the Golgi membrane |
| 0.2 | 1.5 | REACTOME INTERFERON SIGNALING | Genes involved in Interferon Signaling |
| 0.2 | 0.3 | REACTOME PI METABOLISM | Genes involved in PI Metabolism |
| 0.2 | 1.1 | REACTOME BASE EXCISION REPAIR | Genes involved in Base Excision Repair |
| 0.1 | 0.4 | REACTOME SIGNALLING TO ERKS | Genes involved in Signalling to ERKs |
| 0.1 | 0.4 | REACTOME TRNA AMINOACYLATION | Genes involved in tRNA Aminoacylation |
| 0.1 | 0.4 | REACTOME TRANSCRIPTIONAL REGULATION OF WHITE ADIPOCYTE DIFFERENTIATION | Genes involved in Transcriptional Regulation of White Adipocyte Differentiation |
| 0.1 | 0.5 | REACTOME METABOLISM OF NUCLEOTIDES | Genes involved in Metabolism of nucleotides |
| 0.1 | 0.6 | REACTOME SIGNALING BY RHO GTPASES | Genes involved in Signaling by Rho GTPases |
| 0.1 | 0.4 | REACTOME GLYCEROPHOSPHOLIPID BIOSYNTHESIS | Genes involved in Glycerophospholipid biosynthesis |
| 0.1 | 0.4 | REACTOME MITOCHONDRIAL PROTEIN IMPORT | Genes involved in Mitochondrial Protein Import |
| 0.1 | 0.9 | REACTOME CHEMOKINE RECEPTORS BIND CHEMOKINES | Genes involved in Chemokine receptors bind chemokines |
| 0.1 | 0.3 | REACTOME PLATELET ACTIVATION SIGNALING AND AGGREGATION | Genes involved in Platelet activation, signaling and aggregation |
| 0.1 | 0.3 | REACTOME SIGNALING BY SCF KIT | Genes involved in Signaling by SCF-KIT |
| 0.1 | 0.3 | REACTOME INNATE IMMUNE SYSTEM | Genes involved in Innate Immune System |
| 0.1 | 0.2 | REACTOME PYRUVATE METABOLISM AND CITRIC ACID TCA CYCLE | Genes involved in Pyruvate metabolism and Citric Acid (TCA) cycle |
| 0.1 | 0.3 | REACTOME FORMATION OF INCISION COMPLEX IN GG NER | Genes involved in Formation of incision complex in GG-NER |
| 0.1 | 1.4 | REACTOME ABC FAMILY PROTEINS MEDIATED TRANSPORT | Genes involved in ABC-family proteins mediated transport |
| 0.0 | 0.6 | REACTOME FACTORS INVOLVED IN MEGAKARYOCYTE DEVELOPMENT AND PLATELET PRODUCTION | Genes involved in Factors involved in megakaryocyte development and platelet production |
| 0.0 | 0.2 | REACTOME RNA POL II TRANSCRIPTION PRE INITIATION AND PROMOTER OPENING | Genes involved in RNA Polymerase II Transcription Pre-Initiation And Promoter Opening |
| 0.0 | 0.0 | REACTOME HIV LIFE CYCLE | Genes involved in HIV Life Cycle |