Project
GSE43616: Time-course of wild-type Arabidopsis leaf
Navigation
Downloads
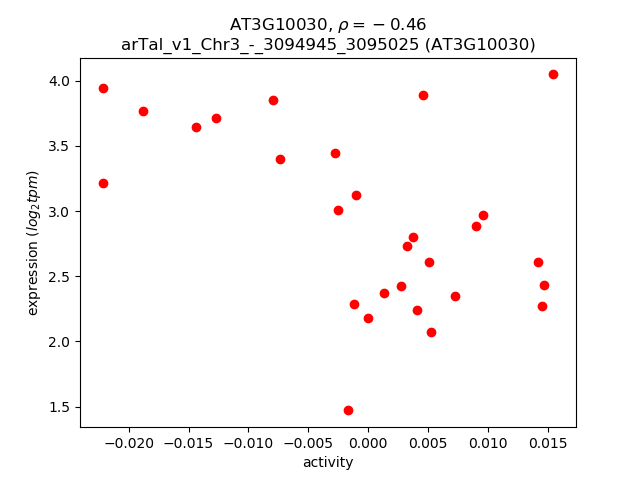
Results for AT3G10030
Z-value: 0.73
Transcription factors associated with AT3G10030
| Gene Symbol | Gene ID | Gene Info |
|---|---|---|
|
AT3G10030
|
AT3G10030 | aspartate/glutamate/uridylate kinase family protein |
Activity-expression correlation:
| Gene | Promoter | Pearson corr. coef. | P-value | Plot |
|---|---|---|---|---|
| AT3G10030 | arTal_v1_Chr3_-_3094945_3095025 | -0.46 | 1.4e-02 | Click! |
Activity profile of AT3G10030 motif
Sorted Z-values of AT3G10030 motif
| Promoter | Log-likelihood | Transcript | Gene | Gene Info |
|---|---|---|---|---|
| arTal_v1_Chr1_-_29635931_29635931 | 1.94 |
AT1G78820.1
|
AT1G78820
|
D-mannose binding lectin protein with Apple-like carbohydrate-binding domain-containing protein |
| arTal_v1_Chr3_-_3357754_3357754 | 1.67 |
AT3G10720.2
|
AT3G10720
|
Plant invertase/pectin methylesterase inhibitor superfamily |
| arTal_v1_Chr4_-_7493080_7493080 | 1.63 |
AT4G12730.1
|
FLA2
|
FASCICLIN-like arabinogalactan 2 |
| arTal_v1_Chr3_-_3356811_3356811 | 1.51 |
AT3G10720.1
|
AT3G10720
|
Plant invertase/pectin methylesterase inhibitor superfamily |
| arTal_v1_Chr1_-_59215_59215 | 1.50 |
AT1G01120.1
|
KCS1
|
3-ketoacyl-CoA synthase 1 |
| arTal_v1_Chr2_-_15790139_15790139 | 1.17 |
AT2G37640.1
|
EXP3
|
Barwin-like endoglucanases superfamily protein |
| arTal_v1_Chr2_-_15789605_15789605 | 1.15 |
AT2G37640.2
|
EXP3
|
Barwin-like endoglucanases superfamily protein |
| arTal_v1_Chr3_-_6436046_6436046 | 1.15 |
AT3G18710.1
|
PUB29
|
plant U-box 29 |
| arTal_v1_Chr3_+_18262290_18262511 | 1.14 |
AT3G49260.1
AT3G49260.3 AT3G49260.2 AT3G49260.4 |
iqd21
|
IQ-domain 21 |
| arTal_v1_Chr3_+_23345754_23345754 | 1.14 |
AT3G63200.1
|
PLP9
|
PATATIN-like protein 9 |
| arTal_v1_Chr3_+_8610979_8610979 | 1.09 |
AT3G23840.1
|
AT3G23840
|
HXXXD-type acyl-transferase family protein |
| arTal_v1_Chr3_+_17949416_17949416 | 1.08 |
AT3G48460.1
|
AT3G48460
|
GDSL-like Lipase/Acylhydrolase superfamily protein |
| arTal_v1_Chr3_+_19845097_19845172 | 1.04 |
AT3G53530.2
AT3G53530.1 |
NAKR3
|
Chloroplast-targeted copper chaperone protein |
| arTal_v1_Chr1_-_28603932_28603932 | 1.01 |
AT1G76240.1
|
AT1G76240
|
DUF241 domain protein (DUF241) |
| arTal_v1_Chr2_+_15335284_15335284 | 1.00 |
AT2G36570.1
|
AT2G36570
|
Leucine-rich repeat protein kinase family protein |
| arTal_v1_Chr4_-_15429113_15429225 | 0.98 |
AT4G31890.2
AT4G31890.1 AT4G31890.3 |
AT4G31890
|
ARM repeat superfamily protein |
| arTal_v1_Chr5_+_3032375_3032375 | 0.93 |
AT5G09760.1
|
AT5G09760
|
Plant invertase/pectin methylesterase inhibitor superfamily |
| arTal_v1_Chr2_+_19191247_19191247 | 0.93 |
AT2G46710.1
|
ROPGAP3
|
Rho GTPase activating protein with PAK-box/P21-Rho-binding domain-containing protein |
| arTal_v1_Chr4_+_160643_160643 | 0.93 |
AT4G00360.1
|
CYP86A2
|
cytochrome P450, family 86, subfamily A, polypeptide 2 |
| arTal_v1_Chr2_-_18914739_18914739 | 0.93 |
AT2G45970.1
|
CYP86A8
|
cytochrome P450, family 86, subfamily A, polypeptide 8 |
| arTal_v1_Chr5_+_26646900_26646900 | 0.91 |
AT5G66740.1
|
AT5G66740
|
spindle assembly abnormal protein (DUF620) |
| arTal_v1_Chr5_+_3032019_3032019 | 0.91 |
AT5G09760.2
|
AT5G09760
|
Plant invertase/pectin methylesterase inhibitor superfamily |
| arTal_v1_Chr3_-_22984566_22984566 | 0.90 |
AT3G62070.1
|
AT3G62070
|
hypothetical protein |
| arTal_v1_Chr5_-_3740146_3740164 | 0.85 |
AT5G11620.2
AT5G11620.1 |
AT5G11620
|
SWIM zinc finger family protein / mitogen-activated protein kinase kinase kinase (MAPKKK)-like protein |
| arTal_v1_Chr1_+_17065858_17065858 | 0.85 |
AT1G45130.2
|
BGAL5
|
beta-galactosidase 5 |
| arTal_v1_Chr5_+_6833564_6833659 | 0.81 |
AT5G20250.2
AT5G20250.1 AT5G20250.4 AT5G20250.3 |
DIN10
|
Raffinose synthase family protein |
| arTal_v1_Chr1_+_28517939_28517939 | 0.81 |
AT1G75960.1
|
AT1G75960
|
AMP-dependent synthetase and ligase family protein |
| arTal_v1_Chr1_+_17065111_17065111 | 0.81 |
AT1G45130.1
|
BGAL5
|
beta-galactosidase 5 |
| arTal_v1_Chr1_-_26515188_26515255 | 0.80 |
AT1G70370.2
AT1G70370.1 |
PG2
|
polygalacturonase 2 |
| arTal_v1_Chr1_+_26439556_26439556 | 0.75 |
AT1G70210.1
|
CYCD1%3B1
|
CYCLIN D1;1 |
| arTal_v1_Chr2_+_15765698_15765698 | 0.74 |
AT2G37585.1
|
AT2G37585
|
Core-2/I-branching beta-1,6-N-acetylglucosaminyltransferase family protein |
| arTal_v1_Chr5_+_2680401_2680401 | 0.73 |
AT5G08330.1
|
TCP11
|
TCP family transcription factor |
| arTal_v1_Chr1_-_26327965_26327965 | 0.70 |
AT1G69900.1
|
AT1G69900
|
Actin cross-linking protein |
| arTal_v1_Chr1_-_29647691_29647691 | 0.69 |
AT1G78860.1
|
AT1G78860
|
D-mannose binding lectin protein with Apple-like carbohydrate-binding domain-containing protein |
| arTal_v1_Chr1_-_29638773_29638773 | 0.68 |
AT1G78830.1
|
AT1G78830
|
Curculin-like (mannose-binding) lectin family protein |
| arTal_v1_Chr2_+_12014412_12014412 | 0.67 |
AT2G28190.1
|
CSD2
|
copper/zinc superoxide dismutase 2 |
| arTal_v1_Chr5_+_6387341_6387489 | 0.67 |
AT5G19090.1
AT5G19090.4 AT5G19090.3 AT5G19090.2 |
AT5G19090
|
Heavy metal transport/detoxification superfamily protein |
| arTal_v1_Chr1_+_11349697_11349697 | 0.64 |
AT1G31710.1
|
AT1G31710
|
Copper amine oxidase family protein |
| arTal_v1_Chr3_+_2347186_2347186 | 0.63 |
AT3G07350.1
|
AT3G07350
|
sulfate/thiosulfate import ATP-binding protein, putative (DUF506) |
| arTal_v1_Chr5_+_26151333_26151422 | 0.62 |
AT5G65440.5
AT5G65440.4 AT5G65440.2 AT5G65440.1 AT5G65440.3 AT5G65440.7 AT5G65440.9 AT5G65440.8 AT5G65440.6 |
AT5G65440
|
transmembrane protein |
| arTal_v1_Chr4_+_10142255_10142255 | 0.62 |
AT4G18350.1
|
NCED2
|
nine-cis-epoxycarotenoid dioxygenase 2 |
| arTal_v1_Chr1_-_22249721_22249721 | 0.62 |
AT1G60390.1
|
PG1
|
polygalacturonase 1 |
| arTal_v1_Chr1_-_30387602_30387602 | 0.62 |
AT1G80850.1
|
AT1G80850
|
DNA glycosylase superfamily protein |
| arTal_v1_Chr3_+_21419449_21419517 | 0.62 |
AT3G57830.1
AT3G57830.2 AT3G57830.3 |
AT3G57830
|
Leucine-rich repeat protein kinase family protein |
| arTal_v1_Chr4_-_16644928_16644928 | 0.60 |
AT4G34950.1
|
AT4G34950
|
Major facilitator superfamily protein |
| arTal_v1_Chr5_+_25328119_25328119 | 0.60 |
AT5G63140.1
|
PAP29
|
purple acid phosphatase 29 |
| arTal_v1_Chr1_+_95935_95935 | 0.59 |
AT1G01225.1
|
AT1G01225
|
NC domain-containing protein-like protein |
| arTal_v1_Chr2_-_7768040_7768040 | 0.58 |
AT2G17880.1
|
AT2G17880
|
Chaperone DnaJ-domain superfamily protein |
| arTal_v1_Chr1_+_4735474_4735474 | 0.58 |
AT1G13820.1
|
AT1G13820
|
alpha/beta-Hydrolases superfamily protein |
| arTal_v1_Chr5_-_26842104_26842104 | 0.57 |
AT5G67270.1
|
EB1C
|
end binding protein 1C |
| arTal_v1_Chr5_+_72292_72292 | 0.57 |
AT5G01190.2
AT5G01190.1 |
LAC10
|
laccase 10 |
| arTal_v1_Chr4_-_13496738_13496738 | 0.56 |
AT4G26830.1
AT4G26830.2 |
AT4G26830
|
O-Glycosyl hydrolases family 17 protein |
| arTal_v1_Chr4_-_12068538_12068624 | 0.55 |
AT4G23020.2
AT4G23020.1 |
TRM11
|
hypothetical protein |
| arTal_v1_Chr5_+_4341262_4341262 | 0.54 |
AT5G13510.1
|
EMB3136
|
Ribosomal protein L10 family protein |
| arTal_v1_Chr4_-_10188981_10188981 | 0.54 |
AT4G18440.1
|
AT4G18440
|
L-Aspartase-like family protein |
| arTal_v1_Chr3_+_18510056_18510056 | 0.54 |
AT3G49930.1
|
AT3G49930
|
C2H2 and C2HC zinc fingers superfamily protein |
| arTal_v1_Chr5_+_26461152_26461177 | 0.53 |
AT5G66230.2
AT5G66220.1 |
AT5G66230
AT5G66220
|
Chalcone-flavanone isomerase family protein Chalcone-flavanone isomerase family protein |
| arTal_v1_Chr1_-_28396677_28396677 | 0.53 |
AT1G75620.1
|
AT1G75620
|
glyoxal oxidase-related protein |
| arTal_v1_Chr3_-_18559326_18559326 | 0.53 |
AT3G50060.1
|
MYB77
|
myb domain protein 77 |
| arTal_v1_Chr5_+_6387735_6387735 | 0.52 |
AT5G19090.5
|
AT5G19090
|
Heavy metal transport/detoxification superfamily protein |
| arTal_v1_Chr2_-_12270020_12270020 | 0.51 |
AT2G28620.3
AT2G28620.1 |
AT2G28620
|
P-loop containing nucleoside triphosphate hydrolases superfamily protein |
| arTal_v1_Chr1_-_1307973_1307973 | 0.50 |
AT1G04680.1
|
AT1G04680
|
Pectin lyase-like superfamily protein |
| arTal_v1_Chr4_+_17986384_17986384 | 0.50 |
AT4G38430.1
|
ROPGEF1
|
rho guanyl-nucleotide exchange factor 1 |
| arTal_v1_Chr5_-_26816761_26816761 | 0.50 |
AT5G67200.1
|
AT5G67200
|
Leucine-rich repeat protein kinase family protein |
| arTal_v1_Chr1_-_29396105_29396105 | 0.49 |
AT1G78120.1
AT1G78120.2 |
TPR12
|
Tetratricopeptide repeat (TPR)-like superfamily protein |
| arTal_v1_Chr3_-_9979843_9979843 | 0.49 |
AT3G27050.1
|
AT3G27050
|
plant/protein |
| arTal_v1_Chr3_-_8217080_8217206 | 0.49 |
AT3G23090.1
AT3G23090.2 AT3G23090.4 AT3G23090.3 |
AT3G23090
|
TPX2 (targeting protein for Xklp2) protein family |
| arTal_v1_Chr2_+_18791289_18791289 | 0.49 |
AT2G45610.1
|
AT2G45610
|
alpha/beta-Hydrolases superfamily protein |
| arTal_v1_Chr2_+_12821569_12821569 | 0.48 |
AT2G30040.1
|
MAPKKK14
|
mitogen-activated protein kinase kinase kinase 14 |
| arTal_v1_Chr4_-_481160_481160 | 0.48 |
AT4G01110.1
|
AT4G01110
|
late embryogenesis abundant hydroxyproline-rich glycoprotein family protein |
| arTal_v1_Chr3_+_10205074_10205074 | 0.48 |
AT3G27540.1
|
AT3G27540
|
beta-1,4-N-acetylglucosaminyltransferase family protein |
| arTal_v1_Chr2_+_9599420_9599550 | 0.47 |
AT2G22610.3
AT2G22610.2 AT2G22610.1 |
AT2G22610
|
Di-glucose binding protein with Kinesin motor domain-containing protein |
| arTal_v1_Chr3_-_22881775_22881775 | 0.47 |
AT3G61820.1
|
AT3G61820
|
Eukaryotic aspartyl protease family protein |
| arTal_v1_Chr5_-_26845294_26845294 | 0.47 |
AT5G67280.1
|
RLK
|
receptor-like kinase |
| arTal_v1_Chr1_+_3400554_3400560 | 0.46 |
AT1G10380.2
AT1G10380.1 |
AT1G10380
|
Putative membrane lipoprotein |
| arTal_v1_Chr1_+_20137537_20137537 | 0.46 |
AT1G53920.1
|
GLIP5
|
GDSL-motif lipase 5 |
| arTal_v1_Chr3_+_22349308_22349308 | 0.45 |
AT3G60490.1
|
AT3G60490
|
Integrase-type DNA-binding superfamily protein |
| arTal_v1_Chr3_-_21085245_21085245 | 0.45 |
AT3G56970.1
|
bHLH38
|
basic helix-loop-helix (bHLH) DNA-binding superfamily protein |
| arTal_v1_Chr2_-_12270763_12270763 | 0.45 |
AT2G28620.2
|
AT2G28620
|
P-loop containing nucleoside triphosphate hydrolases superfamily protein |
| arTal_v1_Chr4_+_7758275_7758275 | 0.45 |
AT4G13340.1
|
LRX3
|
Leucine-rich repeat (LRR) family protein |
| arTal_v1_Chr1_-_25029857_25029857 | 0.45 |
AT1G67050.1
|
AT1G67050
|
membrane-associated kinase regulator |
| arTal_v1_Chr3_-_17020428_17020428 | 0.44 |
AT3G46320.1
|
AT3G46320
|
Histone superfamily protein |
| arTal_v1_Chr5_+_16161449_16161449 | 0.44 |
AT5G40390.1
|
SIP1
|
Raffinose synthase family protein |
| arTal_v1_Chr1_-_13280380_13280387 | 0.44 |
AT1G35780.2
AT1G35780.1 |
AT1G35780
|
N-lysine methyltransferase |
| arTal_v1_Chr5_+_8042853_8042876 | 0.43 |
AT5G23860.1
AT5G23860.2 |
TUB8
|
tubulin beta 8 |
| arTal_v1_Chr5_-_20940895_20940895 | 0.43 |
AT5G51550.1
|
EXL3
|
EXORDIUM like 3 |
| arTal_v1_Chr3_+_1086516_1086516 | 0.43 |
AT3G04140.1
|
AT3G04140
|
Ankyrin repeat family protein |
| arTal_v1_Chr5_+_19179881_19179881 | 0.42 |
AT5G47230.1
|
ERF5
|
ethylene responsive element binding factor 5 |
| arTal_v1_Chr5_+_25948954_25948954 | 0.42 |
AT5G64940.1
AT5G64940.2 |
ATH13
|
ABC2 homolog 13 |
| arTal_v1_Chr3_+_1591115_1591115 | 0.41 |
AT3G05490.1
|
RALFL22
|
ralf-like 22 |
| arTal_v1_Chr4_+_550349_550349 | 0.41 |
AT4G01330.2
AT4G01330.3 |
AT4G01330
|
Protein kinase superfamily protein |
| arTal_v1_Chr4_+_550175_550175 | 0.40 |
AT4G01330.1
|
AT4G01330
|
Protein kinase superfamily protein |
| arTal_v1_Chr1_-_13279682_13279682 | 0.40 |
AT1G35780.4
|
AT1G35780
|
N-lysine methyltransferase |
| arTal_v1_Chr1_-_3444360_3444360 | 0.40 |
AT1G10470.1
|
ARR4
|
response regulator 4 |
| arTal_v1_Chr4_-_18334893_18334893 | 0.40 |
AT4G39410.1
|
WRKY13
|
WRKY DNA-binding protein 13 |
| arTal_v1_Chr1_-_13279879_13279879 | 0.40 |
AT1G35780.3
|
AT1G35780
|
N-lysine methyltransferase |
| arTal_v1_Chr5_+_2063414_2063414 | 0.40 |
AT5G06700.1
|
AT5G06700
|
trichome birefringence-like protein (DUF828) |
| arTal_v1_Chr1_-_3443957_3443957 | 0.40 |
AT1G10470.3
AT1G10470.2 |
ARR4
|
response regulator 4 |
| arTal_v1_Chr5_-_7081789_7081789 | 0.39 |
AT5G20870.1
|
AT5G20870
|
O-Glycosyl hydrolases family 17 protein |
| arTal_v1_Chr5_+_97536_97536 | 0.39 |
AT5G01240.1
|
LAX1
|
like AUXIN RESISTANT 1 |
| arTal_v1_Chr5_-_25843555_25843555 | 0.39 |
AT5G64660.1
|
CMPG2
|
CYS, MET, PRO, and GLY protein 2 |
| arTal_v1_Chr5_-_23236572_23236682 | 0.39 |
AT5G57350.2
AT5G57350.4 AT5G57350.1 |
HA3
|
H[+]-ATPase 3 |
| arTal_v1_Chr5_-_16592381_16592381 | 0.39 |
AT5G41460.1
|
AT5G41460
|
transferring glycosyl group transferase (DUF604) |
| arTal_v1_Chr1_-_28383769_28383769 | 0.39 |
AT1G75590.1
|
AT1G75590
|
SAUR-like auxin-responsive protein family |
| arTal_v1_Chr4_-_18472048_18472048 | 0.39 |
AT4G39800.1
|
MIPS1
|
myo-inositol-1-phosphate synthase 1 |
| arTal_v1_Chr5_-_23234887_23234887 | 0.39 |
AT5G57350.3
|
HA3
|
H[+]-ATPase 3 |
| arTal_v1_Chr1_-_10505166_10505166 | 0.38 |
AT1G29980.2
|
AT1G29980
|
choice-of-anchor C domain protein, putative (Protein of unknown function, DUF642) |
| arTal_v1_Chr3_-_19910226_19910244 | 0.38 |
AT3G53720.1
AT3G53720.2 |
CHX20
|
cation/H+ exchanger 20 |
| arTal_v1_Chr5_-_22080341_22080341 | 0.38 |
AT5G54380.1
|
THE1
|
protein kinase family protein |
| arTal_v1_Chr1_-_10506189_10506189 | 0.38 |
AT1G29980.1
|
AT1G29980
|
choice-of-anchor C domain protein, putative (Protein of unknown function, DUF642) |
| arTal_v1_Chr5_-_16585363_16585363 | 0.38 |
AT5G41420.1
|
AT5G41420
|
hypothetical protein |
| arTal_v1_Chr4_-_9241629_9241629 | 0.38 |
AT4G16340.1
|
SPK1
|
guanyl-nucleotide exchange factors;GTPase binding;GTP binding protein |
| arTal_v1_Chr4_+_17743738_17743738 | 0.38 |
AT4G37760.1
|
SQE3
|
squalene epoxidase 3 |
| arTal_v1_Chr1_+_29735952_29735952 | 0.38 |
AT1G79040.1
|
PSBR
|
photosystem II subunit R |
| arTal_v1_Chr4_-_9241384_9241384 | 0.38 |
AT4G16340.2
|
SPK1
|
guanyl-nucleotide exchange factors;GTPase binding;GTP binding protein |
| arTal_v1_Chr5_+_13934108_13934108 | 0.37 |
AT5G35760.1
|
AT5G35760
|
Beta-galactosidase related protein |
| arTal_v1_Chr1_+_18305445_18305445 | 0.37 |
AT1G49450.1
|
AT1G49450
|
Transducin/WD40 repeat-like superfamily protein |
| arTal_v1_Chr5_+_4156501_4156501 | 0.37 |
AT5G13100.1
|
AT5G13100
|
Gap junction beta-4 protein |
| arTal_v1_Chr2_-_12685145_12685151 | 0.37 |
AT2G29670.2
AT2G29670.1 |
AT2G29670
|
Tetratricopeptide repeat (TPR)-like superfamily protein |
| arTal_v1_Chr5_+_24844248_24844295 | 0.37 |
AT5G61850.2
AT5G61850.1 |
LFY
|
floral meristem identity control protein LEAFY (LFY) |
| arTal_v1_Chr4_+_12600803_12600803 | 0.37 |
AT4G24310.1
|
AT4G24310
|
transmembrane protein, putative (DUF679) |
| arTal_v1_Chr3_+_18620450_18620599 | 0.37 |
AT3G50230.2
AT3G50230.1 |
AT3G50230
|
Leucine-rich repeat protein kinase family protein |
| arTal_v1_Chr4_-_14812821_14812821 | 0.37 |
AT4G30250.1
|
AT4G30250
|
P-loop containing nucleoside triphosphate hydrolases superfamily protein |
| arTal_v1_Chr1_+_20763844_20763844 | 0.37 |
AT1G55580.1
|
LAS
|
GRAS family transcription factor |
| arTal_v1_Chr3_+_22492811_22492811 | 0.37 |
AT3G60870.1
|
AHL18
|
AT-hook motif nuclear-localized protein 18 |
| arTal_v1_Chr4_-_6796398_6796398 | 0.37 |
AT4G11140.1
|
CRF1
|
cytokinin response factor 1 |
| arTal_v1_Chr5_-_1207679_1207679 | 0.37 |
AT5G04310.2
AT5G04310.3 |
AT5G04310
|
Pectin lyase-like superfamily protein |
| arTal_v1_Chr1_+_19958380_19958380 | 0.36 |
AT1G53470.1
|
MSL4
|
mechanosensitive channel of small conductance-like 4 |
| arTal_v1_Chr4_+_7297765_7297765 | 0.36 |
AT4G12270.1
|
AT4G12270
|
Copper amine oxidase family protein |
| arTal_v1_Chr2_-_19353114_19353114 | 0.36 |
AT2G47150.1
|
AT2G47150
|
NAD(P)-binding Rossmann-fold superfamily protein |
| arTal_v1_Chr4_-_8966351_8966351 | 0.36 |
AT4G15740.1
|
AT4G15740
|
Calcium-dependent lipid-binding (CaLB domain) family protein |
| arTal_v1_Chr5_+_98533_98533 | 0.36 |
AT5G01240.2
|
LAX1
|
like AUXIN RESISTANT 1 |
| arTal_v1_Chr1_+_19488755_19488755 | 0.36 |
AT1G52330.1
AT1G52330.2 |
AT1G52330
|
Late embryogenesis abundant (LEA) hydroxyproline-rich glycoprotein family |
| arTal_v1_Chr4_+_128581_128581 | 0.36 |
AT4G00300.1
|
AT4G00300
|
receptor-like kinase |
| arTal_v1_Chr5_+_19031301_19031350 | 0.35 |
AT5G46880.1
AT5G46880.3 |
HB-7
|
homeobox-7 |
| arTal_v1_Chr3_+_3299893_3299893 | 0.35 |
AT3G10560.1
|
UNE9
|
Cytochrome P450 superfamily protein |
| arTal_v1_Chr2_+_15056753_15056753 | 0.35 |
AT2G35850.1
|
AT2G35850
|
transmembrane protein |
| arTal_v1_Chr5_+_7185897_7185897 | 0.35 |
AT5G21130.1
|
AT5G21130
|
Late embryogenesis abundant (LEA) hydroxyproline-rich glycoprotein family |
| arTal_v1_Chr5_+_15611812_15611812 | 0.35 |
AT5G39000.1
|
AT5G39000
|
Malectin/receptor-like protein kinase family protein |
| arTal_v1_Chr1_-_18366559_18366559 | 0.35 |
AT1G49620.1
|
ICK5
|
Cyclin-dependent kinase inhibitor family protein |
| arTal_v1_Chr3_+_2100021_2100021 | 0.35 |
AT3G36659.1
|
AT3G36659
|
Plant invertase/pectin methylesterase inhibitor superfamily protein |
| arTal_v1_Chr4_+_7962428_7962430 | 0.35 |
AT4G13710.1
AT4G13710.2 |
AT4G13710
|
Pectin lyase-like superfamily protein |
| arTal_v1_Chr4_-_9754161_9754161 | 0.35 |
AT4G17490.1
|
ERF6
|
ethylene responsive element binding factor 6 |
| arTal_v1_Chr5_-_7040654_7040654 | 0.35 |
AT5G20790.2
|
AT5G20790
|
transmembrane protein |
| arTal_v1_Chr5_+_1461786_1461786 | 0.35 |
AT5G04960.1
|
AT5G04960
|
Plant invertase/pectin methylesterase inhibitor superfamily |
| arTal_v1_Chr5_-_1467161_1467161 | 0.35 |
AT5G04970.1
|
AT5G04970
|
Plant invertase/pectin methylesterase inhibitor superfamily |
| arTal_v1_Chr2_+_11041331_11041331 | 0.34 |
AT2G25900.2
AT2G25900.1 |
ATCTH
|
Zinc finger C-x8-C-x5-C-x3-H type family protein |
| arTal_v1_Chr5_+_1332759_1332759 | 0.34 |
AT5G04640.1
|
AGL99
|
AGAMOUS-like 99 |
| arTal_v1_Chr2_+_385171_385171 | 0.34 |
AT2G01850.1
|
EXGT-A3
|
endoxyloglucan transferase A3 |
| arTal_v1_Chr2_-_10317353_10317353 | 0.34 |
AT2G24255.1
|
AT2G24255
|
LOW protein: F-box/kelch-repeat protein |
| arTal_v1_Chr3_+_3717894_3717894 | 0.33 |
AT3G11760.1
|
AT3G11760
|
structural maintenance of chromosomes flexible hinge domain protein |
| arTal_v1_Chr1_+_26996805_26996805 | 0.33 |
AT1G71790.1
|
CPB
|
Subunits of heterodimeric actin filament capping protein Capz superfamily |
| arTal_v1_Chr5_-_14586835_14586835 | 0.33 |
AT5G36937.1
|
AT5G36937
|
|
| arTal_v1_Chr3_+_22129505_22129505 | 0.33 |
AT3G59900.1
|
ARGOS
|
auxin-regulated gene involved in organ size |
| arTal_v1_Chr5_-_7040919_7040919 | 0.33 |
AT5G20790.1
|
AT5G20790
|
transmembrane protein |
| arTal_v1_Chr2_+_19508929_19508929 | 0.33 |
AT2G47550.1
|
AT2G47550
|
Plant invertase/pectin methylesterase inhibitor superfamily |
| arTal_v1_Chr1_-_18366744_18366744 | 0.33 |
AT1G49620.3
AT1G49620.2 |
ICK5
|
Cyclin-dependent kinase inhibitor family protein |
| arTal_v1_Chr4_+_10865295_10865295 | 0.33 |
AT4G20080.1
|
AT4G20080
|
Calcium-dependent lipid-binding (CaLB domain) plant phosphoribosyltransferase family protein |
| arTal_v1_Chr1_-_5513933_5513980 | 0.32 |
AT1G16070.3
AT1G16070.2 AT1G16070.1 |
TLP8
|
tubby like protein 8 |
| arTal_v1_Chr2_+_14710754_14710754 | 0.32 |
AT2G34870.1
|
MEE26
|
hydroxyproline-rich glycoprotein family protein |
| arTal_v1_Chr3_-_4834015_4834015 | 0.32 |
AT3G14440.1
|
NCED3
|
nine-cis-epoxycarotenoid dioxygenase 3 |
| arTal_v1_Chr4_-_14813107_14813107 | 0.32 |
AT4G30250.2
|
AT4G30250
|
P-loop containing nucleoside triphosphate hydrolases superfamily protein |
| arTal_v1_Chr5_-_20468128_20468217 | 0.32 |
AT5G50300.1
AT5G50300.2 |
AZG2
|
Xanthine/uracil permease family protein |
| arTal_v1_Chr1_+_29220349_29220349 | 0.32 |
AT1G77740.1
|
PIP5K2
|
phosphatidylinositol-4-phosphate 5-kinase 2 |
| arTal_v1_Chr1_-_1572469_1572469 | 0.31 |
AT1G05370.1
|
AT1G05370
|
Sec14p-like phosphatidylinositol transfer family protein |
| arTal_v1_Chr3_-_8216305_8216305 | 0.31 |
AT3G23090.5
|
AT3G23090
|
TPX2 (targeting protein for Xklp2) protein family |
| arTal_v1_Chr3_+_3712360_3712360 | 0.31 |
AT3G11740.1
|
AT3G11740
|
LURP-one-like protein (DUF567) |
| arTal_v1_Chr3_-_7286442_7286442 | 0.31 |
AT3G20830.1
|
UCNL
|
AGC (cAMP-dependent, cGMP-dependent and protein kinase C) kinase family protein |
| arTal_v1_Chr1_-_29993724_29993766 | 0.31 |
AT1G79700.1
AT1G79700.3 AT1G79700.2 |
WRI4
|
Integrase-type DNA-binding superfamily protein |
| arTal_v1_Chr1_+_23727794_23727794 | 0.31 |
AT1G63930.1
|
ROH1
|
from the Czech 'roh' meaning 'corner' |
| arTal_v1_Chr1_+_29220538_29220538 | 0.30 |
AT1G77740.2
|
PIP5K2
|
phosphatidylinositol-4-phosphate 5-kinase 2 |
| arTal_v1_Chr2_-_14677398_14677398 | 0.30 |
AT2G34790.1
|
MEE23
|
FAD-binding Berberine family protein |
| arTal_v1_Chr4_+_1889360_1889360 | 0.30 |
AT4G03965.1
|
AT4G03965
|
RING/U-box superfamily protein |
| arTal_v1_Chr1_+_8143227_8143312 | 0.30 |
AT1G23000.1
AT1G23000.2 |
AT1G23000
|
Heavy metal transport/detoxification superfamily protein |
| arTal_v1_Chr4_-_6751525_6751536 | 0.30 |
AT4G11050.3
AT4G11050.1 AT4G11050.2 |
GH9C3
|
glycosyl hydrolase 9C3 |
| arTal_v1_Chr5_+_289717_289722 | 0.30 |
AT5G01750.1
AT5G01750.2 |
AT5G01750
|
LURP-one-like protein (DUF567) |
| arTal_v1_Chr1_-_19408319_19408319 | 0.30 |
AT1G52140.1
|
AT1G52140
|
Avr9/Cf-9 rapidly elicited protein |
| arTal_v1_Chr5_-_1207946_1207946 | 0.30 |
AT5G04310.1
|
AT5G04310
|
Pectin lyase-like superfamily protein |
| arTal_v1_Chr1_+_618061_618061 | 0.30 |
AT1G02810.1
|
AT1G02810
|
Plant invertase/pectin methylesterase inhibitor superfamily |
| arTal_v1_Chr1_+_5376793_5376793 | 0.29 |
AT1G15630.1
|
AT1G15630
|
transmembrane protein |
| arTal_v1_Chr1_+_12977668_12977710 | 0.29 |
AT1G35340.4
AT1G35340.2 AT1G35340.1 AT1G35340.5 AT1G35340.3 AT1G35340.6 AT1G35340.7 |
AT1G35340
|
ATP-dependent protease La (LON) domain protein |
| arTal_v1_Chr5_+_19030844_19030844 | 0.29 |
AT5G46880.2
|
HB-7
|
homeobox-7 |
| arTal_v1_Chr3_-_17376054_17376054 | 0.29 |
AT3G47190.1
|
AT3G47190
|
2-oxoglutarate (2OG) and Fe(II)-dependent oxygenase superfamily protein |
| arTal_v1_Chr1_+_8401808_8401808 | 0.29 |
AT1G23760.1
|
JP630
|
BURP domain-containing protein |
| arTal_v1_Chr2_+_17728479_17728479 | 0.28 |
AT2G42580.1
|
TTL3
|
tetratricopetide-repeat thioredoxin-like 3 |
| arTal_v1_Chr4_+_12497055_12497055 | 0.28 |
AT4G24050.2
AT4G24050.1 |
AT4G24050
|
NAD(P)-binding Rossmann-fold superfamily protein |
| arTal_v1_Chr4_-_10319736_10319736 | 0.28 |
AT4G18790.1
|
NRAMP5
|
NRAMP metal ion transporter family protein |
| arTal_v1_Chr4_-_9859288_9859288 | 0.28 |
AT4G17710.1
|
HDG4
|
homeodomain GLABROUS 4 |
| arTal_v1_Chr3_-_7626654_7626654 | 0.28 |
AT3G21660.1
AT3G21660.2 |
AT3G21660
|
UBX domain-containing protein |
| arTal_v1_Chr2_-_15130828_15130828 | 0.28 |
AT2G36040.1
|
AT2G36040
|
|
| arTal_v1_Chr1_-_28466971_28466971 | 0.27 |
AT1G75820.1
|
CLV1
|
Leucine-rich receptor-like protein kinase family protein |
| arTal_v1_Chr1_+_29345851_29345851 | 0.27 |
AT1G78040.2
|
AT1G78040
|
Pollen Ole e 1 allergen and extensin family protein |
| arTal_v1_Chr1_+_29345662_29345662 | 0.27 |
AT1G78040.3
|
AT1G78040
|
Pollen Ole e 1 allergen and extensin family protein |
| arTal_v1_Chr3_-_20121314_20121314 | 0.27 |
AT3G54340.1
|
AP3
|
K-box region and MADS-box transcription factor family protein |
| arTal_v1_Chr3_+_5535124_5535124 | 0.27 |
AT3G16330.1
|
AT3G16330
|
Avr9/Cf-9 rapidly elicited protein |
| arTal_v1_Chr5_-_5253790_5253790 | 0.27 |
AT5G16080.1
|
CXE17
|
carboxyesterase 17 |
| arTal_v1_Chr1_+_29344539_29344539 | 0.27 |
AT1G78040.1
|
AT1G78040
|
Pollen Ole e 1 allergen and extensin family protein |
| arTal_v1_Chr1_-_4066344_4066344 | 0.27 |
AT1G12030.1
|
AT1G12030
|
phosphoenolpyruvate carboxylase, putative (DUF506) |
| arTal_v1_Chr3_+_3313953_3313953 | 0.27 |
AT3G10600.1
|
CAT7
|
cationic amino acid transporter 7 |
| arTal_v1_Chr5_-_4047448_4047448 | 0.27 |
AT5G12470.1
|
AT5G12470
|
UvrABC system C protein, putative (DUF3411) |
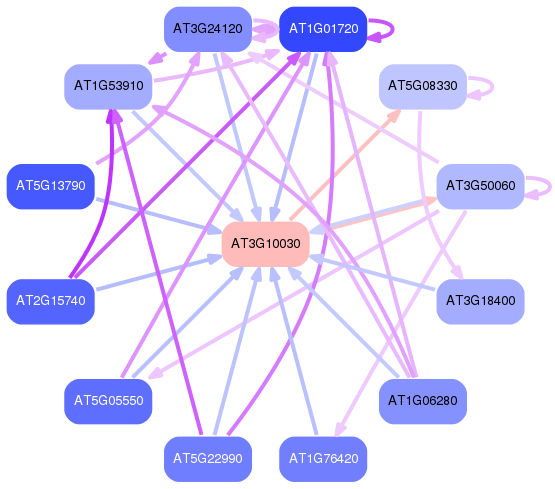
Network of associatons between targets according to the STRING database.

First level regulatory network of AT3G10030
Gene Ontology Analysis
Gene overrepresentation in biological process category:
| Log-likelihood per target | Total log-likelihood | Term | Description |
|---|---|---|---|
| 0.2 | 0.7 | GO:0071457 | cellular response to ozone(GO:0071457) |
| 0.2 | 0.5 | GO:0044208 | 'de novo' AMP biosynthetic process(GO:0044208) |
| 0.2 | 0.5 | GO:1901031 | regulation of response to reactive oxygen species(GO:1901031) |
| 0.1 | 0.4 | GO:0019594 | hexitol metabolic process(GO:0006059) hexitol biosynthetic process(GO:0019406) mannitol biosynthetic process(GO:0019593) mannitol metabolic process(GO:0019594) |
| 0.1 | 0.6 | GO:0072698 | protein localization to cytoskeleton(GO:0044380) protein localization to microtubule cytoskeleton(GO:0072698) |
| 0.1 | 0.4 | GO:0006658 | phosphatidylserine metabolic process(GO:0006658) phosphatidylserine biosynthetic process(GO:0006659) |
| 0.1 | 0.4 | GO:0032025 | response to cobalt ion(GO:0032025) |
| 0.1 | 2.3 | GO:0006949 | syncytium formation(GO:0006949) |
| 0.1 | 0.7 | GO:0051098 | regulation of binding(GO:0051098) |
| 0.1 | 1.5 | GO:0030497 | fatty acid elongation(GO:0030497) |
| 0.1 | 8.2 | GO:0045490 | pectin catabolic process(GO:0045490) |
| 0.1 | 0.5 | GO:0010929 | positive regulation of auxin mediated signaling pathway(GO:0010929) |
| 0.1 | 0.2 | GO:0033194 | response to hydroperoxide(GO:0033194) |
| 0.1 | 0.3 | GO:0031468 | nuclear envelope reassembly(GO:0031468) |
| 0.1 | 0.5 | GO:1904276 | regulation of wax biosynthetic process(GO:1904276) positive regulation of wax biosynthetic process(GO:1904278) |
| 0.1 | 0.3 | GO:0051016 | barbed-end actin filament capping(GO:0051016) |
| 0.1 | 0.3 | GO:0046622 | positive regulation of organ growth(GO:0046622) |
| 0.1 | 0.6 | GO:0090506 | axillary shoot meristem initiation(GO:0090506) |
| 0.1 | 0.4 | GO:0030007 | cellular potassium ion homeostasis(GO:0030007) |
| 0.1 | 0.3 | GO:0072530 | purine-containing compound transmembrane transport(GO:0072530) |
| 0.0 | 0.5 | GO:0010106 | cellular response to iron ion starvation(GO:0010106) |
| 0.0 | 0.3 | GO:0009650 | photoreactive repair(GO:0000719) UV protection(GO:0009650) |
| 0.0 | 0.6 | GO:0048496 | maintenance of organ identity(GO:0048496) maintenance of floral organ identity(GO:0048497) |
| 0.0 | 0.2 | GO:0009647 | skotomorphogenesis(GO:0009647) |
| 0.0 | 0.6 | GO:1990170 | stress response to cadmium ion(GO:1990170) |
| 0.0 | 0.1 | GO:0090603 | sieve element differentiation(GO:0090603) |
| 0.0 | 0.6 | GO:0010093 | specification of floral organ identity(GO:0010093) |
| 0.0 | 0.8 | GO:0003333 | amino acid transmembrane transport(GO:0003333) |
| 0.0 | 1.4 | GO:0009958 | positive gravitropism(GO:0009958) |
| 0.0 | 0.5 | GO:0010161 | red light signaling pathway(GO:0010161) |
| 0.0 | 0.4 | GO:0010077 | maintenance of inflorescence meristem identity(GO:0010077) |
| 0.0 | 0.2 | GO:0042447 | cytokinin catabolic process(GO:0009823) hormone catabolic process(GO:0042447) |
| 0.0 | 0.5 | GO:0048829 | root cap development(GO:0048829) |
| 0.0 | 0.3 | GO:1904030 | negative regulation of cyclin-dependent protein serine/threonine kinase activity(GO:0045736) negative regulation of cyclin-dependent protein kinase activity(GO:1904030) |
| 0.0 | 0.3 | GO:0048354 | mucilage biosynthetic process involved in seed coat development(GO:0048354) |
| 0.0 | 0.1 | GO:0090646 | mitochondrial tRNA processing(GO:0090646) |
| 0.0 | 0.6 | GO:0010207 | photosystem II assembly(GO:0010207) |
| 0.0 | 0.6 | GO:1901068 | guanosine-containing compound metabolic process(GO:1901068) |
| 0.0 | 0.8 | GO:0030641 | regulation of cellular pH(GO:0030641) regulation of intracellular pH(GO:0051453) |
| 0.0 | 0.2 | GO:0010021 | amylopectin biosynthetic process(GO:0010021) amylopectin metabolic process(GO:2000896) |
| 0.0 | 1.1 | GO:0010114 | response to red light(GO:0010114) |
| 0.0 | 0.3 | GO:0050779 | RNA destabilization(GO:0050779) mRNA destabilization(GO:0061157) |
| 0.0 | 1.0 | GO:0048825 | cotyledon development(GO:0048825) |
| 0.0 | 0.5 | GO:0006284 | base-excision repair(GO:0006284) |
| 0.0 | 0.1 | GO:0016926 | protein desumoylation(GO:0016926) |
| 0.0 | 0.2 | GO:0035336 | long-chain fatty-acyl-CoA metabolic process(GO:0035336) |
| 0.0 | 0.1 | GO:0006670 | sphingosine metabolic process(GO:0006670) diol metabolic process(GO:0034311) diol biosynthetic process(GO:0034312) sphingosine biosynthetic process(GO:0046512) |
| 0.0 | 0.4 | GO:0009269 | response to desiccation(GO:0009269) |
| 0.0 | 0.1 | GO:0033206 | meiotic cytokinesis(GO:0033206) |
| 0.0 | 0.5 | GO:0010103 | stomatal complex morphogenesis(GO:0010103) |
| 0.0 | 0.0 | GO:0001173 | DNA-templated transcriptional start site selection(GO:0001173) |
| 0.0 | 0.2 | GO:0080060 | integument development(GO:0080060) |
| 0.0 | 0.2 | GO:0046348 | aminoglycan catabolic process(GO:0006026) chitin metabolic process(GO:0006030) chitin catabolic process(GO:0006032) amino sugar catabolic process(GO:0046348) glucosamine-containing compound catabolic process(GO:1901072) |
| 0.0 | 0.5 | GO:0006865 | amino acid transport(GO:0006865) |
| 0.0 | 0.3 | GO:0000162 | tryptophan biosynthetic process(GO:0000162) indolalkylamine biosynthetic process(GO:0046219) |
| 0.0 | 0.3 | GO:0009934 | regulation of meristem structural organization(GO:0009934) |
| 0.0 | 0.2 | GO:0031365 | N-terminal protein amino acid modification(GO:0031365) |
| 0.0 | 0.3 | GO:0010305 | leaf vascular tissue pattern formation(GO:0010305) |
| 0.0 | 0.4 | GO:0016126 | sterol biosynthetic process(GO:0016126) |
| 0.0 | 0.5 | GO:0006487 | protein N-linked glycosylation(GO:0006487) |
| 0.0 | 1.6 | GO:0010200 | response to chitin(GO:0010200) |
| 0.0 | 0.2 | GO:0019853 | L-ascorbic acid biosynthetic process(GO:0019853) |
| 0.0 | 0.1 | GO:0015749 | monosaccharide transport(GO:0015749) |
| 0.0 | 0.2 | GO:0032922 | circadian regulation of gene expression(GO:0032922) |
Gene overrepresentation in cellular component category:
| Log-likelihood per target | Total log-likelihood | Term | Description |
|---|---|---|---|
| 0.2 | 0.6 | GO:0035371 | microtubule plus-end(GO:0035371) |
| 0.1 | 0.8 | GO:0070971 | endoplasmic reticulum exit site(GO:0070971) |
| 0.1 | 0.9 | GO:0009531 | secondary cell wall(GO:0009531) |
| 0.0 | 0.4 | GO:0045298 | tubulin complex(GO:0045298) |
| 0.0 | 0.6 | GO:0009654 | photosystem II oxygen evolving complex(GO:0009654) |
| 0.0 | 0.5 | GO:0016324 | apical plasma membrane(GO:0016324) |
| 0.0 | 0.3 | GO:0031965 | nuclear membrane(GO:0031965) |
Gene overrepresentation in molecular function category:
| Log-likelihood per target | Total log-likelihood | Term | Description |
|---|---|---|---|
| 0.5 | 2.1 | GO:0016712 | oxidoreductase activity, acting on paired donors, with incorporation or reduction of molecular oxygen, reduced flavin or flavoprotein as one donor, and incorporation of one atom of oxygen(GO:0016712) aromatase activity(GO:0070330) |
| 0.2 | 1.7 | GO:0047274 | galactinol-sucrose galactosyltransferase activity(GO:0047274) |
| 0.2 | 0.6 | GO:0051010 | microtubule plus-end binding(GO:0051010) |
| 0.2 | 0.5 | GO:0045430 | chalcone isomerase activity(GO:0045430) |
| 0.2 | 0.5 | GO:0016842 | amidine-lyase activity(GO:0016842) |
| 0.2 | 1.5 | GO:0009922 | fatty acid elongase activity(GO:0009922) |
| 0.1 | 1.1 | GO:0070696 | transmembrane receptor protein serine/threonine kinase binding(GO:0070696) |
| 0.1 | 0.6 | GO:0003680 | AT DNA binding(GO:0003680) |
| 0.1 | 0.3 | GO:0051669 | levanase activity(GO:0031219) fructan beta-fructosidase activity(GO:0051669) |
| 0.1 | 6.4 | GO:0046910 | pectinesterase inhibitor activity(GO:0046910) |
| 0.1 | 0.4 | GO:0004512 | inositol-3-phosphate synthase activity(GO:0004512) |
| 0.1 | 0.8 | GO:0010328 | auxin influx transmembrane transporter activity(GO:0010328) |
| 0.1 | 0.3 | GO:0004048 | anthranilate phosphoribosyltransferase activity(GO:0004048) |
| 0.1 | 0.4 | GO:0016463 | cadmium-transporting ATPase activity(GO:0015434) zinc-exporting ATPase activity(GO:0016463) |
| 0.1 | 0.7 | GO:0016423 | tRNA (guanine) methyltransferase activity(GO:0016423) |
| 0.1 | 0.2 | GO:0036381 | pyridoxal 5'-phosphate synthase (glutamine hydrolysing) activity(GO:0036381) |
| 0.1 | 1.7 | GO:0030570 | carbon-oxygen lyase activity, acting on polysaccharides(GO:0016837) pectate lyase activity(GO:0030570) |
| 0.1 | 0.5 | GO:0003830 | beta-1,4-mannosylglycoprotein 4-beta-N-acetylglucosaminyltransferase activity(GO:0003830) |
| 0.1 | 1.7 | GO:0004565 | beta-galactosidase activity(GO:0004565) |
| 0.1 | 1.3 | GO:0005089 | Rho guanyl-nucleotide exchange factor activity(GO:0005089) |
| 0.1 | 0.7 | GO:0004784 | superoxide dismutase activity(GO:0004784) oxidoreductase activity, acting on superoxide radicals as acceptor(GO:0016721) |
| 0.1 | 0.2 | GO:0019156 | isoamylase activity(GO:0019156) |
| 0.1 | 1.3 | GO:0015174 | basic amino acid transmembrane transporter activity(GO:0015174) |
| 0.1 | 0.6 | GO:0043733 | alkylbase DNA N-glycosylase activity(GO:0003905) DNA-3-methyladenine glycosylase activity(GO:0008725) DNA-3-methylbase glycosylase activity(GO:0043733) |
| 0.1 | 0.5 | GO:0008131 | primary amine oxidase activity(GO:0008131) |
| 0.0 | 0.1 | GO:0008481 | sphinganine kinase activity(GO:0008481) |
| 0.0 | 0.4 | GO:0004506 | squalene monooxygenase activity(GO:0004506) |
| 0.0 | 0.4 | GO:0022833 | mechanically-gated ion channel activity(GO:0008381) mechanically gated channel activity(GO:0022833) |
| 0.0 | 0.6 | GO:0016308 | 1-phosphatidylinositol-4-phosphate 5-kinase activity(GO:0016308) |
| 0.0 | 1.0 | GO:0052716 | hydroquinone:oxygen oxidoreductase activity(GO:0052716) |
| 0.0 | 0.3 | GO:0003913 | DNA photolyase activity(GO:0003913) |
| 0.0 | 0.2 | GO:0050105 | L-gulonolactone oxidase activity(GO:0050105) |
| 0.0 | 0.2 | GO:0045156 | electron transporter, transferring electrons within the cyclic electron transport pathway of photosynthesis activity(GO:0045156) |
| 0.0 | 0.5 | GO:0015086 | cadmium ion transmembrane transporter activity(GO:0015086) |
| 0.0 | 0.1 | GO:0070140 | ubiquitin-like protein-specific isopeptidase activity(GO:0070138) SUMO-specific isopeptidase activity(GO:0070140) |
| 0.0 | 0.5 | GO:0045551 | cinnamyl-alcohol dehydrogenase activity(GO:0045551) |
| 0.0 | 1.3 | GO:0000156 | phosphorelay response regulator activity(GO:0000156) |
| 0.0 | 0.3 | GO:0004861 | cyclin-dependent protein serine/threonine kinase inhibitor activity(GO:0004861) protein serine/threonine kinase inhibitor activity(GO:0030291) |
| 0.0 | 0.2 | GO:0004142 | diacylglycerol cholinephosphotransferase activity(GO:0004142) |
| 0.0 | 0.4 | GO:0103075 | indole-3-pyruvate monooxygenase activity(GO:0103075) |
| 0.0 | 0.1 | GO:1990841 | promoter-specific chromatin binding(GO:1990841) |
| 0.0 | 0.2 | GO:0004611 | phosphoenolpyruvate carboxykinase activity(GO:0004611) |
| 0.0 | 0.9 | GO:0080030 | methyl indole-3-acetate esterase activity(GO:0080030) |
| 0.0 | 0.2 | GO:0045549 | 9-cis-epoxycarotenoid dioxygenase activity(GO:0045549) |
| 0.0 | 0.4 | GO:0005199 | structural constituent of cell wall(GO:0005199) |
| 0.0 | 0.9 | GO:0033612 | receptor serine/threonine kinase binding(GO:0033612) |
| 0.0 | 0.1 | GO:0070704 | sterol desaturase activity(GO:0070704) |
| 0.0 | 0.2 | GO:0090447 | glycerol-3-phosphate 2-O-acyltransferase activity(GO:0090447) |
| 0.0 | 0.9 | GO:0004190 | aspartic-type endopeptidase activity(GO:0004190) |
| 0.0 | 0.2 | GO:0008061 | chitin binding(GO:0008061) |
| 0.0 | 0.2 | GO:0080019 | fatty-acyl-CoA reductase (alcohol-forming) activity(GO:0080019) |
| 0.0 | 0.1 | GO:0019139 | cytokinin dehydrogenase activity(GO:0019139) |
| 0.0 | 0.4 | GO:0005200 | structural constituent of cytoskeleton(GO:0005200) |
| 0.0 | 0.4 | GO:0005179 | hormone activity(GO:0005179) |
| 0.0 | 0.6 | GO:0003993 | acid phosphatase activity(GO:0003993) |
| 0.0 | 0.2 | GO:0008559 | xenobiotic-transporting ATPase activity(GO:0008559) |
| 0.0 | 0.3 | GO:0008810 | cellulase activity(GO:0008810) |
| 0.0 | 0.3 | GO:0016762 | xyloglucan:xyloglucosyl transferase activity(GO:0016762) |
| 0.0 | 0.4 | GO:0015385 | sodium:proton antiporter activity(GO:0015385) |
Gene overrepresentation in curated gene sets: canonical pathways category:
| Log-likelihood per target | Total log-likelihood | Term | Description |
|---|---|---|---|
| 0.1 | 0.2 | PID HNF3B PATHWAY | FOXA2 and FOXA3 transcription factor networks |
| 0.0 | 0.5 | PID CXCR4 PATHWAY | CXCR4-mediated signaling events |
| 0.0 | 0.2 | PID REELIN PATHWAY | Reelin signaling pathway |
| 0.0 | 0.1 | PID FCER1 PATHWAY | Fc-epsilon receptor I signaling in mast cells |
Gene overrepresentation in curated gene sets: REACTOME pathways category:
| Log-likelihood per target | Total log-likelihood | Term | Description |
|---|---|---|---|
| 0.1 | 0.4 | REACTOME GLYCOSPHINGOLIPID METABOLISM | Genes involved in Glycosphingolipid metabolism |
| 0.1 | 0.2 | REACTOME ABACAVIR TRANSPORT AND METABOLISM | Genes involved in Abacavir transport and metabolism |
| 0.0 | 0.1 | REACTOME SPHINGOLIPID DE NOVO BIOSYNTHESIS | Genes involved in Sphingolipid de novo biosynthesis |