Project
GSE43616: Time-course of wild-type Arabidopsis leaf
Navigation
Downloads
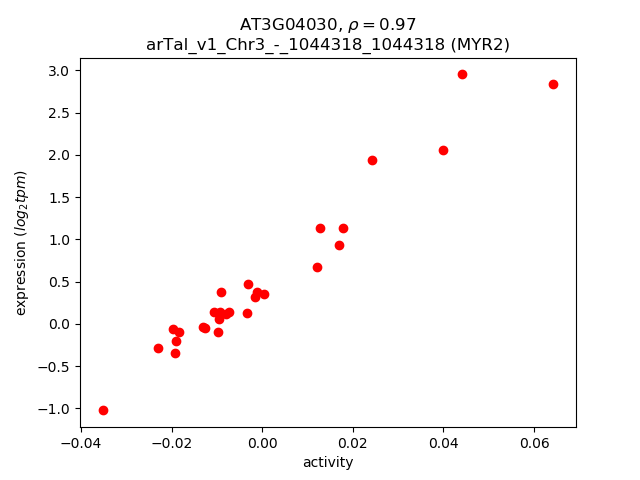
Results for AT3G04030
Z-value: 1.78
Transcription factors associated with AT3G04030
| Gene Symbol | Gene ID | Gene Info |
|---|---|---|
|
AT3G04030
|
AT3G04030 | Homeodomain-like superfamily protein |
Activity-expression correlation:
| Gene | Promoter | Pearson corr. coef. | P-value | Plot |
|---|---|---|---|---|
| MYR2 | arTal_v1_Chr3_-_1044318_1044318 | 0.97 | 4.5e-18 | Click! |
Activity profile of AT3G04030 motif
Sorted Z-values of AT3G04030 motif
| Promoter | Log-likelihood | Transcript | Gene | Gene Info |
|---|---|---|---|---|
| arTal_v1_Chr5_+_18613239_18613239 | 13.27 |
AT5G45890.1
|
SAG12
|
senescence-associated gene 12 |
| arTal_v1_Chr1_-_23238644_23238644 | 9.30 |
AT1G62760.1
|
AT1G62760
|
Plant invertase/pectin methylesterase inhibitor superfamily protein |
| arTal_v1_Chr1_+_20387058_20387058 | 9.11 |
AT1G54575.1
|
AT1G54575
|
hypothetical protein |
| arTal_v1_Chr1_+_20386809_20386809 | 8.83 |
AT1G54575.2
|
AT1G54575
|
hypothetical protein |
| arTal_v1_Chr2_-_18781973_18781973 | 8.37 |
AT2G45570.1
|
CYP76C2
|
cytochrome P450, family 76, subfamily C, polypeptide 2 |
| arTal_v1_Chr1_-_27548282_27548282 | 8.28 |
AT1G73260.1
|
KTI1
|
kunitz trypsin inhibitor 1 |
| arTal_v1_Chr3_+_18873911_18873911 | 8.25 |
AT3G50770.1
|
CML41
|
calmodulin-like 41 |
| arTal_v1_Chr3_-_3197457_3197457 | 8.10 |
AT3G10320.1
|
AT3G10320
|
Glycosyltransferase family 61 protein |
| arTal_v1_Chr4_+_8908763_8908879 | 8.01 |
AT4G15610.1
AT4G15610.2 |
AT4G15610
|
Uncharacterized protein family (UPF0497) |
| arTal_v1_Chr5_+_16290386_16290386 | 7.84 |
AT5G40690.1
|
AT5G40690
|
histone-lysine N-methyltransferase trithorax-like protein |
| arTal_v1_Chr2_+_10906460_10906460 | 7.72 |
AT2G25625.2
|
AT2G25625
|
histone deacetylase-like protein |
| arTal_v1_Chr3_+_5234457_5234457 | 7.71 |
AT3G15500.1
|
NAC3
|
NAC domain containing protein 3 |
| arTal_v1_Chr1_-_30053936_30053936 | 7.56 |
AT1G79900.1
|
BAC2
|
Mitochondrial substrate carrier family protein |
| arTal_v1_Chr2_+_12600914_12601033 | 7.53 |
AT2G29350.2
AT2G29350.1 AT2G29350.3 |
SAG13
|
senescence-associated gene 13 |
| arTal_v1_Chr4_+_15828228_15828228 | 7.51 |
AT4G32810.1
AT4G32810.2 |
CCD8
|
carotenoid cleavage dioxygenase 8 |
| arTal_v1_Chr2_+_10906215_10906215 | 7.51 |
AT2G25625.1
|
AT2G25625
|
histone deacetylase-like protein |
| arTal_v1_Chr1_-_1559917_1559917 | 7.50 |
AT1G05340.1
|
AT1G05340
|
cysteine-rich TM module stress tolerance protein |
| arTal_v1_Chr2_-_13101371_13101371 | 7.49 |
AT2G30750.1
|
CYP71A12
|
cytochrome P450 family 71 polypeptide |
| arTal_v1_Chr3_+_9208861_9208941 | 7.36 |
AT3G25290.1
AT3G25290.2 |
AT3G25290
|
Auxin-responsive family protein |
| arTal_v1_Chr1_+_2984829_2984829 | 7.16 |
AT1G09240.1
|
NAS3
|
nicotianamine synthase 3 |
| arTal_v1_Chr1_+_23887809_23887809 | 7.02 |
AT1G64360.1
|
AT1G64360
|
hypothetical protein |
| arTal_v1_Chr1_-_24433165_24433165 | 6.95 |
AT1G65690.1
|
AT1G65690
|
Late embryogenesis abundant (LEA) hydroxyproline-rich glycoprotein family |
| arTal_v1_Chr2_+_19375985_19375985 | 6.91 |
AT2G47190.1
|
MYB2
|
myb domain protein 2 |
| arTal_v1_Chr2_+_13674255_13674398 | 6.79 |
AT2G32190.2
AT2G32190.1 |
AT2G32190
|
cysteine-rich/transmembrane domain A-like protein |
| arTal_v1_Chr1_-_460696_460831 | 6.77 |
AT1G02310.1
AT1G02310.2 |
MAN1
|
Glycosyl hydrolase superfamily protein |
| arTal_v1_Chr1_-_3752780_3752780 | 6.72 |
AT1G11190.1
|
BFN1
|
bifunctional nuclease i |
| arTal_v1_Chr1_-_10356482_10356482 | 6.71 |
AT1G29640.1
|
AT1G29640
|
senescence regulator (Protein of unknown function, DUF584) |
| arTal_v1_Chr5_-_216773_216773 | 6.71 |
AT5G01550.1
|
LECRKA4.2
|
lectin receptor kinase a4.1 |
| arTal_v1_Chr1_+_27538190_27538190 | 6.61 |
AT1G73220.1
|
OCT1
|
organic cation/carnitine transporter1 |
| arTal_v1_Chr5_-_15859911_15859911 | 6.57 |
AT5G39610.1
|
NAC6
|
NAC domain containing protein 6 |
| arTal_v1_Chr5_-_4183354_4183354 | 6.55 |
AT5G13170.1
|
SAG29
|
senescence-associated gene 29 |
| arTal_v1_Chr4_+_12461907_12461907 | 6.52 |
AT4G24000.1
|
CSLG2
|
cellulose synthase like G2 |
| arTal_v1_Chr4_+_17597110_17597110 | 6.40 |
AT4G37430.1
|
CYP91A2
|
cytochrome P450, family 91, subfamily A, polypeptide 2 |
| arTal_v1_Chr2_-_18646606_18646606 | 6.35 |
AT2G45220.1
|
AT2G45220
|
Plant invertase/pectin methylesterase inhibitor superfamily |
| arTal_v1_Chr1_-_25662276_25662276 | 6.35 |
AT1G68450.1
|
PDE337
|
VQ motif-containing protein |
| arTal_v1_Chr2_+_6244772_6244772 | 6.29 |
AT2G14620.2
AT2G14620.3 AT2G14620.1 |
XTH10
|
xyloglucan endotransglucosylase/hydrolase 10 |
| arTal_v1_Chr5_+_18390942_18390942 | 6.28 |
AT5G45380.1
|
DUR3
|
urea-proton symporter DEGRADATION OF UREA 3 (DUR3) |
| arTal_v1_Chr3_-_1063103_1063234 | 6.19 |
AT3G04070.2
AT3G04070.1 |
NAC047
|
NAC domain containing protein 47 |
| arTal_v1_Chr3_+_10520443_10520502 | 6.16 |
AT3G28210.1
AT3G28210.2 |
PMZ
|
zinc finger (AN1-like) family protein |
| arTal_v1_Chr3_+_9892791_9892791 | 6.15 |
AT3G26840.1
|
PES2
|
Esterase/lipase/thioesterase family protein |
| arTal_v1_Chr5_-_23896702_23896702 | 6.13 |
AT5G59220.2
|
HAI1
|
PP2C protein (Clade A protein phosphatases type 2C) |
| arTal_v1_Chr5_-_6042938_6043014 | 6.07 |
AT5G18270.2
AT5G18270.1 |
ANAC087
|
NAC domain containing protein 87 |
| arTal_v1_Chr5_-_23896939_23896939 | 6.03 |
AT5G59220.1
|
HAI1
|
PP2C protein (Clade A protein phosphatases type 2C) |
| arTal_v1_Chr3_-_4762457_4762457 | 6.02 |
AT3G14280.1
|
AT3G14280
|
LL-diaminopimelate aminotransferase |
| arTal_v1_Chr4_+_10974456_10974510 | 6.02 |
AT4G20320.2
AT4G20320.4 AT4G20320.3 AT4G20320.1 AT4G20320.5 AT4G20320.6 |
AT4G20320
|
CTP synthase family protein |
| arTal_v1_Chr1_+_21652988_21652988 | 5.99 |
AT1G58340.1
|
ZF14
|
MATE efflux family protein |
| arTal_v1_Chr5_-_2176446_2176446 | 5.99 |
AT5G07010.1
|
ST2A
|
sulfotransferase 2A |
| arTal_v1_Chr2_-_11980003_11980003 | 5.99 |
AT2G28110.1
|
FRA8
|
Exostosin family protein |
| arTal_v1_Chr4_+_2224422_2224427 | 5.95 |
AT4G04460.2
AT4G04460.1 |
AT4G04460
|
Saposin-like aspartyl protease family protein |
| arTal_v1_Chr1_+_25426234_25426234 | 5.93 |
AT1G67810.1
|
SUFE2
|
sulfur E2 |
| arTal_v1_Chr1_-_29622445_29622447 | 5.93 |
AT1G78780.1
AT1G78780.2 AT1G78780.4 |
AT1G78780
|
pathogenesis-related family protein |
| arTal_v1_Chr4_-_15991536_15991633 | 5.90 |
AT4G33150.1
AT4G33150.2 |
AT4G33150
|
lysine-ketoglutarate reductase/saccharopine dehydrogenase bifunctional enzyme |
| arTal_v1_Chr3_+_6089381_6089381 | 5.87 |
AT3G17790.1
|
PAP17
|
purple acid phosphatase 17 |
| arTal_v1_Chr3_-_19564195_19564195 | 5.87 |
AT3G52780.2
|
PAP20
|
Purple acid phosphatases superfamily protein |
| arTal_v1_Chr5_+_579744_579852 | 5.85 |
AT5G02580.1
AT5G02580.3 AT5G02580.2 |
AT5G02580
|
argininosuccinate lyase |
| arTal_v1_Chr2_+_18558885_18558938 | 5.80 |
AT2G44990.2
AT2G44990.3 AT2G44990.1 |
CCD7
|
carotenoid cleavage dioxygenase 7 |
| arTal_v1_Chr3_+_4603885_4603885 | 5.79 |
AT3G13950.1
|
AT3G13950
|
ankyrin |
| arTal_v1_Chr3_-_19564350_19564350 | 5.78 |
AT3G52780.1
|
PAP20
|
Purple acid phosphatases superfamily protein |
| arTal_v1_Chr3_-_1055196_1055196 | 5.78 |
AT3G04060.1
|
NAC046
|
NAC domain containing protein 46 |
| arTal_v1_Chr2_+_17251819_17251819 | 5.71 |
AT2G41380.1
|
AT2G41380
|
S-adenosyl-L-methionine-dependent methyltransferases superfamily protein |
| arTal_v1_Chr2_-_19166949_19166967 | 5.71 |
AT2G46680.2
AT2G46680.1 |
HB-7
|
homeobox 7 |
| arTal_v1_Chr1_-_27475962_27475962 | 5.67 |
AT1G73040.1
|
AT1G73040
|
Mannose-binding lectin superfamily protein |
| arTal_v1_Chr5_-_14935885_14935885 | 5.66 |
AT5G37600.1
|
GSR 1
|
hypothetical protein |
| arTal_v1_Chr1_+_26122080_26122080 | 5.66 |
AT1G69490.1
|
NAP
|
NAC-like, activated by AP3/PI |
| arTal_v1_Chr2_-_1548999_1548999 | 5.66 |
AT2G04460.1
|
AT2G04460
|
|
| arTal_v1_Chr2_+_6213972_6213972 | 5.65 |
AT2G14560.2
AT2G14560.1 |
LURP1
|
LURP-one-like protein (DUF567) |
| arTal_v1_Chr2_+_7693596_7693596 | 5.64 |
AT2G17710.1
|
AT2G17710
|
Big1 |
| arTal_v1_Chr1_+_5389952_5389952 | 5.62 |
AT1G15670.1
|
AT1G15670
|
Galactose oxidase/kelch repeat superfamily protein |
| arTal_v1_Chr3_+_19239305_19239412 | 5.62 |
AT3G51860.1
AT3G51860.2 |
CAX3
|
cation exchanger 3 |
| arTal_v1_Chr5_-_9000345_9000345 | 5.60 |
AT5G25820.1
|
AT5G25820
|
Exostosin family protein |
| arTal_v1_Chr4_+_12463312_12463312 | 5.59 |
AT4G24000.2
|
CSLG2
|
cellulose synthase like G2 |
| arTal_v1_Chr2_-_19291632_19291632 | 5.58 |
AT2G46950.2
AT2G46950.1 |
CYP709B2
|
cytochrome P450, family 709, subfamily B, polypeptide 2 |
| arTal_v1_Chr5_+_25679425_25679432 | 5.57 |
AT5G64190.2
AT5G64190.1 |
AT5G64190
|
neuronal PAS domain protein |
| arTal_v1_Chr2_+_6213617_6213676 | 5.52 |
AT2G14560.3
AT2G14560.4 |
LURP1
|
LURP-one-like protein (DUF567) |
| arTal_v1_Chr3_+_11033665_11033665 | 5.47 |
AT3G29035.1
|
NAC3
|
NAC domain containing protein 3 |
| arTal_v1_Chr1_+_1469541_1469541 | 5.47 |
AT1G05100.1
|
MAPKKK18
|
mitogen-activated protein kinase kinase kinase 18 |
| arTal_v1_Chr3_-_23150606_23150606 | 5.45 |
AT3G62590.1
|
AT3G62590
|
alpha/beta-Hydrolases superfamily protein |
| arTal_v1_Chr2_-_12149072_12149072 | 5.38 |
AT2G28400.1
|
AT2G28400
|
senescence regulator (Protein of unknown function, DUF584) |
| arTal_v1_Chr5_+_21984569_21984569 | 5.36 |
AT5G54165.1
|
AT5G54165
|
Avr9/Cf-9 rapidly elicited protein |
| arTal_v1_Chr1_+_23072222_23072222 | 5.35 |
AT1G62370.1
|
AT1G62370
|
RING/U-box superfamily protein |
| arTal_v1_Chr1_-_27834207_27834207 | 5.31 |
AT1G74010.1
|
AT1G74010
|
Calcium-dependent phosphotriesterase superfamily protein |
| arTal_v1_Chr2_+_12871984_12872134 | 5.29 |
AT2G30140.1
AT2G30140.2 |
UGT87A2
|
UDP-Glycosyltransferase superfamily protein |
| arTal_v1_Chr4_-_15988441_15988441 | 5.26 |
AT4G33150.3
|
AT4G33150
|
lysine-ketoglutarate reductase/saccharopine dehydrogenase bifunctional enzyme |
| arTal_v1_Chr4_-_6718550_6718550 | 5.25 |
AT4G10960.1
|
UGE5
|
UDP-D-glucose/UDP-D-galactose 4-epimerase 5 |
| arTal_v1_Chr1_+_29298243_29298243 | 5.23 |
AT1G77920.1
|
TGA7
|
bZIP transcription factor family protein |
| arTal_v1_Chr2_-_12627891_12627891 | 5.22 |
AT2G29460.1
|
GSTU4
|
glutathione S-transferase tau 4 |
| arTal_v1_Chr1_-_8711578_8711578 | 5.22 |
AT1G24575.1
|
AT1G24575
|
DEAD-box ATP-dependent RNA helicase-like protein |
| arTal_v1_Chr2_-_15599951_15599951 | 5.21 |
AT2G37130.2
|
AT2G37130
|
Peroxidase superfamily protein |
| arTal_v1_Chr4_-_9393650_9393650 | 5.17 |
AT4G16690.1
|
MES16
|
methyl esterase 16 |
| arTal_v1_Chr4_-_12006209_12006209 | 5.16 |
AT4G22880.2
AT4G22880.1 AT4G22880.3 |
LDOX
|
leucoanthocyanidin dioxygenase |
| arTal_v1_Chr4_-_15991202_15991202 | 5.15 |
AT4G33150.4
|
AT4G33150
|
lysine-ketoglutarate reductase/saccharopine dehydrogenase bifunctional enzyme |
| arTal_v1_Chr1_+_24763941_24763941 | 5.14 |
AT1G66390.1
|
MYB90
|
myb domain protein 90 |
| arTal_v1_Chr2_-_15600154_15600154 | 5.13 |
AT2G37130.1
|
AT2G37130
|
Peroxidase superfamily protein |
| arTal_v1_Chr1_-_26338818_26338818 | 5.12 |
AT1G69930.1
|
GSTU11
|
glutathione S-transferase TAU 11 |
| arTal_v1_Chr3_-_4079627_4079627 | 5.12 |
AT3G12830.1
|
AT3G12830
|
SAUR-like auxin-responsive protein family |
| arTal_v1_Chr4_-_7406994_7406994 | 5.07 |
AT4G12480.1
|
EARLI1
|
Bifunctional inhibitor/lipid-transfer protein/seed storage 2S albumin superfamily protein |
| arTal_v1_Chr5_-_5424615_5424749 | 5.03 |
AT5G16570.2
AT5G16570.1 |
GLN1%3B4
|
glutamine synthetase 1;4 |
| arTal_v1_Chr5_+_21853348_21853348 | 5.03 |
AT5G53820.1
|
AT5G53820
|
Late embryogenesis abundant protein (LEA) family protein |
| arTal_v1_Chr3_+_18207651_18207651 | 5.02 |
AT3G49120.1
|
PRXCB
|
peroxidase CB |
| arTal_v1_Chr5_-_2079005_2079005 | 4.97 |
AT5G06720.1
|
PA2
|
peroxidase 2 |
| arTal_v1_Chr2_-_19315241_19315343 | 4.96 |
AT2G47000.7
AT2G47000.1 AT2G47000.2 AT2G47000.4 AT2G47000.3 |
ABCB4
|
ATP binding cassette subfamily B4 |
| arTal_v1_Chr5_+_19620267_19620267 | 4.96 |
AT5G48410.4
AT5G48410.3 AT5G48410.2 AT5G48410.1 |
GLR1.3
|
glutamate receptor 1.3 |
| arTal_v1_Chr4_-_15941493_15941493 | 4.94 |
AT4G33040.1
|
AT4G33040
|
Thioredoxin superfamily protein |
| arTal_v1_Chr3_+_1635194_1635194 | 4.92 |
AT3G05630.1
|
PLDP2
|
phospholipase D P2 |
| arTal_v1_Chr1_+_2867203_2867271 | 4.90 |
AT1G08920.1
AT1G08920.2 AT1G08920.3 |
ESL1
|
ERD (early response to dehydration) six-like 1 |
| arTal_v1_Chr3_-_11194897_11194993 | 4.89 |
AT3G29250.2
AT3G29250.1 |
SDR4
|
NAD(P)-binding Rossmann-fold superfamily protein |
| arTal_v1_Chr5_-_763322_763322 | 4.89 |
AT5G03210.1
|
DIP2
|
E3 ubiquitin-protein ligase |
| arTal_v1_Chr2_-_275002_275002 | 4.87 |
AT2G01610.1
|
AT2G01610
|
Plant invertase/pectin methylesterase inhibitor superfamily protein |
| arTal_v1_Chr5_-_9247540_9247540 | 4.87 |
AT5G26340.1
|
MSS1
|
Major facilitator superfamily protein |
| arTal_v1_Chr1_+_23168767_23168767 | 4.86 |
AT1G62570.1
|
FMO GS-OX4
|
flavin-monooxygenase glucosinolate S-oxygenase 4 |
| arTal_v1_Chr3_-_1660380_1660429 | 4.83 |
AT3G05675.3
AT3G05675.2 AT3G05675.1 |
AT3G05675
|
BTB/POZ domain-containing protein |
| arTal_v1_Chr4_+_7304323_7304323 | 4.82 |
AT4G12290.2
|
AT4G12290
|
Copper amine oxidase family protein |
| arTal_v1_Chr5_+_15501126_15501184 | 4.80 |
AT5G38710.1
AT5G38710.2 |
AT5G38710
|
Methylenetetrahydrofolate reductase family protein |
| arTal_v1_Chr1_-_28318362_28318375 | 4.79 |
AT1G75450.1
AT1G75450.2 |
CKX5
|
cytokinin oxidase 5 |
| arTal_v1_Chr4_+_7303985_7303985 | 4.79 |
AT4G12290.1
|
AT4G12290
|
Copper amine oxidase family protein |
| arTal_v1_Chr1_-_12398418_12398418 | 4.78 |
AT1G34060.1
|
AT1G34060
|
Pyridoxal phosphate (PLP)-dependent transferases superfamily protein |
| arTal_v1_Chr1_+_28291698_28291698 | 4.78 |
AT1G75390.1
AT1G75390.2 |
bZIP44
|
basic leucine-zipper 44 |
| arTal_v1_Chr2_+_14685170_14685170 | 4.78 |
AT2G34810.1
|
AT2G34810
|
FAD-binding Berberine family protein |
| arTal_v1_Chr5_-_3405571_3405571 | 4.77 |
AT5G10770.1
|
AT5G10770
|
Eukaryotic aspartyl protease family protein |
| arTal_v1_Chr3_+_995217_995217 | 4.76 |
AT3G03870.1
|
AT3G03870
|
transmembrane protein |
| arTal_v1_Chr3_-_7818985_7818985 | 4.76 |
AT3G22160.1
|
AT3G22160
|
VQ motif-containing protein |
| arTal_v1_Chr1_+_7434235_7434272 | 4.76 |
AT1G21240.1
AT1G21240.2 |
WAK3
|
wall associated kinase 3 |
| arTal_v1_Chr3_+_995062_995062 | 4.75 |
AT3G03870.2
|
AT3G03870
|
transmembrane protein |
| arTal_v1_Chr5_+_5710910_5710910 | 4.75 |
AT5G17330.1
|
GAD
|
glutamate decarboxylase |
| arTal_v1_Chr2_+_14783254_14783254 | 4.69 |
AT2G35070.1
AT2G35070.2 |
AT2G35070
|
transmembrane protein |
| arTal_v1_Chr5_-_23281271_23281271 | 4.67 |
AT5G57480.1
|
AT5G57480
|
P-loop containing nucleoside triphosphate hydrolases superfamily protein |
| arTal_v1_Chr4_-_11588373_11588373 | 4.66 |
AT4G21840.1
|
MSRB8
|
methionine sulfoxide reductase B8 |
| arTal_v1_Chr1_-_3323735_3323735 | 4.66 |
AT1G10140.1
|
AT1G10140
|
Uncharacterized conserved protein UCP031279 |
| arTal_v1_Chr3_-_6788424_6788424 | 4.63 |
AT3G19550.1
|
AT3G19550
|
glutamate racemase |
| arTal_v1_Chr2_-_17882636_17882636 | 4.63 |
AT2G43000.1
AT2G43000.2 |
NAC042
|
NAC domain containing protein 42 |
| arTal_v1_Chr1_-_19789029_19789150 | 4.63 |
AT1G53100.2
AT1G53100.1 |
AT1G53100
|
Core-2/I-branching beta-1,6-N-acetylglucosaminyltransferase family protein |
| arTal_v1_Chr2_+_16460247_16460247 | 4.61 |
AT2G39420.1
|
AT2G39420
|
alpha/beta-Hydrolases superfamily protein |
| arTal_v1_Chr4_-_12345652_12345652 | 4.60 |
AT4G23700.2
|
CHX17
|
cation/H+ exchanger 17 |
| arTal_v1_Chr2_-_9858778_9858778 | 4.60 |
AT2G23150.1
|
NRAMP3
|
natural resistance-associated macrophage protein 3 |
| arTal_v1_Chr3_+_21380648_21380648 | 4.59 |
AT3G57680.1
AT3G57680.2 |
AT3G57680
|
Peptidase S41 family protein |
| arTal_v1_Chr4_+_994726_994726 | 4.59 |
AT4G02280.1
|
SUS3
|
sucrose synthase 3 |
| arTal_v1_Chr4_-_15903523_15903523 | 4.58 |
AT4G32940.1
|
GAMMA-VPE
|
gamma vacuolar processing enzyme |
| arTal_v1_Chr1_-_9848015_9848015 | 4.58 |
AT1G28190.1
|
AT1G28190
|
hypothetical protein |
| arTal_v1_Chr5_-_9716418_9716418 | 4.57 |
AT5G27520.1
|
PNC2
|
peroxisomal adenine nucleotide carrier 2 |
| arTal_v1_Chr4_-_7410406_7410406 | 4.55 |
AT4G12490.1
|
AT4G12490
|
Bifunctional inhibitor/lipid-transfer protein/seed storage 2S albumin superfamily protein |
| arTal_v1_Chr5_+_26772644_26772644 | 4.54 |
AT5G67080.1
|
MAPKKK19
|
mitogen-activated protein kinase kinase kinase 19 |
| arTal_v1_Chr3_+_4346330_4346330 | 4.54 |
AT3G13380.1
|
BRL3
|
BRI1-like 3 |
| arTal_v1_Chr1_-_5338326_5338326 | 4.52 |
AT1G15520.1
AT1G15520.2 |
ABCG40
|
pleiotropic drug resistance 12 |
| arTal_v1_Chr5_-_5904380_5904380 | 4.52 |
AT5G17860.2
|
CAX7
|
calcium exchanger 7 |
| arTal_v1_Chr3_+_18465318_18465318 | 4.51 |
AT3G49780.1
|
PSK4
|
phytosulfokine 4 precursor |
| arTal_v1_Chr1_+_26938369_26938369 | 4.51 |
AT1G71520.1
|
AT1G71520
|
Integrase-type DNA-binding superfamily protein |
| arTal_v1_Chr2_+_11263889_11263889 | 4.51 |
AT2G26480.1
|
UGT76D1
|
UDP-glucosyl transferase 76D1 |
| arTal_v1_Chr3_-_9595283_9595283 | 4.50 |
AT3G26210.1
|
CYP71B23
|
cytochrome P450, family 71, subfamily B, polypeptide 23 |
| arTal_v1_Chr1_-_12397986_12397986 | 4.50 |
AT1G34060.2
|
AT1G34060
|
Pyridoxal phosphate (PLP)-dependent transferases superfamily protein |
| arTal_v1_Chr1_-_23019494_23019494 | 4.50 |
AT1G62300.1
|
WRKY6
|
WRKY family transcription factor |
| arTal_v1_Chr4_-_12346051_12346051 | 4.49 |
AT4G23700.1
|
CHX17
|
cation/H+ exchanger 17 |
| arTal_v1_Chr3_-_19699392_19699392 | 4.49 |
AT3G53150.1
|
UGT73D1
|
UDP-glucosyl transferase 73D1 |
| arTal_v1_Chr3_-_1956397_1956397 | 4.48 |
AT3G06420.1
|
ATG8H
|
Ubiquitin-like superfamily protein |
| arTal_v1_Chr5_-_5904532_5904532 | 4.48 |
AT5G17860.1
|
CAX7
|
calcium exchanger 7 |
| arTal_v1_Chr4_+_18023121_18023121 | 4.47 |
AT4G38540.1
|
AT4G38540
|
FAD/NAD(P)-binding oxidoreductase family protein |
| arTal_v1_Chr3_+_17624340_17624340 | 4.46 |
AT3G47780.1
|
ABCA7
|
ABC2 homolog 6 |
| arTal_v1_Chr4_+_10818128_10818128 | 4.45 |
AT4G19970.1
|
AT4G19970
|
nucleotide-diphospho-sugar transferase family protein |
| arTal_v1_Chr1_-_28991385_28991454 | 4.44 |
AT1G77145.2
AT1G77145.1 |
AT1G77145
|
transmembrane protein, putative (DUF506) |
| arTal_v1_Chr1_+_6100964_6101015 | 4.44 |
AT1G17745.1
AT1G17745.2 |
PGDH
|
D-3-phosphoglycerate dehydrogenase |
| arTal_v1_Chr5_+_9038860_9038860 | 4.44 |
AT5G25910.1
|
RLP52
|
receptor like protein 52 |
| arTal_v1_Chr1_+_3288087_3288087 | 4.43 |
AT1G10070.3
AT1G10070.2 AT1G10070.1 |
BCAT-2
|
branched-chain amino acid transaminase 2 |
| arTal_v1_Chr4_+_7148124_7148386 | 4.43 |
AT4G11890.3
AT4G11890.1 AT4G11890.4 |
ARCK1
|
Protein kinase superfamily protein |
| arTal_v1_Chr3_-_21293158_21293171 | 4.41 |
AT3G57520.2
AT3G57520.3 AT3G57520.1 |
SIP2
|
seed imbibition 2 |
| arTal_v1_Chr5_+_1153740_1153740 | 4.41 |
AT5G04200.1
|
MC9
|
metacaspase 9 |
| arTal_v1_Chr5_+_21910471_21910471 | 4.40 |
AT5G53970.1
|
TAT7
|
Tyrosine transaminase family protein |
| arTal_v1_Chr1_-_20849054_20849054 | 4.39 |
AT1G55760.1
|
AT1G55760
|
BTB/POZ domain-containing protein |
| arTal_v1_Chr1_+_9825169_9825169 | 4.37 |
AT1G28130.1
|
GH3.17
|
Auxin-responsive GH3 family protein |
| arTal_v1_Chr3_-_23298534_23298534 | 4.35 |
AT3G63050.1
|
AT3G63050
|
hypothetical protein |
| arTal_v1_Chr2_+_15834766_15834883 | 4.34 |
AT2G37770.2
AT2G37770.1 |
ChlAKR
|
NAD(P)-linked oxidoreductase superfamily protein |
| arTal_v1_Chr3_+_6093990_6093990 | 4.33 |
AT3G17810.1
|
PYD1
|
pyrimidine 1 |
| arTal_v1_Chr3_-_8036005_8036005 | 4.33 |
AT3G22740.1
|
HMT3
|
homocysteine S-methyltransferase 3 |
| arTal_v1_Chr5_-_763480_763480 | 4.32 |
AT5G03210.2
|
DIP2
|
E3 ubiquitin-protein ligase |
| arTal_v1_Chr3_-_10047453_10047453 | 4.30 |
AT3G27210.1
|
AT3G27210
|
hypothetical protein |
| arTal_v1_Chr5_+_4461554_4461554 | 4.29 |
AT5G13820.2
|
TBP1
|
telomeric DNA binding protein 1 |
| arTal_v1_Chr5_+_8202919_8203003 | 4.28 |
AT5G24200.1
AT5G24200.2 AT5G24200.3 |
AT5G24200
|
alpha/beta-Hydrolases superfamily protein |
| arTal_v1_Chr5_+_206432_206432 | 4.28 |
AT5G01520.2
AT5G01520.1 |
AIRP2
|
RING/U-box superfamily protein |
| arTal_v1_Chr5_-_15575437_15575437 | 4.27 |
AT5G38900.2
|
AT5G38900
|
Thioredoxin superfamily protein |
| arTal_v1_Chr1_+_9825914_9825914 | 4.27 |
AT1G28130.2
|
GH3.17
|
Auxin-responsive GH3 family protein |
| arTal_v1_Chr3_+_22716238_22716349 | 4.27 |
AT3G61390.1
AT3G61390.2 AT3G61390.3 AT3G61390.4 AT3G61390.5 |
AT3G61390
|
RING/U-box superfamily protein |
| arTal_v1_Chr3_-_4654046_4654046 | 4.26 |
AT3G14050.1
|
RSH2
|
RELA/SPOT homolog 2 |
| arTal_v1_Chr1_-_2282828_2282828 | 4.26 |
AT1G07430.1
|
HAI2
|
highly ABA-induced PP2C protein 2 |
| arTal_v1_Chr3_+_25355_25507 | 4.25 |
AT3G01080.2
AT3G01080.3 AT3G01080.1 |
WRKY58
|
WRKY DNA-binding protein 58 |
| arTal_v1_Chr3_+_296024_296051 | 4.25 |
AT3G01830.2
AT3G01830.1 |
AT3G01830
|
Calcium-binding EF-hand family protein |
| arTal_v1_Chr5_-_4454703_4454813 | 4.22 |
AT5G13800.4
AT5G13800.3 AT5G13800.1 AT5G13800.2 |
PPH
|
pheophytinase |
| arTal_v1_Chr4_-_8123835_8123835 | 4.22 |
AT4G14090.1
|
AT4G14090
|
UDP-Glycosyltransferase superfamily protein |
| arTal_v1_Chr1_-_29914967_29914967 | 4.21 |
AT1G79520.1
AT1G79520.4 AT1G79520.3 |
AT1G79520
|
Cation efflux family protein |
| arTal_v1_Chr2_+_13677986_13677986 | 4.21 |
AT2G32210.3
AT2G32210.2 AT2G32210.1 |
AT2G32210
|
cysteine-rich/transmembrane domain A-like protein |
| arTal_v1_Chr5_+_2355759_2355759 | 4.20 |
AT5G07440.2
AT5G07440.1 |
GDH2
|
glutamate dehydrogenase 2 |
| arTal_v1_Chr4_+_131422_131422 | 4.19 |
AT4G00305.1
|
AT4G00305
|
RING/U-box superfamily protein |
| arTal_v1_Chr3_-_2651101_2651231 | 4.19 |
AT3G08720.4
AT3G08720.3 AT3G08720.2 AT3G08720.1 |
S6K2
|
serine/threonine protein kinase 2 |
| arTal_v1_Chr3_+_815550_815550 | 4.18 |
AT3G03440.1
|
AT3G03440
|
ARM repeat superfamily protein |
| arTal_v1_Chr2_-_7910040_7910040 | 4.18 |
AT2G18170.1
|
MPK7
|
MAP kinase 7 |
| arTal_v1_Chr5_-_16943820_16943820 | 4.18 |
AT5G42380.1
|
CML37
|
calmodulin like 37 |
| arTal_v1_Chr1_+_3945584_3945584 | 4.17 |
AT1G11700.1
|
AT1G11700
|
senescence regulator (Protein of unknown function, DUF584) |
| arTal_v1_Chr5_-_18721744_18721744 | 4.17 |
AT5G46180.1
|
DELTA-OAT
|
ornithine-delta-aminotransferase |
| arTal_v1_Chr1_-_24558322_24558322 | 4.16 |
AT1G65970.1
|
TPX2
|
thioredoxin-dependent peroxidase 2 |
| arTal_v1_Chr1_-_1257893_1257893 | 4.15 |
AT1G04580.1
|
AO4
|
aldehyde oxidase 4 |
| arTal_v1_Chr1_+_20617313_20617313 | 4.15 |
AT1G55265.1
|
AT1G55265
|
DUF538 family protein, putative (Protein of unknown function, DUF538) |
| arTal_v1_Chr1_+_6508797_6508797 | 4.15 |
AT1G18860.1
|
WRKY61
|
WRKY DNA-binding protein 61 |
| arTal_v1_Chr5_-_15575712_15575712 | 4.13 |
AT5G38900.1
|
AT5G38900
|
Thioredoxin superfamily protein |
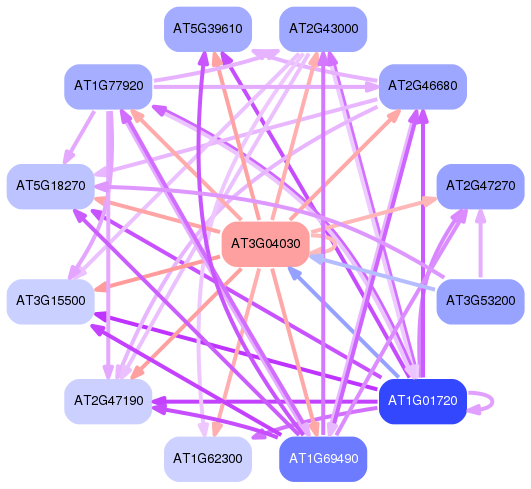
Network of associatons between targets according to the STRING database.

First level regulatory network of AT3G04030
Gene Ontology Analysis
Gene overrepresentation in biological process category:
| Log-likelihood per target | Total log-likelihood | Term | Description |
|---|---|---|---|
| 4.4 | 13.3 | GO:0016110 | tetraterpenoid catabolic process(GO:0016110) carotenoid catabolic process(GO:0016118) xanthophyll catabolic process(GO:0016124) |
| 4.4 | 21.8 | GO:0051091 | positive regulation of sequence-specific DNA binding transcription factor activity(GO:0051091) |
| 3.8 | 22.7 | GO:0080187 | floral organ senescence(GO:0080187) |
| 3.0 | 12.1 | GO:1902457 | negative regulation of stomatal opening(GO:1902457) |
| 3.0 | 17.8 | GO:0009413 | response to flooding(GO:0009413) |
| 2.9 | 8.6 | GO:0015696 | ammonium transport(GO:0015696) |
| 2.6 | 10.3 | GO:0072502 | cellular phosphate ion homeostasis(GO:0030643) cellular trivalent inorganic anion homeostasis(GO:0072502) |
| 2.5 | 10.2 | GO:0010351 | lithium ion transport(GO:0010351) |
| 2.4 | 7.1 | GO:0019859 | thymine catabolic process(GO:0006210) thymine metabolic process(GO:0019859) |
| 2.3 | 9.1 | GO:0015697 | quaternary ammonium group transport(GO:0015697) |
| 2.3 | 9.1 | GO:0015692 | lead ion transport(GO:0015692) |
| 2.1 | 6.4 | GO:0080040 | positive regulation of cellular response to phosphate starvation(GO:0080040) |
| 2.1 | 8.6 | GO:0006527 | arginine catabolic process(GO:0006527) |
| 2.1 | 8.5 | GO:0097438 | release of seed from dormancy(GO:0048838) exit from dormancy(GO:0097438) |
| 2.1 | 6.2 | GO:0030030 | cell projection organization(GO:0030030) cell projection assembly(GO:0030031) |
| 2.0 | 2.0 | GO:0030641 | regulation of cellular pH(GO:0030641) regulation of intracellular pH(GO:0051453) |
| 2.0 | 6.0 | GO:1902289 | negative regulation of defense response to oomycetes(GO:1902289) |
| 2.0 | 10.0 | GO:0060919 | auxin influx(GO:0060919) |
| 1.9 | 9.4 | GO:1902418 | (+)-abscisic acid D-glucopyranosyl ester transmembrane transport(GO:1902418) |
| 1.8 | 9.1 | GO:1901404 | regulation of chlorophyll catabolic process(GO:0010271) regulation of tetrapyrrole catabolic process(GO:1901404) |
| 1.7 | 7.0 | GO:0019567 | pentose biosynthetic process(GO:0019322) arabinose biosynthetic process(GO:0019567) |
| 1.7 | 1.7 | GO:0016241 | regulation of macroautophagy(GO:0016241) regulation of autophagosome assembly(GO:2000785) |
| 1.7 | 5.2 | GO:0015802 | basic amino acid transport(GO:0015802) |
| 1.5 | 7.7 | GO:0015824 | proline transport(GO:0015824) |
| 1.5 | 4.5 | GO:0033530 | raffinose metabolic process(GO:0033530) |
| 1.5 | 12.1 | GO:0006570 | tyrosine metabolic process(GO:0006570) |
| 1.5 | 4.5 | GO:2000693 | positive regulation of seed maturation(GO:2000693) |
| 1.5 | 11.9 | GO:0030149 | sphingolipid catabolic process(GO:0030149) |
| 1.5 | 5.9 | GO:0010618 | aerenchyma formation(GO:0010618) |
| 1.4 | 4.3 | GO:0048832 | specification of organ number(GO:0048832) specification of floral organ number(GO:0048833) |
| 1.4 | 4.3 | GO:0019482 | beta-alanine metabolic process(GO:0019482) |
| 1.4 | 1.4 | GO:0010148 | transpiration(GO:0010148) |
| 1.4 | 4.3 | GO:0009107 | lipoate biosynthetic process(GO:0009107) |
| 1.4 | 4.3 | GO:0002215 | defense response to nematode(GO:0002215) |
| 1.4 | 7.1 | GO:1900367 | positive regulation of defense response to insect(GO:1900367) |
| 1.4 | 5.6 | GO:0033512 | lysine catabolic process(GO:0006554) L-lysine catabolic process to acetyl-CoA(GO:0019474) L-lysine catabolic process(GO:0019477) L-lysine catabolic process to acetyl-CoA via saccharopine(GO:0033512) L-lysine metabolic process(GO:0046440) |
| 1.4 | 22.1 | GO:0019375 | galactolipid biosynthetic process(GO:0019375) |
| 1.4 | 5.5 | GO:0051176 | positive regulation of sulfur metabolic process(GO:0051176) |
| 1.3 | 4.0 | GO:0015812 | gamma-aminobutyric acid transport(GO:0015812) |
| 1.3 | 5.3 | GO:0043433 | negative regulation of sequence-specific DNA binding transcription factor activity(GO:0043433) |
| 1.3 | 5.3 | GO:0016099 | monoterpenoid metabolic process(GO:0016098) monoterpenoid biosynthetic process(GO:0016099) |
| 1.3 | 12.0 | GO:0010230 | alternative respiration(GO:0010230) |
| 1.3 | 5.3 | GO:0009727 | detection of ethylene stimulus(GO:0009727) |
| 1.3 | 9.1 | GO:1901332 | negative regulation of lateral root development(GO:1901332) |
| 1.3 | 7.8 | GO:0006624 | vacuolar protein processing(GO:0006624) |
| 1.3 | 5.2 | GO:0010507 | negative regulation of autophagy(GO:0010507) |
| 1.3 | 7.7 | GO:0006145 | purine nucleobase catabolic process(GO:0006145) |
| 1.3 | 5.1 | GO:0034720 | histone H3-K4 demethylation(GO:0034720) |
| 1.3 | 3.8 | GO:0033477 | S-methylmethionine metabolic process(GO:0033477) S-methylmethionine cycle(GO:0033528) |
| 1.3 | 1.3 | GO:0032491 | detection of molecule of fungal origin(GO:0032491) |
| 1.2 | 11.0 | GO:0051410 | detoxification of nitrogen compound(GO:0051410) |
| 1.2 | 1.2 | GO:0051090 | regulation of sequence-specific DNA binding transcription factor activity(GO:0051090) |
| 1.2 | 7.2 | GO:0010581 | regulation of starch biosynthetic process(GO:0010581) |
| 1.2 | 3.6 | GO:0009830 | cell wall modification involved in abscission(GO:0009830) cell wall disassembly(GO:0044277) |
| 1.2 | 3.5 | GO:0090213 | regulation of radial pattern formation(GO:0090213) |
| 1.2 | 4.7 | GO:0071836 | nectar secretion(GO:0071836) |
| 1.2 | 3.5 | GO:0009945 | radial axis specification(GO:0009945) |
| 1.2 | 17.6 | GO:0006538 | glutamate catabolic process(GO:0006538) |
| 1.2 | 1.2 | GO:0016578 | histone deubiquitination(GO:0016578) |
| 1.1 | 4.6 | GO:0010042 | response to manganese ion(GO:0010042) |
| 1.1 | 3.4 | GO:0043290 | sesquiterpenoid catabolic process(GO:0016107) apocarotenoid catabolic process(GO:0043290) abscisic acid catabolic process(GO:0046345) |
| 1.1 | 7.9 | GO:0090059 | protoxylem development(GO:0090059) |
| 1.1 | 4.5 | GO:0080029 | cellular response to boron-containing substance levels(GO:0080029) |
| 1.1 | 3.4 | GO:0045002 | DNA double-strand break processing involved in repair via single-strand annealing(GO:0010792) double-strand break repair via single-strand annealing(GO:0045002) |
| 1.1 | 9.9 | GO:0045836 | positive regulation of meiotic nuclear division(GO:0045836) |
| 1.1 | 3.3 | GO:0009446 | putrescine metabolic process(GO:0009445) putrescine biosynthetic process(GO:0009446) putrescine biosynthetic process from arginine(GO:0033388) |
| 1.1 | 11.0 | GO:0050691 | regulation of defense response to virus by host(GO:0050691) |
| 1.1 | 2.2 | GO:0035865 | cellular response to potassium ion(GO:0035865) |
| 1.1 | 4.2 | GO:0033306 | phytol metabolic process(GO:0033306) |
| 1.1 | 6.3 | GO:0070536 | protein K63-linked deubiquitination(GO:0070536) |
| 1.0 | 5.2 | GO:1902065 | response to L-glutamate(GO:1902065) |
| 1.0 | 7.2 | GO:0046482 | para-aminobenzoic acid metabolic process(GO:0046482) |
| 1.0 | 11.4 | GO:0046337 | phosphatidylethanolamine biosynthetic process(GO:0006646) phosphatidylethanolamine metabolic process(GO:0046337) |
| 1.0 | 5.2 | GO:0070861 | regulation of protein exit from endoplasmic reticulum(GO:0070861) positive regulation of protein exit from endoplasmic reticulum(GO:0070863) |
| 1.0 | 4.1 | GO:0035494 | SNARE complex disassembly(GO:0035494) |
| 1.0 | 5.1 | GO:0060151 | peroxisome localization(GO:0060151) |
| 1.0 | 3.0 | GO:0009219 | pyrimidine deoxyribonucleoside triphosphate metabolic process(GO:0009211) pyrimidine deoxyribonucleotide metabolic process(GO:0009219) pyrimidine deoxyribonucleotide biosynthetic process(GO:0009221) 2'-deoxyribonucleotide biosynthetic process(GO:0009265) deoxyribose phosphate biosynthetic process(GO:0046385) |
| 1.0 | 3.0 | GO:0006148 | inosine catabolic process(GO:0006148) inosine metabolic process(GO:0046102) |
| 1.0 | 6.0 | GO:0043090 | amino acid import(GO:0043090) |
| 1.0 | 3.0 | GO:0071596 | ubiquitin-dependent protein catabolic process via the N-end rule pathway(GO:0071596) |
| 1.0 | 19.7 | GO:0002238 | response to molecule of fungal origin(GO:0002238) |
| 1.0 | 1.0 | GO:0071280 | cellular response to copper ion(GO:0071280) |
| 1.0 | 1.9 | GO:0090548 | response to nitrate starvation(GO:0090548) |
| 0.9 | 15.2 | GO:0010555 | response to mannitol(GO:0010555) |
| 0.9 | 3.8 | GO:0046373 | L-arabinose metabolic process(GO:0046373) |
| 0.9 | 6.6 | GO:0006542 | glutamine biosynthetic process(GO:0006542) |
| 0.9 | 8.4 | GO:0010120 | camalexin biosynthetic process(GO:0010120) camalexin metabolic process(GO:0052317) |
| 0.9 | 2.8 | GO:0006984 | ER-nucleus signaling pathway(GO:0006984) |
| 0.9 | 4.6 | GO:0006116 | NADH oxidation(GO:0006116) |
| 0.9 | 1.8 | GO:0009065 | glutamine family amino acid catabolic process(GO:0009065) |
| 0.9 | 4.6 | GO:0080024 | indolebutyric acid metabolic process(GO:0080024) |
| 0.9 | 6.3 | GO:0080148 | negative regulation of response to water deprivation(GO:0080148) |
| 0.9 | 7.1 | GO:0006089 | lactate metabolic process(GO:0006089) methylglyoxal metabolic process(GO:0009438) methylglyoxal catabolic process to D-lactate via S-lactoyl-glutathione(GO:0019243) ketone catabolic process(GO:0042182) methylglyoxal catabolic process(GO:0051596) methylglyoxal catabolic process to lactate(GO:0061727) |
| 0.9 | 2.7 | GO:0046475 | glycerophospholipid catabolic process(GO:0046475) |
| 0.9 | 2.6 | GO:0060967 | negative regulation of gene silencing by RNA(GO:0060967) negative regulation of RNA interference(GO:1900369) |
| 0.9 | 4.4 | GO:0060866 | leaf abscission(GO:0060866) |
| 0.9 | 1.7 | GO:1901334 | lactone metabolic process(GO:1901334) lactone biosynthetic process(GO:1901336) strigolactone metabolic process(GO:1901600) strigolactone biosynthetic process(GO:1901601) |
| 0.9 | 2.6 | GO:0090224 | regulation of mitotic spindle organization(GO:0060236) regulation of spindle organization(GO:0090224) |
| 0.9 | 4.3 | GO:0006103 | 2-oxoglutarate metabolic process(GO:0006103) aspartate metabolic process(GO:0006531) |
| 0.9 | 2.6 | GO:0071422 | thiosulfate transport(GO:0015709) succinate transmembrane transport(GO:0071422) |
| 0.9 | 13.6 | GO:0009697 | salicylic acid biosynthetic process(GO:0009697) |
| 0.8 | 5.0 | GO:0071169 | establishment of mitotic sister chromatid cohesion(GO:0034087) establishment of protein localization to chromosome(GO:0070199) rDNA condensation(GO:0070550) establishment of protein localization to chromatin(GO:0071169) transcriptional activation by promoter-enhancer looping(GO:0071733) gene looping(GO:0090202) dsDNA loop formation(GO:0090579) |
| 0.8 | 2.5 | GO:0000973 | posttranscriptional tethering of RNA polymerase II gene DNA at nuclear periphery(GO:0000973) |
| 0.8 | 2.5 | GO:0010269 | response to selenium ion(GO:0010269) |
| 0.8 | 10.7 | GO:0042753 | positive regulation of circadian rhythm(GO:0042753) |
| 0.8 | 4.1 | GO:0046208 | spermine catabolic process(GO:0046208) |
| 0.8 | 5.7 | GO:0046473 | phosphatidic acid metabolic process(GO:0046473) |
| 0.8 | 4.9 | GO:0019509 | L-methionine biosynthetic process from methylthioadenosine(GO:0019509) amino acid salvage(GO:0043102) L-methionine salvage(GO:0071267) |
| 0.8 | 0.8 | GO:0008272 | sulfate transport(GO:0008272) |
| 0.8 | 6.4 | GO:0031222 | arabinan catabolic process(GO:0031222) |
| 0.8 | 4.0 | GO:0010336 | gibberellic acid homeostasis(GO:0010336) |
| 0.8 | 2.4 | GO:2000058 | protein ubiquitination involved in ubiquitin-dependent protein catabolic process(GO:0042787) regulation of protein ubiquitination involved in ubiquitin-dependent protein catabolic process(GO:2000058) |
| 0.8 | 4.0 | GO:0006809 | nitric oxide biosynthetic process(GO:0006809) |
| 0.8 | 3.2 | GO:0055073 | cadmium ion homeostasis(GO:0055073) |
| 0.8 | 5.6 | GO:0000184 | nuclear-transcribed mRNA catabolic process, nonsense-mediated decay(GO:0000184) |
| 0.8 | 7.2 | GO:0006308 | DNA catabolic process(GO:0006308) |
| 0.8 | 11.1 | GO:0080113 | regulation of seed growth(GO:0080113) |
| 0.8 | 2.3 | GO:0015784 | GDP-fucose transport(GO:0015783) GDP-mannose transport(GO:0015784) purine nucleotide-sugar transmembrane transport(GO:0090480) GDP-mannose transmembrane transport(GO:1990570) |
| 0.8 | 3.1 | GO:0050792 | regulation of viral process(GO:0050792) |
| 0.8 | 7.6 | GO:0031204 | posttranslational protein targeting to membrane, translocation(GO:0031204) |
| 0.8 | 3.0 | GO:0060628 | regulation of ER to Golgi vesicle-mediated transport(GO:0060628) |
| 0.8 | 2.3 | GO:0071569 | protein ufmylation(GO:0071569) |
| 0.8 | 2.3 | GO:0010024 | phytochromobilin biosynthetic process(GO:0010024) phytochromobilin metabolic process(GO:0051202) |
| 0.8 | 6.1 | GO:0007205 | protein kinase C-activating G-protein coupled receptor signaling pathway(GO:0007205) |
| 0.8 | 3.8 | GO:0030242 | pexophagy(GO:0030242) |
| 0.8 | 2.3 | GO:0009915 | phloem sucrose loading(GO:0009915) |
| 0.7 | 3.7 | GO:0072334 | UDP-galactose transport(GO:0015785) UDP-galactose transmembrane transport(GO:0072334) |
| 0.7 | 0.7 | GO:0046620 | regulation of organ growth(GO:0046620) |
| 0.7 | 3.7 | GO:0006564 | L-serine biosynthetic process(GO:0006564) |
| 0.7 | 2.2 | GO:0009270 | response to humidity(GO:0009270) |
| 0.7 | 2.2 | GO:1900364 | negative regulation of mRNA 3'-end processing(GO:0031441) negative regulation of mRNA processing(GO:0050686) negative regulation of mRNA polyadenylation(GO:1900364) negative regulation of mRNA metabolic process(GO:1903312) |
| 0.7 | 2.2 | GO:0051865 | protein autoubiquitination(GO:0051865) |
| 0.7 | 8.1 | GO:0072506 | phosphate ion homeostasis(GO:0055062) trivalent inorganic anion homeostasis(GO:0072506) |
| 0.7 | 10.3 | GO:0010039 | response to iron ion(GO:0010039) |
| 0.7 | 0.7 | GO:0090058 | metaxylem development(GO:0090058) |
| 0.7 | 2.2 | GO:0034551 | respiratory chain complex III assembly(GO:0017062) mitochondrial respiratory chain complex III assembly(GO:0034551) mitochondrial respiratory chain complex III biogenesis(GO:0097033) |
| 0.7 | 2.8 | GO:0042256 | mature ribosome assembly(GO:0042256) |
| 0.7 | 1.4 | GO:0010495 | long-distance posttranscriptional gene silencing(GO:0010495) |
| 0.7 | 4.2 | GO:0009823 | cytokinin catabolic process(GO:0009823) hormone catabolic process(GO:0042447) |
| 0.7 | 2.7 | GO:0015720 | allantoin transport(GO:0015720) |
| 0.7 | 7.5 | GO:0015749 | monosaccharide transport(GO:0015749) |
| 0.7 | 2.0 | GO:0010377 | guard cell fate commitment(GO:0010377) |
| 0.7 | 3.4 | GO:0008333 | lysosomal transport(GO:0007041) endosome to lysosome transport(GO:0008333) |
| 0.7 | 2.0 | GO:1990116 | ribosome-associated ubiquitin-dependent protein catabolic process(GO:1990116) |
| 0.7 | 4.1 | GO:0048578 | positive regulation of long-day photoperiodism, flowering(GO:0048578) |
| 0.7 | 31.2 | GO:0009788 | negative regulation of abscisic acid-activated signaling pathway(GO:0009788) |
| 0.7 | 1.3 | GO:0019740 | regulation of nitrogen utilization(GO:0006808) nitrogen utilization(GO:0019740) |
| 0.7 | 3.3 | GO:0030322 | stabilization of membrane potential(GO:0030322) |
| 0.7 | 1.3 | GO:0061062 | nematode larval development(GO:0002119) larval development(GO:0002164) regulation of nematode larval development(GO:0061062) |
| 0.7 | 2.0 | GO:0034247 | snoRNA splicing(GO:0034247) |
| 0.7 | 2.6 | GO:0030418 | nicotianamine metabolic process(GO:0030417) nicotianamine biosynthetic process(GO:0030418) tricarboxylic acid biosynthetic process(GO:0072351) |
| 0.7 | 0.7 | GO:0015744 | succinate transport(GO:0015744) |
| 0.7 | 2.6 | GO:0070676 | intralumenal vesicle formation(GO:0070676) |
| 0.6 | 1.3 | GO:0010597 | green leaf volatile biosynthetic process(GO:0010597) |
| 0.6 | 1.9 | GO:0045905 | positive regulation of translational elongation(GO:0045901) positive regulation of translational termination(GO:0045905) |
| 0.6 | 22.5 | GO:0006995 | cellular response to nitrogen starvation(GO:0006995) |
| 0.6 | 7.0 | GO:0002758 | pattern recognition receptor signaling pathway(GO:0002221) immune response-activating signal transduction(GO:0002757) innate immune response-activating signal transduction(GO:0002758) |
| 0.6 | 14.0 | GO:0043666 | regulation of phosphoprotein phosphatase activity(GO:0043666) |
| 0.6 | 1.3 | GO:0010113 | negative regulation of systemic acquired resistance(GO:0010113) |
| 0.6 | 4.4 | GO:0006552 | leucine catabolic process(GO:0006552) |
| 0.6 | 1.9 | GO:0046459 | short-chain fatty acid metabolic process(GO:0046459) |
| 0.6 | 1.3 | GO:0080178 | 5-carbamoylmethyl uridine residue modification(GO:0080178) |
| 0.6 | 1.9 | GO:0071108 | protein K48-linked deubiquitination(GO:0071108) |
| 0.6 | 2.5 | GO:0002184 | cytoplasmic translational termination(GO:0002184) |
| 0.6 | 3.0 | GO:0010677 | negative regulation of cellular carbohydrate metabolic process(GO:0010677) |
| 0.6 | 1.8 | GO:0034067 | protein localization to Golgi apparatus(GO:0034067) |
| 0.6 | 2.4 | GO:0007032 | endosome organization(GO:0007032) |
| 0.6 | 3.6 | GO:0046247 | carotene catabolic process(GO:0016121) terpene catabolic process(GO:0046247) |
| 0.6 | 1.8 | GO:0051205 | protein insertion into membrane(GO:0051205) |
| 0.6 | 1.8 | GO:0045332 | phospholipid translocation(GO:0045332) |
| 0.6 | 4.1 | GO:0046900 | tetrahydrofolylpolyglutamate metabolic process(GO:0046900) |
| 0.6 | 2.9 | GO:0034051 | negative regulation of plant-type hypersensitive response(GO:0034051) |
| 0.6 | 2.3 | GO:0042040 | molybdenum incorporation into molybdenum-molybdopterin complex(GO:0018315) metal incorporation into metallo-molybdopterin complex(GO:0042040) |
| 0.6 | 5.9 | GO:0090158 | endoplasmic reticulum membrane organization(GO:0090158) |
| 0.6 | 3.5 | GO:0048577 | negative regulation of short-day photoperiodism, flowering(GO:0048577) |
| 0.6 | 1.2 | GO:0010220 | positive regulation of vernalization response(GO:0010220) |
| 0.6 | 6.3 | GO:0015996 | chlorophyll catabolic process(GO:0015996) |
| 0.6 | 4.5 | GO:0015914 | phospholipid transport(GO:0015914) |
| 0.6 | 5.1 | GO:0018210 | peptidyl-threonine phosphorylation(GO:0018107) peptidyl-threonine modification(GO:0018210) |
| 0.6 | 3.9 | GO:0010188 | response to microbial phytotoxin(GO:0010188) |
| 0.6 | 2.8 | GO:0031349 | positive regulation of defense response(GO:0031349) |
| 0.6 | 1.1 | GO:1900363 | regulation of mRNA polyadenylation(GO:1900363) |
| 0.6 | 1.1 | GO:1902583 | multi-organism intracellular transport(GO:1902583) |
| 0.6 | 3.3 | GO:0009939 | positive regulation of gibberellic acid mediated signaling pathway(GO:0009939) |
| 0.5 | 2.7 | GO:0015846 | polyamine transport(GO:0015846) |
| 0.5 | 1.6 | GO:0043618 | regulation of transcription from RNA polymerase II promoter in response to stress(GO:0043618) |
| 0.5 | 4.4 | GO:0042343 | indole glucosinolate metabolic process(GO:0042343) |
| 0.5 | 1.6 | GO:0090239 | regulation of histone H4 acetylation(GO:0090239) |
| 0.5 | 2.2 | GO:0046786 | viral replication complex formation and maintenance(GO:0046786) |
| 0.5 | 8.1 | GO:0015770 | sucrose transport(GO:0015770) |
| 0.5 | 4.9 | GO:0016236 | macroautophagy(GO:0016236) |
| 0.5 | 5.3 | GO:0006878 | cellular copper ion homeostasis(GO:0006878) |
| 0.5 | 1.6 | GO:0034058 | endosomal vesicle fusion(GO:0034058) |
| 0.5 | 5.9 | GO:0010262 | somatic embryogenesis(GO:0010262) |
| 0.5 | 2.7 | GO:2001022 | positive regulation of response to DNA damage stimulus(GO:2001022) |
| 0.5 | 4.2 | GO:0097034 | respiratory chain complex IV assembly(GO:0008535) mitochondrial respiratory chain complex IV assembly(GO:0033617) mitochondrial respiratory chain complex IV biogenesis(GO:0097034) |
| 0.5 | 2.1 | GO:0031538 | negative regulation of anthocyanin metabolic process(GO:0031538) |
| 0.5 | 2.6 | GO:1990019 | protein storage vacuole organization(GO:1990019) |
| 0.5 | 6.2 | GO:0009410 | response to xenobiotic stimulus(GO:0009410) |
| 0.5 | 2.1 | GO:0048587 | regulation of short-day photoperiodism, flowering(GO:0048587) |
| 0.5 | 1.0 | GO:0045911 | positive regulation of DNA recombination(GO:0045911) |
| 0.5 | 0.5 | GO:0006498 | N-terminal protein lipidation(GO:0006498) N-terminal protein myristoylation(GO:0006499) protein myristoylation(GO:0018377) |
| 0.5 | 3.0 | GO:0015691 | cadmium ion transport(GO:0015691) |
| 0.5 | 3.0 | GO:2000306 | positive regulation of photomorphogenesis(GO:2000306) |
| 0.5 | 4.0 | GO:0009854 | oxidative photosynthetic carbon pathway(GO:0009854) |
| 0.5 | 3.5 | GO:0006882 | cellular zinc ion homeostasis(GO:0006882) |
| 0.5 | 8.0 | GO:0007584 | response to nutrient(GO:0007584) |
| 0.5 | 14.0 | GO:0006012 | galactose metabolic process(GO:0006012) |
| 0.5 | 2.5 | GO:0019310 | inositol catabolic process(GO:0019310) |
| 0.5 | 2.5 | GO:0033386 | geranylgeranyl diphosphate metabolic process(GO:0033385) geranylgeranyl diphosphate biosynthetic process(GO:0033386) |
| 0.5 | 1.5 | GO:0048281 | inflorescence morphogenesis(GO:0048281) |
| 0.5 | 1.5 | GO:0010203 | response to very low fluence red light stimulus(GO:0010203) |
| 0.5 | 1.5 | GO:0006557 | S-adenosylmethioninamine biosynthetic process(GO:0006557) S-adenosylmethioninamine metabolic process(GO:0046499) |
| 0.5 | 1.0 | GO:0009264 | deoxyribonucleotide catabolic process(GO:0009264) |
| 0.5 | 16.6 | GO:0009718 | anthocyanin-containing compound biosynthetic process(GO:0009718) |
| 0.5 | 4.9 | GO:0000422 | mitophagy(GO:0000422) mitochondrion disassembly(GO:0061726) |
| 0.5 | 5.3 | GO:0071712 | ER-associated misfolded protein catabolic process(GO:0071712) |
| 0.5 | 18.2 | GO:0072665 | protein targeting to vacuole(GO:0006623) protein localization to vacuole(GO:0072665) establishment of protein localization to vacuole(GO:0072666) |
| 0.5 | 2.9 | GO:0032957 | inositol trisphosphate metabolic process(GO:0032957) |
| 0.5 | 2.9 | GO:0015969 | guanosine tetraphosphate metabolic process(GO:0015969) purine ribonucleoside bisphosphate metabolic process(GO:0034035) |
| 0.5 | 1.4 | GO:0048209 | regulation of vesicle targeting, to, from or within Golgi(GO:0048209) |
| 0.5 | 5.6 | GO:0010439 | regulation of glucosinolate biosynthetic process(GO:0010439) |
| 0.5 | 2.8 | GO:0000290 | deadenylation-dependent decapping of nuclear-transcribed mRNA(GO:0000290) |
| 0.5 | 0.9 | GO:0006449 | regulation of translational termination(GO:0006449) |
| 0.5 | 2.8 | GO:0046339 | diacylglycerol metabolic process(GO:0046339) |
| 0.5 | 2.8 | GO:0006152 | purine nucleoside catabolic process(GO:0006152) |
| 0.5 | 2.8 | GO:0006567 | threonine catabolic process(GO:0006567) |
| 0.5 | 1.4 | GO:0009660 | amyloplast organization(GO:0009660) |
| 0.5 | 4.7 | GO:0017182 | peptidyl-diphthamide metabolic process(GO:0017182) peptidyl-diphthamide biosynthetic process from peptidyl-histidine(GO:0017183) peptidyl-histidine modification(GO:0018202) |
| 0.5 | 1.4 | GO:0030002 | cellular anion homeostasis(GO:0030002) |
| 0.5 | 1.4 | GO:0060862 | regulation of floral organ abscission(GO:0060860) negative regulation of floral organ abscission(GO:0060862) |
| 0.5 | 6.5 | GO:0051262 | protein tetramerization(GO:0051262) |
| 0.5 | 1.4 | GO:1900459 | positive regulation of brassinosteroid mediated signaling pathway(GO:1900459) |
| 0.5 | 0.5 | GO:0080001 | mucilage extrusion from seed coat(GO:0080001) |
| 0.5 | 0.5 | GO:0071481 | cellular response to X-ray(GO:0071481) |
| 0.5 | 1.8 | GO:0070542 | response to fatty acid(GO:0070542) cellular response to fatty acid(GO:0071398) |
| 0.5 | 5.4 | GO:0016558 | protein import into peroxisome matrix(GO:0016558) |
| 0.4 | 2.7 | GO:0010255 | glucose mediated signaling pathway(GO:0010255) |
| 0.4 | 0.4 | GO:0070922 | miRNA loading onto RISC involved in gene silencing by miRNA(GO:0035280) small RNA loading onto RISC(GO:0070922) |
| 0.4 | 4.0 | GO:0032511 | late endosome to vacuole transport via multivesicular body sorting pathway(GO:0032511) |
| 0.4 | 2.7 | GO:0006122 | mitochondrial electron transport, ubiquinol to cytochrome c(GO:0006122) |
| 0.4 | 8.0 | GO:0016024 | CDP-diacylglycerol biosynthetic process(GO:0016024) CDP-diacylglycerol metabolic process(GO:0046341) |
| 0.4 | 0.9 | GO:0035493 | SNARE complex assembly(GO:0035493) |
| 0.4 | 2.6 | GO:0006772 | thiamine metabolic process(GO:0006772) thiamine diphosphate biosynthetic process(GO:0009229) thiamine diphosphate metabolic process(GO:0042357) thiamine-containing compound metabolic process(GO:0042723) |
| 0.4 | 0.9 | GO:0045979 | regulation of oxidative phosphorylation(GO:0002082) positive regulation of nucleoside metabolic process(GO:0045979) positive regulation of nucleotide metabolic process(GO:0045981) positive regulation of purine nucleotide metabolic process(GO:1900544) positive regulation of ATP metabolic process(GO:1903580) positive regulation of oxidative phosphorylation(GO:1903862) |
| 0.4 | 14.8 | GO:0043547 | positive regulation of GTPase activity(GO:0043547) |
| 0.4 | 7.3 | GO:1900424 | regulation of defense response to bacterium(GO:1900424) |
| 0.4 | 9.4 | GO:0030968 | endoplasmic reticulum unfolded protein response(GO:0030968) |
| 0.4 | 1.7 | GO:0051175 | negative regulation of ethylene biosynthetic process(GO:0010366) negative regulation of sulfur amino acid metabolic process(GO:0031336) negative regulation of cellular amine metabolic process(GO:0033239) negative regulation of cellular amino acid metabolic process(GO:0045763) negative regulation of sulfur metabolic process(GO:0051175) negative regulation of olefin metabolic process(GO:1900909) negative regulation of olefin biosynthetic process(GO:1900912) |
| 0.4 | 4.3 | GO:0010031 | circumnutation(GO:0010031) multicellular organismal movement(GO:0050879) |
| 0.4 | 5.1 | GO:0009870 | defense response signaling pathway, resistance gene-dependent(GO:0009870) |
| 0.4 | 7.6 | GO:0061157 | RNA destabilization(GO:0050779) mRNA destabilization(GO:0061157) |
| 0.4 | 5.8 | GO:0043248 | proteasome assembly(GO:0043248) |
| 0.4 | 2.5 | GO:0010387 | COP9 signalosome assembly(GO:0010387) |
| 0.4 | 1.2 | GO:1903008 | organelle disassembly(GO:1903008) |
| 0.4 | 5.0 | GO:0048317 | seed morphogenesis(GO:0048317) |
| 0.4 | 3.7 | GO:0010603 | regulation of cytoplasmic mRNA processing body assembly(GO:0010603) |
| 0.4 | 2.1 | GO:1902767 | farnesyl diphosphate biosynthetic process, mevalonate pathway(GO:0010142) isoprenoid biosynthetic process via mevalonate(GO:1902767) |
| 0.4 | 4.1 | GO:0006450 | regulation of translational fidelity(GO:0006450) |
| 0.4 | 2.0 | GO:1901006 | ubiquinone-6 metabolic process(GO:1901004) ubiquinone-6 biosynthetic process(GO:1901006) |
| 0.4 | 1.2 | GO:0051639 | actin filament network formation(GO:0051639) |
| 0.4 | 4.9 | GO:0006360 | transcription from RNA polymerase I promoter(GO:0006360) |
| 0.4 | 1.6 | GO:0048446 | petal morphogenesis(GO:0048446) |
| 0.4 | 18.3 | GO:0006874 | cellular calcium ion homeostasis(GO:0006874) |
| 0.4 | 6.7 | GO:0002183 | cytoplasmic translational initiation(GO:0002183) |
| 0.4 | 0.4 | GO:0046321 | positive regulation of fatty acid beta-oxidation(GO:0032000) positive regulation of fatty acid oxidation(GO:0046321) positive regulation of lipid catabolic process(GO:0050996) |
| 0.4 | 35.9 | GO:0000209 | protein polyubiquitination(GO:0000209) |
| 0.4 | 1.2 | GO:0045857 | regulation of molecular function, epigenetic(GO:0040030) negative regulation of molecular function, epigenetic(GO:0045857) |
| 0.4 | 1.9 | GO:0042149 | cellular response to glucose starvation(GO:0042149) |
| 0.4 | 5.4 | GO:0046855 | inositol phosphate dephosphorylation(GO:0046855) inositol phosphate catabolic process(GO:0071545) |
| 0.4 | 1.6 | GO:0030259 | lipid glycosylation(GO:0030259) |
| 0.4 | 2.3 | GO:0031348 | negative regulation of defense response(GO:0031348) |
| 0.4 | 5.0 | GO:0006857 | oligopeptide transport(GO:0006857) peptide transport(GO:0015833) |
| 0.4 | 1.9 | GO:0007231 | osmosensory signaling pathway(GO:0007231) |
| 0.4 | 1.2 | GO:0006386 | termination of RNA polymerase III transcription(GO:0006386) |
| 0.4 | 5.0 | GO:0080027 | response to herbivore(GO:0080027) |
| 0.4 | 11.1 | GO:0006635 | fatty acid beta-oxidation(GO:0006635) |
| 0.4 | 1.9 | GO:0050777 | negative regulation of immune response(GO:0050777) |
| 0.4 | 2.7 | GO:0051014 | actin filament severing(GO:0051014) |
| 0.4 | 11.4 | GO:0009682 | induced systemic resistance(GO:0009682) |
| 0.4 | 1.5 | GO:0043153 | entrainment of circadian clock by photoperiod(GO:0043153) |
| 0.4 | 14.4 | GO:0002239 | response to oomycetes(GO:0002239) |
| 0.4 | 18.6 | GO:0009694 | jasmonic acid metabolic process(GO:0009694) |
| 0.4 | 1.1 | GO:0051601 | exocyst localization(GO:0051601) |
| 0.4 | 0.7 | GO:0034389 | lipid particle organization(GO:0034389) |
| 0.4 | 1.4 | GO:0010395 | rhamnogalacturonan I metabolic process(GO:0010395) |
| 0.4 | 4.9 | GO:0000266 | mitochondrial fission(GO:0000266) |
| 0.4 | 3.2 | GO:0006621 | protein retention in ER lumen(GO:0006621) |
| 0.4 | 6.3 | GO:0098754 | detoxification(GO:0098754) |
| 0.3 | 1.7 | GO:0010264 | myo-inositol hexakisphosphate biosynthetic process(GO:0010264) myo-inositol hexakisphosphate metabolic process(GO:0033517) |
| 0.3 | 3.1 | GO:0045962 | positive regulation of development, heterochronic(GO:0045962) |
| 0.3 | 4.5 | GO:0015693 | magnesium ion transport(GO:0015693) |
| 0.3 | 1.7 | GO:0048530 | fruit morphogenesis(GO:0048530) |
| 0.3 | 6.4 | GO:0009838 | abscission(GO:0009838) |
| 0.3 | 0.7 | GO:0032988 | ribonucleoprotein complex disassembly(GO:0032988) |
| 0.3 | 4.3 | GO:0043068 | positive regulation of programmed cell death(GO:0043068) |
| 0.3 | 3.0 | GO:0006102 | isocitrate metabolic process(GO:0006102) |
| 0.3 | 2.0 | GO:1900457 | regulation of brassinosteroid mediated signaling pathway(GO:1900457) |
| 0.3 | 3.3 | GO:0045736 | negative regulation of cyclin-dependent protein serine/threonine kinase activity(GO:0045736) negative regulation of cyclin-dependent protein kinase activity(GO:1904030) |
| 0.3 | 0.7 | GO:0010337 | regulation of salicylic acid metabolic process(GO:0010337) |
| 0.3 | 22.7 | GO:0016579 | protein deubiquitination(GO:0016579) |
| 0.3 | 1.0 | GO:0030656 | regulation of vitamin metabolic process(GO:0030656) regulation of L-ascorbic acid biosynthetic process(GO:2000082) |
| 0.3 | 2.0 | GO:0045851 | pH reduction(GO:0045851) |
| 0.3 | 0.7 | GO:0000972 | transcription-dependent tethering of RNA polymerase II gene DNA at nuclear periphery(GO:0000972) |
| 0.3 | 6.1 | GO:0006904 | vesicle docking involved in exocytosis(GO:0006904) |
| 0.3 | 1.3 | GO:0040031 | snRNA modification(GO:0040031) |
| 0.3 | 1.0 | GO:0051571 | positive regulation of histone H3-K4 methylation(GO:0051571) |
| 0.3 | 6.4 | GO:0010193 | response to ozone(GO:0010193) |
| 0.3 | 5.7 | GO:0010104 | regulation of ethylene-activated signaling pathway(GO:0010104) regulation of phosphorelay signal transduction system(GO:0070297) |
| 0.3 | 4.7 | GO:0046688 | response to copper ion(GO:0046688) |
| 0.3 | 0.9 | GO:0046898 | response to cycloheximide(GO:0046898) cellular response to external biotic stimulus(GO:0071217) |
| 0.3 | 0.9 | GO:0035308 | negative regulation of dephosphorylation(GO:0035305) negative regulation of protein dephosphorylation(GO:0035308) |
| 0.3 | 14.1 | GO:0016036 | cellular response to phosphate starvation(GO:0016036) |
| 0.3 | 2.5 | GO:0032456 | endocytic recycling(GO:0032456) |
| 0.3 | 0.9 | GO:0010501 | RNA secondary structure unwinding(GO:0010501) |
| 0.3 | 2.5 | GO:0045116 | protein neddylation(GO:0045116) |
| 0.3 | 4.9 | GO:0006672 | ceramide metabolic process(GO:0006672) |
| 0.3 | 0.9 | GO:0090069 | regulation of ribosome biogenesis(GO:0090069) |
| 0.3 | 4.6 | GO:0006282 | regulation of DNA repair(GO:0006282) |
| 0.3 | 1.5 | GO:0006914 | autophagy(GO:0006914) |
| 0.3 | 1.2 | GO:0034063 | stress granule assembly(GO:0034063) |
| 0.3 | 2.4 | GO:0043171 | peptide catabolic process(GO:0043171) |
| 0.3 | 3.3 | GO:0070646 | protein modification by small protein removal(GO:0070646) |
| 0.3 | 8.4 | GO:0043484 | regulation of RNA splicing(GO:0043484) |
| 0.3 | 1.2 | GO:1900370 | positive regulation of RNA interference(GO:1900370) |
| 0.3 | 13.7 | GO:0045292 | mRNA cis splicing, via spliceosome(GO:0045292) |
| 0.3 | 4.2 | GO:0051260 | protein homooligomerization(GO:0051260) |
| 0.3 | 2.1 | GO:1904482 | L-serine catabolic process(GO:0006565) glycine biosynthetic process from serine(GO:0019264) folic acid metabolic process(GO:0046655) response to tetrahydrofolate(GO:1904481) cellular response to tetrahydrofolate(GO:1904482) |
| 0.3 | 1.5 | GO:0055070 | copper ion homeostasis(GO:0055070) |
| 0.3 | 1.2 | GO:0045948 | positive regulation of translational initiation(GO:0045948) |
| 0.3 | 1.8 | GO:0045899 | regulation of RNA polymerase II transcriptional preinitiation complex assembly(GO:0045898) positive regulation of RNA polymerase II transcriptional preinitiation complex assembly(GO:0045899) |
| 0.3 | 1.8 | GO:0032509 | endosome transport via multivesicular body sorting pathway(GO:0032509) |
| 0.3 | 1.5 | GO:0000056 | ribosomal small subunit export from nucleus(GO:0000056) |
| 0.3 | 3.2 | GO:0051131 | chaperone-mediated protein complex assembly(GO:0051131) |
| 0.3 | 2.6 | GO:0010048 | vernalization response(GO:0010048) |
| 0.3 | 1.2 | GO:0046622 | positive regulation of organ growth(GO:0046622) |
| 0.3 | 1.4 | GO:0008608 | attachment of spindle microtubules to kinetochore(GO:0008608) |
| 0.3 | 0.9 | GO:0031087 | nuclear-transcribed mRNA catabolic process, deadenylation-independent decay(GO:0031086) deadenylation-independent decapping of nuclear-transcribed mRNA(GO:0031087) |
| 0.3 | 1.1 | GO:0000719 | photoreactive repair(GO:0000719) |
| 0.3 | 0.6 | GO:0032196 | transposition(GO:0032196) |
| 0.3 | 2.8 | GO:0035304 | regulation of protein dephosphorylation(GO:0035304) |
| 0.3 | 1.7 | GO:0010380 | regulation of chlorophyll biosynthetic process(GO:0010380) |
| 0.3 | 0.8 | GO:0033015 | porphyrin-containing compound catabolic process(GO:0006787) tetrapyrrole catabolic process(GO:0033015) |
| 0.3 | 0.6 | GO:0009720 | detection of hormone stimulus(GO:0009720) detection of endogenous stimulus(GO:0009726) |
| 0.3 | 0.8 | GO:0008334 | histone mRNA metabolic process(GO:0008334) |
| 0.3 | 0.6 | GO:0071071 | regulation of isopentenyl diphosphate biosynthetic process, methylerythritol 4-phosphate pathway(GO:0010322) regulation of phospholipid biosynthetic process(GO:0071071) regulation of phospholipid metabolic process(GO:1903725) |
| 0.3 | 13.0 | GO:0006888 | ER to Golgi vesicle-mediated transport(GO:0006888) |
| 0.3 | 3.3 | GO:0033750 | ribosomal subunit export from nucleus(GO:0000054) ribosome localization(GO:0033750) establishment of ribosome localization(GO:0033753) rRNA-containing ribonucleoprotein complex export from nucleus(GO:0071428) |
| 0.3 | 0.5 | GO:0009871 | jasmonic acid and ethylene-dependent systemic resistance, ethylene mediated signaling pathway(GO:0009871) |
| 0.3 | 7.6 | GO:0009833 | plant-type primary cell wall biogenesis(GO:0009833) |
| 0.3 | 1.4 | GO:0015074 | DNA integration(GO:0015074) |
| 0.3 | 3.2 | GO:0008285 | negative regulation of cell proliferation(GO:0008285) |
| 0.3 | 4.9 | GO:0009969 | xyloglucan biosynthetic process(GO:0009969) |
| 0.3 | 0.3 | GO:0031125 | rRNA 3'-end processing(GO:0031125) |
| 0.3 | 1.1 | GO:0006435 | threonyl-tRNA aminoacylation(GO:0006435) |
| 0.3 | 1.6 | GO:0098659 | sodium ion transmembrane transport(GO:0035725) sodium ion import(GO:0097369) inorganic cation import into cell(GO:0098659) sodium ion import across plasma membrane(GO:0098719) inorganic ion import into cell(GO:0099587) sodium ion import into cell(GO:1990118) |
| 0.3 | 9.7 | GO:0000122 | negative regulation of transcription from RNA polymerase II promoter(GO:0000122) |
| 0.3 | 0.8 | GO:0010184 | cytokinin transport(GO:0010184) |
| 0.3 | 2.8 | GO:0070940 | dephosphorylation of RNA polymerase II C-terminal domain(GO:0070940) |
| 0.3 | 2.6 | GO:0016973 | poly(A)+ mRNA export from nucleus(GO:0016973) |
| 0.3 | 7.7 | GO:0007166 | cell surface receptor signaling pathway(GO:0007166) |
| 0.3 | 1.5 | GO:0071586 | CAAX-box protein processing(GO:0071586) CAAX-box protein maturation(GO:0080120) |
| 0.3 | 0.3 | GO:0006723 | cuticle hydrocarbon biosynthetic process(GO:0006723) |
| 0.3 | 1.3 | GO:0048830 | adventitious root development(GO:0048830) |
| 0.3 | 0.5 | GO:0048464 | sepal development(GO:0048442) flower calyx development(GO:0048464) |
| 0.3 | 23.8 | GO:0007568 | aging(GO:0007568) |
| 0.3 | 2.0 | GO:0097428 | protein maturation by iron-sulfur cluster transfer(GO:0097428) |
| 0.3 | 0.8 | GO:0001672 | regulation of chromatin assembly or disassembly(GO:0001672) |
| 0.3 | 0.5 | GO:0042754 | negative regulation of circadian rhythm(GO:0042754) |
| 0.3 | 0.5 | GO:0043545 | Mo-molybdopterin cofactor biosynthetic process(GO:0006777) Mo-molybdopterin cofactor metabolic process(GO:0019720) molybdopterin cofactor biosynthetic process(GO:0032324) molybdopterin cofactor metabolic process(GO:0043545) prosthetic group metabolic process(GO:0051189) |
| 0.3 | 0.8 | GO:0048863 | stem cell differentiation(GO:0048863) |
| 0.2 | 5.9 | GO:0032786 | positive regulation of DNA-templated transcription, elongation(GO:0032786) |
| 0.2 | 0.2 | GO:0046621 | negative regulation of organ growth(GO:0046621) |
| 0.2 | 1.0 | GO:0060149 | negative regulation of posttranscriptional gene silencing(GO:0060149) |
| 0.2 | 0.2 | GO:0080171 | lytic vacuole organization(GO:0080171) |
| 0.2 | 1.0 | GO:0006488 | dolichol-linked oligosaccharide biosynthetic process(GO:0006488) oligosaccharide-lipid intermediate biosynthetic process(GO:0006490) |
| 0.2 | 6.2 | GO:0055072 | iron ion homeostasis(GO:0055072) |
| 0.2 | 1.2 | GO:0019673 | GDP-mannose metabolic process(GO:0019673) 'de novo' GDP-L-fucose biosynthetic process(GO:0042351) |
| 0.2 | 0.2 | GO:0010086 | embryonic root morphogenesis(GO:0010086) |
| 0.2 | 1.2 | GO:0033169 | histone H3-K9 demethylation(GO:0033169) |
| 0.2 | 5.0 | GO:0034050 | plant-type hypersensitive response(GO:0009626) host programmed cell death induced by symbiont(GO:0034050) |
| 0.2 | 1.2 | GO:0034059 | response to anoxia(GO:0034059) |
| 0.2 | 0.9 | GO:0007155 | cell adhesion(GO:0007155) biological adhesion(GO:0022610) |
| 0.2 | 1.8 | GO:0009061 | anaerobic respiration(GO:0009061) |
| 0.2 | 0.7 | GO:0051298 | centrosome cycle(GO:0007098) centriole replication(GO:0007099) centrosome organization(GO:0051297) centrosome duplication(GO:0051298) centriole assembly(GO:0098534) |
| 0.2 | 0.7 | GO:0045737 | positive regulation of cyclin-dependent protein serine/threonine kinase activity(GO:0045737) positive regulation of cyclin-dependent protein kinase activity(GO:1904031) |
| 0.2 | 2.7 | GO:0010417 | glucuronoxylan metabolic process(GO:0010413) glucuronoxylan biosynthetic process(GO:0010417) |
| 0.2 | 3.2 | GO:0009937 | regulation of gibberellic acid mediated signaling pathway(GO:0009937) |
| 0.2 | 0.5 | GO:0009757 | hexose mediated signaling(GO:0009757) |
| 0.2 | 4.5 | GO:0033108 | mitochondrial respiratory chain complex assembly(GO:0033108) |
| 0.2 | 1.6 | GO:0046520 | sphingoid biosynthetic process(GO:0046520) |
| 0.2 | 38.5 | GO:0071453 | cellular response to decreased oxygen levels(GO:0036294) cellular response to oxygen levels(GO:0071453) cellular response to hypoxia(GO:0071456) |
| 0.2 | 1.3 | GO:1902074 | response to salt(GO:1902074) |
| 0.2 | 7.8 | GO:0048510 | regulation of timing of meristematic phase transition(GO:0048506) regulation of timing of transition from vegetative to reproductive phase(GO:0048510) |
| 0.2 | 0.9 | GO:1900384 | regulation of flavonol biosynthetic process(GO:1900384) |
| 0.2 | 2.0 | GO:0009306 | protein secretion(GO:0009306) |
| 0.2 | 8.8 | GO:0048232 | male gamete generation(GO:0048232) |
| 0.2 | 1.3 | GO:0007033 | vacuole organization(GO:0007033) |
| 0.2 | 1.3 | GO:0006120 | mitochondrial electron transport, NADH to ubiquinone(GO:0006120) |
| 0.2 | 0.9 | GO:0080009 | mRNA methylation(GO:0080009) |
| 0.2 | 0.7 | GO:0016320 | endoplasmic reticulum membrane fusion(GO:0016320) |
| 0.2 | 69.1 | GO:0051603 | proteolysis involved in cellular protein catabolic process(GO:0051603) |
| 0.2 | 4.9 | GO:0046219 | tryptophan biosynthetic process(GO:0000162) indolalkylamine biosynthetic process(GO:0046219) |
| 0.2 | 1.1 | GO:0030308 | negative regulation of cell growth(GO:0030308) |
| 0.2 | 1.3 | GO:0006336 | DNA replication-independent nucleosome assembly(GO:0006336) DNA replication-independent nucleosome organization(GO:0034724) |
| 0.2 | 2.7 | GO:0000165 | MAPK cascade(GO:0000165) |
| 0.2 | 1.9 | GO:0033319 | UDP-D-xylose metabolic process(GO:0033319) UDP-D-xylose biosynthetic process(GO:0033320) |
| 0.2 | 6.7 | GO:0009749 | response to glucose(GO:0009749) |
| 0.2 | 2.7 | GO:0015706 | nitrate transport(GO:0015706) |
| 0.2 | 1.9 | GO:0016575 | histone deacetylation(GO:0016575) |
| 0.2 | 2.9 | GO:0009083 | branched-chain amino acid catabolic process(GO:0009083) |
| 0.2 | 32.9 | GO:0016311 | dephosphorylation(GO:0016311) |
| 0.2 | 1.0 | GO:0072662 | protein targeting to peroxisome(GO:0006625) protein localization to peroxisome(GO:0072662) establishment of protein localization to peroxisome(GO:0072663) |
| 0.2 | 1.4 | GO:0048441 | petal development(GO:0048441) corolla development(GO:0048465) |
| 0.2 | 0.6 | GO:0042128 | nitrate metabolic process(GO:0042126) nitrate assimilation(GO:0042128) |
| 0.2 | 3.6 | GO:0043288 | abscisic acid metabolic process(GO:0009687) apocarotenoid metabolic process(GO:0043288) tertiary alcohol metabolic process(GO:1902644) |
| 0.2 | 0.6 | GO:0048439 | flower morphogenesis(GO:0048439) |
| 0.2 | 0.2 | GO:2000068 | regulation of defense response to insect(GO:2000068) |
| 0.2 | 1.0 | GO:0009942 | longitudinal axis specification(GO:0009942) |
| 0.2 | 0.4 | GO:0043970 | histone H3-K9 acetylation(GO:0043970) |
| 0.2 | 0.8 | GO:0070898 | RNA polymerase III transcriptional preinitiation complex assembly(GO:0070898) |
| 0.2 | 1.0 | GO:0070125 | mitochondrial translational elongation(GO:0070125) |
| 0.2 | 2.9 | GO:0048015 | phosphatidylinositol-mediated signaling(GO:0048015) |
| 0.2 | 1.6 | GO:0043928 | exonucleolytic nuclear-transcribed mRNA catabolic process involved in deadenylation-dependent decay(GO:0043928) |
| 0.2 | 1.6 | GO:0035265 | organ growth(GO:0035265) |
| 0.2 | 2.3 | GO:0000460 | maturation of 5.8S rRNA(GO:0000460) |
| 0.2 | 1.5 | GO:0009052 | pentose-phosphate shunt, non-oxidative branch(GO:0009052) |
| 0.2 | 0.8 | GO:0071431 | tRNA export from nucleus(GO:0006409) tRNA transport(GO:0051031) tRNA-containing ribonucleoprotein complex export from nucleus(GO:0071431) |
| 0.2 | 1.0 | GO:0042360 | vitamin E biosynthetic process(GO:0010189) vitamin E metabolic process(GO:0042360) |
| 0.2 | 26.6 | GO:0050832 | defense response to fungus(GO:0050832) |
| 0.2 | 2.6 | GO:0048496 | maintenance of organ identity(GO:0048496) maintenance of floral organ identity(GO:0048497) |
| 0.2 | 7.7 | GO:0006333 | chromatin assembly or disassembly(GO:0006333) |
| 0.2 | 6.0 | GO:0007034 | vacuolar transport(GO:0007034) |
| 0.2 | 0.2 | GO:0051646 | mitochondrion localization(GO:0051646) |
| 0.2 | 0.2 | GO:2001057 | reactive nitrogen species metabolic process(GO:2001057) |
| 0.2 | 1.1 | GO:0080028 | nitrile metabolic process(GO:0050898) nitrile biosynthetic process(GO:0080028) |
| 0.2 | 1.1 | GO:0015689 | molybdate ion transport(GO:0015689) |
| 0.2 | 7.2 | GO:0006897 | endocytosis(GO:0006897) |
| 0.2 | 0.9 | GO:0006370 | 7-methylguanosine mRNA capping(GO:0006370) |
| 0.2 | 1.2 | GO:0042776 | mitochondrial ATP synthesis coupled proton transport(GO:0042776) |
| 0.2 | 4.0 | GO:0030091 | protein repair(GO:0030091) |
| 0.2 | 5.2 | GO:0009863 | salicylic acid mediated signaling pathway(GO:0009863) |
| 0.2 | 4.3 | GO:0030150 | protein import into mitochondrial matrix(GO:0030150) |
| 0.2 | 49.0 | GO:0016567 | protein ubiquitination(GO:0016567) |
| 0.2 | 3.2 | GO:2000028 | regulation of photoperiodism, flowering(GO:2000028) |
| 0.2 | 0.5 | GO:1901001 | negative regulation of response to salt stress(GO:1901001) |
| 0.2 | 1.5 | GO:0006388 | tRNA splicing, via endonucleolytic cleavage and ligation(GO:0006388) |
| 0.2 | 14.6 | GO:0010200 | response to chitin(GO:0010200) |
| 0.2 | 1.5 | GO:0098876 | vesicle-mediated transport to the plasma membrane(GO:0098876) |
| 0.2 | 2.6 | GO:0006383 | transcription from RNA polymerase III promoter(GO:0006383) |
| 0.2 | 1.3 | GO:0002237 | response to molecule of bacterial origin(GO:0002237) |
| 0.2 | 0.8 | GO:0070070 | proton-transporting V-type ATPase complex assembly(GO:0070070) vacuolar proton-transporting V-type ATPase complex assembly(GO:0070072) |
| 0.2 | 0.2 | GO:0031023 | microtubule organizing center organization(GO:0031023) |
| 0.2 | 0.8 | GO:0006013 | mannose metabolic process(GO:0006013) |
| 0.2 | 0.3 | GO:0051973 | positive regulation of telomerase activity(GO:0051973) |
| 0.2 | 0.9 | GO:0006890 | retrograde vesicle-mediated transport, Golgi to ER(GO:0006890) |
| 0.2 | 0.5 | GO:0033967 | box C/D snoRNA 3'-end processing(GO:0000494) peptidyl-glutamine methylation(GO:0018364) box C/D snoRNA metabolic process(GO:0033967) box C/D snoRNA processing(GO:0034963) histone glutamine methylation(GO:1990258) |
| 0.2 | 2.3 | GO:0009313 | oligosaccharide catabolic process(GO:0009313) disaccharide catabolic process(GO:0046352) |
| 0.2 | 13.8 | GO:0010228 | vegetative to reproductive phase transition of meristem(GO:0010228) |
| 0.1 | 1.3 | GO:0010044 | response to aluminum ion(GO:0010044) |
| 0.1 | 1.9 | GO:0000245 | spliceosomal complex assembly(GO:0000245) |
| 0.1 | 0.4 | GO:0019048 | modulation by virus of host morphology or physiology(GO:0019048) |
| 0.1 | 2.2 | GO:0009098 | leucine biosynthetic process(GO:0009098) |
| 0.1 | 1.0 | GO:0009880 | embryonic pattern specification(GO:0009880) |
| 0.1 | 0.5 | GO:0009557 | antipodal cell differentiation(GO:0009557) |
| 0.1 | 0.5 | GO:0006741 | NADP biosynthetic process(GO:0006741) |
| 0.1 | 0.4 | GO:0010289 | homogalacturonan biosynthetic process(GO:0010289) |
| 0.1 | 0.1 | GO:0060776 | simple leaf morphogenesis(GO:0060776) |
| 0.1 | 0.5 | GO:0000012 | single strand break repair(GO:0000012) |
| 0.1 | 0.7 | GO:0097437 | maintenance of seed dormancy(GO:0010231) maintenance of dormancy(GO:0097437) |
| 0.1 | 0.9 | GO:0045910 | negative regulation of DNA recombination(GO:0045910) |
| 0.1 | 2.4 | GO:0010072 | primary shoot apical meristem specification(GO:0010072) |
| 0.1 | 2.5 | GO:0048193 | Golgi vesicle transport(GO:0048193) |
| 0.1 | 1.1 | GO:0006086 | acetyl-CoA biosynthetic process from pyruvate(GO:0006086) |
| 0.1 | 0.9 | GO:0032781 | positive regulation of ATPase activity(GO:0032781) |
| 0.1 | 1.1 | GO:0033683 | nucleotide-excision repair, DNA incision(GO:0033683) |
| 0.1 | 0.4 | GO:0007030 | Golgi organization(GO:0007030) |
| 0.1 | 0.5 | GO:0009560 | female gamete generation(GO:0007292) embryo sac egg cell differentiation(GO:0009560) |
| 0.1 | 1.4 | GO:0009641 | shade avoidance(GO:0009641) |
| 0.1 | 0.8 | GO:0035999 | tetrahydrofolate interconversion(GO:0035999) |
| 0.1 | 2.3 | GO:0006613 | cotranslational protein targeting to membrane(GO:0006613) SRP-dependent cotranslational protein targeting to membrane(GO:0006614) |
| 0.1 | 1.0 | GO:0009816 | defense response to bacterium, incompatible interaction(GO:0009816) |
| 0.1 | 0.8 | GO:0045039 | protein import into mitochondrial inner membrane(GO:0045039) |
| 0.1 | 0.8 | GO:0018344 | protein geranylgeranylation(GO:0018344) |
| 0.1 | 0.3 | GO:0046487 | glyoxylate cycle(GO:0006097) glyoxylate metabolic process(GO:0046487) |
| 0.1 | 3.5 | GO:0000723 | telomere maintenance(GO:0000723) telomere organization(GO:0032200) |
| 0.1 | 1.6 | GO:0001666 | response to hypoxia(GO:0001666) response to decreased oxygen levels(GO:0036293) |
| 0.1 | 0.2 | GO:0048358 | mucilage pectin biosynthetic process(GO:0048358) |
| 0.1 | 1.4 | GO:0009231 | riboflavin metabolic process(GO:0006771) riboflavin biosynthetic process(GO:0009231) |
| 0.1 | 9.3 | GO:0000398 | mRNA splicing, via spliceosome(GO:0000398) |
| 0.1 | 12.7 | GO:0016192 | vesicle-mediated transport(GO:0016192) |
| 0.1 | 1.6 | GO:0018345 | protein palmitoylation(GO:0018345) |
| 0.1 | 1.6 | GO:0071577 | zinc II ion transmembrane transport(GO:0071577) |
| 0.1 | 0.3 | GO:0015804 | neutral amino acid transport(GO:0015804) |
| 0.1 | 0.6 | GO:0010306 | rhamnogalacturonan II biosynthetic process(GO:0010306) rhamnogalacturonan II metabolic process(GO:0010396) |
| 0.1 | 1.1 | GO:0034976 | response to endoplasmic reticulum stress(GO:0034976) |
| 0.1 | 1.6 | GO:0030163 | protein catabolic process(GO:0030163) |
| 0.1 | 0.4 | GO:0000212 | meiotic spindle organization(GO:0000212) |
| 0.1 | 2.7 | GO:0006099 | tricarboxylic acid cycle(GO:0006099) citrate metabolic process(GO:0006101) |
| 0.1 | 0.3 | GO:0010731 | protein glutathionylation(GO:0010731) |
| 0.1 | 9.7 | GO:0009100 | glycoprotein metabolic process(GO:0009100) |
| 0.1 | 5.0 | GO:0009738 | abscisic acid-activated signaling pathway(GO:0009738) |
| 0.1 | 0.3 | GO:0060964 | regulation of gene silencing by miRNA(GO:0060964) |
| 0.1 | 0.6 | GO:0010165 | response to X-ray(GO:0010165) |
| 0.1 | 0.3 | GO:0042989 | sequestering of actin monomers(GO:0042989) |
| 0.1 | 0.3 | GO:0000965 | mitochondrial RNA 3'-end processing(GO:0000965) |
| 0.1 | 1.6 | GO:0017148 | negative regulation of translation(GO:0017148) negative regulation of cellular amide metabolic process(GO:0034249) |
| 0.1 | 1.5 | GO:0031124 | mRNA 3'-end processing(GO:0031124) |
| 0.1 | 0.4 | GO:0032784 | regulation of DNA-templated transcription, elongation(GO:0032784) |
| 0.1 | 1.1 | GO:0006465 | signal peptide processing(GO:0006465) |
| 0.1 | 1.4 | GO:0010252 | auxin homeostasis(GO:0010252) |
| 0.1 | 5.1 | GO:1902600 | hydrogen ion transmembrane transport(GO:1902600) |
| 0.1 | 0.8 | GO:0002097 | tRNA wobble base modification(GO:0002097) |
| 0.1 | 2.1 | GO:0006338 | chromatin remodeling(GO:0006338) |
| 0.1 | 1.0 | GO:0042631 | cellular response to water deprivation(GO:0042631) |
| 0.1 | 0.5 | GO:0043966 | histone H3 acetylation(GO:0043966) |
| 0.1 | 0.8 | GO:0010540 | basipetal auxin transport(GO:0010540) |
| 0.1 | 0.1 | GO:0072523 | purine-containing compound catabolic process(GO:0072523) |
| 0.1 | 2.4 | GO:0071395 | cellular response to jasmonic acid stimulus(GO:0071395) |
| 0.1 | 0.9 | GO:0007031 | peroxisome organization(GO:0007031) |
| 0.1 | 0.1 | GO:0043255 | regulation of carbohydrate biosynthetic process(GO:0043255) |
| 0.1 | 0.4 | GO:0015893 | drug transport(GO:0015893) |
| 0.1 | 0.1 | GO:0043574 | peroxisomal transport(GO:0043574) |
| 0.1 | 2.9 | GO:0009615 | response to virus(GO:0009615) |
| 0.1 | 1.4 | GO:0042026 | protein refolding(GO:0042026) |
| 0.1 | 0.6 | GO:0010050 | vegetative phase change(GO:0010050) |
| 0.1 | 1.6 | GO:0071804 | cellular potassium ion transport(GO:0071804) potassium ion transmembrane transport(GO:0071805) |
| 0.1 | 1.6 | GO:0000462 | maturation of SSU-rRNA from tricistronic rRNA transcript (SSU-rRNA, 5.8S rRNA, LSU-rRNA)(GO:0000462) |
| 0.1 | 0.8 | GO:0005983 | starch catabolic process(GO:0005983) |
| 0.1 | 0.4 | GO:0090502 | RNA phosphodiester bond hydrolysis, endonucleolytic(GO:0090502) |
| 0.1 | 0.5 | GO:1902183 | regulation of shoot apical meristem development(GO:1902183) |
| 0.1 | 2.2 | GO:0019932 | second-messenger-mediated signaling(GO:0019932) |
| 0.1 | 0.4 | GO:0006607 | NLS-bearing protein import into nucleus(GO:0006607) |
| 0.0 | 0.4 | GO:0009251 | glucan catabolic process(GO:0009251) |
| 0.0 | 0.6 | GO:0046834 | lipid phosphorylation(GO:0046834) phosphatidylinositol phosphorylation(GO:0046854) |
| 0.0 | 0.4 | GO:0071472 | cellular response to salt stress(GO:0071472) |
| 0.0 | 0.2 | GO:0051568 | histone H3-K4 methylation(GO:0051568) |
| 0.0 | 0.1 | GO:0010358 | leaf shaping(GO:0010358) |
| 0.0 | 0.2 | GO:0010344 | seed oilbody biogenesis(GO:0010344) |
| 0.0 | 0.3 | GO:0043200 | response to amino acid(GO:0043200) |
| 0.0 | 0.2 | GO:0019287 | isopentenyl diphosphate biosynthetic process, mevalonate pathway(GO:0019287) |
| 0.0 | 0.5 | GO:0061572 | actin filament bundle assembly(GO:0051017) actin filament bundle organization(GO:0061572) |
| 0.0 | 0.1 | GO:0090646 | mitochondrial tRNA processing(GO:0090646) |
| 0.0 | 0.2 | GO:0097036 | regulation of plasma membrane sterol distribution(GO:0097036) |
| 0.0 | 0.1 | GO:0010500 | transmitting tissue development(GO:0010500) |
| 0.0 | 0.0 | GO:0031331 | positive regulation of cellular catabolic process(GO:0031331) |
| 0.0 | 0.1 | GO:0034308 | primary alcohol metabolic process(GO:0034308) |
| 0.0 | 0.0 | GO:0042436 | tryptophan catabolic process(GO:0006569) indole-containing compound catabolic process(GO:0042436) indolalkylamine catabolic process(GO:0046218) |
| 0.0 | 0.2 | GO:0046654 | folic acid-containing compound biosynthetic process(GO:0009396) tetrahydrofolate biosynthetic process(GO:0046654) |
| 0.0 | 0.1 | GO:1901703 | protein localization involved in auxin polar transport(GO:1901703) |
| 0.0 | 0.4 | GO:0031347 | regulation of defense response(GO:0031347) |
| 0.0 | 0.1 | GO:0048363 | mucilage pectin metabolic process(GO:0048363) |
| 0.0 | 0.1 | GO:0006015 | 5-phosphoribose 1-diphosphate biosynthetic process(GO:0006015) 5-phosphoribose 1-diphosphate metabolic process(GO:0046391) |
| 0.0 | 0.1 | GO:0006421 | asparaginyl-tRNA aminoacylation(GO:0006421) |
| 0.0 | 0.0 | GO:1901537 | positive regulation of DNA demethylation(GO:1901537) |
| 0.0 | 0.1 | GO:0051365 | cellular response to potassium ion starvation(GO:0051365) |
| 0.0 | 0.0 | GO:0046705 | CDP metabolic process(GO:0046704) CDP biosynthetic process(GO:0046705) |
| 0.0 | 0.4 | GO:0006749 | glutathione metabolic process(GO:0006749) |
| 0.0 | 0.1 | GO:0051028 | mRNA transport(GO:0051028) |
| 0.0 | 0.1 | GO:0031119 | tRNA pseudouridine synthesis(GO:0031119) |
| 0.0 | 0.3 | GO:0061077 | chaperone-mediated protein folding(GO:0061077) |
| 0.0 | 0.0 | GO:0034508 | centromere complex assembly(GO:0034508) |
Gene overrepresentation in cellular component category:
| Log-likelihood per target | Total log-likelihood | Term | Description |
|---|---|---|---|
| 1.6 | 4.9 | GO:0034703 | ion channel complex(GO:0034702) cation channel complex(GO:0034703) |
| 1.6 | 4.9 | GO:0005785 | signal recognition particle receptor complex(GO:0005785) |
| 1.4 | 1.4 | GO:0031312 | extrinsic component of organelle membrane(GO:0031312) |
| 1.3 | 6.5 | GO:0034657 | GID complex(GO:0034657) |
| 1.2 | 3.7 | GO:0005674 | transcription factor TFIIF complex(GO:0005674) |
| 1.2 | 22.5 | GO:0016602 | CCAAT-binding factor complex(GO:0016602) |
| 1.1 | 7.4 | GO:0000153 | cytoplasmic ubiquitin ligase complex(GO:0000153) |
| 1.0 | 6.0 | GO:0005947 | mitochondrial alpha-ketoglutarate dehydrogenase complex(GO:0005947) mitochondrial tricarboxylic acid cycle enzyme complex(GO:0030062) |
| 1.0 | 4.9 | GO:0035061 | interchromatin granule(GO:0035061) |
| 1.0 | 14.7 | GO:0005801 | cis-Golgi network(GO:0005801) |
| 1.0 | 5.9 | GO:0009986 | cell surface(GO:0009986) |
| 0.9 | 3.8 | GO:0034272 | phosphatidylinositol 3-kinase complex(GO:0005942) phosphatidylinositol 3-kinase complex, class III, type I(GO:0034271) phosphatidylinositol 3-kinase complex, class III, type II(GO:0034272) phosphatidylinositol 3-kinase complex, class III(GO:0035032) |
| 0.9 | 4.6 | GO:0009331 | glycerol-3-phosphate dehydrogenase complex(GO:0009331) |
| 0.9 | 5.4 | GO:0031205 | endoplasmic reticulum Sec complex(GO:0031205) |
| 0.9 | 5.3 | GO:0034098 | VCP-NPL4-UFD1 AAA ATPase complex(GO:0034098) |
| 0.9 | 7.8 | GO:0045252 | oxoglutarate dehydrogenase complex(GO:0045252) |
| 0.9 | 7.7 | GO:0017119 | Golgi transport complex(GO:0017119) |
| 0.9 | 2.6 | GO:0009514 | glyoxysome(GO:0009514) |
| 0.8 | 3.4 | GO:0005967 | mitochondrial pyruvate dehydrogenase complex(GO:0005967) |
| 0.8 | 6.6 | GO:0005884 | actin filament(GO:0005884) |
| 0.8 | 2.4 | GO:0030015 | CCR4-NOT core complex(GO:0030015) |
| 0.7 | 33.3 | GO:0000323 | lytic vacuole(GO:0000323) |
| 0.7 | 5.0 | GO:0090395 | plant cell papilla(GO:0090395) |
| 0.7 | 2.0 | GO:1990112 | RQC complex(GO:1990112) |
| 0.7 | 12.8 | GO:0031970 | organelle envelope lumen(GO:0031970) |
| 0.7 | 5.3 | GO:0005697 | telomerase holoenzyme complex(GO:0005697) |
| 0.7 | 12.5 | GO:0031965 | nuclear membrane(GO:0031965) |
| 0.6 | 2.5 | GO:0018444 | translation release factor complex(GO:0018444) |
| 0.6 | 4.1 | GO:0030897 | HOPS complex(GO:0030897) |
| 0.6 | 1.2 | GO:0000791 | euchromatin(GO:0000791) |
| 0.6 | 4.1 | GO:0042406 | extrinsic component of endoplasmic reticulum membrane(GO:0042406) |
| 0.6 | 3.5 | GO:0043076 | megasporocyte nucleus(GO:0043076) polar nucleus(GO:0043078) |
| 0.6 | 3.5 | GO:0038201 | TORC1 complex(GO:0031931) TOR complex(GO:0038201) |
| 0.6 | 2.9 | GO:0035861 | site of double-strand break(GO:0035861) |
| 0.6 | 9.0 | GO:0033179 | proton-transporting V-type ATPase, V0 domain(GO:0033179) |
| 0.6 | 8.3 | GO:0031231 | integral component of peroxisomal membrane(GO:0005779) intrinsic component of peroxisomal membrane(GO:0031231) |
| 0.6 | 7.2 | GO:0000815 | ESCRT III complex(GO:0000815) |
| 0.5 | 4.4 | GO:0005956 | protein kinase CK2 complex(GO:0005956) |
| 0.5 | 3.8 | GO:0071006 | U2-type catalytic step 1 spliceosome(GO:0071006) catalytic step 1 spliceosome(GO:0071012) |
| 0.5 | 3.2 | GO:0000164 | protein phosphatase type 1 complex(GO:0000164) |
| 0.5 | 5.3 | GO:0005771 | multivesicular body(GO:0005771) |
| 0.5 | 4.0 | GO:0030127 | COPII vesicle coat(GO:0030127) |
| 0.5 | 1.5 | GO:0070847 | core mediator complex(GO:0070847) |
| 0.5 | 6.8 | GO:0005793 | endoplasmic reticulum-Golgi intermediate compartment(GO:0005793) |
| 0.5 | 1.4 | GO:0030874 | nucleolar chromatin(GO:0030874) |
| 0.5 | 3.4 | GO:0033588 | Elongator holoenzyme complex(GO:0033588) |
| 0.5 | 2.9 | GO:0070552 | BRISC complex(GO:0070552) |
| 0.5 | 1.4 | GO:0098576 | integral component of lumenal side of endoplasmic reticulum membrane(GO:0071556) lumenal side of endoplasmic reticulum membrane(GO:0098553) lumenal side of membrane(GO:0098576) |
| 0.5 | 11.9 | GO:0005770 | late endosome(GO:0005770) |
| 0.5 | 2.4 | GO:0030904 | retromer complex(GO:0030904) |
| 0.5 | 2.3 | GO:0030141 | secretory granule(GO:0030141) |
| 0.5 | 2.8 | GO:0005776 | autophagosome(GO:0005776) |
| 0.5 | 3.3 | GO:0030014 | CCR4-NOT complex(GO:0030014) |
| 0.5 | 2.8 | GO:0010168 | ER body(GO:0010168) |
| 0.4 | 0.4 | GO:0030658 | transport vesicle membrane(GO:0030658) |
| 0.4 | 3.6 | GO:0005677 | chromatin silencing complex(GO:0005677) |
| 0.4 | 3.6 | GO:0031588 | nucleotide-activated protein kinase complex(GO:0031588) |
| 0.4 | 30.0 | GO:0019005 | SCF ubiquitin ligase complex(GO:0019005) |
| 0.4 | 3.5 | GO:0005834 | heterotrimeric G-protein complex(GO:0005834) |
| 0.4 | 1.6 | GO:0030677 | ribonuclease P complex(GO:0030677) |
| 0.4 | 11.3 | GO:0044463 | cell projection part(GO:0044463) |
| 0.4 | 2.7 | GO:0031372 | ubiquitin conjugating enzyme complex(GO:0031371) UBC13-MMS2 complex(GO:0031372) |
| 0.4 | 1.1 | GO:0034274 | Atg12-Atg5-Atg16 complex(GO:0034274) |
| 0.4 | 8.8 | GO:0000781 | chromosome, telomeric region(GO:0000781) |
| 0.4 | 3.3 | GO:0070062 | extracellular organelle(GO:0043230) extracellular exosome(GO:0070062) extracellular vesicle(GO:1903561) |
| 0.4 | 5.9 | GO:0070461 | SAGA-type complex(GO:0070461) |
| 0.4 | 2.2 | GO:0017053 | transcriptional repressor complex(GO:0017053) |
| 0.4 | 4.3 | GO:0031304 | intrinsic component of mitochondrial inner membrane(GO:0031304) |
| 0.3 | 3.1 | GO:0089701 | U2AF(GO:0089701) |
| 0.3 | 4.4 | GO:0031012 | extracellular matrix(GO:0031012) |
| 0.3 | 8.1 | GO:0010494 | cytoplasmic stress granule(GO:0010494) |
| 0.3 | 2.0 | GO:0016281 | eukaryotic translation initiation factor 4F complex(GO:0016281) |
| 0.3 | 1.0 | GO:0042709 | succinate-CoA ligase complex(GO:0042709) |
| 0.3 | 9.6 | GO:0030173 | integral component of Golgi membrane(GO:0030173) intrinsic component of Golgi membrane(GO:0031228) |
| 0.3 | 0.7 | GO:0045254 | pyruvate dehydrogenase complex(GO:0045254) |
| 0.3 | 4.2 | GO:0030687 | preribosome, large subunit precursor(GO:0030687) |
| 0.3 | 2.2 | GO:0005662 | DNA replication factor A complex(GO:0005662) |
| 0.3 | 0.9 | GO:0045334 | clathrin-coated endocytic vesicle(GO:0045334) |
| 0.3 | 0.9 | GO:0044614 | nuclear pore cytoplasmic filaments(GO:0044614) |
| 0.3 | 2.8 | GO:0030125 | clathrin vesicle coat(GO:0030125) |
| 0.3 | 2.5 | GO:0070390 | transcription export complex 2(GO:0070390) |
| 0.3 | 2.7 | GO:0030140 | trans-Golgi network transport vesicle(GO:0030140) |
| 0.3 | 3.3 | GO:0005675 | holo TFIIH complex(GO:0005675) carboxy-terminal domain protein kinase complex(GO:0032806) |
| 0.3 | 13.2 | GO:0016592 | mediator complex(GO:0016592) |
| 0.3 | 18.3 | GO:0000139 | Golgi membrane(GO:0000139) |
| 0.3 | 3.2 | GO:0005769 | early endosome(GO:0005769) |
| 0.3 | 6.5 | GO:0035097 | histone methyltransferase complex(GO:0035097) |
| 0.3 | 1.1 | GO:0034045 | pre-autophagosomal structure membrane(GO:0034045) |
| 0.3 | 1.4 | GO:0045239 | tricarboxylic acid cycle enzyme complex(GO:0045239) |
| 0.3 | 1.4 | GO:0071541 | eukaryotic translation initiation factor 3 complex, eIF3m(GO:0071541) |
| 0.3 | 8.7 | GO:0005838 | proteasome regulatory particle(GO:0005838) proteasome accessory complex(GO:0022624) |
| 0.3 | 1.6 | GO:0005673 | transcription factor TFIIE complex(GO:0005673) |
| 0.3 | 5.7 | GO:0031903 | peroxisomal membrane(GO:0005778) microbody membrane(GO:0031903) |
| 0.3 | 0.8 | GO:0034457 | Mpp10 complex(GO:0034457) |
| 0.3 | 2.1 | GO:0005798 | Golgi-associated vesicle(GO:0005798) |
| 0.3 | 3.1 | GO:0030119 | AP-type membrane coat adaptor complex(GO:0030119) |
| 0.3 | 0.8 | GO:0035101 | FACT complex(GO:0035101) |
| 0.3 | 5.5 | GO:0005744 | mitochondrial inner membrane presequence translocase complex(GO:0005744) |
| 0.2 | 5.5 | GO:0005736 | DNA-directed RNA polymerase I complex(GO:0005736) |
| 0.2 | 6.8 | GO:0008287 | protein serine/threonine phosphatase complex(GO:0008287) phosphatase complex(GO:1903293) |
| 0.2 | 1.9 | GO:0000312 | plastid small ribosomal subunit(GO:0000312) |
| 0.2 | 1.4 | GO:0030134 | ER to Golgi transport vesicle(GO:0030134) |
| 0.2 | 4.0 | GO:0016459 | myosin complex(GO:0016459) |
| 0.2 | 0.7 | GO:0005814 | centrosome(GO:0005813) centriole(GO:0005814) |
| 0.2 | 2.5 | GO:0008180 | COP9 signalosome(GO:0008180) |
| 0.2 | 6.1 | GO:0046540 | U4/U6 x U5 tri-snRNP complex(GO:0046540) |
| 0.2 | 0.4 | GO:0005685 | U1 snRNP(GO:0005685) |
| 0.2 | 0.9 | GO:0042721 | mitochondrial inner membrane protein insertion complex(GO:0042721) |
| 0.2 | 2.0 | GO:0005844 | polysome(GO:0005844) |
| 0.2 | 4.8 | GO:0005689 | U12-type spliceosomal complex(GO:0005689) |
| 0.2 | 3.0 | GO:0005880 | nuclear microtubule(GO:0005880) |
| 0.2 | 1.7 | GO:0008250 | oligosaccharyltransferase complex(GO:0008250) |
| 0.2 | 0.6 | GO:0031417 | N-terminal protein acetyltransferase complex(GO:0031414) NatC complex(GO:0031417) |
| 0.2 | 0.9 | GO:0009569 | chloroplast starch grain(GO:0009569) starch grain(GO:0043036) |
| 0.2 | 2.6 | GO:0019774 | proteasome core complex, beta-subunit complex(GO:0019774) |
| 0.2 | 5.7 | GO:0000932 | cytoplasmic mRNA processing body(GO:0000932) |
| 0.2 | 0.6 | GO:0097196 | Shu complex(GO:0097196) |
| 0.2 | 5.0 | GO:0000118 | histone deacetylase complex(GO:0000118) |
| 0.2 | 2.0 | GO:0071014 | post-mRNA release spliceosomal complex(GO:0071014) |
| 0.2 | 3.4 | GO:0005753 | mitochondrial proton-transporting ATP synthase complex(GO:0005753) |
| 0.2 | 2.4 | GO:0045283 | mitochondrial respiratory chain complex II, succinate dehydrogenase complex (ubiquinone)(GO:0005749) succinate dehydrogenase complex (ubiquinone)(GO:0045257) fumarate reductase complex(GO:0045283) |
| 0.2 | 0.6 | GO:0000814 | ESCRT II complex(GO:0000814) |
| 0.2 | 2.8 | GO:0005750 | mitochondrial respiratory chain complex III(GO:0005750) respiratory chain complex III(GO:0045275) |
| 0.2 | 11.4 | GO:0009707 | chloroplast outer membrane(GO:0009707) |
| 0.2 | 0.8 | GO:0000126 | transcription factor TFIIIB complex(GO:0000126) |
| 0.2 | 1.6 | GO:0000346 | transcription export complex(GO:0000346) THO complex part of transcription export complex(GO:0000445) |
| 0.2 | 12.5 | GO:0005635 | nuclear envelope(GO:0005635) |
| 0.2 | 0.6 | GO:0070993 | eukaryotic 48S preinitiation complex(GO:0033290) multi-eIF complex(GO:0043614) translation preinitiation complex(GO:0070993) |
| 0.2 | 3.7 | GO:0015629 | actin cytoskeleton(GO:0015629) |
| 0.2 | 0.7 | GO:0005672 | transcription factor TFIIA complex(GO:0005672) |
| 0.2 | 1.4 | GO:0030688 | preribosome, small subunit precursor(GO:0030688) |
| 0.2 | 0.7 | GO:0010445 | nuclear dicing body(GO:0010445) |
| 0.2 | 0.3 | GO:0055037 | recycling endosome(GO:0055037) |
| 0.2 | 2.7 | GO:0000786 | nucleosome(GO:0000786) |
| 0.2 | 1.3 | GO:0009840 | chloroplastic endopeptidase Clp complex(GO:0009840) |
| 0.2 | 8.0 | GO:0016607 | nuclear speck(GO:0016607) |
| 0.2 | 1.1 | GO:0005850 | eukaryotic translation initiation factor 2 complex(GO:0005850) |
| 0.2 | 10.3 | GO:0005746 | mitochondrial respiratory chain(GO:0005746) |
| 0.2 | 45.1 | GO:0042579 | peroxisome(GO:0005777) microbody(GO:0042579) |
| 0.2 | 1.7 | GO:0043189 | NuA4 histone acetyltransferase complex(GO:0035267) H4/H2A histone acetyltransferase complex(GO:0043189) H4 histone acetyltransferase complex(GO:1902562) |
| 0.1 | 0.7 | GO:0030867 | rough endoplasmic reticulum membrane(GO:0030867) |
| 0.1 | 4.1 | GO:0009504 | cell plate(GO:0009504) |
| 0.1 | 20.9 | GO:0000325 | plant-type vacuole(GO:0000325) |
| 0.1 | 2.6 | GO:0005666 | DNA-directed RNA polymerase III complex(GO:0005666) |
| 0.1 | 2.1 | GO:0005885 | Arp2/3 protein complex(GO:0005885) |
| 0.1 | 0.5 | GO:0033185 | mannosyltransferase complex(GO:0031501) dolichol-phosphate-mannose synthase complex(GO:0033185) |
| 0.1 | 5.5 | GO:0030176 | integral component of endoplasmic reticulum membrane(GO:0030176) |
| 0.1 | 0.8 | GO:0030915 | Smc5-Smc6 complex(GO:0030915) |
| 0.1 | 1.2 | GO:0016272 | prefoldin complex(GO:0016272) |
| 0.1 | 8.9 | GO:0005681 | spliceosomal complex(GO:0005681) |
| 0.1 | 1.0 | GO:0016593 | Cdc73/Paf1 complex(GO:0016593) |
| 0.1 | 0.6 | GO:0005851 | eukaryotic translation initiation factor 2B complex(GO:0005851) |
| 0.1 | 1.2 | GO:0031248 | protein acetyltransferase complex(GO:0031248) acetyltransferase complex(GO:1902493) |
| 0.1 | 0.3 | GO:0032301 | MutSalpha complex(GO:0032301) |
| 0.1 | 0.8 | GO:0005968 | Rab-protein geranylgeranyltransferase complex(GO:0005968) |
| 0.1 | 7.5 | GO:0099503 | secretory vesicle(GO:0099503) |
| 0.1 | 1.2 | GO:0090576 | RNA polymerase III transcription factor complex(GO:0090576) |
| 0.1 | 1.4 | GO:0031201 | SNARE complex(GO:0031201) |
| 0.1 | 0.8 | GO:0005742 | mitochondrial outer membrane translocase complex(GO:0005742) |
| 0.1 | 2.0 | GO:0005852 | eukaryotic translation initiation factor 3 complex(GO:0005852) |
| 0.1 | 17.7 | GO:0000151 | ubiquitin ligase complex(GO:0000151) |
| 0.1 | 0.4 | GO:0005853 | eukaryotic translation elongation factor 1 complex(GO:0005853) |
| 0.1 | 7.2 | GO:0005887 | integral component of plasma membrane(GO:0005887) |
| 0.1 | 1.4 | GO:0005839 | proteasome core complex(GO:0005839) |
| 0.1 | 1.5 | GO:0000145 | exocyst(GO:0000145) |
| 0.1 | 0.2 | GO:0031227 | intrinsic component of endoplasmic reticulum membrane(GO:0031227) |
| 0.1 | 2.7 | GO:0005741 | mitochondrial outer membrane(GO:0005741) |
| 0.1 | 1.1 | GO:0048471 | perinuclear region of cytoplasm(GO:0048471) |
| 0.1 | 27.9 | GO:0005774 | vacuolar membrane(GO:0005774) |
| 0.1 | 3.5 | GO:0090406 | pollen tube(GO:0090406) |
| 0.1 | 1.2 | GO:0016604 | nuclear body(GO:0016604) |
| 0.1 | 0.6 | GO:0005849 | mRNA cleavage factor complex(GO:0005849) |
| 0.1 | 3.3 | GO:0044421 | extracellular region part(GO:0044421) |
| 0.0 | 0.6 | GO:0009574 | preprophase band(GO:0009574) |
| 0.0 | 0.7 | GO:0000137 | Golgi cis cisterna(GO:0000137) |
| 0.0 | 83.1 | GO:0005886 | plasma membrane(GO:0005886) |
| 0.0 | 0.2 | GO:0032541 | cortical endoplasmic reticulum(GO:0032541) endoplasmic reticulum tubular network(GO:0071782) endoplasmic reticulum subcompartment(GO:0098827) |
| 0.0 | 0.3 | GO:0031011 | Ino80 complex(GO:0031011) DNA helicase complex(GO:0033202) |
| 0.0 | 10.1 | GO:0005783 | endoplasmic reticulum(GO:0005783) |
| 0.0 | 0.1 | GO:0002189 | ribose phosphate diphosphokinase complex(GO:0002189) |
| 0.0 | 1.8 | GO:0044217 | host(GO:0018995) host cell part(GO:0033643) host intracellular part(GO:0033646) host intracellular organelle(GO:0033647) host intracellular membrane-bounded organelle(GO:0033648) host cell nucleus(GO:0042025) intracellular region of host(GO:0043656) host cell(GO:0043657) other organism(GO:0044215) other organism cell(GO:0044216) other organism part(GO:0044217) |
| 0.0 | 0.1 | GO:0000502 | proteasome complex(GO:0000502) |
| 0.0 | 137.7 | GO:0005634 | nucleus(GO:0005634) |
Gene overrepresentation in molecular function category:
| Log-likelihood per target | Total log-likelihood | Term | Description |
|---|---|---|---|
| 2.9 | 11.6 | GO:0004352 | glutamate dehydrogenase (NAD+) activity(GO:0004352) |
| 2.8 | 11.0 | GO:0005432 | calcium:sodium antiporter activity(GO:0005432) |
| 2.7 | 2.7 | GO:0033549 | MAP kinase phosphatase activity(GO:0033549) |
| 2.5 | 7.6 | GO:1901474 | azole transmembrane transporter activity(GO:1901474) |
| 2.4 | 7.3 | GO:0003995 | acyl-CoA dehydrogenase activity(GO:0003995) |
| 2.2 | 8.9 | GO:0015603 | iron chelate transmembrane transporter activity(GO:0015603) iron-nicotianamine transmembrane transporter activity(GO:0051980) |
| 2.0 | 12.0 | GO:0050302 | aryl-aldehyde oxidase activity(GO:0018488) indole-3-acetaldehyde oxidase activity(GO:0050302) |
| 1.9 | 16.9 | GO:0010436 | carotenoid dioxygenase activity(GO:0010436) |
| 1.9 | 9.4 | GO:1902417 | (+)-abscisic acid D-glucopyranosyl ester transmembrane transporter activity(GO:1902417) |
| 1.9 | 5.6 | GO:0050736 | O-malonyltransferase activity(GO:0050736) |
| 1.8 | 7.2 | GO:0004048 | anthranilate phosphoribosyltransferase activity(GO:0004048) |
| 1.8 | 7.2 | GO:0080002 | UDP-glucose:4-aminobenzoate acylglucosyltransferase activity(GO:0080002) |
| 1.8 | 7.2 | GO:0046481 | digalactosyldiacylglycerol synthase activity(GO:0046481) |
| 1.8 | 10.6 | GO:0015193 | L-proline transmembrane transporter activity(GO:0015193) |
| 1.7 | 7.0 | GO:0070006 | metalloaminopeptidase activity(GO:0070006) |
| 1.7 | 11.8 | GO:0010279 | indole-3-acetic acid amido synthetase activity(GO:0010279) |
| 1.6 | 4.9 | GO:0050263 | uridine nucleosidase activity(GO:0045437) ribosylpyrimidine nucleosidase activity(GO:0050263) |
| 1.6 | 7.9 | GO:0046509 | 1,2-diacylglycerol 3-beta-galactosyltransferase activity(GO:0046509) |
| 1.6 | 11.0 | GO:0080061 | nitrilase activity(GO:0000257) hydrolase activity, acting on carbon-nitrogen (but not peptide) bonds, in nitriles(GO:0016815) nitrile hydratase activity(GO:0018822) indole-3-acetonitrile nitrilase activity(GO:0080061) |
| 1.5 | 6.2 | GO:0016985 | mannan endo-1,4-beta-mannosidase activity(GO:0016985) |
| 1.5 | 7.6 | GO:0010295 | (+)-abscisic acid 8'-hydroxylase activity(GO:0010295) |
| 1.4 | 4.3 | GO:0016992 | lipoate-protein ligase activity(GO:0016979) lipoate synthase activity(GO:0016992) |
| 1.4 | 10.0 | GO:0003691 | double-stranded telomeric DNA binding(GO:0003691) |
| 1.4 | 5.6 | GO:0034722 | gamma-glutamyl-peptidase activity(GO:0034722) |
| 1.4 | 5.6 | GO:0016751 | dihydrolipoyllysine-residue succinyltransferase activity(GO:0004149) succinyltransferase activity(GO:0016748) S-succinyltransferase activity(GO:0016751) |
| 1.4 | 4.1 | GO:0052901 | spermine:oxygen oxidoreductase (spermidine-forming) activity(GO:0052901) |
| 1.4 | 4.1 | GO:0050403 | trans-zeatin O-beta-D-glucosyltransferase activity(GO:0050403) cis-zeatin O-beta-D-glucosyltransferase activity(GO:0050502) |
| 1.3 | 4.0 | GO:0015185 | gamma-aminobutyric acid transmembrane transporter activity(GO:0015185) |
| 1.3 | 6.7 | GO:0008296 | 3'-5'-exodeoxyribonuclease activity(GO:0008296) |
| 1.3 | 6.7 | GO:0008309 | double-stranded DNA exodeoxyribonuclease activity(GO:0008309) |
| 1.3 | 5.3 | GO:0070034 | telomerase RNA binding(GO:0070034) |
| 1.3 | 4.0 | GO:0052725 | inositol-1,3,4-trisphosphate 6-kinase activity(GO:0052725) |
| 1.3 | 7.9 | GO:0030527 | structural constituent of chromatin(GO:0030527) |
| 1.3 | 7.8 | GO:0015369 | calcium:proton antiporter activity(GO:0015369) |
| 1.3 | 5.2 | GO:0004348 | glucosylceramidase activity(GO:0004348) |
| 1.3 | 6.4 | GO:0003863 | 3-methyl-2-oxobutanoate dehydrogenase (2-methylpropanoyl-transferring) activity(GO:0003863) |
| 1.3 | 5.1 | GO:0047782 | coniferin beta-glucosidase activity(GO:0047782) |
| 1.3 | 5.1 | GO:0015186 | L-glutamine transmembrane transporter activity(GO:0015186) |
| 1.3 | 3.8 | GO:0008898 | S-adenosylmethionine-homocysteine S-methyltransferase activity(GO:0008898) betaine-homocysteine S-methyltransferase activity(GO:0047150) |
| 1.2 | 3.7 | GO:0052692 | alpha-galactosidase activity(GO:0004557) raffinose alpha-galactosidase activity(GO:0052692) |
| 1.2 | 7.1 | GO:0004416 | hydroxyacylglutathione hydrolase activity(GO:0004416) |
| 1.1 | 6.8 | GO:0070547 | L-tyrosine:2-oxoglutarate aminotransferase activity(GO:0004838) L-tyrosine aminotransferase activity(GO:0070547) |
| 1.1 | 5.6 | GO:0005355 | glucose transmembrane transporter activity(GO:0005355) |
| 1.1 | 3.4 | GO:0070336 | Y-form DNA binding(GO:0000403) flap-structured DNA binding(GO:0070336) |
| 1.1 | 4.4 | GO:0004617 | phosphoglycerate dehydrogenase activity(GO:0004617) |
| 1.1 | 14.4 | GO:0009044 | xylan 1,4-beta-xylosidase activity(GO:0009044) |
| 1.1 | 6.6 | GO:0016312 | inositol bisphosphate phosphatase activity(GO:0016312) |
| 1.1 | 3.3 | GO:0051752 | phosphoglucan, water dikinase activity(GO:0051752) |
| 1.1 | 8.8 | GO:0009916 | alternative oxidase activity(GO:0009916) |
| 1.1 | 7.6 | GO:1990137 | plant seed peroxidase activity(GO:1990137) |
| 1.1 | 3.3 | GO:0046524 | sucrose-phosphate synthase activity(GO:0046524) |
| 1.1 | 4.3 | GO:0070401 | NADP+ binding(GO:0070401) |
| 1.1 | 5.4 | GO:0047780 | citrate dehydratase activity(GO:0047780) |
| 1.0 | 10.5 | GO:0008113 | peptide-methionine (S)-S-oxide reductase activity(GO:0008113) |
| 1.0 | 15.6 | GO:0003978 | UDP-glucose 4-epimerase activity(GO:0003978) |
| 1.0 | 3.1 | GO:0010297 | heteropolysaccharide binding(GO:0010297) |
| 1.0 | 4.1 | GO:0080042 | ADP-glucose pyrophosphohydrolase activity(GO:0080042) |
| 1.0 | 4.1 | GO:0008301 | DNA binding, bending(GO:0008301) |
| 1.0 | 2.0 | GO:0032452 | histone demethylase activity(GO:0032452) |
| 1.0 | 5.0 | GO:0033897 | ribonuclease T2 activity(GO:0033897) |
| 1.0 | 4.9 | GO:0004028 | 3-chloroallyl aldehyde dehydrogenase activity(GO:0004028) |
| 1.0 | 2.9 | GO:0016726 | oxidoreductase activity, acting on CH or CH2 groups, NAD or NADP as acceptor(GO:0016726) |
| 1.0 | 2.9 | GO:0015292 | uniporter activity(GO:0015292) |
| 0.9 | 3.8 | GO:0004307 | ethanolaminephosphotransferase activity(GO:0004307) |
| 0.9 | 9.4 | GO:0004602 | glutathione peroxidase activity(GO:0004602) |
| 0.9 | 6.6 | GO:0004356 | glutamate-ammonia ligase activity(GO:0004356) |
| 0.9 | 4.6 | GO:0010277 | chlorophyllide a oxygenase [overall] activity(GO:0010277) |
| 0.9 | 6.4 | GO:1901618 | organic hydroxy compound transmembrane transporter activity(GO:1901618) |
| 0.9 | 2.6 | GO:0004788 | thiamine diphosphokinase activity(GO:0004788) thiamine binding(GO:0030975) |
| 0.9 | 3.5 | GO:0015175 | neutral amino acid transmembrane transporter activity(GO:0015175) |
| 0.9 | 2.6 | GO:0015117 | thiosulfate transmembrane transporter activity(GO:0015117) |
| 0.8 | 5.9 | GO:0008022 | protein C-terminus binding(GO:0008022) |
| 0.8 | 0.8 | GO:0051019 | mitogen-activated protein kinase binding(GO:0051019) |
| 0.8 | 2.4 | GO:0016661 | oxidoreductase activity, acting on other nitrogenous compounds as donors(GO:0016661) |
| 0.8 | 3.2 | GO:0080103 | 4-methylthiopropyl glucosinolate S-oxygenase activity(GO:0080103) |
| 0.8 | 4.0 | GO:0036440 | citrate (Si)-synthase activity(GO:0004108) citrate synthase activity(GO:0036440) |
| 0.8 | 3.2 | GO:0033764 | steroid dehydrogenase activity, acting on the CH-OH group of donors, NAD or NADP as acceptor(GO:0033764) |
| 0.8 | 2.4 | GO:0019776 | Atg8 ligase activity(GO:0019776) |
| 0.8 | 2.3 | GO:0005458 | GDP-mannose transmembrane transporter activity(GO:0005458) |
| 0.8 | 10.1 | GO:0004714 | transmembrane receptor protein tyrosine kinase activity(GO:0004714) |
| 0.8 | 5.4 | GO:0017112 | Rab guanyl-nucleotide exchange factor activity(GO:0017112) |
| 0.8 | 5.4 | GO:0016812 | hydrolase activity, acting on carbon-nitrogen (but not peptide) bonds, in cyclic amides(GO:0016812) |
| 0.8 | 5.3 | GO:0050551 | myrcene synthase activity(GO:0050551) |
| 0.8 | 2.3 | GO:0010354 | homogentisate prenyltransferase activity(GO:0010354) |
| 0.8 | 3.0 | GO:1990381 | ubiquitin-specific protease binding(GO:1990381) |
| 0.8 | 2.3 | GO:0003986 | acetyl-CoA hydrolase activity(GO:0003986) |
| 0.8 | 6.1 | GO:0004143 | diacylglycerol kinase activity(GO:0004143) |
| 0.8 | 11.4 | GO:0004427 | inorganic diphosphatase activity(GO:0004427) |
| 0.8 | 5.3 | GO:0004345 | glucose-6-phosphate dehydrogenase activity(GO:0004345) |
| 0.8 | 11.3 | GO:0016157 | sucrose synthase activity(GO:0016157) |
| 0.7 | 0.7 | GO:0080107 | 8-methylthiopropyl glucosinolate S-oxygenase activity(GO:0080107) |
| 0.7 | 2.9 | GO:0004737 | pyruvate decarboxylase activity(GO:0004737) |
| 0.7 | 2.9 | GO:0003919 | FMN adenylyltransferase activity(GO:0003919) |
| 0.7 | 3.6 | GO:0016629 | 12-oxophytodienoate reductase activity(GO:0016629) |
| 0.7 | 3.5 | GO:0042800 | histone methyltransferase activity (H3-K4 specific)(GO:0042800) |
| 0.7 | 39.0 | GO:0061631 | ubiquitin conjugating enzyme activity(GO:0061631) |
| 0.7 | 3.5 | GO:0001664 | G-protein coupled receptor binding(GO:0001664) G-protein beta/gamma-subunit complex binding(GO:0031683) |
| 0.7 | 2.8 | GO:0010296 | prenylcysteine methylesterase activity(GO:0010296) |
| 0.7 | 12.1 | GO:0070122 | isopeptidase activity(GO:0070122) |
| 0.7 | 2.0 | GO:0052629 | phosphatidylinositol-3-phosphatase activity(GO:0004438) phosphatidylinositol-3,5-bisphosphate 3-phosphatase activity(GO:0052629) |
| 0.7 | 3.3 | GO:0022842 | leak channel activity(GO:0022840) potassium ion leak channel activity(GO:0022841) narrow pore channel activity(GO:0022842) |
| 0.7 | 2.6 | GO:0030410 | nicotianamine synthase activity(GO:0030410) |
| 0.7 | 0.7 | GO:0015141 | succinate transmembrane transporter activity(GO:0015141) |
| 0.7 | 7.2 | GO:0102360 | daphnetin 3-O-glucosyltransferase activity(GO:0102360) |
| 0.7 | 2.0 | GO:0016262 | protein N-acetylglucosaminyltransferase activity(GO:0016262) |
| 0.7 | 2.0 | GO:0001054 | RNA polymerase I activity(GO:0001054) RNA polymerase III activity(GO:0001056) |
| 0.6 | 46.4 | GO:0004197 | cysteine-type endopeptidase activity(GO:0004197) |
| 0.6 | 3.8 | GO:0048038 | quinone binding(GO:0048038) |
| 0.6 | 3.2 | GO:0016530 | metallochaperone activity(GO:0016530) |
| 0.6 | 1.9 | GO:0019781 | NEDD8 activating enzyme activity(GO:0019781) |
| 0.6 | 3.2 | GO:0015203 | polyamine transmembrane transporter activity(GO:0015203) |
| 0.6 | 2.5 | GO:0030742 | GTP-dependent protein binding(GO:0030742) |
| 0.6 | 2.5 | GO:0004792 | thiosulfate sulfurtransferase activity(GO:0004792) |
| 0.6 | 1.9 | GO:0004046 | aminoacylase activity(GO:0004046) |
| 0.6 | 3.1 | GO:0004392 | heme oxygenase (decyclizing) activity(GO:0004392) |
| 0.6 | 5.6 | GO:0043023 | ribosomal large subunit binding(GO:0043023) |
| 0.6 | 1.9 | GO:1990380 | Lys48-specific deubiquitinase activity(GO:1990380) |
| 0.6 | 3.7 | GO:0003841 | 1-acylglycerol-3-phosphate O-acyltransferase activity(GO:0003841) lysophosphatidic acid acyltransferase activity(GO:0042171) |
| 0.6 | 4.3 | GO:0004069 | L-aspartate:2-oxoglutarate aminotransferase activity(GO:0004069) |
| 0.6 | 4.3 | GO:0004366 | glycerol-3-phosphate O-acyltransferase activity(GO:0004366) |
| 0.6 | 4.2 | GO:0008157 | protein phosphatase 1 binding(GO:0008157) |
| 0.6 | 4.2 | GO:0019139 | cytokinin dehydrogenase activity(GO:0019139) |
| 0.6 | 5.4 | GO:0004161 | dimethylallyltranstransferase activity(GO:0004161) |
| 0.6 | 1.8 | GO:0008265 | Mo-molybdopterin cofactor sulfurase activity(GO:0008265) |
| 0.6 | 2.4 | GO:0050284 | sinapate 1-glucosyltransferase activity(GO:0050284) |
| 0.6 | 1.8 | GO:0045140 | inositol phosphoceramide synthase activity(GO:0045140) |
| 0.6 | 3.5 | GO:0005483 | soluble NSF attachment protein activity(GO:0005483) |
| 0.6 | 4.0 | GO:0052853 | very-long-chain-(S)-2-hydroxy-acid oxidase activity(GO:0052852) long-chain-(S)-2-hydroxy-long-chain-acid oxidase activity(GO:0052853) medium-chain-(S)-2-hydroxy-acid oxidase activity(GO:0052854) |
| 0.6 | 2.9 | GO:0036374 | peptidyltransferase activity(GO:0000048) glutathione hydrolase activity(GO:0036374) |
| 0.6 | 6.2 | GO:0008107 | galactoside 2-alpha-L-fucosyltransferase activity(GO:0008107) alpha-(1,2)-fucosyltransferase activity(GO:0031127) |
| 0.6 | 2.8 | GO:0004793 | threonine aldolase activity(GO:0004793) L-allo-threonine aldolase activity(GO:0008732) |
| 0.6 | 7.3 | GO:0019902 | phosphatase binding(GO:0019902) |
| 0.6 | 2.2 | GO:0050291 | sphingosine N-acyltransferase activity(GO:0050291) |
| 0.6 | 2.2 | GO:0004367 | glycerol-3-phosphate dehydrogenase [NAD+] activity(GO:0004367) |
| 0.6 | 9.4 | GO:0008559 | xenobiotic-transporting ATPase activity(GO:0008559) |
| 0.5 | 6.5 | GO:0016813 | hydrolase activity, acting on carbon-nitrogen (but not peptide) bonds, in linear amidines(GO:0016813) |
| 0.5 | 5.4 | GO:0004351 | glutamate decarboxylase activity(GO:0004351) |
| 0.5 | 3.2 | GO:0004449 | isocitrate dehydrogenase (NAD+) activity(GO:0004449) |
| 0.5 | 10.2 | GO:0004864 | protein phosphatase inhibitor activity(GO:0004864) |
| 0.5 | 1.6 | GO:0036402 | proteasome-activating ATPase activity(GO:0036402) |
| 0.5 | 3.2 | GO:0017070 | U6 snRNA binding(GO:0017070) |
| 0.5 | 5.4 | GO:0005086 | ARF guanyl-nucleotide exchange factor activity(GO:0005086) |
| 0.5 | 6.4 | GO:0003950 | NAD+ ADP-ribosyltransferase activity(GO:0003950) |
| 0.5 | 3.7 | GO:0005459 | UDP-galactose transmembrane transporter activity(GO:0005459) |
| 0.5 | 6.4 | GO:0003996 | acyl-CoA ligase activity(GO:0003996) decanoate--CoA ligase activity(GO:0102391) |
| 0.5 | 1.1 | GO:0015116 | sulfate transmembrane transporter activity(GO:0015116) |
| 0.5 | 2.6 | GO:0043682 | copper-transporting ATPase activity(GO:0043682) |
| 0.5 | 4.7 | GO:0047216 | inositol 3-alpha-galactosyltransferase activity(GO:0047216) |
| 0.5 | 2.1 | GO:0052743 | inositol-polyphosphate 5-phosphatase activity(GO:0004445) inositol-1,3,4,5-tetrakisphosphate 5-phosphatase activity(GO:0052659) inositol tetrakisphosphate phosphatase activity(GO:0052743) |
| 0.5 | 1.6 | GO:0000170 | sphingosine hydroxylase activity(GO:0000170) |
| 0.5 | 1.6 | GO:0016906 | sterol 3-beta-glucosyltransferase activity(GO:0016906) |
| 0.5 | 8.7 | GO:0004630 | phospholipase D activity(GO:0004630) N-acylphosphatidylethanolamine-specific phospholipase D activity(GO:0070290) |
| 0.5 | 3.1 | GO:0009041 | uridylate kinase activity(GO:0009041) |
| 0.5 | 2.0 | GO:0070405 | ammonium ion binding(GO:0070405) |
| 0.5 | 2.0 | GO:0005247 | voltage-gated chloride channel activity(GO:0005247) chloride channel activity(GO:0005254) |
| 0.5 | 3.5 | GO:0015391 | nucleobase:cation symporter activity(GO:0015391) |
| 0.5 | 5.5 | GO:0034647 | histone demethylase activity (H3-K4 specific)(GO:0032453) histone demethylase activity (H3-trimethyl-K4 specific)(GO:0034647) |
| 0.5 | 3.5 | GO:0001653 | peptide receptor activity(GO:0001653) |
| 0.5 | 2.5 | GO:0050113 | inositol oxygenase activity(GO:0050113) |
| 0.5 | 3.5 | GO:0004834 | tryptophan synthase activity(GO:0004834) |
| 0.5 | 15.9 | GO:0004725 | protein tyrosine phosphatase activity(GO:0004725) |
| 0.5 | 1.5 | GO:0004014 | adenosylmethionine decarboxylase activity(GO:0004014) |
| 0.5 | 4.5 | GO:0030291 | cyclin-dependent protein serine/threonine kinase inhibitor activity(GO:0004861) protein serine/threonine kinase inhibitor activity(GO:0030291) |
| 0.5 | 1.5 | GO:0051669 | levanase activity(GO:0031219) fructan beta-fructosidase activity(GO:0051669) |
| 0.5 | 5.9 | GO:0015112 | nitrate transmembrane transporter activity(GO:0015112) |
| 0.5 | 2.0 | GO:0005315 | inorganic phosphate transmembrane transporter activity(GO:0005315) |
| 0.5 | 20.6 | GO:0015081 | sodium ion transmembrane transporter activity(GO:0015081) |
| 0.5 | 1.9 | GO:0004679 | AMP-activated protein kinase activity(GO:0004679) |
| 0.5 | 3.8 | GO:0004566 | beta-glucuronidase activity(GO:0004566) |
| 0.5 | 2.9 | GO:0008728 | GTP diphosphokinase activity(GO:0008728) |
| 0.5 | 2.4 | GO:0004535 | poly(A)-specific ribonuclease activity(GO:0004535) |
| 0.5 | 4.7 | GO:0008199 | ferric iron binding(GO:0008199) |
| 0.5 | 6.6 | GO:0004709 | MAP kinase kinase kinase activity(GO:0004709) |
| 0.5 | 3.7 | GO:0017169 | CDP-alcohol phosphatidyltransferase activity(GO:0017169) |
| 0.5 | 4.7 | GO:0035252 | UDP-xylosyltransferase activity(GO:0035252) |
| 0.5 | 10.2 | GO:0004866 | endopeptidase inhibitor activity(GO:0004866) |
| 0.5 | 1.4 | GO:0016504 | peptidase activator activity(GO:0016504) |
| 0.5 | 3.2 | GO:0008239 | dipeptidyl-peptidase activity(GO:0008239) |
| 0.5 | 1.4 | GO:0043812 | phosphatidylinositol phosphate 4-phosphatase activity(GO:0034596) phosphatidylinositol-4-phosphate phosphatase activity(GO:0043812) phosphatidylinositol monophosphate phosphatase activity(GO:0052744) |
| 0.5 | 3.6 | GO:0043995 | histone acetyltransferase activity (H4-K5 specific)(GO:0043995) |
| 0.5 | 1.8 | GO:0016656 | monodehydroascorbate reductase (NADH) activity(GO:0016656) |
| 0.4 | 10.8 | GO:0031386 | protein tag(GO:0031386) |
| 0.4 | 2.7 | GO:0001102 | RNA polymerase II activating transcription factor binding(GO:0001102) |
| 0.4 | 2.2 | GO:0005544 | calcium-dependent phospholipid binding(GO:0005544) |
| 0.4 | 0.9 | GO:0052578 | sesquiterpene synthase activity(GO:0010334) alpha-farnesene synthase activity(GO:0052578) |
| 0.4 | 2.2 | GO:0038199 | ethylene receptor activity(GO:0038199) ethylene binding(GO:0051740) alkene binding(GO:0072328) |
| 0.4 | 1.7 | GO:0009882 | blue light photoreceptor activity(GO:0009882) |
| 0.4 | 7.3 | GO:0015217 | ADP transmembrane transporter activity(GO:0015217) |
| 0.4 | 3.0 | GO:0001671 | ATPase activator activity(GO:0001671) |
| 0.4 | 1.7 | GO:0004647 | phosphoserine phosphatase activity(GO:0004647) |
| 0.4 | 1.7 | GO:0017110 | nucleoside-diphosphatase activity(GO:0017110) |
| 0.4 | 1.7 | GO:0046423 | allene-oxide cyclase activity(GO:0046423) |
| 0.4 | 6.6 | GO:0008515 | sucrose transmembrane transporter activity(GO:0008515) |
| 0.4 | 2.9 | GO:0005047 | signal recognition particle binding(GO:0005047) |
| 0.4 | 1.2 | GO:0070678 | preprotein binding(GO:0070678) |
| 0.4 | 2.0 | GO:1990825 | sequence-specific mRNA binding(GO:1990825) |
| 0.4 | 7.3 | GO:0004022 | alcohol dehydrogenase (NAD) activity(GO:0004022) |
| 0.4 | 3.3 | GO:0004715 | non-membrane spanning protein tyrosine kinase activity(GO:0004715) |
| 0.4 | 1.6 | GO:0048030 | disaccharide binding(GO:0048030) maltose binding(GO:1901982) |
| 0.4 | 13.8 | GO:0008553 | hydrogen-exporting ATPase activity, phosphorylative mechanism(GO:0008553) |
| 0.4 | 3.9 | GO:0035198 | miRNA binding(GO:0035198) |
| 0.4 | 0.8 | GO:0030332 | cyclin binding(GO:0030332) |
| 0.4 | 1.5 | GO:0004751 | ribose-5-phosphate isomerase activity(GO:0004751) |
| 0.4 | 6.9 | GO:0005384 | manganese ion transmembrane transporter activity(GO:0005384) |
| 0.4 | 4.2 | GO:0004713 | protein tyrosine kinase activity(GO:0004713) |
| 0.4 | 3.4 | GO:0003955 | NAD(P)H dehydrogenase (quinone) activity(GO:0003955) |
| 0.4 | 2.6 | GO:0003872 | 6-phosphofructokinase activity(GO:0003872) |
| 0.4 | 42.0 | GO:0004722 | protein serine/threonine phosphatase activity(GO:0004722) |
| 0.4 | 19.8 | GO:0035091 | phosphatidylinositol binding(GO:0035091) |
| 0.4 | 1.5 | GO:0031516 | far-red light photoreceptor activity(GO:0031516) |
| 0.4 | 8.1 | GO:0031491 | nucleosome binding(GO:0031491) |
| 0.4 | 14.3 | GO:0004702 | receptor signaling protein serine/threonine kinase activity(GO:0004702) |
| 0.4 | 6.2 | GO:0035064 | methylated histone binding(GO:0035064) |
| 0.4 | 2.2 | GO:0030544 | Hsp70 protein binding(GO:0030544) |
| 0.4 | 1.1 | GO:0000179 | rRNA (adenine-N6,N6-)-dimethyltransferase activity(GO:0000179) |
| 0.4 | 20.4 | GO:0005096 | GTPase activator activity(GO:0005096) |
| 0.4 | 1.4 | GO:0000268 | peroxisome targeting sequence binding(GO:0000268) |
| 0.3 | 1.0 | GO:0008821 | crossover junction endodeoxyribonuclease activity(GO:0008821) |
| 0.3 | 2.0 | GO:0003954 | NADH dehydrogenase activity(GO:0003954) |
| 0.3 | 3.4 | GO:0004435 | phosphatidylinositol phospholipase C activity(GO:0004435) |
| 0.3 | 1.0 | GO:0004774 | succinate-CoA ligase activity(GO:0004774) succinate-CoA ligase (ADP-forming) activity(GO:0004775) succinate-CoA ligase (GDP-forming) activity(GO:0004776) |
| 0.3 | 1.0 | GO:0047209 | coniferyl-alcohol glucosyltransferase activity(GO:0047209) |
| 0.3 | 1.0 | GO:0010331 | gibberellin binding(GO:0010331) |
| 0.3 | 1.6 | GO:0004325 | ferrochelatase activity(GO:0004325) |
| 0.3 | 2.0 | GO:0047627 | hydrolase activity, acting on acid anhydrides, in sulfonyl-containing anhydrides(GO:0016819) adenylylsulfatase activity(GO:0047627) |
| 0.3 | 113.6 | GO:0019787 | ubiquitin-like protein transferase activity(GO:0019787) |
| 0.3 | 2.2 | GO:0032977 | membrane insertase activity(GO:0032977) |
| 0.3 | 0.6 | GO:0047635 | L-alanine:2-oxoglutarate aminotransferase activity(GO:0004021) alanine-oxo-acid transaminase activity(GO:0047635) |
| 0.3 | 1.3 | GO:0000035 | acyl binding(GO:0000035) |
| 0.3 | 4.8 | GO:0008195 | phosphatidate phosphatase activity(GO:0008195) |
| 0.3 | 2.5 | GO:0002020 | protease binding(GO:0002020) |
| 0.3 | 12.0 | GO:0003993 | acid phosphatase activity(GO:0003993) |
| 0.3 | 2.8 | GO:0051747 | cytosine C-5 DNA demethylase activity(GO:0051747) |
| 0.3 | 0.9 | GO:0035615 | clathrin adaptor activity(GO:0035615) endocytic adaptor activity(GO:0098748) |
| 0.3 | 1.6 | GO:0046577 | long-chain-alcohol oxidase activity(GO:0046577) |
| 0.3 | 15.4 | GO:0042910 | xenobiotic transporter activity(GO:0042910) |
| 0.3 | 2.5 | GO:0008453 | alanine-glyoxylate transaminase activity(GO:0008453) |
| 0.3 | 1.6 | GO:0030371 | translation repressor activity(GO:0030371) |
| 0.3 | 16.1 | GO:0008234 | cysteine-type peptidase activity(GO:0008234) |
| 0.3 | 4.2 | GO:0046961 | proton-transporting ATPase activity, rotational mechanism(GO:0046961) |
| 0.3 | 0.9 | GO:0030943 | mitochondrion targeting sequence binding(GO:0030943) |
| 0.3 | 36.6 | GO:0046982 | protein heterodimerization activity(GO:0046982) |
| 0.3 | 2.1 | GO:0070905 | glycine hydroxymethyltransferase activity(GO:0004372) serine binding(GO:0070905) |
| 0.3 | 1.8 | GO:0004362 | glutathione-disulfide reductase activity(GO:0004362) |
| 0.3 | 0.9 | GO:0010385 | double-stranded methylated DNA binding(GO:0010385) |
| 0.3 | 12.2 | GO:0003713 | transcription coactivator activity(GO:0003713) |
| 0.3 | 0.9 | GO:0004618 | phosphoglycerate kinase activity(GO:0004618) |
| 0.3 | 2.3 | GO:0004738 | pyruvate dehydrogenase activity(GO:0004738) |
| 0.3 | 0.9 | GO:0015296 | anion:cation symporter activity(GO:0015296) cation:chloride symporter activity(GO:0015377) |
| 0.3 | 2.0 | GO:0010178 | IAA-amino acid conjugate hydrolase activity(GO:0010178) |
| 0.3 | 1.9 | GO:0043047 | single-stranded telomeric DNA binding(GO:0043047) sequence-specific single stranded DNA binding(GO:0098847) |
| 0.3 | 1.4 | GO:0004333 | fumarate hydratase activity(GO:0004333) |
| 0.3 | 0.8 | GO:0004488 | methenyltetrahydrofolate cyclohydrolase activity(GO:0004477) methylenetetrahydrofolate dehydrogenase (NADP+) activity(GO:0004488) |
| 0.3 | 12.9 | GO:0001228 | transcriptional activator activity, RNA polymerase II transcription regulatory region sequence-specific binding(GO:0001228) |
| 0.3 | 3.5 | GO:0052742 | phosphatidylinositol kinase activity(GO:0052742) |
| 0.3 | 1.6 | GO:0052654 | L-leucine transaminase activity(GO:0052654) L-valine transaminase activity(GO:0052655) L-isoleucine transaminase activity(GO:0052656) |
| 0.3 | 1.9 | GO:0003997 | acyl-CoA oxidase activity(GO:0003997) |
| 0.3 | 4.0 | GO:0000993 | RNA polymerase II core binding(GO:0000993) |
| 0.3 | 1.6 | GO:0005388 | calcium-transporting ATPase activity(GO:0005388) |
| 0.3 | 1.1 | GO:0004829 | threonine-tRNA ligase activity(GO:0004829) |
| 0.3 | 16.1 | GO:0043130 | ubiquitin binding(GO:0043130) |
| 0.3 | 2.9 | GO:0019905 | syntaxin binding(GO:0019905) |
| 0.3 | 3.1 | GO:0030628 | pre-mRNA 3'-splice site binding(GO:0030628) |
| 0.3 | 3.5 | GO:0008889 | glycerophosphodiester phosphodiesterase activity(GO:0008889) |
| 0.3 | 3.5 | GO:0015095 | magnesium ion transmembrane transporter activity(GO:0015095) |
| 0.3 | 1.0 | GO:0008253 | 5'-nucleotidase activity(GO:0008253) |
| 0.3 | 1.0 | GO:0008251 | adenosine deaminase activity(GO:0004000) tRNA-specific adenosine deaminase activity(GO:0008251) |
| 0.2 | 20.2 | GO:0003712 | transcription factor activity, transcription factor binding(GO:0000989) transcription cofactor activity(GO:0003712) |
| 0.2 | 1.0 | GO:0004821 | histidine-tRNA ligase activity(GO:0004821) |
| 0.2 | 5.7 | GO:0008066 | glutamate receptor activity(GO:0008066) |
| 0.2 | 1.0 | GO:0015018 | galactosylgalactosylxylosylprotein 3-beta-glucuronosyltransferase activity(GO:0015018) |
| 0.2 | 11.9 | GO:0004712 | protein serine/threonine/tyrosine kinase activity(GO:0004712) |
| 0.2 | 1.2 | GO:0016653 | oxidoreductase activity, acting on NAD(P)H, heme protein as acceptor(GO:0016653) |
| 0.2 | 1.2 | GO:0050664 | NAD(P)H oxidase activity(GO:0016174) oxidoreductase activity, acting on NAD(P)H, oxygen as acceptor(GO:0050664) |
| 0.2 | 4.7 | GO:0005385 | zinc ion transmembrane transporter activity(GO:0005385) |
| 0.2 | 1.4 | GO:0009884 | cytokinin receptor activity(GO:0009884) |
| 0.2 | 0.9 | GO:0016165 | linoleate 13S-lipoxygenase activity(GO:0016165) |
| 0.2 | 3.7 | GO:0031369 | translation initiation factor binding(GO:0031369) |
| 0.2 | 3.0 | GO:0003746 | translation elongation factor activity(GO:0003746) |
| 0.2 | 1.8 | GO:0009815 | 1-aminocyclopropane-1-carboxylate oxidase activity(GO:0009815) |
| 0.2 | 3.2 | GO:0004575 | sucrose alpha-glucosidase activity(GO:0004575) |
| 0.2 | 0.4 | GO:0036002 | pre-mRNA binding(GO:0036002) |
| 0.2 | 2.2 | GO:0047372 | acylglycerol lipase activity(GO:0047372) |
| 0.2 | 1.1 | GO:0004594 | pantothenate kinase activity(GO:0004594) |
| 0.2 | 3.0 | GO:0004144 | diacylglycerol O-acyltransferase activity(GO:0004144) |
| 0.2 | 0.9 | GO:0004335 | galactokinase activity(GO:0004335) |
| 0.2 | 14.8 | GO:0019900 | kinase binding(GO:0019900) |
| 0.2 | 0.9 | GO:0019156 | isoamylase activity(GO:0019156) |
| 0.2 | 1.1 | GO:0004148 | dihydrolipoyl dehydrogenase activity(GO:0004148) |
| 0.2 | 0.4 | GO:0051731 | polynucleotide 5'-hydroxyl-kinase activity(GO:0051731) |
| 0.2 | 3.2 | GO:0008143 | poly(A) binding(GO:0008143) |
| 0.2 | 29.1 | GO:0019001 | GTP binding(GO:0005525) guanyl nucleotide binding(GO:0019001) guanyl ribonucleotide binding(GO:0032561) |
| 0.2 | 2.9 | GO:0015020 | glucuronosyltransferase activity(GO:0015020) |
| 0.2 | 0.4 | GO:0008517 | folic acid transporter activity(GO:0008517) |
| 0.2 | 0.6 | GO:0045430 | chalcone isomerase activity(GO:0045430) |
| 0.2 | 11.0 | GO:0005484 | SNAP receptor activity(GO:0005484) |
| 0.2 | 2.0 | GO:0005375 | copper ion transmembrane transporter activity(GO:0005375) |
| 0.2 | 2.2 | GO:0047617 | acyl-CoA hydrolase activity(GO:0047617) |
| 0.2 | 0.8 | GO:0015924 | mannosyl-oligosaccharide mannosidase activity(GO:0015924) |
| 0.2 | 1.0 | GO:0098599 | palmitoyl hydrolase activity(GO:0098599) |
| 0.2 | 0.6 | GO:0032182 | ubiquitin-like protein binding(GO:0032182) |
| 0.2 | 2.6 | GO:0060090 | binding, bridging(GO:0060090) |
| 0.2 | 2.7 | GO:0016645 | oxidoreductase activity, acting on the CH-NH group of donors(GO:0016645) |
| 0.2 | 0.4 | GO:0052592 | oxidoreductase activity, acting on CH or CH2 groups, with an iron-sulfur protein as acceptor(GO:0052592) |
| 0.2 | 0.7 | GO:0004556 | alpha-amylase activity(GO:0004556) |
| 0.2 | 0.9 | GO:0004930 | G-protein coupled receptor activity(GO:0004930) |
| 0.2 | 0.9 | GO:0005049 | nuclear export signal receptor activity(GO:0005049) |
| 0.2 | 3.8 | GO:0080031 | methyl salicylate esterase activity(GO:0080031) methyl jasmonate esterase activity(GO:0080032) |
| 0.2 | 0.7 | GO:0004113 | cyclic-nucleotide phosphodiesterase activity(GO:0004112) 2',3'-cyclic-nucleotide 3'-phosphodiesterase activity(GO:0004113) |
| 0.2 | 1.9 | GO:0048040 | UDP-glucuronate decarboxylase activity(GO:0048040) |
| 0.2 | 1.7 | GO:0016702 | oxidoreductase activity, acting on single donors with incorporation of molecular oxygen, incorporation of two atoms of oxygen(GO:0016702) |
| 0.2 | 2.4 | GO:0034594 | phosphatidylinositol trisphosphate phosphatase activity(GO:0034594) |
| 0.2 | 1.8 | GO:0015662 | ATPase activity, coupled to transmembrane movement of ions, phosphorylative mechanism(GO:0015662) |
| 0.2 | 8.8 | GO:0004683 | calmodulin-dependent protein kinase activity(GO:0004683) |
| 0.2 | 9.8 | GO:0004364 | glutathione transferase activity(GO:0004364) |
| 0.2 | 2.4 | GO:0031543 | peptidyl-proline dioxygenase activity(GO:0031543) |
| 0.2 | 1.0 | GO:0001727 | lipid kinase activity(GO:0001727) |
| 0.2 | 1.0 | GO:0043878 | glyceraldehyde-3-phosphate dehydrogenase (NAD+) (non-phosphorylating) activity(GO:0043878) |
| 0.2 | 5.3 | GO:0016760 | cellulose synthase (UDP-forming) activity(GO:0016760) |
| 0.2 | 2.6 | GO:0016790 | thiolester hydrolase activity(GO:0016790) |
| 0.2 | 2.0 | GO:0017069 | snRNA binding(GO:0017069) |
| 0.2 | 0.5 | GO:1990259 | protein-glutamine N-methyltransferase activity(GO:0036009) histone-glutamine methyltransferase activity(GO:1990259) |
| 0.1 | 6.1 | GO:0000156 | phosphorelay response regulator activity(GO:0000156) |
| 0.1 | 1.2 | GO:0010997 | anaphase-promoting complex binding(GO:0010997) |
| 0.1 | 0.6 | GO:0046537 | 2,3-bisphosphoglycerate-independent phosphoglycerate mutase activity(GO:0046537) |
| 0.1 | 2.8 | GO:0019208 | phosphatase regulator activity(GO:0019208) protein phosphatase regulator activity(GO:0019888) |
| 0.1 | 1.5 | GO:0005504 | fatty acid binding(GO:0005504) |
| 0.1 | 1.5 | GO:0008139 | nuclear localization sequence binding(GO:0008139) |
| 0.1 | 0.6 | GO:0004385 | guanylate kinase activity(GO:0004385) |
| 0.1 | 1.5 | GO:0047938 | glucose-6-phosphate 1-epimerase activity(GO:0047938) |
| 0.1 | 0.5 | GO:0004582 | dolichyl-phosphate beta-D-mannosyltransferase activity(GO:0004582) |
| 0.1 | 0.7 | GO:0043024 | ribosomal small subunit binding(GO:0043024) |
| 0.1 | 0.5 | GO:0001099 | basal transcription machinery binding(GO:0001098) basal RNA polymerase II transcription machinery binding(GO:0001099) |
| 0.1 | 0.5 | GO:0003951 | NAD+ kinase activity(GO:0003951) |
| 0.1 | 0.8 | GO:0070300 | phosphatidic acid binding(GO:0070300) |
| 0.1 | 0.7 | GO:0001046 | core promoter sequence-specific DNA binding(GO:0001046) core promoter binding(GO:0001047) |
| 0.1 | 5.0 | GO:0051536 | iron-sulfur cluster binding(GO:0051536) metal cluster binding(GO:0051540) |
| 0.1 | 0.5 | GO:0015245 | fatty acid transporter activity(GO:0015245) |
| 0.1 | 1.3 | GO:0016863 | intramolecular oxidoreductase activity, transposing C=C bonds(GO:0016863) |
| 0.1 | 2.8 | GO:0051119 | sugar transmembrane transporter activity(GO:0051119) |
| 0.1 | 9.4 | GO:0003924 | GTPase activity(GO:0003924) |
| 0.1 | 0.9 | GO:0031490 | chromatin DNA binding(GO:0031490) |
| 0.1 | 1.2 | GO:0051879 | Hsp90 protein binding(GO:0051879) |
| 0.1 | 15.9 | GO:0003779 | actin binding(GO:0003779) |
| 0.1 | 1.6 | GO:0052747 | sinapyl alcohol dehydrogenase activity(GO:0052747) |
| 0.1 | 17.7 | GO:0005516 | calmodulin binding(GO:0005516) |
| 0.1 | 1.7 | GO:0031420 | pyruvate kinase activity(GO:0004743) potassium ion binding(GO:0030955) alkali metal ion binding(GO:0031420) |
| 0.1 | 0.3 | GO:0032143 | single base insertion or deletion binding(GO:0032138) single thymine insertion binding(GO:0032143) mismatch repair complex binding(GO:0032404) MutLalpha complex binding(GO:0032405) |
| 0.1 | 0.3 | GO:0008883 | glutamyl-tRNA reductase activity(GO:0008883) |
| 0.1 | 0.3 | GO:0051765 | inositol tetrakisphosphate kinase activity(GO:0051765) |
| 0.1 | 2.2 | GO:0017137 | Rab GTPase binding(GO:0017137) |
| 0.1 | 30.9 | GO:0004674 | protein serine/threonine kinase activity(GO:0004674) |
| 0.1 | 1.7 | GO:0080030 | methyl indole-3-acetate esterase activity(GO:0080030) |
| 0.1 | 0.3 | GO:0004791 | thioredoxin-disulfide reductase activity(GO:0004791) |
| 0.1 | 1.8 | GO:0016844 | strictosidine synthase activity(GO:0016844) |
| 0.1 | 0.3 | GO:0047364 | desulfoglucosinolate sulfotransferase activity(GO:0047364) |
| 0.1 | 4.3 | GO:0003743 | translation initiation factor activity(GO:0003743) |
| 0.1 | 0.3 | GO:0000249 | C-22 sterol desaturase activity(GO:0000249) |
| 0.1 | 1.0 | GO:0070181 | small ribosomal subunit rRNA binding(GO:0070181) |
| 0.1 | 2.5 | GO:0080044 | quercetin 7-O-glucosyltransferase activity(GO:0080044) |
| 0.1 | 3.8 | GO:0019843 | rRNA binding(GO:0019843) |
| 0.1 | 0.4 | GO:0015002 | cytochrome-c oxidase activity(GO:0004129) heme-copper terminal oxidase activity(GO:0015002) oxidoreductase activity, acting on a heme group of donors(GO:0016675) oxidoreductase activity, acting on a heme group of donors, oxygen as acceptor(GO:0016676) |
| 0.1 | 5.1 | GO:0051213 | dioxygenase activity(GO:0051213) |
| 0.1 | 2.2 | GO:0050897 | cobalt ion binding(GO:0050897) |
| 0.1 | 0.6 | GO:0004605 | phosphatidate cytidylyltransferase activity(GO:0004605) |
| 0.1 | 0.2 | GO:0032131 | alkylated DNA binding(GO:0032131) |
| 0.1 | 0.6 | GO:0003830 | beta-1,4-mannosylglycoprotein 4-beta-N-acetylglucosaminyltransferase activity(GO:0003830) |
| 0.1 | 0.4 | GO:0032451 | demethylase activity(GO:0032451) |
| 0.1 | 0.4 | GO:0004376 | glycolipid mannosyltransferase activity(GO:0004376) |
| 0.1 | 0.7 | GO:0017025 | TBP-class protein binding(GO:0017025) |
| 0.1 | 0.5 | GO:0000285 | 1-phosphatidylinositol-3-phosphate 5-kinase activity(GO:0000285) |
| 0.1 | 0.3 | GO:0017176 | phosphatidylinositol N-acetylglucosaminyltransferase activity(GO:0017176) |
| 0.1 | 0.7 | GO:0051117 | ATPase binding(GO:0051117) |
| 0.1 | 0.7 | GO:0004402 | histone acetyltransferase activity(GO:0004402) peptide-lysine-N-acetyltransferase activity(GO:0061733) |
| 0.1 | 0.5 | GO:0043495 | protein anchor(GO:0043495) |
| 0.1 | 1.0 | GO:0016408 | C-acyltransferase activity(GO:0016408) |
| 0.1 | 0.5 | GO:0033293 | monocarboxylic acid binding(GO:0033293) |
| 0.1 | 0.3 | GO:0004326 | tetrahydrofolylpolyglutamate synthase activity(GO:0004326) |
| 0.1 | 1.0 | GO:0008146 | sulfotransferase activity(GO:0008146) |
| 0.1 | 0.7 | GO:0008137 | NADH dehydrogenase (ubiquinone) activity(GO:0008137) NADH dehydrogenase (quinone) activity(GO:0050136) |
| 0.1 | 0.7 | GO:0010181 | FMN binding(GO:0010181) |
| 0.1 | 1.5 | GO:0004721 | phosphoprotein phosphatase activity(GO:0004721) |
| 0.1 | 0.6 | GO:0004311 | farnesyltranstransferase activity(GO:0004311) |
| 0.1 | 0.9 | GO:0005543 | phospholipid binding(GO:0005543) |
| 0.1 | 0.6 | GO:0015174 | basic amino acid transmembrane transporter activity(GO:0015174) |
| 0.0 | 6.8 | GO:0005509 | calcium ion binding(GO:0005509) |
| 0.0 | 0.3 | GO:0003917 | DNA topoisomerase type I activity(GO:0003917) |
| 0.0 | 28.0 | GO:0044212 | regulatory region DNA binding(GO:0000975) transcription regulatory region sequence-specific DNA binding(GO:0000976) regulatory region nucleic acid binding(GO:0001067) transcription regulatory region DNA binding(GO:0044212) |
| 0.0 | 0.3 | GO:0004806 | triglyceride lipase activity(GO:0004806) |
| 0.0 | 0.3 | GO:0004652 | polynucleotide adenylyltransferase activity(GO:0004652) |
| 0.0 | 0.2 | GO:0004719 | protein-L-isoaspartate (D-aspartate) O-methyltransferase activity(GO:0004719) |
| 0.0 | 0.4 | GO:0019158 | glucokinase activity(GO:0004340) glucose binding(GO:0005536) mannokinase activity(GO:0019158) |
| 0.0 | 2.2 | GO:0004190 | aspartic-type endopeptidase activity(GO:0004190) |
| 0.0 | 0.4 | GO:0022833 | mechanically-gated ion channel activity(GO:0008381) mechanically gated channel activity(GO:0022833) |
| 0.0 | 1.2 | GO:0042393 | histone binding(GO:0042393) |
| 0.0 | 0.1 | GO:0044183 | protein binding involved in protein folding(GO:0044183) |
| 0.0 | 11.6 | GO:0043565 | sequence-specific DNA binding(GO:0043565) |
| 0.0 | 0.8 | GO:0000049 | tRNA binding(GO:0000049) |
| 0.0 | 0.3 | GO:0017091 | AU-rich element binding(GO:0017091) |
| 0.0 | 0.2 | GO:0004663 | protein geranylgeranyltransferase activity(GO:0004661) Rab geranylgeranyltransferase activity(GO:0004663) |
| 0.0 | 0.5 | GO:0008081 | phosphoric diester hydrolase activity(GO:0008081) |
| 0.0 | 0.3 | GO:0008536 | Ran GTPase binding(GO:0008536) |
| 0.0 | 0.2 | GO:0015645 | fatty acid ligase activity(GO:0015645) |
| 0.0 | 1.3 | GO:0005319 | lipid transporter activity(GO:0005319) |
| 0.0 | 0.3 | GO:0017056 | structural constituent of nuclear pore(GO:0017056) |
| 0.0 | 0.3 | GO:0016409 | palmitoyltransferase activity(GO:0016409) |
| 0.0 | 0.1 | GO:0004749 | ribose phosphate diphosphokinase activity(GO:0004749) |
| 0.0 | 0.1 | GO:0004816 | asparagine-tRNA ligase activity(GO:0004816) |
| 0.0 | 1.5 | GO:0051082 | unfolded protein binding(GO:0051082) |
| 0.0 | 0.1 | GO:0019201 | nucleotide kinase activity(GO:0019201) |
| 0.0 | 0.9 | GO:0005216 | ion channel activity(GO:0005216) |
Gene overrepresentation in curated gene sets: canonical pathways category:
| Log-likelihood per target | Total log-likelihood | Term | Description |
|---|---|---|---|
| 0.9 | 5.4 | PID PLK1 PATHWAY | PLK1 signaling events |
| 0.8 | 9.2 | PID RAC1 PATHWAY | RAC1 signaling pathway |
| 0.6 | 3.2 | PID S1P META PATHWAY | Sphingosine 1-phosphate (S1P) pathway |
| 0.6 | 1.7 | PID BETA CATENIN NUC PATHWAY | Regulation of nuclear beta catenin signaling and target gene transcription |
| 0.5 | 1.1 | ST INTEGRIN SIGNALING PATHWAY | Integrin Signaling Pathway |
| 0.5 | 1.5 | PID TAP63 PATHWAY | Validated transcriptional targets of TAp63 isoforms |
| 0.4 | 1.6 | PID HIF1A PATHWAY | Hypoxic and oxygen homeostasis regulation of HIF-1-alpha |
| 0.4 | 1.6 | PID IL4 2PATHWAY | IL4-mediated signaling events |
| 0.4 | 2.7 | PID MTOR 4PATHWAY | mTOR signaling pathway |
| 0.3 | 1.0 | PID AMB2 NEUTROPHILS PATHWAY | amb2 Integrin signaling |
| 0.3 | 2.3 | NABA ECM GLYCOPROTEINS | Genes encoding structural ECM glycoproteins |
| 0.2 | 0.7 | PID ARF 3PATHWAY | Arf1 pathway |
| 0.2 | 0.6 | PID VEGFR1 PATHWAY | VEGFR1 specific signals |
| 0.1 | 0.7 | PID HDAC CLASSII PATHWAY | Signaling events mediated by HDAC Class II |
| 0.1 | 0.7 | PID CIRCADIAN PATHWAY | Circadian rhythm pathway |
| 0.1 | 0.7 | PID CMYB PATHWAY | C-MYB transcription factor network |
| 0.1 | 0.4 | SIG REGULATION OF THE ACTIN CYTOSKELETON BY RHO GTPASES | Genes related to regulation of the actin cytoskeleton |
Gene overrepresentation in curated gene sets: REACTOME pathways category:
| Log-likelihood per target | Total log-likelihood | Term | Description |
|---|---|---|---|
| 1.5 | 16.6 | REACTOME PPARA ACTIVATES GENE EXPRESSION | Genes involved in PPARA Activates Gene Expression |
| 1.5 | 5.8 | REACTOME CITRIC ACID CYCLE TCA CYCLE | Genes involved in Citric acid cycle (TCA cycle) |
| 1.3 | 5.0 | REACTOME METABOLISM OF NUCLEOTIDES | Genes involved in Metabolism of nucleotides |
| 1.2 | 3.5 | REACTOME APOPTOSIS INDUCED DNA FRAGMENTATION | Genes involved in Apoptosis induced DNA fragmentation |
| 1.1 | 3.3 | REACTOME IL1 SIGNALING | Genes involved in Interleukin-1 signaling |
| 1.1 | 3.3 | REACTOME FATTY ACID TRIACYLGLYCEROL AND KETONE BODY METABOLISM | Genes involved in Fatty acid, triacylglycerol, and ketone body metabolism |
| 0.8 | 4.0 | REACTOME PEROXISOMAL LIPID METABOLISM | Genes involved in Peroxisomal lipid metabolism |
| 0.6 | 1.7 | REACTOME NEUROTRANSMITTER RECEPTOR BINDING AND DOWNSTREAM TRANSMISSION IN THE POSTSYNAPTIC CELL | Genes involved in Neurotransmitter Receptor Binding And Downstream Transmission In The Postsynaptic Cell |
| 0.5 | 1.0 | REACTOME GLUCOSE METABOLISM | Genes involved in Glucose metabolism |
| 0.5 | 3.9 | REACTOME METABOLISM OF AMINO ACIDS AND DERIVATIVES | Genes involved in Metabolism of amino acids and derivatives |
| 0.4 | 1.1 | REACTOME NRAGE SIGNALS DEATH THROUGH JNK | Genes involved in NRAGE signals death through JNK |
| 0.4 | 1.1 | REACTOME MRNA DECAY BY 5 TO 3 EXORIBONUCLEASE | Genes involved in mRNA Decay by 5' to 3' Exoribonuclease |
| 0.4 | 1.4 | REACTOME GLYCEROPHOSPHOLIPID BIOSYNTHESIS | Genes involved in Glycerophospholipid biosynthesis |
| 0.3 | 2.1 | REACTOME HOST INTERACTIONS OF HIV FACTORS | Genes involved in Host Interactions of HIV factors |
| 0.3 | 10.1 | REACTOME ABC FAMILY PROTEINS MEDIATED TRANSPORT | Genes involved in ABC-family proteins mediated transport |
| 0.3 | 1.1 | REACTOME BMAL1 CLOCK NPAS2 ACTIVATES CIRCADIAN EXPRESSION | Genes involved in BMAL1:CLOCK/NPAS2 Activates Circadian Expression |
| 0.2 | 0.7 | REACTOME MITOTIC PROMETAPHASE | Genes involved in Mitotic Prometaphase |
| 0.2 | 0.7 | REACTOME TRANSCRIPTIONAL REGULATION OF WHITE ADIPOCYTE DIFFERENTIATION | Genes involved in Transcriptional Regulation of White Adipocyte Differentiation |
| 0.2 | 0.6 | REACTOME SEMAPHORIN INTERACTIONS | Genes involved in Semaphorin interactions |
| 0.2 | 0.8 | REACTOME BIOSYNTHESIS OF THE N GLYCAN PRECURSOR DOLICHOL LIPID LINKED OLIGOSACCHARIDE LLO AND TRANSFER TO A NASCENT PROTEIN | Genes involved in Biosynthesis of the N-glycan precursor (dolichol lipid-linked oligosaccharide, LLO) and transfer to a nascent protein |
| 0.2 | 1.7 | REACTOME CHEMOKINE RECEPTORS BIND CHEMOKINES | Genes involved in Chemokine receptors bind chemokines |
| 0.2 | 0.5 | REACTOME GLUTATHIONE CONJUGATION | Genes involved in Glutathione conjugation |
| 0.2 | 0.5 | REACTOME APOPTOSIS | Genes involved in Apoptosis |
| 0.2 | 0.3 | REACTOME SIGNALING BY ROBO RECEPTOR | Genes involved in Signaling by Robo receptor |
| 0.2 | 0.5 | REACTOME TRNA AMINOACYLATION | Genes involved in tRNA Aminoacylation |
| 0.1 | 0.3 | REACTOME MITOCHONDRIAL PROTEIN IMPORT | Genes involved in Mitochondrial Protein Import |
| 0.1 | 3.3 | REACTOME NONSENSE MEDIATED DECAY ENHANCED BY THE EXON JUNCTION COMPLEX | Genes involved in Nonsense Mediated Decay Enhanced by the Exon Junction Complex |
| 0.1 | 0.4 | REACTOME GLUCOSE TRANSPORT | Genes involved in Glucose transport |
| 0.1 | 0.7 | REACTOME METABOLISM OF VITAMINS AND COFACTORS | Genes involved in Metabolism of vitamins and cofactors |
| 0.1 | 0.7 | REACTOME POL SWITCHING | Genes involved in Polymerase switching |
| 0.0 | 0.1 | REACTOME DOWNSTREAM SIGNAL TRANSDUCTION | Genes involved in Downstream signal transduction |
| 0.0 | 0.3 | REACTOME LATE PHASE OF HIV LIFE CYCLE | Genes involved in Late Phase of HIV Life Cycle |