Project
GSE43616: Time-course of wild-type Arabidopsis leaf
Navigation
Downloads
Results for AT2G35530
Z-value: 0.56
Transcription factors associated with AT2G35530
| Gene Symbol | Gene ID | Gene Info |
|---|---|---|
|
AT2G35530
|
AT2G35530 | basic region/leucine zipper transcription factor 16 |
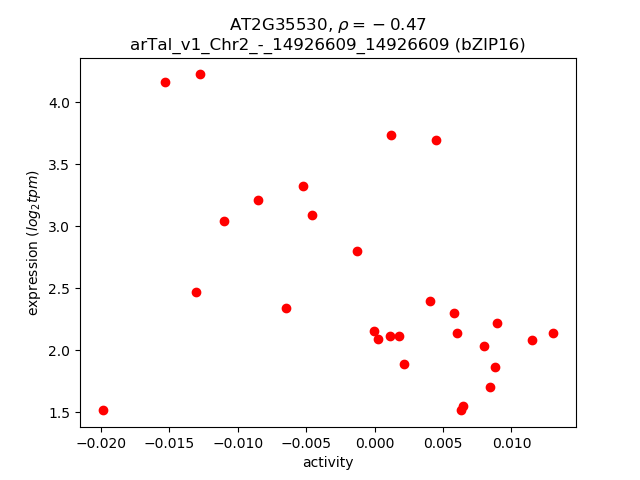
Activity-expression correlation:
| Gene | Promoter | Pearson corr. coef. | P-value | Plot |
|---|---|---|---|---|
| bZIP16 | arTal_v1_Chr2_-_14926609_14926609 | -0.47 | 1.1e-02 | Click! |
Activity profile of AT2G35530 motif
Sorted Z-values of AT2G35530 motif
| Promoter | Log-likelihood | Transcript | Gene | Gene Info |
|---|---|---|---|---|
| arTal_v1_Chr3_+_10255906_10255941 | 2.17 |
AT3G27690.2
AT3G27690.1 |
LHCB2.3
|
photosystem II light harvesting complex protein 2.3 |
| arTal_v1_Chr4_-_17777445_17777445 | 2.05 |
AT4G37800.1
|
XTH7
|
xyloglucan endotransglucosylase/hydrolase 7 |
| arTal_v1_Chr5_-_15378416_15378416 | 1.90 |
AT5G38410.3
AT5G38410.2 |
RBCS3B
|
Ribulose bisphosphate carboxylase (small chain) family protein |
| arTal_v1_Chr5_-_15378642_15378642 | 1.90 |
AT5G38410.1
|
RBCS3B
|
Ribulose bisphosphate carboxylase (small chain) family protein |
| arTal_v1_Chr2_+_14577083_14577083 | 1.72 |
AT2G34620.1
|
AT2G34620
|
Mitochondrial transcription termination factor family protein |
| arTal_v1_Chr1_+_6612630_6612630 | 1.65 |
AT1G19150.1
|
Lhca6
|
PSI type II chlorophyll a/b-binding protein (Lhca2*1) |
| arTal_v1_Chr5_+_26298728_26298728 | 1.65 |
AT5G65730.1
|
XTH6
|
xyloglucan endotransglucosylase/hydrolase 6 |
| arTal_v1_Chr2_+_2763449_2763513 | 1.58 |
AT2G06850.1
AT2G06850.2 |
XTH4
|
xyloglucan endotransglucosylase/hydrolase 4 |
| arTal_v1_Chr1_-_25049424_25049424 | 1.46 |
AT1G67090.2
|
RBCS1A
|
ribulose bisphosphate carboxylase small chain 1A |
| arTal_v1_Chr1_-_25049667_25049667 | 1.46 |
AT1G67090.1
|
RBCS1A
|
ribulose bisphosphate carboxylase small chain 1A |
| arTal_v1_Chr1_+_26687202_26687202 | 1.44 |
AT1G70760.1
|
NdhL
|
inorganic carbon transport protein-like protein |
| arTal_v1_Chr1_+_19454798_19454798 | 1.39 |
AT1G52230.1
|
PSAH2
|
photosystem I subunit H2 |
| arTal_v1_Chr1_-_59215_59215 | 1.37 |
AT1G01120.1
|
KCS1
|
3-ketoacyl-CoA synthase 1 |
| arTal_v1_Chr4_-_7493080_7493080 | 1.37 |
AT4G12730.1
|
FLA2
|
FASCICLIN-like arabinogalactan 2 |
| arTal_v1_Chr3_+_17228642_17228642 | 1.36 |
AT3G46780.1
|
PTAC16
|
plastid transcriptionally active 16 |
| arTal_v1_Chr3_-_7377186_7377226 | 1.32 |
AT3G21055.1
AT3G21055.2 |
PSBTN
|
photosystem II subunit T |
| arTal_v1_Chr3_+_6510982_6510982 | 1.31 |
AT3G18890.1
|
Tic62
|
NAD(P)-binding Rossmann-fold superfamily protein |
| arTal_v1_Chr1_-_10475969_10475969 | 1.31 |
AT1G29920.1
|
CAB2
|
chlorophyll A/B-binding protein 2 |
| arTal_v1_Chr1_-_1043887_1043887 | 1.27 |
AT1G04040.1
|
AT1G04040
|
HAD superfamily, subfamily IIIB acid phosphatase |
| arTal_v1_Chr2_+_19243348_19243427 | 1.23 |
AT2G46820.1
AT2G46820.2 |
PSI-P
|
photosystem I P subunit |
| arTal_v1_Chr2_-_9130212_9130240 | 1.18 |
AT2G21330.3
AT2G21330.2 |
FBA1
|
fructose-bisphosphate aldolase 1 |
| arTal_v1_Chr2_-_9130619_9130619 | 1.17 |
AT2G21330.1
|
FBA1
|
fructose-bisphosphate aldolase 1 |
| arTal_v1_Chr2_+_266559_266630 | 1.14 |
AT2G01590.1
AT2G01590.2 |
CRR3
|
chlororespiratory reduction 3 |
| arTal_v1_Chr3_-_5469594_5469594 | 1.14 |
AT3G16140.1
|
PSAH-1
|
photosystem I subunit H-1 |
| arTal_v1_Chr4_+_11334352_11334402 | 1.13 |
AT4G21280.1
AT4G21280.2 |
PSBQA
|
photosystem II subunit QA |
| arTal_v1_Chr3_-_2130451_2130451 | 1.13 |
AT3G06750.1
|
AT3G06750
|
hydroxyproline-rich glycoprotein family protein |
| arTal_v1_Chr1_-_19052582_19052582 | 1.13 |
AT1G51400.1
|
AT1G51400
|
Photosystem II 5 kD protein |
| arTal_v1_Chr1_+_3664187_3664187 | 1.11 |
AT1G10960.1
|
FD1
|
ferredoxin 1 |
| arTal_v1_Chr1_+_20713499_20713499 | 1.11 |
AT1G55480.1
|
ZKT
|
protein containing PDZ domain, a K-box domain, and a TPR region |
| arTal_v1_Chr1_-_4530222_4530222 | 1.11 |
AT1G13250.1
|
GATL3
|
galacturonosyltransferase-like 3 |
| arTal_v1_Chr1_+_4899045_4899045 | 1.10 |
AT1G14345.1
|
AT1G14345
|
NAD(P)-linked oxidoreductase superfamily protein |
| arTal_v1_Chr1_-_6319427_6319427 | 1.10 |
AT1G18360.1
|
AT1G18360
|
alpha/beta-Hydrolases superfamily protein |
| arTal_v1_Chr1_-_4265156_4265156 | 1.09 |
AT1G12500.1
|
AT1G12500
|
Nucleotide-sugar transporter family protein |
| arTal_v1_Chr5_+_16768935_16768935 | 1.09 |
AT5G41900.1
|
AT5G41900
|
alpha/beta-Hydrolases superfamily protein |
| arTal_v1_Chr2_-_6493512_6493512 | 1.08 |
AT2G15020.1
|
AT2G15020
|
hypothetical protein |
| arTal_v1_Chr1_+_2047886_2047886 | 1.07 |
AT1G06680.2
|
PSBP-1
|
photosystem II subunit P-1 |
| arTal_v1_Chr1_+_2047634_2047634 | 1.07 |
AT1G06680.1
|
PSBP-1
|
photosystem II subunit P-1 |
| arTal_v1_Chr5_-_7738535_7738535 | 1.04 |
AT5G23060.2
AT5G23060.1 |
CaS
|
calcium sensing receptor |
| arTal_v1_Chr1_+_898480_898480 | 1.01 |
AT1G03600.1
|
PSB27
|
photosystem II family protein |
| arTal_v1_Chr1_-_5447880_5447880 | 1.01 |
AT1G15820.1
|
LHCB6
|
light harvesting complex photosystem II subunit 6 |
| arTal_v1_Chr3_+_20709294_20709294 | 0.96 |
AT3G55800.1
|
SBPASE
|
sedoheptulose-bisphosphatase |
| arTal_v1_Chr1_+_20048434_20048434 | 0.95 |
AT1G53700.1
|
WAG1
|
WAG 1 |
| arTal_v1_Chr2_-_15790139_15790139 | 0.94 |
AT2G37640.1
|
EXP3
|
Barwin-like endoglucanases superfamily protein |
| arTal_v1_Chr5_-_25629615_25629708 | 0.94 |
AT5G64040.2
AT5G64040.1 |
PSAN
|
photosystem I reaction center subunit PSI-N, chloroplast, putative / PSI-N, putative (PSAN) |
| arTal_v1_Chr1_-_84864_84946 | 0.93 |
AT1G01190.1
AT1G01190.2 |
CYP78A8
|
cytochrome P450, family 78, subfamily A, polypeptide 8 |
| arTal_v1_Chr5_-_18588792_18588792 | 0.92 |
AT5G45820.1
|
CIPK20
|
CBL-interacting protein kinase 20 |
| arTal_v1_Chr3_-_17495033_17495033 | 0.92 |
AT3G47470.1
|
LHCA4
|
light-harvesting chlorophyll-protein complex I subunit A4 |
| arTal_v1_Chr1_-_16709713_16709713 | 0.92 |
AT1G44000.1
|
AT1G44000
|
STAY-GREEN-like protein |
| arTal_v1_Chr2_-_15789605_15789605 | 0.91 |
AT2G37640.2
|
EXP3
|
Barwin-like endoglucanases superfamily protein |
| arTal_v1_Chr1_-_26515188_26515255 | 0.91 |
AT1G70370.2
AT1G70370.1 |
PG2
|
polygalacturonase 2 |
| arTal_v1_Chr1_+_7886323_7886323 | 0.91 |
AT1G22330.1
|
AT1G22330
|
RNA-binding (RRM/RBD/RNP motifs) family protein |
| arTal_v1_Chr4_-_14204061_14204061 | 0.89 |
AT4G28750.1
|
PSAE-1
|
Photosystem I reaction centre subunit IV / PsaE protein |
| arTal_v1_Chr2_+_19145218_19145218 | 0.89 |
AT2G46630.1
|
AT2G46630
|
serine/arginine repetitive matrix protein |
| arTal_v1_Chr3_+_23345754_23345754 | 0.89 |
AT3G63200.1
|
PLP9
|
PATATIN-like protein 9 |
| arTal_v1_Chr5_-_7242857_7242880 | 0.88 |
AT5G21920.2
AT5G21920.1 |
YLMG2
|
YGGT family protein |
| arTal_v1_Chr1_-_28554810_28554930 | 0.87 |
AT1G76100.1
AT1G76100.2 |
PETE1
|
plastocyanin 1 |
| arTal_v1_Chr1_+_25374072_25374222 | 0.87 |
AT1G67700.1
AT1G67700.2 AT1G67700.5 AT1G67700.4 AT1G67700.3 |
AT1G67700
|
multidrug resistance protein |
| arTal_v1_Chr4_+_455768_455768 | 0.87 |
AT4G01050.1
|
TROL
|
thylakoid rhodanese-like protein |
| arTal_v1_Chr4_+_455583_455583 | 0.87 |
AT4G01050.2
|
TROL
|
thylakoid rhodanese-like protein |
| arTal_v1_Chr4_+_160643_160643 | 0.85 |
AT4G00360.1
|
CYP86A2
|
cytochrome P450, family 86, subfamily A, polypeptide 2 |
| arTal_v1_Chr1_-_29716255_29716255 | 0.84 |
AT1G78995.1
|
AT1G78995
|
hypothetical protein |
| arTal_v1_Chr5_+_26572265_26572265 | 0.82 |
AT5G66580.1
|
AT5G66580
|
hypothetical protein |
| arTal_v1_Chr5_-_26845294_26845294 | 0.82 |
AT5G67280.1
|
RLK
|
receptor-like kinase |
| arTal_v1_Chr4_-_16773456_16773456 | 0.82 |
AT4G35250.1
|
HCF244
|
NAD(P)-binding Rossmann-fold superfamily protein |
| arTal_v1_Chr5_+_24940203_24940396 | 0.82 |
AT5G62100.2
AT5G62100.4 AT5G62100.3 AT5G62100.5 AT5G62100.6 AT5G62100.1 |
BAG2
|
BCL-2-associated athanogene 2 |
| arTal_v1_Chr1_-_12053935_12053935 | 0.81 |
AT1G33240.2
|
GTL1
|
GT-2-like 1 |
| arTal_v1_Chr5_+_23374873_23374874 | 0.81 |
AT5G57700.3
AT5G57700.2 AT5G57700.1 AT5G57700.5 |
AT5G57700
|
BNR/Asp-box repeat family protein |
| arTal_v1_Chr4_+_12086898_12086898 | 0.81 |
AT4G23060.1
|
IQD22
|
IQ-domain 22 |
| arTal_v1_Chr4_-_9157133_9157133 | 0.80 |
AT4G16155.1
|
AT4G16155
|
dihydrolipoamide dehydrogenase |
| arTal_v1_Chr2_-_13120199_13120199 | 0.80 |
AT2G30790.1
|
PSBP-2
|
photosystem II subunit P-2 |
| arTal_v1_Chr4_+_813048_813068 | 0.80 |
AT4G01883.1
AT4G01883.3 AT4G01883.2 |
AT4G01883
|
Polyketide cyclase / dehydrase and lipid transport protein |
| arTal_v1_Chr1_-_12054753_12054753 | 0.80 |
AT1G33240.1
AT1G33240.3 |
GTL1
|
GT-2-like 1 |
| arTal_v1_Chr4_-_18472048_18472048 | 0.80 |
AT4G39800.1
|
MIPS1
|
myo-inositol-1-phosphate synthase 1 |
| arTal_v1_Chr3_+_11252807_11252807 | 0.80 |
AT3G29320.1
|
PHS1
|
Glycosyl transferase, family 35 |
| arTal_v1_Chr1_+_10810877_10810877 | 0.79 |
AT1G30520.4
AT1G30520.3 |
AAE14
|
acyl-activating enzyme 14 |
| arTal_v1_Chr5_-_14199431_14199431 | 0.79 |
AT5G36120.1
|
CCB3
|
cofactor assembly, complex C (B6F) |
| arTal_v1_Chr1_+_4735474_4735474 | 0.79 |
AT1G13820.1
|
AT1G13820
|
alpha/beta-Hydrolases superfamily protein |
| arTal_v1_Chr1_+_22700073_22700073 | 0.78 |
AT1G61520.2
|
LHCA3
|
PSI type III chlorophyll a/b-binding protein |
| arTal_v1_Chr1_+_22699893_22699893 | 0.78 |
AT1G61520.1
|
LHCA3
|
PSI type III chlorophyll a/b-binding protein |
| arTal_v1_Chr2_+_15289975_15289975 | 0.77 |
AT2G36430.1
|
AT2G36430
|
transmembrane protein, putative (DUF247) |
| arTal_v1_Chr2_+_18537177_18537177 | 0.77 |
AT2G44940.1
|
AT2G44940
|
Integrase-type DNA-binding superfamily protein |
| arTal_v1_Chr3_+_2167730_2167730 | 0.77 |
AT3G06868.1
|
AT3G06868
|
vitellogenin-like protein |
| arTal_v1_Chr5_+_16410782_16410782 | 0.77 |
AT5G40950.1
|
RPL27
|
ribosomal protein large subunit 27 |
| arTal_v1_Chr1_+_10810397_10810397 | 0.76 |
AT1G30520.1
AT1G30520.2 |
AAE14
|
acyl-activating enzyme 14 |
| arTal_v1_Chr5_+_20945676_20945676 | 0.76 |
AT5G51560.1
|
AT5G51560
|
Leucine-rich repeat protein kinase family protein |
| arTal_v1_Chr1_+_26964087_26964087 | 0.76 |
AT1G71695.1
|
AT1G71695
|
Peroxidase superfamily protein |
| arTal_v1_Chr3_-_20903080_20903080 | 0.75 |
AT3G56370.1
|
AT3G56370
|
Leucine-rich repeat protein kinase family protein |
| arTal_v1_Chr3_-_18628888_18628914 | 0.75 |
AT3G50240.3
AT3G50240.2 AT3G50240.4 AT3G50240.1 |
KICP-02
|
ATP binding microtubule motor family protein |
| arTal_v1_Chr5_+_22808641_22808641 | 0.74 |
AT5G56320.2
AT5G56320.1 AT5G56320.3 |
EXPA14
|
expansin A14 |
| arTal_v1_Chr5_-_7026533_7026533 | 0.74 |
AT5G20740.1
|
AT5G20740
|
Plant invertase/pectin methylesterase inhibitor superfamily protein |
| arTal_v1_Chr4_+_12006986_12007040 | 0.73 |
AT4G22890.3
AT4G22890.4 AT4G22890.5 AT4G22890.1 AT4G22890.2 |
PGR5-LIKE A
|
PGR5-LIKE A |
| arTal_v1_Chr1_+_22699715_22699715 | 0.73 |
AT1G61520.3
|
LHCA3
|
PSI type III chlorophyll a/b-binding protein |
| arTal_v1_Chr5_-_20779464_20779488 | 0.73 |
AT5G51110.2
AT5G51110.1 |
AT5G51110
|
Transcriptional coactivator/pterin dehydratase |
| arTal_v1_Chr2_+_8987584_8987584 | 0.73 |
AT2G20890.1
|
PSB29
|
photosystem II reaction center PSB29 protein |
| arTal_v1_Chr1_+_29735952_29735952 | 0.73 |
AT1G79040.1
|
PSBR
|
photosystem II subunit R |
| arTal_v1_Chr4_-_14002069_14002124 | 0.73 |
AT4G28250.2
AT4G28250.3 AT4G28250.4 AT4G28250.1 |
EXPB3
|
expansin B3 |
| arTal_v1_Chr1_+_28078852_28078852 | 0.72 |
AT1G74730.1
|
AT1G74730
|
transmembrane protein, putative (DUF1118) |
| arTal_v1_Chr3_-_8533834_8533834 | 0.72 |
AT3G23700.1
|
AT3G23700
|
Nucleic acid-binding proteins superfamily |
| arTal_v1_Chr4_-_16703486_16703504 | 0.72 |
AT4G35090.3
AT4G35090.1 |
CAT2
|
catalase 2 |
| arTal_v1_Chr4_-_16703286_16703286 | 0.72 |
AT4G35090.2
|
CAT2
|
catalase 2 |
| arTal_v1_Chr4_+_18519599_18519599 | 0.71 |
AT4G39940.1
|
AKN2
|
APS-kinase 2 |
| arTal_v1_Chr4_-_11956918_11956918 | 0.70 |
AT4G22756.1
|
SMO1-2
|
sterol C4-methyl oxidase 1-2 |
| arTal_v1_Chr3_-_4775258_4775258 | 0.70 |
AT3G14310.1
|
PME3
|
pectin methylesterase 3 |
| arTal_v1_Chr5_+_17798262_17798281 | 0.69 |
AT5G44190.2
AT5G44190.1 |
GLK2
|
GOLDEN2-like 2 |
| arTal_v1_Chr2_-_183639_183764 | 0.69 |
AT2G01420.3
AT2G01420.1 AT2G01420.2 |
PIN4
|
Auxin efflux carrier family protein |
| arTal_v1_Chr5_-_26501955_26501955 | 0.69 |
AT5G66330.1
|
AT5G66330
|
Leucine-rich repeat (LRR) family protein |
| arTal_v1_Chr5_-_23849107_23849151 | 0.68 |
AT5G59080.1
AT5G59080.2 |
AT5G59080
|
hypothetical protein |
| arTal_v1_Chr2_+_16745628_16745653 | 0.68 |
AT2G40100.1
AT2G40100.2 |
LHCB4.3
|
light harvesting complex photosystem II |
| arTal_v1_Chr5_-_3709403_3709403 | 0.68 |
AT5G11550.1
|
AT5G11550
|
ARM repeat superfamily protein |
| arTal_v1_Chr5_-_9174598_9174598 | 0.68 |
AT5G26230.1
|
MAKR1
|
membrane-associated kinase regulator |
| arTal_v1_Chr5_-_7026753_7026753 | 0.67 |
AT5G20740.2
|
AT5G20740
|
Plant invertase/pectin methylesterase inhibitor superfamily protein |
| arTal_v1_Chr1_+_28458691_28458691 | 0.67 |
AT1G75800.1
|
AT1G75800
|
Pathogenesis-related thaumatin superfamily protein |
| arTal_v1_Chr5_-_15828035_15828035 | 0.67 |
AT5G39530.1
AT5G39530.2 |
AT5G39530
|
hypothetical protein (DUF1997) |
| arTal_v1_Chr1_-_105330_105330 | 0.67 |
AT1G01250.1
|
AT1G01250
|
Integrase-type DNA-binding superfamily protein |
| arTal_v1_Chr2_-_10063863_10063863 | 0.67 |
AT2G23670.1
|
YCF37
|
homolog of Synechocystis YCF37 |
| arTal_v1_Chr4_+_17583992_17583992 | 0.67 |
AT4G37400.1
|
CYP81F3
|
cytochrome P450, family 81, subfamily F, polypeptide 3 |
| arTal_v1_Chr4_+_16134366_16134440 | 0.67 |
AT4G33550.2
AT4G33550.1 |
AT4G33550
|
Bifunctional inhibitor/lipid-transfer protein/seed storage 2S albumin superfamily protein |
| arTal_v1_Chr1_-_19454697_19454765 | 0.67 |
AT1G52220.3
AT1G52220.2 AT1G52220.4 AT1G52220.1 |
AT1G52220
|
CURVATURE THYLAKOID protein |
| arTal_v1_Chr3_-_7704958_7704958 | 0.67 |
AT3G21870.1
|
CYCP2%3B1
|
cyclin p2;1 |
| arTal_v1_Chr2_+_19469571_19469612 | 0.66 |
AT2G47440.2
AT2G47440.1 |
AT2G47440
|
Tetratricopeptide repeat (TPR)-like superfamily protein |
| arTal_v1_Chr2_-_12355480_12355570 | 0.65 |
AT2G28790.1
AT2G28790.2 |
AT2G28790
|
Pathogenesis-related thaumatin superfamily protein |
| arTal_v1_Chr1_+_2204104_2204104 | 0.64 |
AT1G07180.1
|
NDA1
|
alternative NAD(P)H dehydrogenase 1 |
| arTal_v1_Chr4_-_9305763_9305845 | 0.64 |
AT4G16515.1
AT4G16515.2 |
RGF6
|
root meristem growth factor |
| arTal_v1_Chr5_+_26568572_26568572 | 0.64 |
AT5G66570.1
|
PSBO1
|
PS II oxygen-evolving complex 1 |
| arTal_v1_Chr3_-_4620305_4620305 | 0.63 |
AT3G13980.1
|
AT3G13980
|
SKI/DACH domain protein |
| arTal_v1_Chr1_-_3931701_3931701 | 0.63 |
AT1G11670.1
|
AT1G11670
|
MATE efflux family protein |
| arTal_v1_Chr5_-_23230749_23230749 | 0.63 |
AT5G57345.1
|
AT5G57345
|
transmembrane protein |
| arTal_v1_Chr5_+_20900859_20900860 | 0.63 |
AT5G51460.1
AT5G51460.4 |
ATTPPA
|
Haloacid dehalogenase-like hydrolase (HAD) superfamily protein |
| arTal_v1_Chr1_+_25493193_25493218 | 0.62 |
AT1G68010.1
AT1G68010.2 AT1G68010.3 |
HPR
|
hydroxypyruvate reductase |
| arTal_v1_Chr3_+_5748497_5748497 | 0.62 |
AT3G16850.1
|
AT3G16850
|
Pectin lyase-like superfamily protein |
| arTal_v1_Chr1_-_26293173_26293173 | 0.62 |
AT1G69830.1
|
AMY3
|
alpha-amylase-like 3 |
| arTal_v1_Chr1_-_7040231_7040231 | 0.62 |
AT1G20330.1
|
SMT2
|
sterol methyltransferase 2 |
| arTal_v1_Chr4_+_16357421_16357421 | 0.62 |
AT4G34160.1
|
CYCD3%3B1
|
CYCLIN D3;1 |
| arTal_v1_Chr1_+_16467298_16467298 | 0.61 |
AT1G43670.1
|
FBP
|
Inositol monophosphatase family protein |
| arTal_v1_Chr5_-_18021508_18021508 | 0.61 |
AT5G44670.1
|
GALS2
|
glycosyltransferase family protein (DUF23) |
| arTal_v1_Chr3_-_19805663_19805730 | 0.61 |
AT3G53420.2
AT3G53420.1 |
PIP2A
|
plasma membrane intrinsic protein 2A |
| arTal_v1_Chr1_+_7238693_7238693 | 0.61 |
AT1G20823.1
|
AT1G20823
|
RING/U-box superfamily protein |
| arTal_v1_Chr5_+_20902087_20902087 | 0.60 |
AT5G51460.2
|
ATTPPA
|
Haloacid dehalogenase-like hydrolase (HAD) superfamily protein |
| arTal_v1_Chr3_-_4782452_4782452 | 0.60 |
AT3G14330.1
|
AT3G14330
|
Tetratricopeptide repeat (TPR)-like superfamily protein |
| arTal_v1_Chr5_+_20901835_20901835 | 0.59 |
AT5G51460.5
|
ATTPPA
|
Haloacid dehalogenase-like hydrolase (HAD) superfamily protein |
| arTal_v1_Chr4_-_16606135_16606135 | 0.59 |
AT4G34830.1
|
MRL1
|
Pentatricopeptide repeat (PPR) superfamily protein |
| arTal_v1_Chr3_-_7231194_7231194 | 0.58 |
AT3G20680.1
|
AT3G20680
|
plant/protein (DUF1995) |
| arTal_v1_Chr3_-_19791695_19791695 | 0.58 |
AT3G53380.1
|
AT3G53380
|
Concanavalin A-like lectin protein kinase family protein |
| arTal_v1_Chr5_+_23375170_23375170 | 0.58 |
AT5G57700.4
|
AT5G57700
|
BNR/Asp-box repeat family protein |
| arTal_v1_Chr5_+_7842607_7842607 | 0.58 |
AT5G23280.1
|
AT5G23280
|
TCP family transcription factor |
| arTal_v1_Chr5_+_20901537_20901537 | 0.58 |
AT5G51460.3
|
ATTPPA
|
Haloacid dehalogenase-like hydrolase (HAD) superfamily protein |
| arTal_v1_Chr2_+_17044932_17044932 | 0.58 |
AT2G40840.1
|
DPE2
|
disproportionating enzyme 2 |
| arTal_v1_Chr1_+_17766738_17766738 | 0.57 |
AT1G48100.1
|
AT1G48100
|
Pectin lyase-like superfamily protein |
| arTal_v1_Chr1_+_12188678_12188678 | 0.57 |
AT1G33610.1
|
AT1G33610
|
Leucine-rich repeat (LRR) family protein |
| arTal_v1_Chr1_+_1104493_1104493 | 0.57 |
AT1G04180.1
|
YUC9
|
YUCCA 9 |
| arTal_v1_Chr1_+_17525342_17525342 | 0.57 |
AT1G47655.1
|
AT1G47655
|
Dof-type zinc finger DNA-binding family protein |
| arTal_v1_Chr3_+_1086516_1086516 | 0.56 |
AT3G04140.1
|
AT3G04140
|
Ankyrin repeat family protein |
| arTal_v1_Chr1_-_1122786_1122786 | 0.56 |
AT1G04220.1
|
KCS2
|
3-ketoacyl-CoA synthase 2 |
| arTal_v1_Chr5_-_25390227_25390227 | 0.56 |
AT5G63380.1
|
AT5G63380
|
AMP-dependent synthetase and ligase family protein |
| arTal_v1_Chr5_+_25948954_25948954 | 0.56 |
AT5G64940.1
AT5G64940.2 |
ATH13
|
ABC2 homolog 13 |
| arTal_v1_Chr5_+_8266790_8266790 | 0.56 |
AT5G24300.2
|
SS1
|
Glycogen/starch synthases, ADP-glucose type |
| arTal_v1_Chr2_-_7878013_7878072 | 0.55 |
AT2G18120.2
AT2G18120.1 |
SRS4
|
SHI-related sequence 4 |
| arTal_v1_Chr5_+_8266566_8266566 | 0.55 |
AT5G24300.1
|
SS1
|
Glycogen/starch synthases, ADP-glucose type |
| arTal_v1_Chr4_+_12686459_12686459 | 0.55 |
AT4G24570.1
|
DIC2
|
dicarboxylate carrier 2 |
| arTal_v1_Chr5_-_23785512_23785512 | 0.55 |
AT5G58900.1
|
AT5G58900
|
Homeodomain-like transcriptional regulator |
| arTal_v1_Chr1_+_26450166_26450166 | 0.55 |
AT1G70230.1
|
TBL27
|
TRICHOME BIREFRINGENCE-LIKE 27 |
| arTal_v1_Chr5_+_26281642_26281711 | 0.54 |
AT5G65700.1
AT5G65700.2 |
BAM1
|
Leucine-rich receptor-like protein kinase family protein |
| arTal_v1_Chr1_+_6254094_6254094 | 0.54 |
AT1G18170.1
|
AT1G18170
|
FKBP-like peptidyl-prolyl cis-trans isomerase family protein |
| arTal_v1_Chr4_-_18077369_18077369 | 0.54 |
AT4G38700.1
|
AT4G38700
|
Disease resistance-responsive (dirigent-like protein) family protein |
| arTal_v1_Chr5_-_5363126_5363126 | 0.53 |
AT5G16390.2
|
CAC1
|
chloroplastic acetylcoenzyme A carboxylase 1 |
| arTal_v1_Chr3_+_4403355_4403355 | 0.53 |
AT3G13510.1
|
AT3G13510
|
carboxyl-terminal peptidase, putative (DUF239) |
| arTal_v1_Chr5_+_25243405_25243417 | 0.53 |
AT5G62890.3
AT5G62890.1 |
AT5G62890
|
Xanthine/uracil permease family protein |
| arTal_v1_Chr5_-_5363297_5363297 | 0.52 |
AT5G16390.1
|
CAC1
|
chloroplastic acetylcoenzyme A carboxylase 1 |
| arTal_v1_Chr1_-_11163274_11163274 | 0.52 |
AT1G31230.1
|
AK-HSDH I
|
aspartate kinase-homoserine dehydrogenase i |
| arTal_v1_Chr5_-_8412240_8412265 | 0.52 |
AT5G24580.3
AT5G24580.2 |
AT5G24580
|
Heavy metal transport/detoxification superfamily protein |
| arTal_v1_Chr5_+_25243148_25243251 | 0.52 |
AT5G62890.2
AT5G62890.4 |
AT5G62890
|
Xanthine/uracil permease family protein |
| arTal_v1_Chr1_+_12177673_12177702 | 0.52 |
AT1G33590.2
AT1G33590.3 AT1G33590.1 |
AT1G33590
|
Leucine-rich repeat (LRR) family protein |
| arTal_v1_Chr2_+_9354842_9354842 | 0.52 |
AT2G21960.1
|
AT2G21960
|
transmembrane protein |
| arTal_v1_Chr3_+_8112614_8112614 | 0.51 |
AT3G22890.1
|
APS1
|
ATP sulfurylase 1 |
| arTal_v1_Chr3_-_18618816_18618816 | 0.51 |
AT3G50220.1
|
IRX15
|
IRREGULAR XYLEM protein (DUF579) |
| arTal_v1_Chr1_-_8935544_8935544 | 0.51 |
AT1G25440.1
|
BBX15
|
B-box type zinc finger protein with CCT domain-containing protein |
| arTal_v1_Chr4_-_9754161_9754161 | 0.51 |
AT4G17490.1
|
ERF6
|
ethylene responsive element binding factor 6 |
| arTal_v1_Chr5_+_7243002_7243038 | 0.51 |
AT5G21930.3
AT5G21930.1 AT5G21930.4 AT5G21930.2 |
PAA2
|
P-type ATPase of Arabidopsis 2 |
| arTal_v1_Chr4_+_15779911_15779911 | 0.51 |
AT4G32710.1
|
PERK14
|
Protein kinase superfamily protein |
| arTal_v1_Chr4_-_14627631_14627631 | 0.50 |
AT4G29905.1
|
AT4G29905
|
hypothetical protein |
| arTal_v1_Chr2_-_10439469_10439469 | 0.50 |
AT2G24570.1
|
WRKY17
|
WRKY DNA-binding protein 17 |
| arTal_v1_Chr3_-_201742_201810 | 0.50 |
AT3G01510.1
AT3G01510.3 |
LSF1
|
like SEX4 1 |
| arTal_v1_Chr3_+_21419449_21419517 | 0.50 |
AT3G57830.1
AT3G57830.2 AT3G57830.3 |
AT3G57830
|
Leucine-rich repeat protein kinase family protein |
| arTal_v1_Chr4_-_18160158_18160158 | 0.50 |
AT4G38950.2
AT4G38950.1 AT4G38950.3 |
AT4G38950
|
ATP binding microtubule motor family protein |
| arTal_v1_Chr5_+_5483260_5483260 | 0.49 |
AT5G16710.1
|
DHAR3
|
dehydroascorbate reductase 1 |
| arTal_v1_Chr3_+_17115483_17115570 | 0.49 |
AT3G46490.1
AT3G46490.2 |
AT3G46490
|
2-oxoglutarate (2OG) and Fe(II)-dependent oxygenase superfamily protein |
| arTal_v1_Chr2_+_11041331_11041331 | 0.49 |
AT2G25900.2
AT2G25900.1 |
ATCTH
|
Zinc finger C-x8-C-x5-C-x3-H type family protein |
| arTal_v1_Chr1_-_5265103_5265155 | 0.49 |
AT1G15290.2
AT1G15290.1 |
AT1G15290
|
Tetratricopeptide repeat (TPR)-like superfamily protein |
| arTal_v1_Chr4_+_14566183_14566265 | 0.49 |
AT4G29740.3
AT4G29740.2 AT4G29740.1 |
CKX4
|
cytokinin oxidase 4 |
| arTal_v1_Chr3_-_201311_201311 | 0.49 |
AT3G01510.2
|
LSF1
|
like SEX4 1 |
| arTal_v1_Chr2_+_11380463_11380463 | 0.49 |
AT2G26710.1
|
BAS1
|
Cytochrome P450 superfamily protein |
| arTal_v1_Chr5_-_8412453_8412512 | 0.49 |
AT5G24580.1
AT5G24580.4 |
AT5G24580
|
Heavy metal transport/detoxification superfamily protein |
| arTal_v1_Chr5_-_21651626_21651713 | 0.49 |
AT5G53370.1
AT5G53370.2 |
PMEPCRF
|
pectin methylesterase PCR fragment F |
| arTal_v1_Chr5_+_26354853_26354874 | 0.48 |
AT5G65890.2
AT5G65890.3 AT5G65890.1 |
ACR1
|
ACT domain repeat 1 |
| arTal_v1_Chr1_-_11923866_11923866 | 0.48 |
AT1G32900.1
|
GBSS1
|
UDP-Glycosyltransferase superfamily protein |
| arTal_v1_Chr1_-_29715017_29715017 | 0.48 |
AT1G78990.1
|
AT1G78990
|
HXXXD-type acyl-transferase family protein |
| arTal_v1_Chr4_+_16410791_16410791 | 0.48 |
AT4G34290.1
|
AT4G34290
|
SWIB/MDM2 domain superfamily protein |
| arTal_v1_Chr3_+_6191461_6191461 | 0.48 |
AT3G18080.1
|
BGLU44
|
B-S glucosidase 44 |
| arTal_v1_Chr2_+_6950041_6950041 | 0.47 |
AT2G15970.2
|
COR413-PM1
|
cold regulated 413 plasma membrane 1 |
| arTal_v1_Chr3_-_9375671_9375671 | 0.47 |
AT3G25717.1
|
RTFL16
|
ROTUNDIFOLIA like 16 |
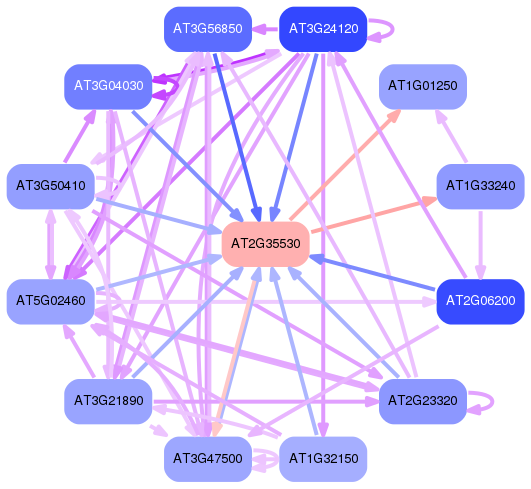
Network of associatons between targets according to the STRING database.

First level regulatory network of AT2G35530
Gene Ontology Analysis
Gene overrepresentation in biological process category:
| Log-likelihood per target | Total log-likelihood | Term | Description |
|---|---|---|---|
| 0.4 | 10.3 | GO:0009768 | photosynthesis, light harvesting in photosystem I(GO:0009768) |
| 0.3 | 1.7 | GO:0009772 | photosynthetic electron transport in photosystem II(GO:0009772) |
| 0.3 | 0.9 | GO:0090143 | nucleoid organization(GO:0090143) |
| 0.3 | 5.5 | GO:0009773 | photosynthetic electron transport in photosystem I(GO:0009773) |
| 0.3 | 0.8 | GO:0006659 | phosphatidylserine metabolic process(GO:0006658) phosphatidylserine biosynthetic process(GO:0006659) |
| 0.3 | 1.6 | GO:0006000 | fructose metabolic process(GO:0006000) |
| 0.2 | 5.4 | GO:0010207 | photosystem II assembly(GO:0010207) |
| 0.2 | 2.2 | GO:0032876 | negative regulation of DNA endoreduplication(GO:0032876) |
| 0.2 | 1.0 | GO:0071277 | cellular response to calcium ion(GO:0071277) |
| 0.2 | 0.6 | GO:0048255 | mRNA stabilization(GO:0048255) |
| 0.2 | 0.6 | GO:1901031 | regulation of response to reactive oxygen species(GO:1901031) |
| 0.2 | 2.1 | GO:2000896 | amylopectin biosynthetic process(GO:0010021) amylopectin metabolic process(GO:2000896) |
| 0.2 | 2.3 | GO:0030388 | fructose 1,6-bisphosphate metabolic process(GO:0030388) |
| 0.2 | 0.5 | GO:1901537 | positive regulation of DNA demethylation(GO:1901537) |
| 0.2 | 0.8 | GO:0010422 | regulation of brassinosteroid biosynthetic process(GO:0010422) regulation of steroid metabolic process(GO:0019218) regulation of steroid biosynthetic process(GO:0050810) regulation of steroid hormone biosynthetic process(GO:0090030) |
| 0.2 | 0.8 | GO:0005980 | glycogen catabolic process(GO:0005980) |
| 0.2 | 0.6 | GO:0015965 | diadenosine polyphosphate metabolic process(GO:0015959) diadenosine tetraphosphate metabolic process(GO:0015965) |
| 0.2 | 0.3 | GO:0090322 | regulation of superoxide metabolic process(GO:0090322) |
| 0.2 | 1.2 | GO:0051294 | establishment of mitotic spindle orientation(GO:0000132) establishment of mitotic spindle localization(GO:0040001) establishment of spindle localization(GO:0051293) establishment of spindle orientation(GO:0051294) spindle localization(GO:0051653) |
| 0.2 | 0.6 | GO:0080170 | hydrogen peroxide transmembrane transport(GO:0080170) |
| 0.2 | 0.5 | GO:0019593 | hexitol metabolic process(GO:0006059) hexitol biosynthetic process(GO:0019406) mannitol biosynthetic process(GO:0019593) mannitol metabolic process(GO:0019594) |
| 0.2 | 0.5 | GO:0010266 | response to vitamin B1(GO:0010266) |
| 0.1 | 0.6 | GO:0000023 | maltose metabolic process(GO:0000023) |
| 0.1 | 2.3 | GO:0009645 | response to low light intensity stimulus(GO:0009645) |
| 0.1 | 0.8 | GO:0006021 | inositol biosynthetic process(GO:0006021) |
| 0.1 | 0.4 | GO:0006557 | S-adenosylmethioninamine biosynthetic process(GO:0006557) S-adenosylmethioninamine metabolic process(GO:0046499) |
| 0.1 | 2.6 | GO:0006949 | syncytium formation(GO:0006949) |
| 0.1 | 1.2 | GO:0070814 | hydrogen sulfide biosynthetic process(GO:0070814) |
| 0.1 | 0.4 | GO:0080051 | cutin transport(GO:0080051) |
| 0.1 | 0.4 | GO:0051639 | actin filament network formation(GO:0051639) |
| 0.1 | 0.4 | GO:0009915 | phloem sucrose loading(GO:0009915) |
| 0.1 | 0.7 | GO:0009090 | homoserine biosynthetic process(GO:0009090) |
| 0.1 | 1.3 | GO:1901348 | positive regulation of secondary cell wall biogenesis(GO:1901348) |
| 0.1 | 0.5 | GO:0010480 | microsporocyte differentiation(GO:0010480) |
| 0.1 | 0.4 | GO:0006063 | uronic acid metabolic process(GO:0006063) galacturonate metabolic process(GO:0019586) |
| 0.1 | 1.4 | GO:1902183 | regulation of shoot apical meristem development(GO:1902183) |
| 0.1 | 0.8 | GO:0010190 | cytochrome b6f complex assembly(GO:0010190) |
| 0.1 | 0.4 | GO:0048363 | mucilage pectin metabolic process(GO:0048363) |
| 0.1 | 0.5 | GO:0045038 | protein import into chloroplast thylakoid membrane(GO:0045038) |
| 0.1 | 1.4 | GO:0030497 | fatty acid elongation(GO:0030497) |
| 0.1 | 0.4 | GO:0009831 | plant-type cell wall modification involved in multidimensional cell growth(GO:0009831) |
| 0.1 | 0.4 | GO:0034764 | positive regulation of transmembrane transport(GO:0034764) |
| 0.1 | 1.4 | GO:0005983 | starch catabolic process(GO:0005983) |
| 0.1 | 0.6 | GO:0009854 | oxidative photosynthetic carbon pathway(GO:0009854) |
| 0.1 | 9.8 | GO:0015979 | photosynthesis(GO:0015979) |
| 0.1 | 0.6 | GO:0042182 | lactate metabolic process(GO:0006089) methylglyoxal metabolic process(GO:0009438) methylglyoxal catabolic process to D-lactate via S-lactoyl-glutathione(GO:0019243) ketone catabolic process(GO:0042182) methylglyoxal catabolic process(GO:0051596) methylglyoxal catabolic process to lactate(GO:0061727) |
| 0.1 | 0.7 | GO:0009970 | cellular response to sulfate starvation(GO:0009970) |
| 0.1 | 4.0 | GO:0010411 | xyloglucan metabolic process(GO:0010411) |
| 0.1 | 0.3 | GO:0098609 | pollen tube adhesion(GO:0009865) cell-cell adhesion(GO:0098609) multi organism cell adhesion(GO:0098740) |
| 0.1 | 0.3 | GO:0010047 | fruit dehiscence(GO:0010047) |
| 0.1 | 0.4 | GO:0080148 | negative regulation of response to water deprivation(GO:0080148) |
| 0.1 | 0.4 | GO:0090057 | procambium histogenesis(GO:0010067) root radial pattern formation(GO:0090057) |
| 0.1 | 0.3 | GO:0010226 | response to lithium ion(GO:0010226) |
| 0.1 | 0.2 | GO:2000039 | regulation of trichome morphogenesis(GO:2000039) |
| 0.1 | 0.4 | GO:0000289 | nuclear-transcribed mRNA poly(A) tail shortening(GO:0000289) |
| 0.1 | 0.7 | GO:0007143 | female meiotic division(GO:0007143) |
| 0.1 | 0.4 | GO:0071219 | cellular response to molecule of bacterial origin(GO:0071219) |
| 0.1 | 0.2 | GO:0006057 | cell wall mannoprotein biosynthetic process(GO:0000032) mannoprotein metabolic process(GO:0006056) mannoprotein biosynthetic process(GO:0006057) cell wall glycoprotein biosynthetic process(GO:0031506) response to cobalt ion(GO:0032025) |
| 0.1 | 2.2 | GO:0009827 | plant-type cell wall modification(GO:0009827) |
| 0.1 | 0.3 | GO:0046208 | spermine catabolic process(GO:0046208) |
| 0.1 | 0.9 | GO:0048497 | maintenance of organ identity(GO:0048496) maintenance of floral organ identity(GO:0048497) |
| 0.1 | 0.3 | GO:0031930 | mitochondria-nucleus signaling pathway(GO:0031930) |
| 0.1 | 0.5 | GO:0006825 | copper ion transport(GO:0006825) |
| 0.1 | 0.4 | GO:0090506 | axillary shoot meristem initiation(GO:0090506) |
| 0.1 | 0.2 | GO:0071163 | regulation of DNA-dependent DNA replication initiation(GO:0030174) DNA replication preinitiation complex assembly(GO:0071163) |
| 0.1 | 0.1 | GO:0010343 | singlet oxygen-mediated programmed cell death(GO:0010343) |
| 0.1 | 0.2 | GO:1901881 | positive regulation of protein depolymerization(GO:1901881) |
| 0.1 | 0.5 | GO:0071249 | cellular response to nitrate(GO:0071249) |
| 0.1 | 0.3 | GO:0010361 | negative regulation of anion channel activity(GO:0010360) regulation of anion channel activity by blue light(GO:0010361) negative regulation of anion channel activity by blue light(GO:0010362) negative regulation of transporter activity(GO:0032410) negative regulation of ion transmembrane transporter activity(GO:0032413) negative regulation of transmembrane transport(GO:0034763) negative regulation of ion transmembrane transport(GO:0034766) negative regulation of anion transport(GO:1903792) negative regulation of anion transmembrane transport(GO:1903960) |
| 0.1 | 0.8 | GO:0018230 | peptidyl-L-cysteine S-palmitoylation(GO:0018230) peptidyl-S-diacylglycerol-L-cysteine biosynthetic process from peptidyl-cysteine(GO:0018231) |
| 0.0 | 0.2 | GO:0033386 | geranylgeranyl diphosphate metabolic process(GO:0033385) geranylgeranyl diphosphate biosynthetic process(GO:0033386) |
| 0.0 | 0.7 | GO:1900056 | negative regulation of leaf senescence(GO:1900056) |
| 0.0 | 0.2 | GO:0080141 | regulation of jasmonic acid metabolic process(GO:0080140) regulation of jasmonic acid biosynthetic process(GO:0080141) |
| 0.0 | 0.7 | GO:0050829 | defense response to Gram-negative bacterium(GO:0050829) |
| 0.0 | 0.8 | GO:0042343 | indole glucosinolate metabolic process(GO:0042343) |
| 0.0 | 2.0 | GO:0009851 | auxin biosynthetic process(GO:0009851) |
| 0.0 | 0.8 | GO:0050821 | protein stabilization(GO:0050821) |
| 0.0 | 0.4 | GO:1901703 | protein localization involved in auxin polar transport(GO:1901703) |
| 0.0 | 0.2 | GO:0048464 | sepal development(GO:0048442) flower calyx development(GO:0048464) |
| 0.0 | 0.8 | GO:0046688 | response to copper ion(GO:0046688) |
| 0.0 | 0.2 | GO:0051016 | barbed-end actin filament capping(GO:0051016) |
| 0.0 | 0.1 | GO:0048533 | sporocyte differentiation(GO:0048533) |
| 0.0 | 0.2 | GO:0009647 | skotomorphogenesis(GO:0009647) |
| 0.0 | 0.8 | GO:0007052 | mitotic spindle organization(GO:0007052) |
| 0.0 | 0.6 | GO:0009901 | anther dehiscence(GO:0009901) |
| 0.0 | 0.4 | GO:0010199 | organ boundary specification between lateral organs and the meristem(GO:0010199) |
| 0.0 | 0.1 | GO:0010028 | xanthophyll cycle(GO:0010028) |
| 0.0 | 0.2 | GO:0010731 | protein glutathionylation(GO:0010731) |
| 0.0 | 0.1 | GO:0048462 | transmitting tissue development(GO:0010500) carpel formation(GO:0048462) |
| 0.0 | 0.4 | GO:0070193 | synaptonemal complex assembly(GO:0007130) synaptonemal complex organization(GO:0070193) |
| 0.0 | 0.3 | GO:0042372 | phylloquinone biosynthetic process(GO:0042372) phylloquinone metabolic process(GO:0042374) |
| 0.0 | 0.5 | GO:0010315 | auxin efflux(GO:0010315) |
| 0.0 | 0.6 | GO:2000012 | regulation of auxin polar transport(GO:2000012) |
| 0.0 | 1.0 | GO:0005992 | trehalose biosynthetic process(GO:0005992) |
| 0.0 | 1.4 | GO:0048825 | cotyledon development(GO:0048825) |
| 0.0 | 0.3 | GO:1902223 | L-phenylalanine biosynthetic process(GO:0009094) erythrose 4-phosphate/phosphoenolpyruvate family amino acid biosynthetic process(GO:1902223) |
| 0.0 | 0.3 | GO:1902584 | positive regulation of response to water deprivation(GO:1902584) |
| 0.0 | 0.5 | GO:0061157 | RNA destabilization(GO:0050779) mRNA destabilization(GO:0061157) |
| 0.0 | 0.1 | GO:0000912 | assembly of actomyosin apparatus involved in cytokinesis(GO:0000912) phragmoplast assembly(GO:0000914) assembly of actomyosin apparatus involved in mitotic cytokinesis(GO:1902407) |
| 0.0 | 0.2 | GO:2000114 | regulation of establishment of cell polarity(GO:2000114) |
| 0.0 | 0.2 | GO:0006121 | mitochondrial electron transport, succinate to ubiquinone(GO:0006121) |
| 0.0 | 0.1 | GO:0016560 | protein import into peroxisome matrix, docking(GO:0016560) protein to membrane docking(GO:0022615) |
| 0.0 | 0.4 | GO:0006782 | protoporphyrinogen IX biosynthetic process(GO:0006782) protoporphyrinogen IX metabolic process(GO:0046501) |
| 0.0 | 0.6 | GO:0010268 | brassinosteroid homeostasis(GO:0010268) |
| 0.0 | 1.5 | GO:0007018 | microtubule-based movement(GO:0007018) |
| 0.0 | 0.2 | GO:1904276 | regulation of wax biosynthetic process(GO:1904276) positive regulation of wax biosynthetic process(GO:1904278) |
| 0.0 | 0.3 | GO:0071329 | cellular response to disaccharide stimulus(GO:0071324) cellular response to sucrose stimulus(GO:0071329) |
| 0.0 | 0.5 | GO:0046856 | phosphatidylinositol dephosphorylation(GO:0046856) |
| 0.0 | 0.3 | GO:1901371 | regulation of leaf morphogenesis(GO:1901371) |
| 0.0 | 0.3 | GO:0009750 | response to fructose(GO:0009750) |
| 0.0 | 0.6 | GO:0009691 | cytokinin biosynthetic process(GO:0009691) |
| 0.0 | 0.9 | GO:0045489 | pectin biosynthetic process(GO:0045489) |
| 0.0 | 0.9 | GO:0015995 | chlorophyll biosynthetic process(GO:0015995) |
| 0.0 | 0.6 | GO:0042631 | cellular response to water deprivation(GO:0042631) |
| 0.0 | 0.2 | GO:2000014 | regulation of endosperm development(GO:2000014) |
| 0.0 | 0.6 | GO:0010193 | response to ozone(GO:0010193) |
| 0.0 | 0.1 | GO:0016103 | diterpenoid catabolic process(GO:0016103) gibberellin catabolic process(GO:0045487) |
| 0.0 | 0.4 | GO:0009959 | negative gravitropism(GO:0009959) |
| 0.0 | 0.1 | GO:0001173 | DNA-templated transcriptional start site selection(GO:0001173) |
| 0.0 | 0.1 | GO:0046622 | positive regulation of organ growth(GO:0046622) |
| 0.0 | 0.4 | GO:0006415 | translational termination(GO:0006415) |
| 0.0 | 0.1 | GO:0015739 | sialic acid transport(GO:0015739) |
| 0.0 | 0.5 | GO:0006506 | GPI anchor metabolic process(GO:0006505) GPI anchor biosynthetic process(GO:0006506) |
| 0.0 | 1.4 | GO:0045490 | pectin catabolic process(GO:0045490) |
| 0.0 | 0.1 | GO:0010929 | positive regulation of auxin mediated signaling pathway(GO:0010929) |
| 0.0 | 0.2 | GO:0071712 | ER-associated misfolded protein catabolic process(GO:0071712) |
| 0.0 | 0.3 | GO:0010227 | floral organ abscission(GO:0010227) |
| 0.0 | 0.1 | GO:0000187 | activation of MAPK activity(GO:0000187) positive regulation of MAP kinase activity(GO:0043406) |
| 0.0 | 0.3 | GO:0006863 | purine nucleobase transport(GO:0006863) |
| 0.0 | 0.1 | GO:0033319 | UDP-D-xylose metabolic process(GO:0033319) UDP-D-xylose biosynthetic process(GO:0033320) |
| 0.0 | 0.2 | GO:2000652 | regulation of secondary cell wall biogenesis(GO:2000652) |
| 0.0 | 0.2 | GO:0070940 | dephosphorylation of RNA polymerase II C-terminal domain(GO:0070940) |
| 0.0 | 0.0 | GO:0060776 | simple leaf morphogenesis(GO:0060776) |
| 0.0 | 0.1 | GO:0051320 | mitotic G1 phase(GO:0000080) mitotic S phase(GO:0000084) mitotic G2 phase(GO:0000085) G1 phase(GO:0051318) G2 phase(GO:0051319) S phase(GO:0051320) interphase(GO:0051325) mitotic interphase(GO:0051329) |
| 0.0 | 0.1 | GO:0042814 | monopolar cell growth(GO:0042814) regulation of monopolar cell growth(GO:0051513) |
| 0.0 | 0.3 | GO:0010345 | suberin biosynthetic process(GO:0010345) |
| 0.0 | 0.2 | GO:1902645 | abscisic acid biosynthetic process(GO:0009688) apocarotenoid biosynthetic process(GO:0043289) tertiary alcohol biosynthetic process(GO:1902645) |
| 0.0 | 0.2 | GO:0001709 | cell fate determination(GO:0001709) |
| 0.0 | 0.3 | GO:0071577 | zinc II ion transmembrane transport(GO:0071577) |
| 0.0 | 0.4 | GO:0010208 | pollen wall assembly(GO:0010208) cellular component assembly involved in morphogenesis(GO:0010927) extracellular matrix assembly(GO:0085029) |
| 0.0 | 0.4 | GO:0045010 | positive regulation of actin filament polymerization(GO:0030838) actin nucleation(GO:0045010) |
| 0.0 | 0.7 | GO:0009566 | fertilization(GO:0009566) double fertilization forming a zygote and endosperm(GO:0009567) |
| 0.0 | 1.1 | GO:0009698 | phenylpropanoid metabolic process(GO:0009698) |
| 0.0 | 0.1 | GO:0006655 | phosphatidylglycerol biosynthetic process(GO:0006655) |
| 0.0 | 0.8 | GO:0009873 | ethylene-activated signaling pathway(GO:0009873) |
| 0.0 | 0.3 | GO:0009958 | positive gravitropism(GO:0009958) |
| 0.0 | 0.0 | GO:0070509 | calcium ion import(GO:0070509) |
| 0.0 | 0.3 | GO:0007166 | cell surface receptor signaling pathway(GO:0007166) |
Gene overrepresentation in cellular component category:
| Log-likelihood per target | Total log-likelihood | Term | Description |
|---|---|---|---|
| 0.7 | 2.2 | GO:0030093 | chloroplast photosystem I(GO:0030093) |
| 0.4 | 3.4 | GO:0009538 | photosystem I reaction center(GO:0009538) |
| 0.4 | 2.4 | GO:0009522 | photosystem I(GO:0009522) |
| 0.3 | 1.0 | GO:0009521 | photosystem(GO:0009521) photosystem II(GO:0009523) |
| 0.3 | 1.2 | GO:0031515 | tRNA (m1A) methyltransferase complex(GO:0031515) |
| 0.3 | 1.5 | GO:0043036 | chloroplast starch grain(GO:0009569) starch grain(GO:0043036) |
| 0.3 | 1.1 | GO:0009509 | chromoplast(GO:0009509) |
| 0.3 | 1.1 | GO:0009317 | acetyl-CoA carboxylase complex(GO:0009317) |
| 0.2 | 5.5 | GO:0009654 | photosystem II oxygen evolving complex(GO:0009654) |
| 0.2 | 3.1 | GO:0098807 | chloroplast thylakoid membrane protein complex(GO:0098807) |
| 0.2 | 7.7 | GO:0031977 | thylakoid lumen(GO:0031977) |
| 0.2 | 2.6 | GO:0010598 | NAD(P)H dehydrogenase complex (plastoquinone)(GO:0010598) |
| 0.1 | 0.4 | GO:0030015 | CCR4-NOT core complex(GO:0030015) |
| 0.1 | 0.4 | GO:0032432 | actin filament bundle(GO:0032432) |
| 0.1 | 5.5 | GO:0010287 | plastoglobule(GO:0010287) |
| 0.1 | 0.3 | GO:0070382 | exocytic vesicle(GO:0070382) |
| 0.1 | 0.4 | GO:0009897 | external side of plasma membrane(GO:0009897) |
| 0.1 | 1.4 | GO:0009508 | plastid chromosome(GO:0009508) |
| 0.1 | 2.2 | GO:0010319 | stromule(GO:0010319) |
| 0.1 | 0.4 | GO:0031209 | SCAR complex(GO:0031209) |
| 0.1 | 0.4 | GO:0034990 | nuclear cohesin complex(GO:0000798) mitotic cohesin complex(GO:0030892) meiotic cohesin complex(GO:0030893) nuclear mitotic cohesin complex(GO:0034990) nuclear meiotic cohesin complex(GO:0034991) |
| 0.1 | 0.7 | GO:0000124 | SAGA complex(GO:0000124) |
| 0.0 | 15.9 | GO:0009579 | thylakoid(GO:0009579) |
| 0.0 | 0.1 | GO:0009501 | amyloplast(GO:0009501) |
| 0.0 | 5.3 | GO:0009505 | plant-type cell wall(GO:0009505) |
| 0.0 | 0.1 | GO:0044545 | NSL complex(GO:0044545) |
| 0.0 | 0.3 | GO:0009986 | cell surface(GO:0009986) |
| 0.0 | 0.1 | GO:0071541 | eukaryotic translation initiation factor 3 complex, eIF3m(GO:0071541) |
| 0.0 | 0.3 | GO:0031304 | intrinsic component of mitochondrial inner membrane(GO:0031304) |
| 0.0 | 7.8 | GO:0009570 | chloroplast stroma(GO:0009570) |
| 0.0 | 0.2 | GO:0045281 | respiratory chain complex II(GO:0045273) succinate dehydrogenase complex(GO:0045281) |
| 0.0 | 0.1 | GO:0000153 | cytoplasmic ubiquitin ligase complex(GO:0000153) |
| 0.0 | 0.1 | GO:0010369 | chromocenter(GO:0010369) |
| 0.0 | 0.9 | GO:0000138 | Golgi trans cisterna(GO:0000138) |
| 0.0 | 0.2 | GO:0016324 | apical plasma membrane(GO:0016324) |
Gene overrepresentation in molecular function category:
| Log-likelihood per target | Total log-likelihood | Term | Description |
|---|---|---|---|
| 1.1 | 6.7 | GO:0016984 | ribulose-bisphosphate carboxylase activity(GO:0016984) |
| 0.4 | 1.6 | GO:0004512 | inositol-3-phosphate synthase activity(GO:0004512) |
| 0.4 | 1.6 | GO:0042132 | fructose 1,6-bisphosphate 1-phosphatase activity(GO:0042132) |
| 0.4 | 1.4 | GO:0016712 | oxidoreductase activity, acting on paired donors, with incorporation or reduction of molecular oxygen, reduced flavin or flavoprotein as one donor, and incorporation of one atom of oxygen(GO:0016712) aromatase activity(GO:0070330) |
| 0.4 | 1.1 | GO:0009374 | biotin binding(GO:0009374) |
| 0.3 | 8.4 | GO:0016168 | chlorophyll binding(GO:0016168) |
| 0.3 | 1.2 | GO:0016429 | tRNA (adenine-N1-)-methyltransferase activity(GO:0016429) |
| 0.3 | 1.4 | GO:0031956 | medium-chain fatty acid-CoA ligase activity(GO:0031956) |
| 0.3 | 0.3 | GO:0031409 | pigment binding(GO:0031409) |
| 0.3 | 2.4 | GO:0004373 | glycogen (starch) synthase activity(GO:0004373) |
| 0.2 | 0.7 | GO:0004412 | homoserine dehydrogenase activity(GO:0004412) |
| 0.2 | 1.9 | GO:0009922 | fatty acid elongase activity(GO:0009922) |
| 0.2 | 0.6 | GO:0010242 | oxygen evolving activity(GO:0010242) |
| 0.2 | 0.6 | GO:0016618 | hydroxypyruvate reductase activity(GO:0016618) |
| 0.2 | 0.8 | GO:0008703 | 5-amino-6-(5-phosphoribosylamino)uracil reductase activity(GO:0008703) |
| 0.2 | 0.6 | GO:0004462 | lactoylglutathione lyase activity(GO:0004462) |
| 0.2 | 1.0 | GO:0010277 | chlorophyllide a oxygenase [overall] activity(GO:0010277) |
| 0.2 | 0.6 | GO:0010297 | 4-alpha-glucanotransferase activity(GO:0004134) heteropolysaccharide binding(GO:0010297) |
| 0.2 | 1.1 | GO:0045156 | electron transporter, transferring electrons within the cyclic electron transport pathway of photosynthesis activity(GO:0045156) |
| 0.2 | 6.2 | GO:0016762 | xyloglucan:xyloglucosyl transferase activity(GO:0016762) |
| 0.2 | 2.3 | GO:0004332 | fructose-bisphosphate aldolase activity(GO:0004332) |
| 0.2 | 0.5 | GO:0045174 | oxidoreductase activity, acting on a sulfur group of donors, quinone or similar compound as acceptor(GO:0016672) glutathione dehydrogenase (ascorbate) activity(GO:0045174) |
| 0.2 | 0.6 | GO:0003959 | NADPH dehydrogenase activity(GO:0003959) |
| 0.2 | 0.8 | GO:0004148 | dihydrolipoyl dehydrogenase activity(GO:0004148) |
| 0.2 | 1.4 | GO:0004096 | catalase activity(GO:0004096) |
| 0.2 | 0.6 | GO:0004556 | alpha-amylase activity(GO:0004556) |
| 0.1 | 0.4 | GO:0004014 | adenosylmethionine decarboxylase activity(GO:0004014) |
| 0.1 | 1.2 | GO:0004020 | adenylylsulfate kinase activity(GO:0004020) |
| 0.1 | 0.6 | GO:0034432 | bis(5'-adenosyl)-pentaphosphatase activity(GO:0034432) |
| 0.1 | 0.4 | GO:0000225 | N-acetylglucosaminylphosphatidylinositol deacetylase activity(GO:0000225) |
| 0.1 | 0.5 | GO:0008395 | steroid hydroxylase activity(GO:0008395) |
| 0.1 | 0.4 | GO:0052739 | phosphatidylserine 1-acylhydrolase activity(GO:0052739) 1-acyl-2-lysophosphatidylserine acylhydrolase activity(GO:0052740) |
| 0.1 | 0.4 | GO:0001227 | transcriptional repressor activity, RNA polymerase II transcription regulatory region sequence-specific binding(GO:0001227) |
| 0.1 | 0.5 | GO:0033843 | xyloglucan 6-xylosyltransferase activity(GO:0033843) |
| 0.1 | 0.6 | GO:0004567 | beta-mannosidase activity(GO:0004567) |
| 0.1 | 0.5 | GO:0043682 | copper-transporting ATPase activity(GO:0043682) |
| 0.1 | 0.4 | GO:0015245 | fatty acid transporter activity(GO:0015245) |
| 0.1 | 1.3 | GO:0016207 | 4-coumarate-CoA ligase activity(GO:0016207) |
| 0.1 | 0.2 | GO:0052736 | beta-glucanase activity(GO:0052736) |
| 0.1 | 0.7 | GO:0016730 | oxidoreductase activity, acting on iron-sulfur proteins as donors(GO:0016730) |
| 0.1 | 0.4 | GO:0004535 | poly(A)-specific ribonuclease activity(GO:0004535) |
| 0.1 | 1.0 | GO:0103075 | indole-3-pyruvate monooxygenase activity(GO:0103075) |
| 0.1 | 0.3 | GO:0001216 | bacterial-type RNA polymerase transcription factor activity, sequence-specific DNA binding(GO:0001130) bacterial-type RNA polymerase transcriptional activator activity, sequence-specific DNA binding(GO:0001216) |
| 0.1 | 0.6 | GO:0008083 | growth factor activity(GO:0008083) |
| 0.1 | 2.1 | GO:0008266 | poly(U) RNA binding(GO:0008266) |
| 0.1 | 0.5 | GO:0019144 | ADP-sugar diphosphatase activity(GO:0019144) ADP-ribose pyrophosphohydrolase activity(GO:0080041) |
| 0.1 | 0.6 | GO:0052622 | ATP dimethylallyltransferase activity(GO:0052622) ADP dimethylallyltransferase activity(GO:0052623) |
| 0.1 | 0.3 | GO:0003680 | AT DNA binding(GO:0003680) |
| 0.1 | 0.4 | GO:0050378 | UDP-glucuronate 4-epimerase activity(GO:0050378) |
| 0.1 | 0.7 | GO:0016872 | intramolecular lyase activity(GO:0016872) |
| 0.1 | 0.2 | GO:0003844 | 1,4-alpha-glucan branching enzyme activity(GO:0003844) |
| 0.1 | 0.7 | GO:0000254 | C-4 methylsterol oxidase activity(GO:0000254) |
| 0.1 | 0.6 | GO:0008506 | sucrose:proton symporter activity(GO:0008506) |
| 0.1 | 0.4 | GO:0001872 | (1->3)-beta-D-glucan binding(GO:0001872) |
| 0.1 | 0.4 | GO:0016621 | cinnamoyl-CoA reductase activity(GO:0016621) |
| 0.1 | 0.2 | GO:0004476 | mannose-6-phosphate isomerase activity(GO:0004476) |
| 0.1 | 0.4 | GO:0016149 | translation release factor activity, codon specific(GO:0016149) |
| 0.0 | 0.6 | GO:0000774 | adenyl-nucleotide exchange factor activity(GO:0000774) |
| 0.0 | 0.8 | GO:0019706 | protein-cysteine S-palmitoyltransferase activity(GO:0019706) protein-cysteine S-acyltransferase activity(GO:0019707) |
| 0.0 | 2.0 | GO:0019203 | carbohydrate phosphatase activity(GO:0019203) |
| 0.0 | 0.6 | GO:0019210 | kinase inhibitor activity(GO:0019210) |
| 0.0 | 1.5 | GO:0016655 | oxidoreductase activity, acting on NAD(P)H, quinone or similar compound as acceptor(GO:0016655) |
| 0.0 | 0.9 | GO:0005199 | structural constituent of cell wall(GO:0005199) |
| 0.0 | 0.7 | GO:0034485 | phosphatidylinositol-3,4,5-trisphosphate 5-phosphatase activity(GO:0034485) |
| 0.0 | 0.3 | GO:0046592 | polyamine oxidase activity(GO:0046592) |
| 0.0 | 0.2 | GO:0070182 | DNA polymerase binding(GO:0070182) |
| 0.0 | 0.5 | GO:0015112 | nitrate transmembrane transporter activity(GO:0015112) |
| 0.0 | 1.1 | GO:0047262 | polygalacturonate 4-alpha-galacturonosyltransferase activity(GO:0047262) |
| 0.0 | 0.1 | GO:0034594 | phosphatidylinositol-3,4,5-trisphosphate 3-phosphatase activity(GO:0016314) phosphatidylinositol trisphosphate phosphatase activity(GO:0034594) |
| 0.0 | 0.1 | GO:0002151 | G-quadruplex RNA binding(GO:0002151) |
| 0.0 | 2.4 | GO:0003777 | microtubule motor activity(GO:0003777) |
| 0.0 | 0.2 | GO:0008177 | succinate dehydrogenase (ubiquinone) activity(GO:0008177) |
| 0.0 | 0.3 | GO:0005375 | copper ion transmembrane transporter activity(GO:0005375) |
| 0.0 | 0.5 | GO:0010329 | auxin efflux transmembrane transporter activity(GO:0010329) |
| 0.0 | 0.6 | GO:0005372 | water transmembrane transporter activity(GO:0005372) water channel activity(GO:0015250) |
| 0.0 | 0.3 | GO:0009882 | blue light photoreceptor activity(GO:0009882) |
| 0.0 | 0.3 | GO:0017048 | Rho GTPase binding(GO:0017048) |
| 0.0 | 1.9 | GO:0004650 | polygalacturonase activity(GO:0004650) |
| 0.0 | 0.1 | GO:0005315 | inorganic phosphate transmembrane transporter activity(GO:0005315) |
| 0.0 | 0.6 | GO:0030570 | carbon-oxygen lyase activity, acting on polysaccharides(GO:0016837) pectate lyase activity(GO:0030570) |
| 0.0 | 0.2 | GO:0004337 | geranyltranstransferase activity(GO:0004337) |
| 0.0 | 0.3 | GO:0047938 | glucose-6-phosphate 1-epimerase activity(GO:0047938) |
| 0.0 | 1.4 | GO:0046910 | pectinesterase inhibitor activity(GO:0046910) |
| 0.0 | 1.9 | GO:0004857 | enzyme inhibitor activity(GO:0004857) |
| 0.0 | 1.0 | GO:0003993 | acid phosphatase activity(GO:0003993) |
| 0.0 | 0.3 | GO:0004124 | cysteine synthase activity(GO:0004124) |
| 0.0 | 0.1 | GO:0015136 | sialic acid transmembrane transporter activity(GO:0015136) |
| 0.0 | 0.3 | GO:0070628 | proteasome binding(GO:0070628) |
| 0.0 | 0.4 | GO:0052716 | hydroquinone:oxygen oxidoreductase activity(GO:0052716) |
| 0.0 | 0.2 | GO:0032440 | 2-alkenal reductase [NAD(P)] activity(GO:0032440) |
| 0.0 | 0.2 | GO:0008061 | chitin binding(GO:0008061) |
| 0.0 | 0.2 | GO:0008453 | alanine-glyoxylate transaminase activity(GO:0008453) |
| 0.0 | 0.1 | GO:0045543 | gibberellin 2-beta-dioxygenase activity(GO:0045543) C-19 gibberellin 2-beta-dioxygenase activity(GO:0052634) |
| 0.0 | 0.1 | GO:0004181 | metallocarboxypeptidase activity(GO:0004181) |
| 0.0 | 0.2 | GO:0009927 | histidine phosphotransfer kinase activity(GO:0009927) |
| 0.0 | 0.2 | GO:0031176 | endo-1,4-beta-xylanase activity(GO:0031176) |
| 0.0 | 0.2 | GO:0016308 | 1-phosphatidylinositol-4-phosphate 5-kinase activity(GO:0016308) |
| 0.0 | 0.7 | GO:0003713 | transcription coactivator activity(GO:0003713) |
| 0.0 | 0.1 | GO:1990269 | phosphoserine binding(GO:0050815) RNA polymerase II C-terminal domain phosphoserine binding(GO:1990269) |
| 0.0 | 0.4 | GO:0016597 | amino acid binding(GO:0016597) |
| 0.0 | 0.6 | GO:0000295 | adenine nucleotide transmembrane transporter activity(GO:0000295) |
| 0.0 | 0.3 | GO:0005345 | purine nucleobase transmembrane transporter activity(GO:0005345) |
| 0.0 | 0.2 | GO:0015114 | phosphate ion transmembrane transporter activity(GO:0015114) |
| 0.0 | 0.1 | GO:0048040 | UDP-glucuronate decarboxylase activity(GO:0048040) |
| 0.0 | 0.2 | GO:0008420 | CTD phosphatase activity(GO:0008420) |
| 0.0 | 0.0 | GO:0015292 | uniporter activity(GO:0015292) |
| 0.0 | 0.5 | GO:0102483 | scopolin beta-glucosidase activity(GO:0102483) |
Gene overrepresentation in curated gene sets: canonical pathways category:
| Log-likelihood per target | Total log-likelihood | Term | Description |
|---|---|---|---|
| 0.0 | 0.2 | PID HDAC CLASSII PATHWAY | Signaling events mediated by HDAC Class II |
| 0.0 | 0.1 | PID AMB2 NEUTROPHILS PATHWAY | amb2 Integrin signaling |
| 0.0 | 0.1 | SA G1 AND S PHASES | Cdk2, 4, and 6 bind cyclin D in G1, while cdk2/cyclin E promotes the G1/S transition. |
Gene overrepresentation in curated gene sets: REACTOME pathways category:
| Log-likelihood per target | Total log-likelihood | Term | Description |
|---|---|---|---|
| 0.1 | 0.4 | REACTOME DOPAMINE NEUROTRANSMITTER RELEASE CYCLE | Genes involved in Dopamine Neurotransmitter Release Cycle |
| 0.0 | 0.4 | REACTOME ASPARAGINE N LINKED GLYCOSYLATION | Genes involved in Asparagine N-linked glycosylation |
| 0.0 | 0.4 | REACTOME CHEMOKINE RECEPTORS BIND CHEMOKINES | Genes involved in Chemokine receptors bind chemokines |
| 0.0 | 0.1 | REACTOME SYNTHESIS OF PIPS AT THE GOLGI MEMBRANE | Genes involved in Synthesis of PIPs at the Golgi membrane |
| 0.0 | 0.8 | REACTOME PEPTIDE CHAIN ELONGATION | Genes involved in Peptide chain elongation |
| 0.0 | 0.2 | REACTOME FACTORS INVOLVED IN MEGAKARYOCYTE DEVELOPMENT AND PLATELET PRODUCTION | Genes involved in Factors involved in megakaryocyte development and platelet production |