Project
GSE43616: Time-course of wild-type Arabidopsis leaf
Navigation
Downloads
Results for AT2G27050
Z-value: 0.09
Transcription factors associated with AT2G27050
| Gene Symbol | Gene ID | Gene Info |
|---|---|---|
|
AT2G27050
|
AT2G27050 | ETHYLENE-INSENSITIVE3-like 1 |
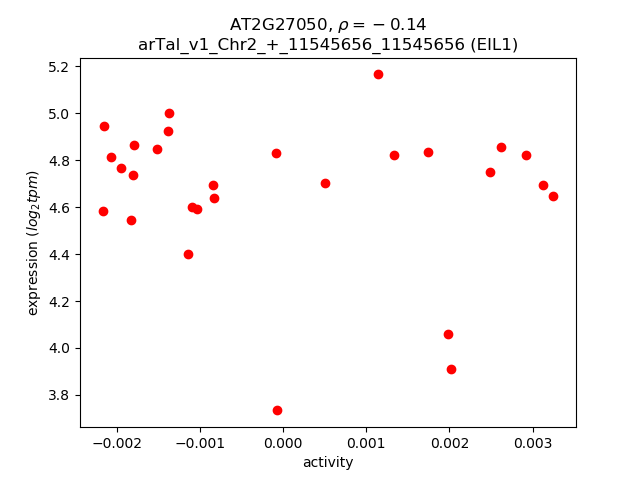
Activity-expression correlation:
| Gene | Promoter | Pearson corr. coef. | P-value | Plot |
|---|---|---|---|---|
| EIL1 | arTal_v1_Chr2_+_11545656_11545656 | -0.14 | 4.7e-01 | Click! |
Activity profile of AT2G27050 motif
Sorted Z-values of AT2G27050 motif
| Promoter | Log-likelihood | Transcript | Gene | Gene Info |
|---|---|---|---|---|
| arTal_v1_Chr3_+_8295617_8295617 | 0.24 |
AT3G23240.1
|
ERF1
|
ethylene response factor 1 |
| arTal_v1_Chr2_-_12996012_12996012 | 0.06 |
AT2G30490.1
|
C4H
|
cinnamate-4-hydroxylase |
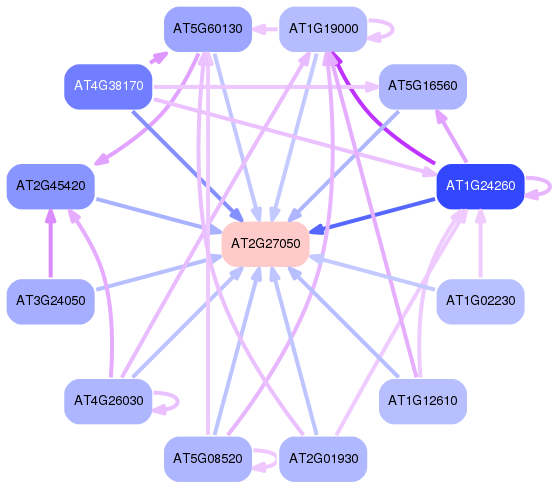
Network of associatons between targets according to the STRING database.
