Project
GSE43616: Time-course of wild-type Arabidopsis leaf
Navigation
Downloads
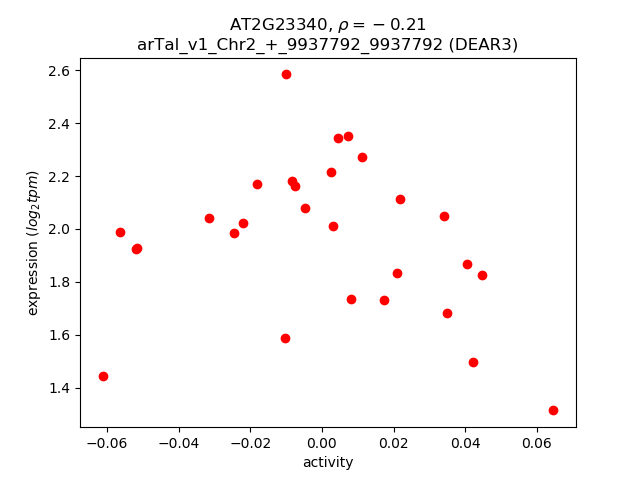
Results for AT2G23340
Z-value: 1.79
Transcription factors associated with AT2G23340
| Gene Symbol | Gene ID | Gene Info |
|---|---|---|
|
AT2G23340
|
AT2G23340 | DREB and EAR motif protein 3 |
Activity-expression correlation:
| Gene | Promoter | Pearson corr. coef. | P-value | Plot |
|---|---|---|---|---|
| DEAR3 | arTal_v1_Chr2_+_9937792_9937792 | -0.21 | 2.7e-01 | Click! |
Activity profile of AT2G23340 motif
Sorted Z-values of AT2G23340 motif
| Promoter | Log-likelihood | Transcript | Gene | Gene Info |
|---|---|---|---|---|
| arTal_v1_Chr4_-_18098633_18098633 | 13.56 |
AT4G38770.1
|
PRP4
|
proline-rich protein 4 |
| arTal_v1_Chr3_+_5505360_5505360 | 13.39 |
AT3G16240.1
|
DELTA-TIP
|
delta tonoplast integral protein |
| arTal_v1_Chr5_+_8863224_8863224 | 10.81 |
AT5G25460.1
|
DGR2
|
transmembrane protein, putative (Protein of unknown function, DUF642) |
| arTal_v1_Chr2_-_18744322_18744322 | 10.47 |
AT2G45470.1
|
FLA8
|
FASCICLIN-like arabinogalactan protein 8 |
| arTal_v1_Chr4_-_7493080_7493080 | 10.05 |
AT4G12730.1
|
FLA2
|
FASCICLIN-like arabinogalactan 2 |
| arTal_v1_Chr5_+_26298728_26298728 | 10.03 |
AT5G65730.1
|
XTH6
|
xyloglucan endotransglucosylase/hydrolase 6 |
| arTal_v1_Chr2_+_2763449_2763513 | 9.37 |
AT2G06850.1
AT2G06850.2 |
XTH4
|
xyloglucan endotransglucosylase/hydrolase 4 |
| arTal_v1_Chr5_+_26767599_26767599 | 8.54 |
AT5G67070.1
|
RALFL34
|
ralf-like 34 |
| arTal_v1_Chr5_-_22560461_22560541 | 8.53 |
AT5G55730.2
AT5G55730.1 |
FLA1
|
FASCICLIN-like arabinogalactan 1 |
| arTal_v1_Chr5_+_625254_625254 | 8.48 |
AT5G02760.1
|
AT5G02760
|
Protein phosphatase 2C family protein |
| arTal_v1_Chr2_+_8940833_8940833 | 8.42 |
AT2G20750.2
AT2G20750.1 |
EXPB1
|
expansin B1 |
| arTal_v1_Chr5_+_4087689_4087689 | 8.39 |
AT5G12940.1
|
AT5G12940
|
Leucine-rich repeat (LRR) family protein |
| arTal_v1_Chr3_-_8589754_8589754 | 8.16 |
AT3G23810.1
|
SAHH2
|
S-adenosyl-l-homocysteine (SAH) hydrolase 2 |
| arTal_v1_Chr3_+_23345754_23345754 | 8.00 |
AT3G63200.1
|
PLP9
|
PATATIN-like protein 9 |
| arTal_v1_Chr2_+_17592038_17592038 | 7.96 |
AT2G42220.1
|
AT2G42220
|
Rhodanese/Cell cycle control phosphatase superfamily protein |
| arTal_v1_Chr3_-_4744263_4744263 | 7.92 |
AT3G14240.1
|
AT3G14240
|
Subtilase family protein |
| arTal_v1_Chr4_-_17606924_17607050 | 7.72 |
AT4G37450.1
AT4G37450.2 |
AGP18
|
arabinogalactan protein 18 |
| arTal_v1_Chr4_+_6100714_6100714 | 7.48 |
AT4G09650.1
|
ATPD
|
F-type H+-transporting ATPase subunit delta |
| arTal_v1_Chr1_-_4530222_4530222 | 7.47 |
AT1G13250.1
|
GATL3
|
galacturonosyltransferase-like 3 |
| arTal_v1_Chr1_+_3008910_3008910 | 7.42 |
AT1G09310.1
|
AT1G09310
|
plant/protein (Protein of unknown function, DUF538) |
| arTal_v1_Chr1_+_12267808_12267808 | 7.42 |
AT1G33811.1
|
AT1G33811
|
GDSL-like Lipase/Acylhydrolase superfamily protein |
| arTal_v1_Chr5_+_5237970_5238178 | 7.42 |
AT5G16030.1
AT5G16030.4 AT5G16030.2 AT5G16030.3 |
AT5G16030
|
mental retardation GTPase activating protein |
| arTal_v1_Chr3_-_2334185_2334185 | 7.38 |
AT3G07320.1
|
AT3G07320
|
O-Glycosyl hydrolases family 17 protein |
| arTal_v1_Chr5_+_21020014_21020014 | 7.37 |
AT5G51750.1
|
SBT1.3
|
subtilase 1.3 |
| arTal_v1_Chr1_-_28419635_28419635 | 7.34 |
AT1G75680.1
|
GH9B7
|
glycosyl hydrolase 9B7 |
| arTal_v1_Chr2_-_9062093_9062093 | 7.33 |
AT2G21140.1
|
PRP2
|
proline-rich protein 2 |
| arTal_v1_Chr2_-_15474717_15474828 | 7.23 |
AT2G36870.2
AT2G36870.1 |
XTH32
|
xyloglucan endotransglucosylase/hydrolase 32 |
| arTal_v1_Chr4_+_15401640_15401640 | 7.15 |
AT4G31840.1
|
ENODL15
|
early nodulin-like protein 15 |
| arTal_v1_Chr3_-_23328789_23328789 | 7.10 |
AT3G63140.1
|
CSP41A
|
chloroplast stem-loop binding protein of 41 kDa |
| arTal_v1_Chr2_+_1676999_1676999 | 7.00 |
AT2G04780.2
|
FLA7
|
FASCICLIN-like arabinoogalactan 7 |
| arTal_v1_Chr1_-_3880391_3880391 | 6.91 |
AT1G11545.1
|
XTH8
|
xyloglucan endotransglucosylase/hydrolase 8 |
| arTal_v1_Chr2_+_1676717_1676717 | 6.83 |
AT2G04780.1
|
FLA7
|
FASCICLIN-like arabinoogalactan 7 |
| arTal_v1_Chr4_-_12768239_12768239 | 6.80 |
AT4G24770.1
|
RBP31
|
31-kDa RNA binding protein |
| arTal_v1_Chr4_-_12769419_12769419 | 6.77 |
AT4G24770.2
|
RBP31
|
31-kDa RNA binding protein |
| arTal_v1_Chr3_+_8586359_8586359 | 6.76 |
AT3G23805.1
|
RALFL24
|
ralf-like 24 |
| arTal_v1_Chr5_+_21479382_21479382 | 6.70 |
AT5G52970.1
AT5G52970.2 |
AT5G52970
|
thylakoid lumen 15.0 kDa protein |
| arTal_v1_Chr5_+_3889906_3889906 | 6.67 |
AT5G12050.1
|
AT5G12050
|
rho GTPase-activating protein |
| arTal_v1_Chr5_+_5238502_5238502 | 6.61 |
AT5G16030.5
|
AT5G16030
|
mental retardation GTPase activating protein |
| arTal_v1_Chr5_+_16468327_16468344 | 6.57 |
AT5G41140.1
AT5G41140.2 |
AT5G41140
|
Myosin heavy chain-related protein |
| arTal_v1_Chr1_-_26515188_26515255 | 6.45 |
AT1G70370.2
AT1G70370.1 |
PG2
|
polygalacturonase 2 |
| arTal_v1_Chr3_+_18262290_18262511 | 6.43 |
AT3G49260.1
AT3G49260.3 AT3G49260.2 AT3G49260.4 |
iqd21
|
IQ-domain 21 |
| arTal_v1_Chr4_-_12772438_12772479 | 6.43 |
AT4G24780.1
AT4G24780.2 |
AT4G24780
|
Pectin lyase-like superfamily protein |
| arTal_v1_Chr1_+_310169_310169 | 6.42 |
AT1G01900.1
|
SBTI1.1
|
subtilase family protein |
| arTal_v1_Chr3_+_17949416_17949416 | 6.38 |
AT3G48460.1
|
AT3G48460
|
GDSL-like Lipase/Acylhydrolase superfamily protein |
| arTal_v1_Chr4_+_17243583_17243583 | 6.37 |
AT4G36540.2
AT4G36540.1 |
BEE2
|
BR enhanced expression 2 |
| arTal_v1_Chr5_-_990630_990630 | 6.35 |
AT5G03760.1
|
ATCSLA09
|
Nucleotide-diphospho-sugar transferases superfamily protein |
| arTal_v1_Chr5_-_8338032_8338032 | 6.33 |
AT5G24420.1
|
PGL5
|
6-phosphogluconolactonase 5 |
| arTal_v1_Chr1_-_6319427_6319427 | 6.33 |
AT1G18360.1
|
AT1G18360
|
alpha/beta-Hydrolases superfamily protein |
| arTal_v1_Chr4_+_9556783_9556783 | 6.31 |
AT4G16980.1
|
AT4G16980
|
arabinogalactan-protein family |
| arTal_v1_Chr5_-_21092410_21092410 | 6.31 |
AT5G51890.1
|
AT5G51890
|
Peroxidase superfamily protein |
| arTal_v1_Chr5_-_671687_671687 | 6.30 |
AT5G02890.1
|
AT5G02890
|
HXXXD-type acyl-transferase family protein |
| arTal_v1_Chr2_+_13647699_13647699 | 6.26 |
AT2G32100.1
|
OFP16
|
ovate family protein 16 |
| arTal_v1_Chr1_+_28428671_28428671 | 6.17 |
AT1G75710.1
|
AT1G75710
|
C2H2-like zinc finger protein |
| arTal_v1_Chr5_-_8916856_8916856 | 6.17 |
AT5G25610.1
|
RD22
|
BURP domain-containing protein |
| arTal_v1_Chr5_+_208866_208866 | 6.13 |
AT5G01530.1
|
LHCB4.1
|
light harvesting complex photosystem II |
| arTal_v1_Chr4_-_17181261_17181261 | 6.09 |
AT4G36360.2
|
BGAL3
|
beta-galactosidase 3 |
| arTal_v1_Chr4_-_13958107_13958107 | 6.08 |
AT4G28080.1
|
AT4G28080
|
Tetratricopeptide repeat (TPR)-like superfamily protein |
| arTal_v1_Chr3_+_5314817_5314817 | 6.07 |
AT3G15680.1
AT3G15680.2 |
AT3G15680
|
Ran BP2/NZF zinc finger-like superfamily protein |
| arTal_v1_Chr4_-_17181466_17181466 | 6.06 |
AT4G36360.1
|
BGAL3
|
beta-galactosidase 3 |
| arTal_v1_Chr4_+_12876822_12876948 | 6.06 |
AT4G25080.6
AT4G25080.5 AT4G25080.2 AT4G25080.1 AT4G25080.3 AT4G25080.4 |
CHLM
|
magnesium-protoporphyrin IX methyltransferase |
| arTal_v1_Chr5_-_24990331_24990331 | 6.04 |
AT5G62220.1
|
GT18
|
glycosyltransferase 18 |
| arTal_v1_Chr3_+_18973126_18973126 | 6.03 |
AT3G51080.1
|
GATA6
|
GATA transcription factor 6 |
| arTal_v1_Chr3_-_3108266_3108385 | 5.95 |
AT3G10080.1
AT3G10080.2 |
AT3G10080
|
RmlC-like cupins superfamily protein |
| arTal_v1_Chr4_-_13398307_13398307 | 5.94 |
AT4G26540.1
|
AT4G26540
|
Leucine-rich repeat receptor-like protein kinase family protein |
| arTal_v1_Chr1_-_15607966_15607966 | 5.93 |
AT1G41830.1
|
SKS6
|
SKU5-similar 6 |
| arTal_v1_Chr3_-_5252697_5252792 | 5.85 |
AT3G15520.1
AT3G15520.2 AT3G15520.3 |
AT3G15520
|
Cyclophilin-like peptidyl-prolyl cis-trans isomerase family protein |
| arTal_v1_Chr1_+_23911024_23911024 | 5.81 |
AT1G64390.1
|
GH9C2
|
glycosyl hydrolase 9C2 |
| arTal_v1_Chr4_-_16806830_16806830 | 5.81 |
AT4G35320.1
|
AT4G35320
|
hypothetical protein |
| arTal_v1_Chr4_+_15819489_15819489 | 5.78 |
AT4G32800.1
|
AT4G32800
|
Integrase-type DNA-binding superfamily protein |
| arTal_v1_Chr5_+_1952505_1952505 | 5.75 |
AT5G06390.1
|
FLA17
|
FASCICLIN-like arabinogalactan protein 17 precursor |
| arTal_v1_Chr3_+_2717557_2717676 | 5.73 |
AT3G08940.2
AT3G08940.1 |
LHCB4.2
|
light harvesting complex photosystem II |
| arTal_v1_Chr4_+_160643_160643 | 5.72 |
AT4G00360.1
|
CYP86A2
|
cytochrome P450, family 86, subfamily A, polypeptide 2 |
| arTal_v1_Chr2_+_6399621_6399621 | 5.70 |
AT2G14890.2
|
AGP9
|
arabinogalactan protein 9 |
| arTal_v1_Chr4_-_15429113_15429225 | 5.69 |
AT4G31890.2
AT4G31890.1 AT4G31890.3 |
AT4G31890
|
ARM repeat superfamily protein |
| arTal_v1_Chr2_-_15797059_15797059 | 5.67 |
AT2G37660.1
|
AT2G37660
|
NAD(P)-binding Rossmann-fold superfamily protein |
| arTal_v1_Chr1_-_28581315_28581315 | 5.66 |
AT1G76160.1
|
sks5
|
SKU5 similar 5 |
| arTal_v1_Chr4_-_10278794_10278794 | 5.61 |
AT4G18670.1
|
AT4G18670
|
Leucine-rich repeat (LRR) family protein |
| arTal_v1_Chr3_-_7187521_7187521 | 5.58 |
AT3G20570.1
|
ENODL9
|
early nodulin-like protein 9 |
| arTal_v1_Chr5_+_15742543_15742543 | 5.54 |
AT5G39320.1
|
UDG4
|
UDP-glucose 6-dehydrogenase family protein |
| arTal_v1_Chr4_-_7591259_7591259 | 5.51 |
AT4G12980.1
|
AT4G12980
|
Auxin-responsive family protein |
| arTal_v1_Chr5_+_16768935_16768935 | 5.51 |
AT5G41900.1
|
AT5G41900
|
alpha/beta-Hydrolases superfamily protein |
| arTal_v1_Chr3_+_11252807_11252807 | 5.45 |
AT3G29320.1
|
PHS1
|
Glycosyl transferase, family 35 |
| arTal_v1_Chr4_+_17986384_17986384 | 5.38 |
AT4G38430.1
|
ROPGEF1
|
rho guanyl-nucleotide exchange factor 1 |
| arTal_v1_Chr5_+_21582614_21582614 | 5.38 |
AT5G53200.1
|
TRY
|
Homeodomain-like superfamily protein |
| arTal_v1_Chr1_-_1307973_1307973 | 5.36 |
AT1G04680.1
|
AT1G04680
|
Pectin lyase-like superfamily protein |
| arTal_v1_Chr5_-_7652714_7652714 | 5.36 |
AT5G22880.1
|
HTB2
|
histone B2 |
| arTal_v1_Chr5_+_6387341_6387489 | 5.34 |
AT5G19090.1
AT5G19090.4 AT5G19090.3 AT5G19090.2 |
AT5G19090
|
Heavy metal transport/detoxification superfamily protein |
| arTal_v1_Chr1_+_9259750_9259750 | 5.31 |
AT1G26770.2
|
EXPA10
|
expansin A10 |
| arTal_v1_Chr5_-_3278461_3278461 | 5.31 |
AT5G10430.1
|
AGP4
|
arabinogalactan protein 4 |
| arTal_v1_Chr1_-_18690503_18690503 | 5.29 |
AT1G50450.1
|
AT1G50450
|
Saccharopine dehydrogenase |
| arTal_v1_Chr3_-_2216483_2216483 | 5.29 |
AT3G07010.1
AT3G07010.2 |
AT3G07010
|
Pectin lyase-like superfamily protein |
| arTal_v1_Chr3_-_6980523_6980523 | 5.29 |
AT3G20015.1
|
AT3G20015
|
Eukaryotic aspartyl protease family protein |
| arTal_v1_Chr2_+_6399405_6399405 | 5.27 |
AT2G14890.1
|
AGP9
|
arabinogalactan protein 9 |
| arTal_v1_Chr5_-_16820195_16820195 | 5.24 |
AT5G42070.1
|
AT5G42070
|
hypothetical protein |
| arTal_v1_Chr1_+_9259432_9259432 | 5.19 |
AT1G26770.1
|
EXPA10
|
expansin A10 |
| arTal_v1_Chr4_-_18160158_18160158 | 5.19 |
AT4G38950.2
AT4G38950.1 AT4G38950.3 |
AT4G38950
|
ATP binding microtubule motor family protein |
| arTal_v1_Chr1_-_8559066_8559066 | 5.16 |
AT1G24170.1
|
LGT9
|
Nucleotide-diphospho-sugar transferases superfamily protein |
| arTal_v1_Chr3_+_6105908_6105908 | 5.15 |
AT3G17840.1
|
RLK902
|
receptor-like kinase 902 |
| arTal_v1_Chr5_-_7419335_7419335 | 5.14 |
AT5G22390.1
|
AT5G22390
|
FANTASTIC four-like protein (DUF3049) |
| arTal_v1_Chr3_-_9723904_9723904 | 5.12 |
AT3G26520.1
|
TIP2
|
tonoplast intrinsic protein 2 |
| arTal_v1_Chr3_+_22745514_22745514 | 5.10 |
AT3G61470.1
|
LHCA2
|
photosystem I light harvesting complex protein |
| arTal_v1_Chr5_-_7047446_7047446 | 5.10 |
AT5G20820.1
|
AT5G20820
|
SAUR-like auxin-responsive protein family |
| arTal_v1_Chr2_+_10662190_10662190 | 5.07 |
AT2G25060.1
|
ENODL14
|
early nodulin-like protein 14 |
| arTal_v1_Chr2_+_13940187_13940187 | 5.04 |
AT2G32860.2
AT2G32860.1 |
BGLU33
|
beta glucosidase 33 |
| arTal_v1_Chr3_-_6855513_6855590 | 5.02 |
AT3G19720.3
AT3G19720.2 AT3G19720.1 |
ARC5
|
P-loop containing nucleoside triphosphate hydrolases superfamily protein |
| arTal_v1_Chr3_-_23417119_23417119 | 5.01 |
AT3G63410.1
|
APG1
|
S-adenosyl-L-methionine-dependent methyltransferases superfamily protein |
| arTal_v1_Chr4_-_14439723_14439769 | 5.00 |
AT4G29310.1
AT4G29310.2 |
AT4G29310
|
DUF1005 family protein (DUF1005) |
| arTal_v1_Chr4_-_15312987_15312987 | 4.98 |
AT4G31590.1
|
CSLC5
|
Cellulose-synthase-like C5 |
| arTal_v1_Chr5_+_1912013_1912013 | 4.94 |
AT5G06270.2
AT5G06270.1 |
AT5G06270
|
hypothetical protein |
| arTal_v1_Chr3_-_2175686_2175771 | 4.93 |
AT3G06880.1
AT3G06880.5 AT3G06880.4 AT3G06880.3 AT3G06880.2 |
AT3G06880
|
Transducin/WD40 repeat-like superfamily protein |
| arTal_v1_Chr3_-_18834834_18834834 | 4.90 |
AT3G50685.1
|
AT3G50685
|
anti-muellerian hormone type-2 receptor |
| arTal_v1_Chr5_+_16151772_16151772 | 4.90 |
AT5G40380.3
AT5G40380.2 |
CRK42
|
cysteine-rich RLK (RECEPTOR-like protein kinase) 42 |
| arTal_v1_Chr3_+_10505711_10505711 | 4.88 |
AT3G28180.1
|
CSLC04
|
Cellulose-synthase-like C4 |
| arTal_v1_Chr3_-_1855063_1855197 | 4.87 |
AT3G06130.2
AT3G06130.1 |
AT3G06130
|
Heavy metal transport/detoxification superfamily protein |
| arTal_v1_Chr4_-_18158873_18158873 | 4.87 |
AT4G38950.4
AT4G38950.5 |
AT4G38950
|
ATP binding microtubule motor family protein |
| arTal_v1_Chr3_+_21948851_21948851 | 4.84 |
AT3G59410.3
|
GCN2
|
protein kinase family protein |
| arTal_v1_Chr1_-_19101265_19101265 | 4.83 |
AT1G51500.1
|
ABCG12
|
ABC-2 type transporter family protein |
| arTal_v1_Chr4_-_13496738_13496738 | 4.83 |
AT4G26830.1
AT4G26830.2 |
AT4G26830
|
O-Glycosyl hydrolases family 17 protein |
| arTal_v1_Chr4_+_14304921_14304921 | 4.82 |
AT4G29020.2
AT4G29020.1 |
AT4G29020
|
glycine-rich protein |
| arTal_v1_Chr5_+_18894378_18894378 | 4.79 |
AT5G46570.1
|
BSK2
|
BR-signaling kinase 2 |
| arTal_v1_Chr3_-_9255083_9255083 | 4.76 |
AT3G25500.1
|
AFH1
|
formin homology 1 |
| arTal_v1_Chr1_+_18351324_18351324 | 4.74 |
AT1G49580.1
|
AT1G49580
|
Calcium-dependent protein kinase (CDPK) family protein |
| arTal_v1_Chr1_+_12188678_12188678 | 4.73 |
AT1G33610.1
|
AT1G33610
|
Leucine-rich repeat (LRR) family protein |
| arTal_v1_Chr3_-_20257916_20257916 | 4.73 |
AT3G54720.1
|
AMP1
|
Peptidase M28 family protein |
| arTal_v1_Chr3_-_427095_427095 | 4.68 |
AT3G02250.1
|
AT3G02250
|
O-fucosyltransferase family protein |
| arTal_v1_Chr1_+_19879405_19879405 | 4.63 |
AT1G53300.1
|
TTL1
|
tetratricopetide-repeat thioredoxin-like 1 |
| arTal_v1_Chr1_+_18802552_18802552 | 4.63 |
AT1G50732.1
|
AT1G50732
|
transmembrane protein |
| arTal_v1_Chr2_-_14523568_14523568 | 4.59 |
AT2G34420.1
|
LHB1B2
|
photosystem II light harvesting complex protein B1B2 |
| arTal_v1_Chr5_+_25016860_25016860 | 4.57 |
AT5G62280.1
|
AT5G62280
|
DUF1442 family protein (DUF1442) |
| arTal_v1_Chr2_+_19145218_19145218 | 4.56 |
AT2G46630.1
|
AT2G46630
|
serine/arginine repetitive matrix protein |
| arTal_v1_Chr4_+_11907355_11907355 | 4.54 |
AT4G22620.1
|
AT4G22620
|
SAUR-like auxin-responsive protein family |
| arTal_v1_Chr1_-_1768837_1768837 | 4.53 |
AT1G05850.2
AT1G05850.1 |
POM1
|
Chitinase family protein |
| arTal_v1_Chr3_-_5252506_5252506 | 4.53 |
AT3G15520.4
|
AT3G15520
|
Cyclophilin-like peptidyl-prolyl cis-trans isomerase family protein |
| arTal_v1_Chr1_-_8940613_8940613 | 4.52 |
AT1G25450.1
|
KCS5
|
3-ketoacyl-CoA synthase 5 |
| arTal_v1_Chr4_-_17979740_17979885 | 4.50 |
AT4G38400.1
AT4G38401.1 |
EXLA2
AT4G38401
|
expansin-like A2 hypothetical protein |
| arTal_v1_Chr5_-_3709403_3709403 | 4.49 |
AT5G11550.1
|
AT5G11550
|
ARM repeat superfamily protein |
| arTal_v1_Chr1_+_8156504_8156504 | 4.48 |
AT1G23030.1
|
AT1G23030
|
ARM repeat superfamily protein |
| arTal_v1_Chr5_+_20900859_20900860 | 4.46 |
AT5G51460.1
AT5G51460.4 |
ATTPPA
|
Haloacid dehalogenase-like hydrolase (HAD) superfamily protein |
| arTal_v1_Chr3_+_1225919_1225919 | 4.46 |
AT3G04550.1
|
AT3G04550
|
rubisco accumulation factor-like protein |
| arTal_v1_Chr4_-_14002069_14002124 | 4.40 |
AT4G28250.2
AT4G28250.3 AT4G28250.4 AT4G28250.1 |
EXPB3
|
expansin B3 |
| arTal_v1_Chr3_+_7280792_7280792 | 4.39 |
AT3G20820.1
|
AT3G20820
|
Leucine-rich repeat (LRR) family protein |
| arTal_v1_Chr5_-_5833989_5834000 | 4.36 |
AT5G17700.2
AT5G17700.1 AT5G17700.3 |
AT5G17700
|
MATE efflux family protein |
| arTal_v1_Chr5_-_26845294_26845294 | 4.31 |
AT5G67280.1
|
RLK
|
receptor-like kinase |
| arTal_v1_Chr1_-_29643535_29643535 | 4.31 |
AT1G78850.1
|
AT1G78850
|
D-mannose binding lectin protein with Apple-like carbohydrate-binding domain-containing protein |
| arTal_v1_Chr1_-_9458176_9458176 | 4.31 |
AT1G27210.1
|
AT1G27210
|
ARM repeat superfamily protein |
| arTal_v1_Chr4_-_17835017_17835017 | 4.30 |
AT4G37930.1
|
SHM1
|
serine transhydroxymethyltransferase 1 |
| arTal_v1_Chr2_+_11852078_11852080 | 4.29 |
AT2G27810.1
AT2G27810.3 AT2G27810.2 AT2G27810.4 |
NAT12
|
nucleobase-ascorbate transporter 12 |
| arTal_v1_Chr4_-_11785937_11785937 | 4.28 |
AT4G22290.1
|
AT4G22290
|
Ubiquitin-specific protease family C19-related protein |
| arTal_v1_Chr3_-_2137012_2137085 | 4.28 |
AT3G06770.1
AT3G06770.5 |
AT3G06770
|
Pectin lyase-like superfamily protein |
| arTal_v1_Chr5_+_24667873_24667873 | 4.28 |
AT5G61350.1
|
AT5G61350
|
Protein kinase superfamily protein |
| arTal_v1_Chr1_-_1349478_1349478 | 4.27 |
AT1G04800.1
|
AT1G04800
|
glycine-rich protein |
| arTal_v1_Chr5_+_20902087_20902087 | 4.26 |
AT5G51460.2
|
ATTPPA
|
Haloacid dehalogenase-like hydrolase (HAD) superfamily protein |
| arTal_v1_Chr4_-_13752103_13752103 | 4.25 |
AT4G27520.1
|
ENODL2
|
early nodulin-like protein 2 |
| arTal_v1_Chr1_-_4217412_4217412 | 4.25 |
AT1G12380.1
|
AT1G12380
|
hypothetical protein |
| arTal_v1_Chr3_+_3012094_3012094 | 4.24 |
AT3G09820.2
|
ADK1
|
adenosine kinase 1 |
| arTal_v1_Chr3_+_3011780_3011780 | 4.23 |
AT3G09820.1
|
ADK1
|
adenosine kinase 1 |
| arTal_v1_Chr3_-_2137280_2137350 | 4.22 |
AT3G06770.4
AT3G06770.3 |
AT3G06770
|
Pectin lyase-like superfamily protein |
| arTal_v1_Chr1_+_21159736_21159744 | 4.20 |
AT1G56500.2
AT1G56500.1 AT1G56500.3 |
AT1G56500
|
haloacid dehalogenase-like hydrolase family protein |
| arTal_v1_Chr4_+_9739518_9739518 | 4.20 |
AT4G17460.1
|
HAT1
|
Homeobox-leucine zipper protein 4 (HB-4) / HD-ZIP protein |
| arTal_v1_Chr3_+_3301887_3301887 | 4.18 |
AT3G10570.1
|
CYP77A6
|
cytochrome P450, family 77, subfamily A, polypeptide 6 |
| arTal_v1_Chr5_+_16151522_16151522 | 4.17 |
AT5G40380.1
|
CRK42
|
cysteine-rich RLK (RECEPTOR-like protein kinase) 42 |
| arTal_v1_Chr5_+_20901835_20901835 | 4.16 |
AT5G51460.5
|
ATTPPA
|
Haloacid dehalogenase-like hydrolase (HAD) superfamily protein |
| arTal_v1_Chr2_+_8987584_8987584 | 4.15 |
AT2G20890.1
|
PSB29
|
photosystem II reaction center PSB29 protein |
| arTal_v1_Chr1_-_7040231_7040231 | 4.14 |
AT1G20330.1
|
SMT2
|
sterol methyltransferase 2 |
| arTal_v1_Chr5_-_24728244_24728244 | 4.13 |
AT5G61480.1
|
PXY
|
Leucine-rich repeat protein kinase family protein |
| arTal_v1_Chr5_+_72292_72292 | 4.13 |
AT5G01190.2
AT5G01190.1 |
LAC10
|
laccase 10 |
| arTal_v1_Chr2_-_183639_183764 | 4.13 |
AT2G01420.3
AT2G01420.1 AT2G01420.2 |
PIN4
|
Auxin efflux carrier family protein |
| arTal_v1_Chr4_+_7758275_7758275 | 4.13 |
AT4G13340.1
|
LRX3
|
Leucine-rich repeat (LRR) family protein |
| arTal_v1_Chr3_+_21419449_21419517 | 4.13 |
AT3G57830.1
AT3G57830.2 AT3G57830.3 |
AT3G57830
|
Leucine-rich repeat protein kinase family protein |
| arTal_v1_Chr5_-_22515458_22515458 | 4.13 |
AT5G55570.2
AT5G55570.1 |
AT5G55570
|
transmembrane protein |
| arTal_v1_Chr5_-_3057447_3057578 | 4.12 |
AT5G09820.3
AT5G09820.2 AT5G09820.1 |
AT5G09820
|
Plastid-lipid associated protein PAP / fibrillin family protein |
| arTal_v1_Chr2_+_12805667_12805714 | 4.11 |
AT2G30010.2
AT2G30010.1 |
TBL45
|
TRICHOME BIREFRINGENCE-LIKE 45 |
| arTal_v1_Chr1_-_8501542_8501542 | 4.10 |
AT1G24020.1
|
MLP423
|
MLP-like protein 423 |
| arTal_v1_Chr4_-_16330212_16330224 | 4.10 |
AT4G34090.2
AT4G34090.3 AT4G34090.1 |
AT4G34090
|
cyclin delta-3 |
| arTal_v1_Chr5_+_20901537_20901537 | 4.09 |
AT5G51460.3
|
ATTPPA
|
Haloacid dehalogenase-like hydrolase (HAD) superfamily protein |
| arTal_v1_Chr1_+_4735474_4735474 | 4.09 |
AT1G13820.1
|
AT1G13820
|
alpha/beta-Hydrolases superfamily protein |
| arTal_v1_Chr5_+_6122725_6122725 | 4.07 |
AT5G18460.1
|
AT5G18460
|
carboxyl-terminal peptidase (DUF239) |
| arTal_v1_Chr2_+_16869189_16869334 | 4.04 |
AT2G40400.1
AT2G40400.2 AT2G40400.3 |
AT2G40400
|
DUF399 family protein, putative (DUF399 and DUF3411) |
| arTal_v1_Chr2_-_17161293_17161294 | 4.01 |
AT2G41170.2
AT2G41170.1 AT2G41170.3 |
AT2G41170
|
F-box family protein |
| arTal_v1_Chr5_-_740319_740319 | 4.01 |
AT5G03140.1
|
AT5G03140
|
Concanavalin A-like lectin protein kinase family protein |
| arTal_v1_Chr5_-_8412240_8412265 | 4.01 |
AT5G24580.3
AT5G24580.2 |
AT5G24580
|
Heavy metal transport/detoxification superfamily protein |
| arTal_v1_Chr4_-_14453966_14453982 | 4.01 |
AT4G29360.2
AT4G29360.1 |
AT4G29360
|
O-Glycosyl hydrolases family 17 protein |
| arTal_v1_Chr1_-_10326848_10326848 | 4.00 |
AT1G29530.1
|
AT1G29530
|
hypothetical protein |
| arTal_v1_Chr5_+_2446669_2446669 | 3.99 |
AT5G07690.1
|
MYB29
|
myb domain protein 29 |
| arTal_v1_Chr2_+_12588191_12588197 | 3.98 |
AT2G29300.2
AT2G29300.1 |
AT2G29300
|
NAD(P)-binding Rossmann-fold superfamily protein |
| arTal_v1_Chr2_+_8063023_8063023 | 3.97 |
AT2G18570.1
|
AT2G18570
|
UDP-Glycosyltransferase superfamily protein |
| arTal_v1_Chr3_-_7434743_7434743 | 3.97 |
AT3G21190.1
|
MSR1
|
O-fucosyltransferase family protein |
| arTal_v1_Chr2_+_13824663_13824664 | 3.95 |
AT2G32560.1
AT2G32560.2 |
AT2G32560
|
F-box family protein |
| arTal_v1_Chr5_+_6387735_6387735 | 3.95 |
AT5G19090.5
|
AT5G19090
|
Heavy metal transport/detoxification superfamily protein |
| arTal_v1_Chr5_+_25524045_25524045 | 3.94 |
AT5G63780.2
|
SHA1
|
RING/FYVE/PHD zinc finger superfamily protein |
| arTal_v1_Chr1_-_17015497_17015520 | 3.92 |
AT1G45010.2
AT1G45010.3 AT1G45010.4 AT1G45010.1 |
AT1G45010
|
TRAM, LAG1 and CLN8 (TLC) lipid-sensing domain containing protein |
| arTal_v1_Chr5_+_25191860_25191860 | 3.92 |
AT5G62720.2
|
AT5G62720
|
Integral membrane HPP family protein |
| arTal_v1_Chr5_+_3032375_3032375 | 3.92 |
AT5G09760.1
|
AT5G09760
|
Plant invertase/pectin methylesterase inhibitor superfamily |
| arTal_v1_Chr2_+_10842863_10842863 | 3.91 |
AT2G25480.2
AT2G25480.1 |
AT2G25480
|
TPX2 (targeting protein for Xklp2) protein family |
| arTal_v1_Chr1_-_8502065_8502065 | 3.90 |
AT1G24020.2
|
MLP423
|
MLP-like protein 423 |
| arTal_v1_Chr2_+_19109513_19109513 | 3.88 |
AT2G46535.1
|
AT2G46535
|
hypothetical protein |
| arTal_v1_Chr4_+_8470179_8470300 | 3.88 |
AT4G14750.2
AT4G14750.3 AT4G14750.1 |
IQD19
|
IQ-domain 19 |
| arTal_v1_Chr5_+_25523827_25523827 | 3.88 |
AT5G63780.1
|
SHA1
|
RING/FYVE/PHD zinc finger superfamily protein |
| arTal_v1_Chr5_+_25191402_25191402 | 3.88 |
AT5G62720.1
|
AT5G62720
|
Integral membrane HPP family protein |
| arTal_v1_Chr2_-_5675995_5675995 | 3.85 |
AT2G13610.1
|
ABCG5
|
ABC-2 type transporter family protein |
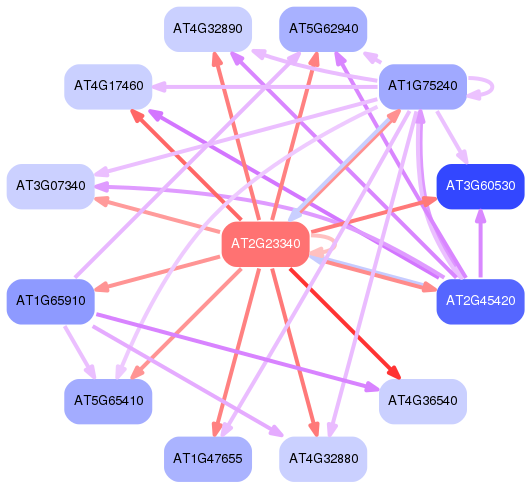
Network of associatons between targets according to the STRING database.

First level regulatory network of AT2G23340
Gene Ontology Analysis
Gene overrepresentation in biological process category:
| Log-likelihood per target | Total log-likelihood | Term | Description |
|---|---|---|---|
| 4.5 | 13.4 | GO:0015840 | urea transport(GO:0015840) |
| 2.4 | 7.2 | GO:0080170 | hydrogen peroxide transmembrane transport(GO:0080170) |
| 2.1 | 8.5 | GO:0080094 | response to trehalose-6-phosphate(GO:0080094) |
| 1.9 | 7.4 | GO:0033353 | S-adenosylmethionine cycle(GO:0033353) S-adenosylhomocysteine metabolic process(GO:0046498) |
| 1.8 | 5.3 | GO:0010198 | synergid death(GO:0010198) |
| 1.7 | 13.6 | GO:0043489 | RNA stabilization(GO:0043489) |
| 1.6 | 6.4 | GO:0051574 | positive regulation of histone H3-K9 methylation(GO:0051574) |
| 1.6 | 6.3 | GO:0042759 | long-chain fatty acid biosynthetic process(GO:0042759) |
| 1.5 | 10.7 | GO:0010067 | procambium histogenesis(GO:0010067) |
| 1.4 | 5.5 | GO:0006024 | aminoglycan biosynthetic process(GO:0006023) glycosaminoglycan biosynthetic process(GO:0006024) UDP-glucuronate biosynthetic process(GO:0006065) glycosaminoglycan metabolic process(GO:0030203) |
| 1.3 | 8.1 | GO:0051098 | regulation of binding(GO:0051098) |
| 1.3 | 6.3 | GO:0006556 | S-adenosylmethionine biosynthetic process(GO:0006556) |
| 1.3 | 23.9 | GO:0006949 | syncytium formation(GO:0006949) |
| 1.2 | 6.1 | GO:0005980 | glycogen catabolic process(GO:0005980) |
| 1.2 | 4.8 | GO:0006063 | uronic acid metabolic process(GO:0006063) galacturonate metabolic process(GO:0019586) |
| 1.2 | 3.5 | GO:0045857 | regulation of molecular function, epigenetic(GO:0040030) negative regulation of molecular function, epigenetic(GO:0045857) |
| 1.2 | 2.3 | GO:0071163 | DNA replication preinitiation complex assembly(GO:0071163) |
| 1.2 | 3.5 | GO:0010447 | response to acidic pH(GO:0010447) |
| 1.1 | 4.3 | GO:0015853 | adenine transport(GO:0015853) guanine transport(GO:0015854) |
| 1.1 | 3.2 | GO:0000050 | urea cycle(GO:0000050) |
| 1.1 | 7.5 | GO:0009772 | photosynthetic electron transport in photosystem II(GO:0009772) |
| 1.0 | 12.6 | GO:0048354 | mucilage biosynthetic process involved in seed coat development(GO:0048354) |
| 1.0 | 4.1 | GO:1902458 | positive regulation of stomatal opening(GO:1902458) |
| 1.0 | 16.3 | GO:0016998 | cell wall macromolecule catabolic process(GO:0016998) |
| 1.0 | 4.8 | GO:0051016 | barbed-end actin filament capping(GO:0051016) |
| 0.9 | 21.5 | GO:0009768 | photosynthesis, light harvesting in photosystem I(GO:0009768) |
| 0.9 | 3.5 | GO:0072698 | protein localization to cytoskeleton(GO:0044380) protein localization to microtubule cytoskeleton(GO:0072698) |
| 0.9 | 2.6 | GO:0010501 | RNA secondary structure unwinding(GO:0010501) |
| 0.8 | 5.9 | GO:1902969 | mitotic DNA replication(GO:1902969) |
| 0.8 | 3.4 | GO:0080003 | thalianol metabolic process(GO:0080003) |
| 0.8 | 5.0 | GO:0010236 | plastoquinone biosynthetic process(GO:0010236) |
| 0.8 | 0.8 | GO:0010253 | UDP-rhamnose biosynthetic process(GO:0010253) UDP-rhamnose metabolic process(GO:0033478) |
| 0.8 | 7.5 | GO:0009819 | drought recovery(GO:0009819) |
| 0.8 | 2.4 | GO:0080145 | cysteine homeostasis(GO:0080145) |
| 0.8 | 5.6 | GO:0043446 | cellular alkane metabolic process(GO:0043446) |
| 0.8 | 4.7 | GO:0097502 | mannosylation(GO:0097502) |
| 0.8 | 2.3 | GO:0001736 | establishment of planar polarity(GO:0001736) morphogenesis of a polarized epithelium(GO:0001738) morphogenesis of an epithelium(GO:0002009) tissue morphogenesis(GO:0048729) |
| 0.8 | 2.3 | GO:0090224 | regulation of mitotic spindle organization(GO:0060236) regulation of spindle organization(GO:0090224) |
| 0.8 | 3.8 | GO:0010362 | negative regulation of anion channel activity(GO:0010360) regulation of anion channel activity by blue light(GO:0010361) negative regulation of anion channel activity by blue light(GO:0010362) negative regulation of transporter activity(GO:0032410) negative regulation of ion transmembrane transporter activity(GO:0032413) negative regulation of transmembrane transport(GO:0034763) negative regulation of ion transmembrane transport(GO:0034766) negative regulation of anion transport(GO:1903792) negative regulation of anion transmembrane transport(GO:1903960) |
| 0.7 | 11.8 | GO:0010315 | auxin efflux(GO:0010315) |
| 0.7 | 2.2 | GO:0042817 | pyridoxal metabolic process(GO:0042817) |
| 0.7 | 2.2 | GO:0046085 | adenosine metabolic process(GO:0046085) |
| 0.7 | 6.4 | GO:0033206 | meiotic cytokinesis(GO:0033206) |
| 0.7 | 3.3 | GO:0042218 | 1-aminocyclopropane-1-carboxylate biosynthetic process(GO:0042218) |
| 0.7 | 3.3 | GO:0006421 | asparaginyl-tRNA aminoacylation(GO:0006421) |
| 0.7 | 2.6 | GO:0042450 | arginine biosynthetic process via ornithine(GO:0042450) |
| 0.6 | 1.9 | GO:0009805 | coumarin biosynthetic process(GO:0009805) |
| 0.6 | 38.5 | GO:0010411 | xyloglucan metabolic process(GO:0010411) |
| 0.6 | 4.3 | GO:1904482 | L-serine catabolic process(GO:0006565) glycine biosynthetic process from serine(GO:0019264) glycine decarboxylation via glycine cleavage system(GO:0019464) response to tetrahydrofolate(GO:1904481) cellular response to tetrahydrofolate(GO:1904482) |
| 0.6 | 7.8 | GO:0010158 | abaxial cell fate specification(GO:0010158) |
| 0.6 | 1.8 | GO:0017145 | stem cell division(GO:0017145) |
| 0.6 | 1.8 | GO:0051639 | actin filament network formation(GO:0051639) |
| 0.6 | 7.1 | GO:0032544 | plastid translation(GO:0032544) |
| 0.6 | 1.8 | GO:0015709 | thiosulfate transport(GO:0015709) succinate transmembrane transport(GO:0071422) |
| 0.6 | 1.8 | GO:0000032 | cell wall mannoprotein biosynthetic process(GO:0000032) mannoprotein metabolic process(GO:0006056) mannoprotein biosynthetic process(GO:0006057) cell wall glycoprotein biosynthetic process(GO:0031506) response to cobalt ion(GO:0032025) |
| 0.5 | 2.7 | GO:0007266 | Rho protein signal transduction(GO:0007266) |
| 0.5 | 7.0 | GO:0009554 | megasporogenesis(GO:0009554) |
| 0.5 | 7.5 | GO:0010052 | guard cell differentiation(GO:0010052) |
| 0.5 | 4.8 | GO:0010358 | leaf shaping(GO:0010358) |
| 0.5 | 3.1 | GO:0010258 | NADH dehydrogenase complex (plastoquinone) assembly(GO:0010258) |
| 0.5 | 2.6 | GO:0035864 | response to potassium ion(GO:0035864) |
| 0.5 | 18.0 | GO:0005991 | trehalose metabolic process(GO:0005991) |
| 0.5 | 2.1 | GO:0050993 | dimethylallyl diphosphate biosynthetic process(GO:0050992) dimethylallyl diphosphate metabolic process(GO:0050993) |
| 0.5 | 1.5 | GO:2001294 | fatty-acyl-CoA catabolic process(GO:0036115) malonyl-CoA catabolic process(GO:2001294) |
| 0.5 | 2.0 | GO:0080005 | photosystem stoichiometry adjustment(GO:0080005) |
| 0.5 | 1.5 | GO:0046166 | glyceraldehyde-3-phosphate biosynthetic process(GO:0046166) |
| 0.5 | 6.3 | GO:0009051 | pentose-phosphate shunt, oxidative branch(GO:0009051) |
| 0.5 | 4.8 | GO:0009957 | epidermal cell fate specification(GO:0009957) |
| 0.5 | 3.2 | GO:0070979 | protein K11-linked ubiquitination(GO:0070979) |
| 0.5 | 4.1 | GO:0032876 | negative regulation of DNA endoreduplication(GO:0032876) |
| 0.5 | 0.9 | GO:0043953 | protein transport by the Tat complex(GO:0043953) |
| 0.5 | 2.3 | GO:1902626 | assembly of large subunit precursor of preribosome(GO:1902626) |
| 0.4 | 10.6 | GO:0010020 | chloroplast fission(GO:0010020) plastid fission(GO:0043572) |
| 0.4 | 5.1 | GO:0007143 | female meiotic division(GO:0007143) |
| 0.4 | 2.5 | GO:0048871 | multicellular organismal homeostasis(GO:0048871) |
| 0.4 | 2.1 | GO:0045730 | respiratory burst involved in defense response(GO:0002679) respiratory burst(GO:0045730) |
| 0.4 | 2.0 | GO:0042547 | cell wall modification involved in multidimensional cell growth(GO:0042547) |
| 0.4 | 4.0 | GO:0010588 | cotyledon vascular tissue pattern formation(GO:0010588) |
| 0.4 | 3.1 | GO:0010192 | mucilage biosynthetic process(GO:0010192) |
| 0.4 | 1.9 | GO:0071366 | cellular response to indolebutyric acid stimulus(GO:0071366) |
| 0.4 | 1.9 | GO:0009298 | GDP-mannose biosynthetic process(GO:0009298) |
| 0.4 | 2.6 | GO:0015689 | molybdate ion transport(GO:0015689) |
| 0.4 | 9.7 | GO:0009959 | negative gravitropism(GO:0009959) |
| 0.4 | 1.5 | GO:0048464 | sepal development(GO:0048442) flower calyx development(GO:0048464) |
| 0.4 | 1.8 | GO:0070525 | tRNA threonylcarbamoyladenosine metabolic process(GO:0070525) |
| 0.4 | 31.6 | GO:0045490 | pectin catabolic process(GO:0045490) |
| 0.4 | 1.1 | GO:0018279 | peptidyl-asparagine modification(GO:0018196) protein N-linked glycosylation via asparagine(GO:0018279) |
| 0.4 | 1.1 | GO:0031120 | snRNA pseudouridine synthesis(GO:0031120) |
| 0.3 | 1.4 | GO:0071836 | nectar secretion(GO:0071836) |
| 0.3 | 1.7 | GO:0007142 | male meiosis II(GO:0007142) |
| 0.3 | 3.4 | GO:0043171 | peptide catabolic process(GO:0043171) |
| 0.3 | 1.3 | GO:0001578 | microtubule bundle formation(GO:0001578) |
| 0.3 | 1.3 | GO:0048656 | anther wall tapetum formation(GO:0048656) anther wall tapetum cell differentiation(GO:0048657) |
| 0.3 | 8.2 | GO:0009828 | plant-type cell wall loosening(GO:0009828) |
| 0.3 | 2.2 | GO:0035434 | copper ion transmembrane transport(GO:0035434) |
| 0.3 | 6.9 | GO:0009269 | response to desiccation(GO:0009269) |
| 0.3 | 1.9 | GO:0000395 | mRNA 5'-splice site recognition(GO:0000395) |
| 0.3 | 1.8 | GO:0010581 | regulation of starch biosynthetic process(GO:0010581) |
| 0.3 | 23.4 | GO:0009834 | plant-type secondary cell wall biogenesis(GO:0009834) |
| 0.3 | 0.6 | GO:0050687 | negative regulation of immune effector process(GO:0002698) negative regulation of defense response to virus(GO:0050687) |
| 0.3 | 1.8 | GO:0072344 | rescue of stalled ribosome(GO:0072344) |
| 0.3 | 8.1 | GO:0009825 | multidimensional cell growth(GO:0009825) |
| 0.3 | 6.3 | GO:0003333 | amino acid transmembrane transport(GO:0003333) |
| 0.3 | 0.8 | GO:0010338 | leaf formation(GO:0010338) |
| 0.3 | 1.6 | GO:2000779 | regulation of double-strand break repair(GO:2000779) |
| 0.3 | 6.3 | GO:0009292 | genetic transfer(GO:0009292) DNA mediated transformation(GO:0009294) |
| 0.3 | 4.5 | GO:0042761 | very long-chain fatty acid biosynthetic process(GO:0042761) |
| 0.3 | 5.0 | GO:0080188 | RNA-directed DNA methylation(GO:0080188) |
| 0.3 | 1.0 | GO:0097054 | L-glutamate biosynthetic process(GO:0097054) |
| 0.3 | 2.8 | GO:0009423 | chorismate biosynthetic process(GO:0009423) |
| 0.3 | 6.3 | GO:0010305 | leaf vascular tissue pattern formation(GO:0010305) |
| 0.2 | 1.2 | GO:0015939 | pantothenate metabolic process(GO:0015939) pantothenate biosynthetic process(GO:0015940) |
| 0.2 | 14.7 | GO:0007267 | cell-cell signaling(GO:0007267) |
| 0.2 | 2.3 | GO:0010371 | regulation of gibberellin biosynthetic process(GO:0010371) |
| 0.2 | 4.4 | GO:0009904 | chloroplast accumulation movement(GO:0009904) |
| 0.2 | 5.3 | GO:0005983 | starch catabolic process(GO:0005983) |
| 0.2 | 3.2 | GO:0071329 | cellular response to sucrose stimulus(GO:0071329) |
| 0.2 | 1.4 | GO:0051754 | meiotic sister chromatid cohesion, centromeric(GO:0051754) |
| 0.2 | 2.4 | GO:0072583 | clathrin-mediated endocytosis(GO:0072583) |
| 0.2 | 1.3 | GO:0019408 | dolichol biosynthetic process(GO:0019408) |
| 0.2 | 0.7 | GO:0010482 | epidermal cell division(GO:0010481) regulation of epidermal cell division(GO:0010482) regulation of trichome morphogenesis(GO:2000039) |
| 0.2 | 7.3 | GO:0010197 | karyogamy(GO:0000741) polar nucleus fusion(GO:0010197) |
| 0.2 | 0.6 | GO:0010028 | xanthophyll cycle(GO:0010028) |
| 0.2 | 1.3 | GO:0006011 | UDP-glucose metabolic process(GO:0006011) |
| 0.2 | 1.9 | GO:0009094 | L-phenylalanine biosynthetic process(GO:0009094) erythrose 4-phosphate/phosphoenolpyruvate family amino acid biosynthetic process(GO:1902223) |
| 0.2 | 1.9 | GO:2000904 | regulation of starch metabolic process(GO:2000904) |
| 0.2 | 7.9 | GO:0045489 | pectin biosynthetic process(GO:0045489) |
| 0.2 | 4.5 | GO:0000038 | very long-chain fatty acid metabolic process(GO:0000038) |
| 0.2 | 2.0 | GO:0045962 | positive regulation of development, heterochronic(GO:0045962) |
| 0.2 | 2.0 | GO:0006662 | glycerol ether metabolic process(GO:0006662) |
| 0.2 | 1.8 | GO:0010106 | cellular response to iron ion starvation(GO:0010106) |
| 0.2 | 3.0 | GO:0046501 | protoporphyrinogen IX biosynthetic process(GO:0006782) protoporphyrinogen IX metabolic process(GO:0046501) |
| 0.2 | 13.6 | GO:0007018 | microtubule-based movement(GO:0007018) |
| 0.2 | 1.6 | GO:0006183 | GTP biosynthetic process(GO:0006183) |
| 0.2 | 1.7 | GO:1903825 | organic acid transmembrane transport(GO:1903825) carboxylic acid transmembrane transport(GO:1905039) |
| 0.2 | 5.1 | GO:0043622 | cortical microtubule organization(GO:0043622) |
| 0.2 | 2.0 | GO:0051446 | positive regulation of meiotic cell cycle(GO:0051446) |
| 0.2 | 1.9 | GO:2000032 | regulation of morphogenesis of a branching structure(GO:0060688) regulation of secondary shoot formation(GO:2000032) |
| 0.2 | 1.2 | GO:0051131 | chaperone-mediated protein complex assembly(GO:0051131) |
| 0.2 | 4.8 | GO:0010025 | wax biosynthetic process(GO:0010025) |
| 0.2 | 4.7 | GO:0051225 | spindle assembly(GO:0051225) |
| 0.2 | 8.4 | GO:0016485 | protein processing(GO:0016485) |
| 0.2 | 2.5 | GO:0005986 | sucrose biosynthetic process(GO:0005986) |
| 0.2 | 2.4 | GO:0052803 | histidine biosynthetic process(GO:0000105) histidine metabolic process(GO:0006547) imidazole-containing compound metabolic process(GO:0052803) |
| 0.2 | 0.5 | GO:0033259 | plastid DNA metabolic process(GO:0033258) plastid DNA replication(GO:0033259) |
| 0.2 | 2.9 | GO:0050821 | protein stabilization(GO:0050821) |
| 0.2 | 4.6 | GO:0030050 | vesicle transport along actin filament(GO:0030050) vesicle cytoskeletal trafficking(GO:0099518) |
| 0.2 | 2.2 | GO:0032922 | circadian regulation of gene expression(GO:0032922) |
| 0.2 | 2.1 | GO:0070475 | rRNA base methylation(GO:0070475) |
| 0.1 | 2.4 | GO:0006268 | DNA unwinding involved in DNA replication(GO:0006268) |
| 0.1 | 6.2 | GO:0045036 | protein targeting to chloroplast(GO:0045036) establishment of protein localization to chloroplast(GO:0072596) |
| 0.1 | 1.3 | GO:0046294 | formaldehyde catabolic process(GO:0046294) |
| 0.1 | 1.7 | GO:0042753 | positive regulation of circadian rhythm(GO:0042753) |
| 0.1 | 1.1 | GO:0010115 | regulation of abscisic acid biosynthetic process(GO:0010115) |
| 0.1 | 5.5 | GO:0009664 | plant-type cell wall organization(GO:0009664) |
| 0.1 | 2.7 | GO:0009086 | methionine biosynthetic process(GO:0009086) |
| 0.1 | 0.8 | GO:0009209 | CTP biosynthetic process(GO:0006241) pyrimidine ribonucleoside triphosphate metabolic process(GO:0009208) pyrimidine ribonucleoside triphosphate biosynthetic process(GO:0009209) CTP metabolic process(GO:0046036) |
| 0.1 | 2.6 | GO:0009934 | regulation of meristem structural organization(GO:0009934) |
| 0.1 | 2.6 | GO:0010252 | auxin homeostasis(GO:0010252) |
| 0.1 | 1.4 | GO:0045723 | positive regulation of fatty acid biosynthetic process(GO:0045723) |
| 0.1 | 3.7 | GO:0000027 | ribosomal large subunit assembly(GO:0000027) |
| 0.1 | 8.8 | GO:0071367 | cellular response to brassinosteroid stimulus(GO:0071367) |
| 0.1 | 3.9 | GO:0000413 | protein peptidyl-prolyl isomerization(GO:0000413) |
| 0.1 | 5.1 | GO:0009911 | positive regulation of flower development(GO:0009911) |
| 0.1 | 2.7 | GO:0010227 | floral organ abscission(GO:0010227) |
| 0.1 | 2.2 | GO:0031425 | chloroplast RNA processing(GO:0031425) |
| 0.1 | 3.8 | GO:0006334 | nucleosome assembly(GO:0006334) |
| 0.1 | 0.4 | GO:0042908 | xenobiotic transport(GO:0042908) |
| 0.1 | 0.7 | GO:0080117 | secondary growth(GO:0080117) |
| 0.1 | 1.1 | GO:0007093 | mitotic cell cycle checkpoint(GO:0007093) |
| 0.1 | 3.9 | GO:0009226 | nucleotide-sugar biosynthetic process(GO:0009226) |
| 0.1 | 0.8 | GO:0006542 | glutamine biosynthetic process(GO:0006542) |
| 0.1 | 0.8 | GO:0006526 | arginine biosynthetic process(GO:0006526) |
| 0.1 | 1.8 | GO:0019852 | L-ascorbic acid metabolic process(GO:0019852) L-ascorbic acid biosynthetic process(GO:0019853) |
| 0.1 | 0.3 | GO:0046391 | 5-phosphoribose 1-diphosphate biosynthetic process(GO:0006015) 5-phosphoribose 1-diphosphate metabolic process(GO:0046391) |
| 0.1 | 1.4 | GO:0010274 | hydrotropism(GO:0010274) |
| 0.1 | 1.8 | GO:0010152 | pollen maturation(GO:0010152) |
| 0.1 | 2.7 | GO:0019915 | lipid storage(GO:0019915) |
| 0.1 | 0.7 | GO:0051952 | amine transport(GO:0015837) regulation of organic acid transport(GO:0032890) regulation of amine transport(GO:0051952) regulation of amino acid transport(GO:0051955) regulation of amino acid export(GO:0080143) |
| 0.1 | 0.3 | GO:0048451 | petal formation(GO:0048451) |
| 0.1 | 3.7 | GO:0010311 | lateral root formation(GO:0010311) |
| 0.1 | 1.7 | GO:0008284 | positive regulation of cell proliferation(GO:0008284) |
| 0.1 | 0.3 | GO:0006883 | cellular sodium ion homeostasis(GO:0006883) vacuolar sequestering(GO:0043181) |
| 0.1 | 1.8 | GO:0001678 | cellular glucose homeostasis(GO:0001678) |
| 0.1 | 2.9 | GO:0016556 | mRNA modification(GO:0016556) |
| 0.1 | 1.7 | GO:2000012 | regulation of auxin polar transport(GO:2000012) |
| 0.1 | 0.5 | GO:0035335 | peptidyl-tyrosine dephosphorylation(GO:0035335) |
| 0.1 | 1.7 | GO:0006817 | phosphate ion transport(GO:0006817) |
| 0.1 | 0.6 | GO:0031333 | negative regulation of protein complex assembly(GO:0031333) |
| 0.1 | 4.9 | GO:0048544 | recognition of pollen(GO:0048544) |
| 0.1 | 1.5 | GO:0010207 | photosystem II assembly(GO:0010207) |
| 0.1 | 1.6 | GO:0010584 | pollen exine formation(GO:0010584) |
| 0.1 | 0.6 | GO:0006488 | dolichol-linked oligosaccharide biosynthetic process(GO:0006488) |
| 0.1 | 2.5 | GO:0031348 | negative regulation of defense response(GO:0031348) |
| 0.1 | 3.4 | GO:0002181 | cytoplasmic translation(GO:0002181) |
| 0.1 | 2.5 | GO:0006414 | translational elongation(GO:0006414) |
| 0.1 | 1.0 | GO:0006538 | glutamate catabolic process(GO:0006538) |
| 0.1 | 0.7 | GO:0018026 | peptidyl-lysine monomethylation(GO:0018026) |
| 0.1 | 1.1 | GO:0006743 | ubiquinone metabolic process(GO:0006743) ubiquinone biosynthetic process(GO:0006744) |
| 0.1 | 0.8 | GO:0009306 | protein secretion(GO:0009306) |
| 0.1 | 2.3 | GO:0009853 | photorespiration(GO:0009853) |
| 0.1 | 6.0 | GO:0009860 | pollen tube growth(GO:0009860) |
| 0.0 | 0.1 | GO:0000973 | posttranscriptional tethering of RNA polymerase II gene DNA at nuclear periphery(GO:0000973) |
| 0.0 | 4.3 | GO:0018209 | peptidyl-serine phosphorylation(GO:0018105) peptidyl-serine modification(GO:0018209) |
| 0.0 | 1.2 | GO:0010582 | floral meristem determinacy(GO:0010582) |
| 0.0 | 1.9 | GO:0016145 | S-glycoside catabolic process(GO:0016145) glycosinolate catabolic process(GO:0019759) glucosinolate catabolic process(GO:0019762) |
| 0.0 | 1.0 | GO:0010268 | brassinosteroid homeostasis(GO:0010268) |
| 0.0 | 0.4 | GO:0052548 | negative regulation of endopeptidase activity(GO:0010951) regulation of endopeptidase activity(GO:0052548) |
| 0.0 | 0.4 | GO:0015743 | malate transport(GO:0015743) |
| 0.0 | 2.9 | GO:0006885 | regulation of pH(GO:0006885) |
| 0.0 | 1.8 | GO:0044772 | mitotic cell cycle phase transition(GO:0044772) |
| 0.0 | 0.6 | GO:0015833 | oligopeptide transport(GO:0006857) peptide transport(GO:0015833) |
| 0.0 | 0.8 | GO:0000162 | tryptophan biosynthetic process(GO:0000162) indolalkylamine biosynthetic process(GO:0046219) |
| 0.0 | 0.4 | GO:0010100 | negative regulation of photomorphogenesis(GO:0010100) |
| 0.0 | 4.1 | GO:0080167 | response to karrikin(GO:0080167) |
| 0.0 | 1.7 | GO:0009817 | defense response to fungus, incompatible interaction(GO:0009817) |
| 0.0 | 0.6 | GO:0010051 | xylem and phloem pattern formation(GO:0010051) |
| 0.0 | 0.1 | GO:0006386 | termination of RNA polymerase III transcription(GO:0006386) |
| 0.0 | 0.4 | GO:0045787 | positive regulation of cell cycle(GO:0045787) |
| 0.0 | 1.7 | GO:0006101 | tricarboxylic acid cycle(GO:0006099) citrate metabolic process(GO:0006101) |
| 0.0 | 3.3 | GO:0006486 | protein glycosylation(GO:0006486) macromolecule glycosylation(GO:0043413) |
| 0.0 | 1.1 | GO:0051084 | 'de novo' posttranslational protein folding(GO:0051084) chaperone mediated protein folding requiring cofactor(GO:0051085) |
| 0.0 | 0.7 | GO:0009691 | cytokinin biosynthetic process(GO:0009691) |
| 0.0 | 0.8 | GO:0007166 | cell surface receptor signaling pathway(GO:0007166) |
| 0.0 | 0.5 | GO:0006378 | mRNA polyadenylation(GO:0006378) |
| 0.0 | 0.1 | GO:0071786 | endoplasmic reticulum tubular network organization(GO:0071786) |
| 0.0 | 0.6 | GO:0009082 | branched-chain amino acid biosynthetic process(GO:0009082) |
| 0.0 | 1.2 | GO:0009567 | fertilization(GO:0009566) double fertilization forming a zygote and endosperm(GO:0009567) |
| 0.0 | 0.2 | GO:0046513 | ceramide biosynthetic process(GO:0046513) |
| 0.0 | 0.7 | GO:0048510 | regulation of timing of meristematic phase transition(GO:0048506) regulation of timing of transition from vegetative to reproductive phase(GO:0048510) |
| 0.0 | 0.2 | GO:0006265 | DNA topological change(GO:0006265) |
| 0.0 | 0.8 | GO:0000381 | regulation of alternative mRNA splicing, via spliceosome(GO:0000381) |
| 0.0 | 0.4 | GO:0042744 | hydrogen peroxide catabolic process(GO:0042744) |
| 0.0 | 0.2 | GO:2000142 | regulation of transcription initiation from RNA polymerase II promoter(GO:0060260) positive regulation of transcription initiation from RNA polymerase II promoter(GO:0060261) regulation of DNA-templated transcription, initiation(GO:2000142) positive regulation of DNA-templated transcription, initiation(GO:2000144) |
| 0.0 | 0.5 | GO:0006405 | RNA export from nucleus(GO:0006405) |
| 0.0 | 1.9 | GO:0006364 | rRNA processing(GO:0006364) |
| 0.0 | 0.1 | GO:0006353 | DNA-templated transcription, termination(GO:0006353) |
| 0.0 | 0.5 | GO:0006400 | tRNA modification(GO:0006400) |
Gene overrepresentation in cellular component category:
| Log-likelihood per target | Total log-likelihood | Term | Description |
|---|---|---|---|
| 2.6 | 2.6 | GO:0016328 | lateral plasma membrane(GO:0016328) |
| 1.7 | 5.1 | GO:0043674 | pollen wall(GO:0043667) exine(GO:0043668) sexine(GO:0043673) columella(GO:0043674) |
| 1.4 | 7.1 | GO:0009897 | external side of plasma membrane(GO:0009897) |
| 1.2 | 4.7 | GO:0010330 | cellulose synthase complex(GO:0010330) |
| 1.1 | 5.4 | GO:0009569 | chloroplast starch grain(GO:0009569) starch grain(GO:0043036) |
| 0.9 | 9.9 | GO:0000326 | storage vacuole(GO:0000322) protein storage vacuole(GO:0000326) |
| 0.9 | 2.7 | GO:0031021 | interphase microtubule organizing center(GO:0031021) |
| 0.8 | 3.3 | GO:0009317 | acetyl-CoA carboxylase complex(GO:0009317) |
| 0.7 | 2.0 | GO:0070382 | exocytic vesicle(GO:0070382) |
| 0.6 | 6.1 | GO:0042555 | MCM complex(GO:0042555) |
| 0.6 | 1.8 | GO:0032432 | actin filament bundle(GO:0032432) |
| 0.6 | 6.6 | GO:0045261 | proton-transporting ATP synthase complex, catalytic core F(1)(GO:0045261) |
| 0.5 | 1.5 | GO:0035371 | microtubule plus-end(GO:0035371) |
| 0.5 | 10.4 | GO:0016324 | apical plasma membrane(GO:0016324) |
| 0.5 | 6.6 | GO:0005880 | nuclear microtubule(GO:0005880) |
| 0.4 | 1.8 | GO:0031353 | intrinsic component of plastid inner membrane(GO:0031352) integral component of plastid inner membrane(GO:0031353) intrinsic component of chloroplast inner membrane(GO:0031356) integral component of chloroplast inner membrane(GO:0031357) |
| 0.4 | 3.5 | GO:0032153 | cell division site(GO:0032153) |
| 0.4 | 6.7 | GO:0031012 | extracellular matrix(GO:0031012) |
| 0.4 | 59.7 | GO:0046658 | anchored component of plasma membrane(GO:0046658) |
| 0.4 | 15.5 | GO:0010319 | stromule(GO:0010319) |
| 0.4 | 17.0 | GO:0031978 | chloroplast thylakoid lumen(GO:0009543) plastid thylakoid lumen(GO:0031978) |
| 0.4 | 1.1 | GO:0031429 | box H/ACA snoRNP complex(GO:0031429) box H/ACA RNP complex(GO:0072588) |
| 0.3 | 4.3 | GO:0009986 | cell surface(GO:0009986) |
| 0.3 | 2.3 | GO:0030139 | endocytic vesicle(GO:0030139) |
| 0.3 | 3.5 | GO:0031519 | PcG protein complex(GO:0031519) |
| 0.3 | 5.1 | GO:0009522 | photosystem I(GO:0009522) |
| 0.3 | 17.4 | GO:0005797 | Golgi medial cisterna(GO:0005797) |
| 0.3 | 8.2 | GO:0055028 | cortical microtubule(GO:0055028) |
| 0.3 | 0.9 | GO:0043235 | TAT protein transport complex(GO:0033281) receptor complex(GO:0043235) |
| 0.3 | 54.4 | GO:0009505 | plant-type cell wall(GO:0009505) |
| 0.3 | 72.2 | GO:0048046 | apoplast(GO:0048046) |
| 0.3 | 1.4 | GO:0005828 | kinetochore microtubule(GO:0005828) |
| 0.3 | 3.1 | GO:0045298 | tubulin complex(GO:0045298) |
| 0.2 | 55.8 | GO:0009535 | chloroplast thylakoid membrane(GO:0009535) |
| 0.2 | 0.7 | GO:0032299 | ribonuclease H2 complex(GO:0032299) |
| 0.2 | 1.1 | GO:0008250 | oligosaccharyltransferase complex(GO:0008250) |
| 0.2 | 16.1 | GO:0000138 | Golgi trans cisterna(GO:0000138) |
| 0.2 | 0.7 | GO:0042788 | polysomal ribosome(GO:0042788) |
| 0.2 | 2.2 | GO:0019773 | proteasome core complex, alpha-subunit complex(GO:0019773) |
| 0.2 | 26.0 | GO:0005618 | cell wall(GO:0005618) external encapsulating structure(GO:0030312) |
| 0.1 | 18.7 | GO:0022625 | cytosolic large ribosomal subunit(GO:0022625) |
| 0.1 | 10.1 | GO:0009534 | chloroplast thylakoid(GO:0009534) |
| 0.1 | 14.3 | GO:0031225 | anchored component of membrane(GO:0031225) |
| 0.1 | 3.2 | GO:0005680 | anaphase-promoting complex(GO:0005680) |
| 0.1 | 2.7 | GO:0012511 | monolayer-surrounded lipid storage body(GO:0012511) |
| 0.1 | 1.8 | GO:0016459 | myosin complex(GO:0016459) |
| 0.1 | 0.3 | GO:0002189 | ribose phosphate diphosphokinase complex(GO:0002189) |
| 0.1 | 1.7 | GO:0000786 | nucleosome(GO:0000786) |
| 0.1 | 2.4 | GO:0005871 | kinesin complex(GO:0005871) |
| 0.1 | 1.4 | GO:0009508 | plastid chromosome(GO:0009508) |
| 0.1 | 1.4 | GO:0032588 | trans-Golgi network membrane(GO:0032588) |
| 0.1 | 0.6 | GO:0005845 | mRNA cap binding complex(GO:0005845) |
| 0.1 | 0.6 | GO:0005687 | U4 snRNP(GO:0005687) |
| 0.1 | 8.6 | GO:0031969 | chloroplast membrane(GO:0031969) |
| 0.1 | 4.4 | GO:0090406 | pollen tube(GO:0090406) |
| 0.1 | 1.8 | GO:0000307 | cyclin-dependent protein kinase holoenzyme complex(GO:0000307) |
| 0.1 | 166.6 | GO:0005576 | extracellular region(GO:0005576) |
| 0.1 | 1.5 | GO:0005686 | U2 snRNP(GO:0005686) |
| 0.1 | 0.2 | GO:0009330 | DNA topoisomerase complex (ATP-hydrolyzing)(GO:0009330) |
| 0.1 | 6.9 | GO:0022626 | cytosolic ribosome(GO:0022626) |
| 0.1 | 1.1 | GO:0000784 | nuclear chromosome, telomeric region(GO:0000784) |
| 0.1 | 0.5 | GO:0005832 | chaperonin-containing T-complex(GO:0005832) |
| 0.0 | 0.1 | GO:0044614 | nuclear pore cytoplasmic filaments(GO:0044614) |
| 0.0 | 1.3 | GO:0005798 | Golgi-associated vesicle(GO:0005798) |
| 0.0 | 1.5 | GO:0099503 | secretory vesicle(GO:0099503) |
| 0.0 | 1.3 | GO:0005874 | microtubule(GO:0005874) |
| 0.0 | 1.0 | GO:0009504 | cell plate(GO:0009504) |
| 0.0 | 0.4 | GO:0031965 | nuclear membrane(GO:0031965) |
| 0.0 | 0.4 | GO:0000418 | DNA-directed RNA polymerase IV complex(GO:0000418) |
| 0.0 | 0.5 | GO:0005643 | nuclear pore(GO:0005643) |
| 0.0 | 0.1 | GO:0098554 | integral component of cytoplasmic side of endoplasmic reticulum membrane(GO:0071458) cytoplasmic side of endoplasmic reticulum membrane(GO:0098554) |
Gene overrepresentation in molecular function category:
| Log-likelihood per target | Total log-likelihood | Term | Description |
|---|---|---|---|
| 4.5 | 13.4 | GO:0015204 | ammonium transmembrane transporter activity(GO:0008519) urea transmembrane transporter activity(GO:0015204) |
| 2.7 | 8.2 | GO:0016802 | adenosylhomocysteinase activity(GO:0004013) trialkylsulfonium hydrolase activity(GO:0016802) |
| 2.4 | 4.7 | GO:0051753 | beta-1,4-mannosyltransferase activity(GO:0019187) mannan synthase activity(GO:0051753) |
| 1.7 | 8.5 | GO:0004001 | adenosine kinase activity(GO:0004001) |
| 1.6 | 8.1 | GO:0008835 | diaminohydroxyphosphoribosylaminopyrimidine deaminase activity(GO:0008835) |
| 1.4 | 5.7 | GO:0070330 | oxidoreductase activity, acting on paired donors, with incorporation or reduction of molecular oxygen, reduced flavin or flavoprotein as one donor, and incorporation of one atom of oxygen(GO:0016712) aromatase activity(GO:0070330) |
| 1.4 | 2.8 | GO:0047912 | galacturonokinase activity(GO:0047912) |
| 1.3 | 6.3 | GO:0004478 | methionine adenosyltransferase activity(GO:0004478) |
| 1.2 | 3.6 | GO:0003959 | NADPH dehydrogenase activity(GO:0003959) |
| 1.1 | 3.3 | GO:0009374 | biotin binding(GO:0009374) |
| 1.1 | 5.5 | GO:0003979 | UDP-glucose 6-dehydrogenase activity(GO:0003979) |
| 1.1 | 2.1 | GO:0016618 | hydroxypyruvate reductase activity(GO:0016618) |
| 1.1 | 6.3 | GO:0017057 | 6-phosphogluconolactonase activity(GO:0017057) |
| 1.0 | 33.5 | GO:0016762 | xyloglucan:xyloglucosyl transferase activity(GO:0016762) |
| 1.0 | 2.9 | GO:0043140 | ATP-dependent 3'-5' DNA helicase activity(GO:0043140) single-stranded DNA-dependent ATP-dependent 3'-5' DNA helicase activity(GO:1990518) |
| 0.9 | 3.6 | GO:0004556 | alpha-amylase activity(GO:0004556) |
| 0.8 | 21.5 | GO:0016168 | chlorophyll binding(GO:0016168) |
| 0.8 | 16.5 | GO:0005199 | structural constituent of cell wall(GO:0005199) |
| 0.8 | 3.3 | GO:0052740 | phosphatidylserine 1-acylhydrolase activity(GO:0052739) 1-acyl-2-lysophosphatidylserine acylhydrolase activity(GO:0052740) |
| 0.8 | 2.4 | GO:0044540 | L-cystine L-cysteine-lyase (deaminating)(GO:0044540) |
| 0.8 | 3.9 | GO:0033843 | xyloglucan 6-xylosyltransferase activity(GO:0033843) |
| 0.8 | 2.3 | GO:0004359 | glutaminase activity(GO:0004359) |
| 0.7 | 3.7 | GO:0008964 | phosphoenolpyruvate carboxylase activity(GO:0008964) |
| 0.7 | 23.1 | GO:0008266 | poly(U) RNA binding(GO:0008266) |
| 0.7 | 6.6 | GO:0046933 | proton-transporting ATP synthase activity, rotational mechanism(GO:0046933) |
| 0.7 | 2.9 | GO:0008395 | steroid hydroxylase activity(GO:0008395) |
| 0.7 | 2.2 | GO:1990465 | octadecanal decarbonylase activity(GO:0009924) aldehyde decarbonylase activity(GO:0071771) aldehyde oxygenase (deformylating) activity(GO:1990465) |
| 0.7 | 12.9 | GO:0010329 | auxin efflux transmembrane transporter activity(GO:0010329) |
| 0.7 | 19.0 | GO:0008810 | cellulase activity(GO:0008810) |
| 0.7 | 2.1 | GO:0004452 | isopentenyl-diphosphate delta-isomerase activity(GO:0004452) |
| 0.7 | 2.7 | GO:0045548 | phenylalanine ammonia-lyase activity(GO:0045548) |
| 0.7 | 2.0 | GO:0001216 | bacterial-type RNA polymerase transcription factor activity, sequence-specific DNA binding(GO:0001130) bacterial-type RNA polymerase transcriptional activator activity, sequence-specific DNA binding(GO:0001216) |
| 0.7 | 2.6 | GO:0070182 | DNA polymerase binding(GO:0070182) |
| 0.7 | 3.3 | GO:0004816 | asparagine-tRNA ligase activity(GO:0004816) |
| 0.7 | 3.3 | GO:0042085 | 5-methyltetrahydropteroyltriglutamate-homocysteine S-methyltransferase activity(GO:0003871) methionine synthase activity(GO:0008705) 5-methyltetrahydrofolate-dependent methyltransferase activity(GO:0042084) 5-methyltetrahydropteroyltri-L-glutamate-dependent methyltransferase activity(GO:0042085) |
| 0.6 | 16.6 | GO:0004805 | trehalose-phosphatase activity(GO:0004805) |
| 0.6 | 1.8 | GO:0003849 | 3-deoxy-7-phosphoheptulonate synthase activity(GO:0003849) |
| 0.6 | 3.6 | GO:0047769 | prephenate dehydratase activity(GO:0004664) arogenate dehydratase activity(GO:0047769) |
| 0.6 | 1.8 | GO:0015117 | thiosulfate transmembrane transporter activity(GO:0015117) |
| 0.6 | 1.8 | GO:0004476 | mannose-6-phosphate isomerase activity(GO:0004476) |
| 0.6 | 1.8 | GO:0005078 | MAP-kinase scaffold activity(GO:0005078) protein kinase C binding(GO:0005080) protein complex scaffold(GO:0032947) signaling adaptor activity(GO:0035591) |
| 0.6 | 2.3 | GO:0015018 | galactosylgalactosylxylosylprotein 3-beta-glucuronosyltransferase activity(GO:0015018) 1,4-beta-D-xylan synthase activity(GO:0047517) |
| 0.6 | 2.3 | GO:0080161 | auxin transmembrane transporter activity(GO:0080161) |
| 0.6 | 4.5 | GO:0022833 | mechanically-gated ion channel activity(GO:0008381) mechanically gated channel activity(GO:0022833) |
| 0.6 | 19.0 | GO:0005179 | hormone activity(GO:0005179) |
| 0.6 | 2.2 | GO:0070818 | oxygen-dependent protoporphyrinogen oxidase activity(GO:0004729) protoporphyrinogen oxidase activity(GO:0070818) |
| 0.6 | 1.7 | GO:0017077 | oxidative phosphorylation uncoupler activity(GO:0017077) |
| 0.6 | 13.8 | GO:0016837 | carbon-oxygen lyase activity, acting on polysaccharides(GO:0016837) pectate lyase activity(GO:0030570) |
| 0.5 | 2.2 | GO:0047724 | inosine nucleosidase activity(GO:0047724) |
| 0.5 | 13.4 | GO:0004565 | beta-galactosidase activity(GO:0004565) |
| 0.5 | 4.3 | GO:0015210 | pyrimidine nucleobase transmembrane transporter activity(GO:0005350) uracil transmembrane transporter activity(GO:0015210) |
| 0.5 | 6.3 | GO:0047259 | glucomannan 4-beta-mannosyltransferase activity(GO:0047259) |
| 0.5 | 2.6 | GO:0008430 | selenium binding(GO:0008430) |
| 0.5 | 1.5 | GO:0003986 | acetyl-CoA hydrolase activity(GO:0003986) |
| 0.5 | 2.5 | GO:0004127 | cytidylate kinase activity(GO:0004127) |
| 0.5 | 4.5 | GO:0009922 | fatty acid elongase activity(GO:0009922) |
| 0.5 | 1.5 | GO:0004807 | triose-phosphate isomerase activity(GO:0004807) |
| 0.5 | 4.5 | GO:0009979 | 16:0 monogalactosyldiacylglycerol desaturase activity(GO:0009979) |
| 0.5 | 1.5 | GO:0051010 | microtubule plus-end binding(GO:0051010) |
| 0.5 | 3.4 | GO:0008121 | ubiquinol-cytochrome-c reductase activity(GO:0008121) oxidoreductase activity, acting on diphenols and related substances as donors, cytochrome as acceptor(GO:0016681) |
| 0.5 | 1.9 | GO:0042409 | caffeoyl-CoA O-methyltransferase activity(GO:0042409) |
| 0.4 | 2.2 | GO:0043682 | copper-transporting ATPase activity(GO:0043682) |
| 0.4 | 8.7 | GO:0005089 | Rho guanyl-nucleotide exchange factor activity(GO:0005089) |
| 0.4 | 1.7 | GO:0080097 | L-tryptophan:pyruvate aminotransferase activity(GO:0080097) |
| 0.4 | 12.3 | GO:0047262 | polygalacturonate 4-alpha-galacturonosyltransferase activity(GO:0047262) |
| 0.4 | 3.8 | GO:0009882 | blue light photoreceptor activity(GO:0009882) |
| 0.4 | 1.2 | GO:0003864 | 3-methyl-2-oxobutanoate hydroxymethyltransferase activity(GO:0003864) |
| 0.4 | 1.6 | GO:0004445 | inositol-polyphosphate 5-phosphatase activity(GO:0004445) inositol-1,3,4,5-tetrakisphosphate 5-phosphatase activity(GO:0052659) inositol tetrakisphosphate phosphatase activity(GO:0052743) |
| 0.4 | 1.9 | GO:0009678 | hydrogen-translocating pyrophosphatase activity(GO:0009678) |
| 0.4 | 2.6 | GO:0015098 | molybdate ion transmembrane transporter activity(GO:0015098) |
| 0.4 | 1.9 | GO:0034511 | U3 snoRNA binding(GO:0034511) |
| 0.4 | 6.9 | GO:0015250 | water transmembrane transporter activity(GO:0005372) water channel activity(GO:0015250) |
| 0.4 | 8.0 | GO:0019203 | carbohydrate phosphatase activity(GO:0019203) |
| 0.3 | 2.1 | GO:0050378 | UDP-glucuronate 4-epimerase activity(GO:0050378) |
| 0.3 | 1.7 | GO:0010313 | phytochrome binding(GO:0010313) |
| 0.3 | 2.3 | GO:0016621 | cinnamoyl-CoA reductase activity(GO:0016621) |
| 0.3 | 0.6 | GO:0005315 | inorganic phosphate transmembrane transporter activity(GO:0005315) |
| 0.3 | 12.5 | GO:0016759 | cellulose synthase activity(GO:0016759) |
| 0.3 | 2.7 | GO:0016646 | oxidoreductase activity, acting on the CH-NH group of donors, NAD or NADP as acceptor(GO:0016646) |
| 0.3 | 3.3 | GO:0016847 | 1-aminocyclopropane-1-carboxylate synthase activity(GO:0016847) |
| 0.3 | 1.2 | GO:0019172 | glyoxalase III activity(GO:0019172) |
| 0.3 | 2.7 | GO:0017048 | Rho GTPase binding(GO:0017048) |
| 0.3 | 3.5 | GO:0103075 | indole-3-pyruvate monooxygenase activity(GO:0103075) |
| 0.3 | 3.7 | GO:1990939 | ATP-dependent microtubule motor activity(GO:1990939) |
| 0.3 | 1.4 | GO:0034432 | bis(5'-adenosyl)-pentaphosphatase activity(GO:0034432) |
| 0.3 | 18.7 | GO:0046910 | pectinesterase inhibitor activity(GO:0046910) |
| 0.3 | 10.8 | GO:0045735 | nutrient reservoir activity(GO:0045735) |
| 0.3 | 1.6 | GO:0004652 | polynucleotide adenylyltransferase activity(GO:0004652) |
| 0.3 | 5.4 | GO:0004864 | protein phosphatase inhibitor activity(GO:0004864) |
| 0.3 | 0.8 | GO:0010280 | UDP-L-rhamnose synthase activity(GO:0010280) UDP-glucose 4,6-dehydratase activity(GO:0050377) |
| 0.3 | 10.1 | GO:0018024 | histone-lysine N-methyltransferase activity(GO:0018024) |
| 0.3 | 1.0 | GO:0015930 | glutamate synthase activity(GO:0015930) glutamate synthase (NADH) activity(GO:0016040) glutamate synthase activity, NAD(P)H as acceptor(GO:0045181) |
| 0.3 | 1.3 | GO:0000048 | peptidyltransferase activity(GO:0000048) glutathione hydrolase activity(GO:0036374) |
| 0.3 | 1.8 | GO:0005247 | voltage-gated chloride channel activity(GO:0005247) chloride channel activity(GO:0005254) |
| 0.3 | 3.3 | GO:0070567 | cytidylyltransferase activity(GO:0070567) |
| 0.3 | 0.8 | GO:0004042 | acetyl-CoA:L-glutamate N-acetyltransferase activity(GO:0004042) |
| 0.2 | 2.4 | GO:0009378 | four-way junction helicase activity(GO:0009378) |
| 0.2 | 2.9 | GO:0000774 | adenyl-nucleotide exchange factor activity(GO:0000774) |
| 0.2 | 4.8 | GO:0042973 | glucan endo-1,3-beta-D-glucosidase activity(GO:0042973) |
| 0.2 | 32.7 | GO:0008017 | microtubule binding(GO:0008017) |
| 0.2 | 1.4 | GO:0019904 | protein domain specific binding(GO:0019904) |
| 0.2 | 1.6 | GO:0003885 | D-arabinono-1,4-lactone oxidase activity(GO:0003885) |
| 0.2 | 1.3 | GO:0045547 | dehydrodolichyl diphosphate synthase activity(GO:0045547) |
| 0.2 | 3.0 | GO:0016207 | 4-coumarate-CoA ligase activity(GO:0016207) |
| 0.2 | 0.8 | GO:0004048 | anthranilate phosphoribosyltransferase activity(GO:0004048) |
| 0.2 | 1.3 | GO:0003983 | UTP:glucose-1-phosphate uridylyltransferase activity(GO:0003983) |
| 0.2 | 2.1 | GO:0008173 | RNA methyltransferase activity(GO:0008173) |
| 0.2 | 8.0 | GO:0008171 | O-methyltransferase activity(GO:0008171) |
| 0.2 | 2.6 | GO:0016774 | phosphotransferase activity, carboxyl group as acceptor(GO:0016774) |
| 0.2 | 2.0 | GO:0047134 | protein-disulfide reductase activity(GO:0047134) |
| 0.2 | 4.0 | GO:0008146 | sulfotransferase activity(GO:0008146) |
| 0.2 | 21.9 | GO:0004252 | serine-type endopeptidase activity(GO:0004252) |
| 0.2 | 0.6 | GO:0000340 | RNA 7-methylguanosine cap binding(GO:0000340) |
| 0.2 | 3.2 | GO:0003688 | DNA replication origin binding(GO:0003688) |
| 0.2 | 2.4 | GO:0016308 | 1-phosphatidylinositol-4-phosphate 5-kinase activity(GO:0016308) |
| 0.2 | 1.7 | GO:0050136 | NADH dehydrogenase (ubiquinone) activity(GO:0008137) NADH dehydrogenase (quinone) activity(GO:0050136) |
| 0.2 | 4.0 | GO:0004568 | chitinase activity(GO:0004568) |
| 0.2 | 0.5 | GO:0016314 | phosphatidylinositol-3,4,5-trisphosphate 3-phosphatase activity(GO:0016314) |
| 0.2 | 4.6 | GO:0000146 | microfilament motor activity(GO:0000146) actin-dependent ATPase activity(GO:0030898) |
| 0.2 | 1.3 | GO:0004024 | alcohol dehydrogenase activity, zinc-dependent(GO:0004024) |
| 0.2 | 7.4 | GO:0016413 | O-acetyltransferase activity(GO:0016413) |
| 0.1 | 2.3 | GO:0016782 | transferase activity, transferring sulfur-containing groups(GO:0016782) |
| 0.1 | 6.6 | GO:0102483 | scopolin beta-glucosidase activity(GO:0102483) |
| 0.1 | 1.5 | GO:0015165 | pyrimidine nucleotide-sugar transmembrane transporter activity(GO:0015165) |
| 0.1 | 0.9 | GO:0005536 | glucokinase activity(GO:0004340) glucose binding(GO:0005536) mannokinase activity(GO:0019158) |
| 0.1 | 1.0 | GO:0048038 | quinone binding(GO:0048038) |
| 0.1 | 2.0 | GO:0004176 | ATP-dependent peptidase activity(GO:0004176) |
| 0.1 | 1.4 | GO:0004430 | 1-phosphatidylinositol 4-kinase activity(GO:0004430) |
| 0.1 | 0.3 | GO:0004749 | ribose phosphate diphosphokinase activity(GO:0004749) |
| 0.1 | 1.7 | GO:0015114 | phosphate ion transmembrane transporter activity(GO:0015114) |
| 0.1 | 3.5 | GO:0000049 | tRNA binding(GO:0000049) |
| 0.1 | 1.0 | GO:0004351 | glutamate decarboxylase activity(GO:0004351) |
| 0.1 | 5.2 | GO:0004190 | aspartic-type endopeptidase activity(GO:0004190) |
| 0.1 | 1.7 | GO:0070628 | proteasome binding(GO:0070628) |
| 0.1 | 3.6 | GO:0016881 | acid-amino acid ligase activity(GO:0016881) |
| 0.1 | 3.1 | GO:0005200 | structural constituent of cytoskeleton(GO:0005200) |
| 0.1 | 5.9 | GO:0004650 | polygalacturonase activity(GO:0004650) |
| 0.1 | 1.4 | GO:0000175 | 3'-5'-exoribonuclease activity(GO:0000175) |
| 0.1 | 1.5 | GO:0043295 | glutathione binding(GO:0043295) oligopeptide binding(GO:1900750) |
| 0.1 | 1.8 | GO:0016538 | cyclin-dependent protein serine/threonine kinase regulator activity(GO:0016538) |
| 0.1 | 0.9 | GO:0004467 | long-chain fatty acid-CoA ligase activity(GO:0004467) decanoate--CoA ligase activity(GO:0102391) |
| 0.1 | 8.4 | GO:0008757 | S-adenosylmethionine-dependent methyltransferase activity(GO:0008757) |
| 0.1 | 4.5 | GO:0003755 | peptidyl-prolyl cis-trans isomerase activity(GO:0003755) |
| 0.1 | 0.9 | GO:0016405 | CoA-ligase activity(GO:0016405) |
| 0.1 | 3.6 | GO:0005451 | monovalent cation:proton antiporter activity(GO:0005451) |
| 0.1 | 3.1 | GO:0003678 | DNA helicase activity(GO:0003678) |
| 0.1 | 5.1 | GO:0016866 | intramolecular transferase activity(GO:0016866) |
| 0.1 | 0.2 | GO:0045140 | inositol phosphoceramide synthase activity(GO:0045140) |
| 0.1 | 16.8 | GO:0003735 | structural constituent of ribosome(GO:0003735) |
| 0.1 | 1.0 | GO:0047196 | long-chain-alcohol O-fatty-acyltransferase activity(GO:0047196) |
| 0.1 | 3.2 | GO:0010857 | calcium-dependent protein serine/threonine kinase activity(GO:0009931) calcium-dependent protein kinase activity(GO:0010857) |
| 0.1 | 0.5 | GO:0051537 | 2 iron, 2 sulfur cluster binding(GO:0051537) |
| 0.1 | 0.5 | GO:0030060 | L-malate dehydrogenase activity(GO:0030060) |
| 0.1 | 2.1 | GO:0016879 | ligase activity, forming carbon-nitrogen bonds(GO:0016879) |
| 0.0 | 2.6 | GO:0001871 | pattern binding(GO:0001871) polysaccharide binding(GO:0030247) |
| 0.0 | 6.3 | GO:0009055 | electron carrier activity(GO:0009055) |
| 0.0 | 0.7 | GO:0017056 | structural constituent of nuclear pore(GO:0017056) |
| 0.0 | 7.0 | GO:0005507 | copper ion binding(GO:0005507) |
| 0.0 | 2.9 | GO:0004857 | enzyme inhibitor activity(GO:0004857) |
| 0.0 | 0.8 | GO:0060090 | binding, bridging(GO:0060090) |
| 0.0 | 0.6 | GO:0004743 | pyruvate kinase activity(GO:0004743) potassium ion binding(GO:0030955) alkali metal ion binding(GO:0031420) |
| 0.0 | 0.5 | GO:0005452 | inorganic anion exchanger activity(GO:0005452) |
| 0.0 | 0.7 | GO:0008375 | acetylglucosaminyltransferase activity(GO:0008375) |
| 0.0 | 6.4 | GO:0042803 | protein homodimerization activity(GO:0042803) |
| 0.0 | 0.1 | GO:0016985 | mannan endo-1,4-beta-mannosidase activity(GO:0016985) |
| 0.0 | 1.3 | GO:0019199 | transmembrane receptor protein kinase activity(GO:0019199) |
| 0.0 | 25.6 | GO:0004672 | protein kinase activity(GO:0004672) |
| 0.0 | 0.1 | GO:0004181 | metallocarboxypeptidase activity(GO:0004181) |
| 0.0 | 0.3 | GO:0048040 | UDP-glucuronate decarboxylase activity(GO:0048040) |
| 0.0 | 1.6 | GO:0016706 | oxidoreductase activity, acting on paired donors, with incorporation or reduction of molecular oxygen, 2-oxoglutarate as one donor, and incorporation of one atom each of oxygen into both donors(GO:0016706) |
| 0.0 | 0.6 | GO:0005227 | calcium activated cation channel activity(GO:0005227) ion gated channel activity(GO:0022839) |
| 0.0 | 0.5 | GO:0003887 | DNA-directed DNA polymerase activity(GO:0003887) |
| 0.0 | 1.1 | GO:0016763 | transferase activity, transferring pentosyl groups(GO:0016763) |
| 0.0 | 0.2 | GO:0061505 | DNA topoisomerase type II (ATP-hydrolyzing) activity(GO:0003918) DNA topoisomerase II activity(GO:0061505) |
| 0.0 | 0.1 | GO:0080045 | quercetin 3'-O-glucosyltransferase activity(GO:0080045) |
| 0.0 | 0.2 | GO:0004506 | squalene monooxygenase activity(GO:0004506) |
| 0.0 | 0.1 | GO:0003785 | actin monomer binding(GO:0003785) |
| 0.0 | 0.2 | GO:0008506 | sucrose:proton symporter activity(GO:0008506) |
| 0.0 | 2.2 | GO:0005525 | GTP binding(GO:0005525) guanyl nucleotide binding(GO:0019001) guanyl ribonucleotide binding(GO:0032561) |
| 0.0 | 6.6 | GO:0046983 | protein dimerization activity(GO:0046983) |
| 0.0 | 0.7 | GO:0004523 | RNA-DNA hybrid ribonuclease activity(GO:0004523) |
| 0.0 | 1.1 | GO:0003724 | RNA helicase activity(GO:0003724) |
| 0.0 | 0.1 | GO:0052623 | ATP dimethylallyltransferase activity(GO:0052622) ADP dimethylallyltransferase activity(GO:0052623) |
| 0.0 | 0.5 | GO:0003899 | DNA-directed RNA polymerase activity(GO:0003899) |
| 0.0 | 0.1 | GO:0035198 | miRNA binding(GO:0035198) |
| 0.0 | 0.3 | GO:0045309 | protein phosphorylated amino acid binding(GO:0045309) phosphoprotein binding(GO:0051219) |
Gene overrepresentation in curated gene sets: canonical pathways category:
| Log-likelihood per target | Total log-likelihood | Term | Description |
|---|---|---|---|
| 1.4 | 9.5 | PID HES HEY PATHWAY | Notch-mediated HES/HEY network |
| 0.8 | 2.3 | PID AURORA A PATHWAY | Aurora A signaling |
| 0.5 | 2.0 | PID BCR 5PATHWAY | BCR signaling pathway |
| 0.5 | 2.9 | PID AP1 PATHWAY | AP-1 transcription factor network |
| 0.4 | 3.0 | PID CMYB PATHWAY | C-MYB transcription factor network |
| 0.3 | 1.0 | PID ARF6 DOWNSTREAM PATHWAY | Arf6 downstream pathway |
| 0.3 | 0.9 | PID AMB2 NEUTROPHILS PATHWAY | amb2 Integrin signaling |
| 0.2 | 1.8 | PID HIF1 TFPATHWAY | HIF-1-alpha transcription factor network |
| 0.2 | 2.0 | PID MYC ACTIV PATHWAY | Validated targets of C-MYC transcriptional activation |
Gene overrepresentation in curated gene sets: REACTOME pathways category:
| Log-likelihood per target | Total log-likelihood | Term | Description |
|---|---|---|---|
| 1.1 | 3.4 | REACTOME INTEGRATION OF ENERGY METABOLISM | Genes involved in Integration of energy metabolism |
| 0.9 | 6.1 | REACTOME UNWINDING OF DNA | Genes involved in Unwinding of DNA |
| 0.7 | 2.0 | REACTOME TCR SIGNALING | Genes involved in TCR signaling |
| 0.7 | 2.0 | REACTOME PRE NOTCH EXPRESSION AND PROCESSING | Genes involved in Pre-NOTCH Expression and Processing |
| 0.6 | 1.9 | REACTOME FORMATION OF TUBULIN FOLDING INTERMEDIATES BY CCT TRIC | Genes involved in Formation of tubulin folding intermediates by CCT/TriC |
| 0.6 | 3.8 | REACTOME LIPID DIGESTION MOBILIZATION AND TRANSPORT | Genes involved in Lipid digestion, mobilization, and transport |
| 0.5 | 1.4 | REACTOME ABACAVIR TRANSPORT AND METABOLISM | Genes involved in Abacavir transport and metabolism |
| 0.4 | 6.7 | REACTOME FACTORS INVOLVED IN MEGAKARYOCYTE DEVELOPMENT AND PLATELET PRODUCTION | Genes involved in Factors involved in megakaryocyte development and platelet production |
| 0.4 | 3.3 | REACTOME ASPARAGINE N LINKED GLYCOSYLATION | Genes involved in Asparagine N-linked glycosylation |
| 0.4 | 2.9 | REACTOME INNATE IMMUNE SYSTEM | Genes involved in Innate Immune System |
| 0.0 | 0.1 | REACTOME COPI MEDIATED TRANSPORT | Genes involved in COPI Mediated Transport |