Project
GSE43616: Time-course of wild-type Arabidopsis leaf
Navigation
Downloads
Results for AT2G22430
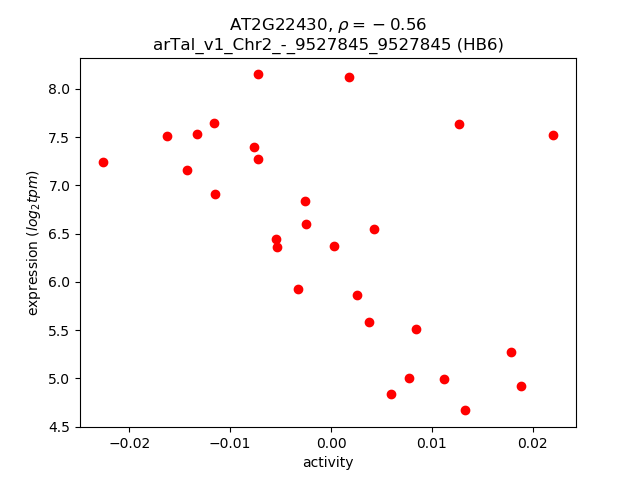
Z-value: 1.38
Transcription factors associated with AT2G22430
| Gene Symbol | Gene ID | Gene Info |
|---|---|---|
|
AT2G22430
|
AT2G22430 | homeobox protein 6 |
Activity-expression correlation:
| Gene | Promoter | Pearson corr. coef. | P-value | Plot |
|---|---|---|---|---|
| HB6 | arTal_v1_Chr2_-_9527845_9527845 | -0.56 | 1.9e-03 | Click! |
Activity profile of AT2G22430 motif
Sorted Z-values of AT2G22430 motif
| Promoter | Log-likelihood | Transcript | Gene | Gene Info |
|---|---|---|---|---|
| arTal_v1_Chr2_-_4312103_4312162 | 3.66 |
AT2G10940.2
AT2G10940.1 |
AT2G10940
|
Bifunctional inhibitor/lipid-transfer protein/seed storage 2S albumin superfamily protein |
| arTal_v1_Chr5_+_9072708_9072727 | 2.67 |
AT5G25980.2
AT5G25980.1 AT5G25980.3 |
TGG2
|
glucoside glucohydrolase 2 |
| arTal_v1_Chr1_-_20648891_20648891 | 2.48 |
AT1G55330.1
|
AGP21
|
arabinogalactan protein 21 |
| arTal_v1_Chr4_-_10391298_10391298 | 2.41 |
AT4G18970.1
|
AT4G18970
|
GDSL-like Lipase/Acylhydrolase superfamily protein |
| arTal_v1_Chr4_-_10390991_10390991 | 2.40 |
AT4G18970.2
|
AT4G18970
|
GDSL-like Lipase/Acylhydrolase superfamily protein |
| arTal_v1_Chr5_-_9082384_9082384 | 2.21 |
AT5G26000.1
AT5G26000.2 |
TGG1
|
thioglucoside glucohydrolase 1 |
| arTal_v1_Chr2_+_8940833_8940833 | 2.00 |
AT2G20750.2
AT2G20750.1 |
EXPB1
|
expansin B1 |
| arTal_v1_Chr2_-_17827648_17827648 | 1.99 |
AT2G42840.1
|
PDF1
|
protodermal factor 1 |
| arTal_v1_Chr5_+_18528267_18528267 | 1.95 |
AT5G45670.1
|
AT5G45670
|
GDSL-like Lipase/Acylhydrolase superfamily protein |
| arTal_v1_Chr4_-_17606924_17607050 | 1.94 |
AT4G37450.1
AT4G37450.2 |
AGP18
|
arabinogalactan protein 18 |
| arTal_v1_Chr3_-_7796310_7796460 | 1.81 |
AT3G22120.1
AT3G22120.2 |
CWLP
|
cell wall-plasma membrane linker protein |
| arTal_v1_Chr4_-_176870_176870 | 1.79 |
AT4G00400.1
|
GPAT8
|
glycerol-3-phosphate acyltransferase 8 |
| arTal_v1_Chr3_-_1136397_1136397 | 1.79 |
AT3G04290.1
|
LTL1
|
Li-tolerant lipase 1 |
| arTal_v1_Chr3_-_4008018_4008018 | 1.78 |
AT3G12610.1
|
DRT100
|
Leucine-rich repeat (LRR) family protein |
| arTal_v1_Chr5_+_21020014_21020014 | 1.78 |
AT5G51750.1
|
SBT1.3
|
subtilase 1.3 |
| arTal_v1_Chr5_+_4087689_4087689 | 1.77 |
AT5G12940.1
|
AT5G12940
|
Leucine-rich repeat (LRR) family protein |
| arTal_v1_Chr1_+_2097106_2097106 | 1.75 |
AT1G06830.1
|
AT1G06830
|
Glutaredoxin family protein |
| arTal_v1_Chr1_-_29635931_29635931 | 1.72 |
AT1G78820.1
|
AT1G78820
|
D-mannose binding lectin protein with Apple-like carbohydrate-binding domain-containing protein |
| arTal_v1_Chr5_-_671687_671687 | 1.71 |
AT5G02890.1
|
AT5G02890
|
HXXXD-type acyl-transferase family protein |
| arTal_v1_Chr4_+_12660687_12660687 | 1.71 |
AT4G24510.1
|
CER2
|
HXXXD-type acyl-transferase family protein |
| arTal_v1_Chr1_+_10371675_10371675 | 1.70 |
AT1G29660.1
|
AT1G29660
|
GDSL-like Lipase/Acylhydrolase superfamily protein |
| arTal_v1_Chr5_-_13911225_13911225 | 1.67 |
AT5G35740.1
|
AT5G35740
|
Carbohydrate-binding X8 domain superfamily protein |
| arTal_v1_Chr4_+_18291218_18291218 | 1.64 |
AT4G39330.1
AT4G39330.2 |
CAD9
|
cinnamyl alcohol dehydrogenase 9 |
| arTal_v1_Chr2_-_15014147_15014284 | 1.64 |
AT2G35710.3
AT2G35710.4 AT2G35710.1 |
PGSIP7
|
Nucleotide-diphospho-sugar transferases superfamily protein |
| arTal_v1_Chr2_+_12805667_12805714 | 1.64 |
AT2G30010.2
AT2G30010.1 |
TBL45
|
TRICHOME BIREFRINGENCE-LIKE 45 |
| arTal_v1_Chr1_+_418726_418767 | 1.63 |
AT1G02205.4
AT1G02205.3 AT1G02205.5 AT1G02205.1 |
CER1
|
Fatty acid hydroxylase superfamily |
| arTal_v1_Chr1_-_59215_59215 | 1.61 |
AT1G01120.1
|
KCS1
|
3-ketoacyl-CoA synthase 1 |
| arTal_v1_Chr1_+_11343854_11343854 | 1.60 |
AT1G31690.1
|
AT1G31690
|
Copper amine oxidase family protein |
| arTal_v1_Chr1_+_25401514_25401514 | 1.60 |
AT1G67750.1
|
AT1G67750
|
Pectate lyase family protein |
| arTal_v1_Chr2_+_2763449_2763513 | 1.59 |
AT2G06850.1
AT2G06850.2 |
XTH4
|
xyloglucan endotransglucosylase/hydrolase 4 |
| arTal_v1_Chr1_-_5858446_5858550 | 1.59 |
AT1G17140.1
AT1G17140.2 |
ICR1
|
interactor of constitutive active rops 1 |
| arTal_v1_Chr1_+_7886323_7886323 | 1.58 |
AT1G22330.1
|
AT1G22330
|
RNA-binding (RRM/RBD/RNP motifs) family protein |
| arTal_v1_Chr2_+_1594588_1594588 | 1.57 |
AT2G04570.1
|
AT2G04570
|
GDSL-like Lipase/Acylhydrolase superfamily protein |
| arTal_v1_Chr5_+_152446_152446 | 1.57 |
AT5G01370.1
|
ACI1
|
ALC-interacting protein 1 |
| arTal_v1_Chr1_+_176141_176141 | 1.57 |
AT1G01480.2
|
ACS2
|
1-amino-cyclopropane-1-carboxylate synthase 2 |
| arTal_v1_Chr5_-_5146458_5146458 | 1.57 |
AT5G15780.1
|
AT5G15780
|
Pollen Ole e 1 allergen and extensin family protein |
| arTal_v1_Chr1_+_175706_175706 | 1.53 |
AT1G01480.1
|
ACS2
|
1-amino-cyclopropane-1-carboxylate synthase 2 |
| arTal_v1_Chr2_+_6399621_6399621 | 1.51 |
AT2G14890.2
|
AGP9
|
arabinogalactan protein 9 |
| arTal_v1_Chr5_-_25343369_25343369 | 1.50 |
AT5G63180.1
|
AT5G63180
|
Pectin lyase-like superfamily protein |
| arTal_v1_Chr2_-_15483706_15483788 | 1.50 |
AT2G36885.2
AT2G36885.1 |
AT2G36885
|
translation initiation factor |
| arTal_v1_Chr4_-_17979740_17979885 | 1.47 |
AT4G38400.1
AT4G38401.1 |
EXLA2
AT4G38401
|
expansin-like A2 hypothetical protein |
| arTal_v1_Chr5_-_3278461_3278461 | 1.47 |
AT5G10430.1
|
AGP4
|
arabinogalactan protein 4 |
| arTal_v1_Chr3_+_1258519_1258546 | 1.47 |
AT3G04630.2
AT3G04630.1 |
WDL1
|
WVD2-like 1 |
| arTal_v1_Chr4_-_1268612_1268612 | 1.46 |
AT4G02850.1
|
AT4G02850
|
phenazine biosynthesis PhzC/PhzF family protein |
| arTal_v1_Chr2_+_6399405_6399405 | 1.46 |
AT2G14890.1
|
AGP9
|
arabinogalactan protein 9 |
| arTal_v1_Chr2_+_15934244_15934244 | 1.45 |
AT2G38080.1
|
IRX12
|
Laccase/Diphenol oxidase family protein |
| arTal_v1_Chr5_+_4944816_4944816 | 1.44 |
AT5G15230.1
|
GASA4
|
GAST1 protein homolog 4 |
| arTal_v1_Chr2_-_15789605_15789605 | 1.43 |
AT2G37640.2
|
EXP3
|
Barwin-like endoglucanases superfamily protein |
| arTal_v1_Chr1_-_1043887_1043887 | 1.42 |
AT1G04040.1
|
AT1G04040
|
HAD superfamily, subfamily IIIB acid phosphatase |
| arTal_v1_Chr3_+_8550037_8550037 | 1.41 |
AT3G23730.1
|
XTH16
|
xyloglucan endotransglucosylase/hydrolase 16 |
| arTal_v1_Chr1_+_17918207_17918207 | 1.40 |
AT1G48480.1
|
RKL1
|
receptor-like kinase 1 |
| arTal_v1_Chr2_-_15790139_15790139 | 1.40 |
AT2G37640.1
|
EXP3
|
Barwin-like endoglucanases superfamily protein |
| arTal_v1_Chr3_-_3357754_3357754 | 1.40 |
AT3G10720.2
|
AT3G10720
|
Plant invertase/pectin methylesterase inhibitor superfamily |
| arTal_v1_Chr1_-_21614169_21614169 | 1.38 |
AT1G58270.1
|
ZW9
|
TRAF-like family protein |
| arTal_v1_Chr1_+_29446861_29446985 | 1.37 |
AT1G78260.1
AT1G78260.2 |
AT1G78260
|
RNA-binding (RRM/RBD/RNP motifs) family protein |
| arTal_v1_Chr4_+_14944129_14944129 | 1.37 |
AT4G30610.1
|
BRS1
|
alpha/beta-Hydrolases superfamily protein |
| arTal_v1_Chr4_+_10142255_10142255 | 1.36 |
AT4G18350.1
|
NCED2
|
nine-cis-epoxycarotenoid dioxygenase 2 |
| arTal_v1_Chr3_+_1258830_1258830 | 1.34 |
AT3G04630.3
|
WDL1
|
WVD2-like 1 |
| arTal_v1_Chr5_+_4945062_4945062 | 1.34 |
AT5G15230.2
|
GASA4
|
GAST1 protein homolog 4 |
| arTal_v1_Chr2_+_7209108_7209108 | 1.34 |
AT2G16630.1
|
AT2G16630
|
Pollen Ole e 1 allergen and extensin family protein |
| arTal_v1_Chr1_-_3518035_3518035 | 1.33 |
AT1G10640.1
|
AT1G10640
|
Pectin lyase-like superfamily protein |
| arTal_v1_Chr1_+_20614573_20614610 | 1.33 |
AT1G55260.1
AT1G55260.2 |
AT1G55260
|
Bifunctional inhibitor/lipid-transfer protein/seed storage 2S albumin superfamily protein |
| arTal_v1_Chr3_-_22972239_22972303 | 1.32 |
AT3G62020.2
AT3G62020.1 |
GLP10
|
germin-like protein 10 |
| arTal_v1_Chr2_+_14427509_14427893 | 1.31 |
AT2G34170.3
AT2G34170.2 AT2G34170.1 AT2G34170.4 AT2G34170.5 AT2G34170.6 |
AT2G34170
|
hypothetical protein (DUF688) |
| arTal_v1_Chr3_-_3356811_3356811 | 1.30 |
AT3G10720.1
|
AT3G10720
|
Plant invertase/pectin methylesterase inhibitor superfamily |
| arTal_v1_Chr2_+_12014412_12014412 | 1.29 |
AT2G28190.1
|
CSD2
|
copper/zinc superoxide dismutase 2 |
| arTal_v1_Chr5_-_14562863_14562863 | 1.29 |
AT5G36910.1
|
THI2.2
|
thionin 2.2 |
| arTal_v1_Chr5_+_1427117_1427117 | 1.27 |
AT5G04890.1
|
RTM2
|
HSP20-like chaperones superfamily protein |
| arTal_v1_Chr3_-_373805_373805 | 1.27 |
AT3G02110.1
|
scpl25
|
serine carboxypeptidase-like 25 |
| arTal_v1_Chr4_-_7353117_7353135 | 1.27 |
AT4G12420.1
AT4G12420.2 |
SKU5
|
Cupredoxin superfamily protein |
| arTal_v1_Chr5_-_990630_990630 | 1.27 |
AT5G03760.1
|
ATCSLA09
|
Nucleotide-diphospho-sugar transferases superfamily protein |
| arTal_v1_Chr1_-_28551836_28551836 | 1.27 |
AT1G76090.1
|
SMT3
|
sterol methyltransferase 3 |
| arTal_v1_Chr1_+_9067039_9067039 | 1.26 |
AT1G26210.1
|
SOFL1
|
SOB five-like 1 |
| arTal_v1_Chr3_+_23229381_23229381 | 1.26 |
AT3G62820.1
|
AT3G62820
|
Plant invertase/pectin methylesterase inhibitor superfamily protein |
| arTal_v1_Chr3_-_20576249_20576249 | 1.25 |
AT3G55500.1
|
EXPA16
|
expansin A16 |
| arTal_v1_Chr3_-_19595834_19595834 | 1.25 |
AT3G52870.1
|
AT3G52870
|
IQ calmodulin-binding motif family protein |
| arTal_v1_Chr4_-_10278794_10278794 | 1.24 |
AT4G18670.1
|
AT4G18670
|
Leucine-rich repeat (LRR) family protein |
| arTal_v1_Chr5_+_8151907_8151907 | 1.24 |
AT5G24105.1
|
AGP41
|
arabinogalactan protein 41 |
| arTal_v1_Chr5_+_19825078_19825078 | 1.23 |
AT5G48900.1
|
AT5G48900
|
Pectin lyase-like superfamily protein |
| arTal_v1_Chr3_-_4042075_4042075 | 1.23 |
AT3G12710.1
|
AT3G12710
|
DNA glycosylase superfamily protein |
| arTal_v1_Chr5_-_15461459_15461459 | 1.23 |
AT5G38610.1
|
AT5G38610
|
Plant invertase/pectin methylesterase inhibitor superfamily protein |
| arTal_v1_Chr4_-_7587099_7587099 | 1.23 |
AT4G12970.1
|
STOMAGEN
|
stomagen |
| arTal_v1_Chr1_+_10537648_10537648 | 1.22 |
AT1G30040.2
|
GA2OX2
|
gibberellin 2-oxidase |
| arTal_v1_Chr1_-_15607966_15607966 | 1.22 |
AT1G41830.1
|
SKS6
|
SKU5-similar 6 |
| arTal_v1_Chr2_-_15137012_15137012 | 1.21 |
AT2G36050.1
|
OFP15
|
ovate family protein 15 |
| arTal_v1_Chr5_+_22474142_22474142 | 1.21 |
AT5G55480.1
|
SVL1
|
SHV3-like 1 |
| arTal_v1_Chr5_+_24167996_24168072 | 1.21 |
AT5G60020.1
AT5G60020.2 |
LAC17
|
laccase 17 |
| arTal_v1_Chr3_-_2216483_2216483 | 1.21 |
AT3G07010.1
AT3G07010.2 |
AT3G07010
|
Pectin lyase-like superfamily protein |
| arTal_v1_Chr1_+_10375754_10375754 | 1.20 |
AT1G29670.1
|
AT1G29670
|
GDSL-like Lipase/Acylhydrolase superfamily protein |
| arTal_v1_Chr1_+_10375599_10375599 | 1.19 |
AT1G29670.2
|
AT1G29670
|
GDSL-like Lipase/Acylhydrolase superfamily protein |
| arTal_v1_Chr1_+_10537457_10537457 | 1.19 |
AT1G30040.1
|
GA2OX2
|
gibberellin 2-oxidase |
| arTal_v1_Chr2_+_14577083_14577083 | 1.19 |
AT2G34620.1
|
AT2G34620
|
Mitochondrial transcription termination factor family protein |
| arTal_v1_Chr3_-_6436046_6436046 | 1.19 |
AT3G18710.1
|
PUB29
|
plant U-box 29 |
| arTal_v1_Chr3_+_5471735_5471735 | 1.19 |
AT3G16150.1
|
ASPGB1
|
N-terminal nucleophile aminohydrolases (Ntn hydrolases) superfamily protein |
| arTal_v1_Chr5_+_7122800_7122800 | 1.19 |
AT5G20970.1
|
AT5G20970
|
HSP20-like chaperones superfamily protein |
| arTal_v1_Chr5_-_6112039_6112039 | 1.18 |
AT5G18430.1
|
AT5G18430
|
GDSL-like Lipase/Acylhydrolase superfamily protein |
| arTal_v1_Chr5_+_18945543_18945543 | 1.17 |
AT5G46690.2
AT5G46690.1 |
bHLH071
|
beta HLH protein 71 |
| arTal_v1_Chr1_+_418416_418416 | 1.17 |
AT1G02205.2
|
CER1
|
Fatty acid hydroxylase superfamily |
| arTal_v1_Chr4_+_17524461_17524461 | 1.17 |
AT4G37240.1
|
AT4G37240
|
HTH-type transcriptional regulator |
| arTal_v1_Chr2_-_12433796_12433796 | 1.17 |
AT2G28950.1
|
EXPA6
|
expansin A6 |
| arTal_v1_Chr2_+_17527167_17527167 | 1.17 |
AT2G41990.1
|
AT2G41990
|
late embryogenesis abundant protein |
| arTal_v1_Chr3_+_18046144_18046144 | 1.16 |
AT3G48720.1
|
DCF
|
HXXXD-type acyl-transferase family protein |
| arTal_v1_Chr5_-_24377206_24377206 | 1.16 |
AT5G60660.1
|
PIP2%3B4
|
plasma membrane intrinsic protein 2;4 |
| arTal_v1_Chr1_+_5795879_5795879 | 1.16 |
AT1G16950.1
|
AT1G16950
|
transmembrane protein |
| arTal_v1_Chr2_+_15335284_15335284 | 1.16 |
AT2G36570.1
|
AT2G36570
|
Leucine-rich repeat protein kinase family protein |
| arTal_v1_Chr1_-_29643535_29643535 | 1.15 |
AT1G78850.1
|
AT1G78850
|
D-mannose binding lectin protein with Apple-like carbohydrate-binding domain-containing protein |
| arTal_v1_Chr3_-_17288953_17289006 | 1.14 |
AT3G46940.1
AT3G46940.2 |
DUT1
|
DUTP-PYROPHOSPHATASE-LIKE 1 |
| arTal_v1_Chr3_+_19713799_19713799 | 1.13 |
AT3G53190.1
|
AT3G53190
|
Pectin lyase-like superfamily protein |
| arTal_v1_Chr2_-_15013368_15013368 | 1.13 |
AT2G35710.2
|
PGSIP7
|
Nucleotide-diphospho-sugar transferases superfamily protein |
| arTal_v1_Chr4_-_1026179_1026179 | 1.13 |
AT4G02320.1
|
AT4G02320
|
Plant invertase/pectin methylesterase inhibitor superfamily |
| arTal_v1_Chr3_-_10129937_10129937 | 1.13 |
AT3G27360.1
|
AT3G27360
|
Histone superfamily protein |
| arTal_v1_Chr5_+_20945676_20945676 | 1.12 |
AT5G51560.1
|
AT5G51560
|
Leucine-rich repeat protein kinase family protein |
| arTal_v1_Chr5_+_24707445_24707445 | 1.12 |
AT5G61440.2
AT5G61440.1 |
ACHT5
|
atypical CYS HIS rich thioredoxin 5 |
| arTal_v1_Chr2_-_7727404_7727503 | 1.12 |
AT2G17780.2
AT2G17780.4 AT2G17780.5 AT2G17780.8 AT2G17780.10 AT2G17780.9 AT2G17780.1 AT2G17780.6 AT2G17780.3 AT2G17780.7 |
MCA2
|
PLAC8 family protein |
| arTal_v1_Chr2_-_18082776_18082776 | 1.12 |
AT2G43590.1
|
AT2G43590
|
Chitinase family protein |
| arTal_v1_Chr1_-_24033600_24033674 | 1.11 |
AT1G64670.1
AT1G64670.3 AT1G64670.2 |
BDG1
|
alpha/beta-Hydrolases superfamily protein |
| arTal_v1_Chr2_+_14216771_14216771 | 1.11 |
AT2G33570.1
|
GALS1
|
glycosyltransferase family protein (DUF23) |
| arTal_v1_Chr2_+_7301334_7301334 | 1.11 |
AT2G16850.1
|
PIP2%3B8
|
plasma membrane intrinsic protein 2;8 |
| arTal_v1_Chr1_-_29647691_29647691 | 1.10 |
AT1G78860.1
|
AT1G78860
|
D-mannose binding lectin protein with Apple-like carbohydrate-binding domain-containing protein |
| arTal_v1_Chr3_+_23438396_23438396 | 1.10 |
AT3G63470.1
|
scpl40
|
serine carboxypeptidase-like 40 |
| arTal_v1_Chr5_-_21439133_21439133 | 1.10 |
AT5G52882.1
|
AT5G52882
|
P-loop containing nucleoside triphosphate hydrolases superfamily protein |
| arTal_v1_Chr4_-_9583290_9583290 | 1.09 |
AT4G17030.1
|
EXLB1
|
expansin-like B1 |
| arTal_v1_Chr5_-_26129547_26129547 | 1.09 |
AT5G65390.1
|
AGP7
|
arabinogalactan protein 7 |
| arTal_v1_Chr1_+_18290942_18290979 | 1.08 |
AT1G49430.1
AT1G49430.2 |
LACS2
|
long-chain acyl-CoA synthetase 2 |
| arTal_v1_Chr3_-_18883033_18883033 | 1.08 |
AT3G50800.1
|
AT3G50800
|
hypothetical protein |
| arTal_v1_Chr2_-_19617681_19617681 | 1.07 |
AT2G47930.1
|
AGP26
|
arabinogalactan protein 26 |
| arTal_v1_Chr2_+_15706285_15706285 | 1.07 |
AT2G37430.1
|
ZAT11
|
C2H2 and C2HC zinc fingers superfamily protein |
| arTal_v1_Chr4_-_16583075_16583075 | 1.07 |
AT4G34760.1
|
AT4G34760
|
SAUR-like auxin-responsive protein family |
| arTal_v1_Chr5_+_20130752_20130752 | 1.07 |
AT5G49600.1
|
AT5G49600
|
plant/protein (Protein of unknown function, DUF538) |
| arTal_v1_Chr5_-_2576814_2576819 | 1.06 |
AT5G08030.1
AT5G08030.2 |
GDPD6
|
PLC-like phosphodiesterases superfamily protein |
| arTal_v1_Chr1_-_6999839_6999839 | 1.06 |
AT1G20190.1
|
EXPA11
|
expansin 11 |
| arTal_v1_Chr3_-_2664834_2664888 | 1.06 |
AT3G08770.2
AT3G08770.1 |
LTP6
|
lipid transfer protein 6 |
| arTal_v1_Chr5_-_19939797_19939797 | 1.05 |
AT5G49170.1
|
AT5G49170
|
hypothetical protein |
| arTal_v1_Chr2_-_17040127_17040204 | 1.05 |
AT2G40820.2
AT2G40820.1 AT2G40820.3 AT2G40820.5 |
AT2G40820
|
stomatal closure actin-binding-like protein |
| arTal_v1_Chr5_+_26298728_26298728 | 1.04 |
AT5G65730.1
|
XTH6
|
xyloglucan endotransglucosylase/hydrolase 6 |
| arTal_v1_Chr4_+_16397995_16397995 | 1.03 |
AT4G34260.1
|
FUC95A
|
1,2-alpha-L-fucosidase |
| arTal_v1_Chr2_-_9699915_9699944 | 1.03 |
AT2G22795.3
AT2G22795.2 AT2G22795.1 |
AT2G22795
|
hypothetical protein |
| arTal_v1_Chr1_-_24023424_24023424 | 1.03 |
AT1G64640.1
|
ENODL8
|
early nodulin-like protein 8 |
| arTal_v1_Chr5_+_5038563_5038563 | 1.03 |
AT5G15530.1
|
BCCP2
|
biotin carboxyl carrier protein 2 |
| arTal_v1_Chr3_+_377025_377025 | 1.02 |
AT3G02120.1
|
AT3G02120
|
hydroxyproline-rich glycoprotein family protein |
| arTal_v1_Chr5_-_7047446_7047446 | 1.02 |
AT5G20820.1
|
AT5G20820
|
SAUR-like auxin-responsive protein family |
| arTal_v1_Chr5_+_16768935_16768935 | 1.01 |
AT5G41900.1
|
AT5G41900
|
alpha/beta-Hydrolases superfamily protein |
| arTal_v1_Chr4_+_8541879_8541879 | 1.01 |
AT4G14940.1
|
AO1
|
amine oxidase 1 |
| arTal_v1_Chr2_+_6830995_6830995 | 0.99 |
AT2G15680.1
|
CML30
|
Calcium-binding EF-hand family protein |
| arTal_v1_Chr1_-_24653998_24653998 | 0.98 |
AT1G66190.1
|
AT1G66190
|
hypothetical protein |
| arTal_v1_Chr2_-_18443405_18443405 | 0.97 |
AT2G44740.1
|
CYCP4%3B1
|
cyclin p4;1 |
| arTal_v1_Chr5_+_22893151_22893151 | 0.97 |
AT5G56540.1
|
AGP14
|
arabinogalactan protein 14 |
| arTal_v1_Chr5_+_880148_880148 | 0.97 |
AT5G03510.1
|
AT5G03510
|
C2H2-type zinc finger family protein |
| arTal_v1_Chr3_-_1970946_1970946 | 0.97 |
AT3G06435.2
|
AT3G06435
|
Expressed protein |
| arTal_v1_Chr1_+_6886867_6886867 | 0.97 |
AT1G19850.2
|
MP
|
Transcriptional factor B3 family protein / auxin-responsive factor AUX/IAA-like protein |
| arTal_v1_Chr1_+_6886669_6886669 | 0.97 |
AT1G19850.1
|
MP
|
Transcriptional factor B3 family protein / auxin-responsive factor AUX/IAA-like protein |
| arTal_v1_Chr1_+_20462940_20462940 | 0.96 |
AT1G54890.1
|
AT1G54890
|
Late embryogenesis abundant (LEA) protein-like protein |
| arTal_v1_Chr2_-_8525238_8525238 | 0.96 |
AT2G19780.1
|
AT2G19780
|
Leucine-rich repeat (LRR) family protein |
| arTal_v1_Chr2_+_2322215_2322222 | 0.96 |
AT2G05990.1
AT2G05990.2 |
MOD1
|
NAD(P)-binding Rossmann-fold superfamily protein |
| arTal_v1_Chr1_+_26647205_26647205 | 0.96 |
AT1G70680.1
|
AT1G70680
|
Caleosin-related family protein |
| arTal_v1_Chr3_-_2168960_2168960 | 0.96 |
AT3G06870.1
|
AT3G06870
|
proline-rich family protein |
| arTal_v1_Chr1_+_26647684_26647684 | 0.96 |
AT1G70680.2
|
AT1G70680
|
Caleosin-related family protein |
| arTal_v1_Chr4_+_160643_160643 | 0.95 |
AT4G00360.1
|
CYP86A2
|
cytochrome P450, family 86, subfamily A, polypeptide 2 |
| arTal_v1_Chr3_-_16448844_16448844 | 0.95 |
AT3G44990.1
|
XTH31
|
xyloglucan endo-transglycosylase-related 8 |
| arTal_v1_Chr1_-_6999523_6999523 | 0.95 |
AT1G20190.2
|
EXPA11
|
expansin 11 |
| arTal_v1_Chr1_+_26220190_26220190 | 0.94 |
AT1G69700.1
|
HVA22C
|
HVA22 homologue C |
| arTal_v1_Chr4_+_16708552_16708552 | 0.94 |
AT4G35100.2
|
PIP3
|
plasma membrane intrinsic protein 3 |
| arTal_v1_Chr4_+_16708361_16708361 | 0.94 |
AT4G35100.1
|
PIP3
|
plasma membrane intrinsic protein 3 |
| arTal_v1_Chr1_+_26964087_26964087 | 0.94 |
AT1G71695.1
|
AT1G71695
|
Peroxidase superfamily protein |
| arTal_v1_Chr1_+_26439556_26439556 | 0.94 |
AT1G70210.1
|
CYCD1%3B1
|
CYCLIN D1;1 |
| arTal_v1_Chr4_-_12772438_12772479 | 0.94 |
AT4G24780.1
AT4G24780.2 |
AT4G24780
|
Pectin lyase-like superfamily protein |
| arTal_v1_Chr4_+_7758275_7758275 | 0.93 |
AT4G13340.1
|
LRX3
|
Leucine-rich repeat (LRR) family protein |
| arTal_v1_Chr4_-_10309591_10309591 | 0.93 |
AT4G18760.1
|
RLP51
|
receptor like protein 51 |
| arTal_v1_Chr1_-_24771393_24771393 | 0.93 |
AT1G66400.1
|
CML23
|
calmodulin like 23 |
| arTal_v1_Chr4_+_9407611_9407611 | 0.93 |
AT4G16740.4
AT4G16740.3 AT4G16740.1 |
TPS03
|
terpene synthase 03 |
| arTal_v1_Chr4_-_14872267_14872267 | 0.93 |
AT4G30410.1
AT4G30410.2 |
AT4G30410
|
sequence-specific DNA binding transcription factor |
| arTal_v1_Chr3_-_2407634_2407634 | 0.93 |
AT3G07540.1
|
AT3G07540
|
Actin-binding FH2 (formin homology 2) family protein |
| arTal_v1_Chr1_-_4265156_4265156 | 0.93 |
AT1G12500.1
|
AT1G12500
|
Nucleotide-sugar transporter family protein |
| arTal_v1_Chr1_+_10887607_10887655 | 0.93 |
AT1G30690.2
AT1G30690.1 |
AT1G30690
|
Sec14p-like phosphatidylinositol transfer family protein |
| arTal_v1_Chr4_-_13460105_13460105 | 0.92 |
AT4G26690.1
|
SHV3
|
PLC-like phosphodiesterase family protein |
| arTal_v1_Chr5_-_4423095_4423095 | 0.91 |
AT5G13700.1
|
PAO1
|
polyamine oxidase 1 |
| arTal_v1_Chr2_-_8447355_8447355 | 0.91 |
AT2G19500.1
|
CKX2
|
cytokinin oxidase 2 |
| arTal_v1_Chr1_-_18439115_18439115 | 0.91 |
AT1G49800.1
|
AT1G49800
|
transmembrane protein |
| arTal_v1_Chr5_+_24168245_24168245 | 0.91 |
AT5G60020.3
|
LAC17
|
laccase 17 |
| arTal_v1_Chr3_-_6882235_6882315 | 0.90 |
AT3G19820.3
AT3G19820.1 AT3G19820.2 |
DWF1
|
cell elongation protein / DWARF1 / DIMINUTO (DIM) |
| arTal_v1_Chr1_+_16970214_16970240 | 0.90 |
AT1G44900.2
AT1G44900.1 |
MCM2
|
minichromosome maintenance (MCM2/3/5) family protein |
| arTal_v1_Chr1_-_8501542_8501542 | 0.90 |
AT1G24020.1
|
MLP423
|
MLP-like protein 423 |
| arTal_v1_Chr5_-_24661241_24661241 | 0.89 |
AT5G61330.1
AT5G61330.2 |
AT5G61330
|
rRNA processing protein-like protein |
| arTal_v1_Chr4_+_9407768_9407768 | 0.89 |
AT4G16740.2
|
TPS03
|
terpene synthase 03 |
| arTal_v1_Chr5_-_19404147_19404147 | 0.89 |
AT5G47920.1
|
AT5G47920
|
transcription elongation factor |
| arTal_v1_Chr3_+_3012094_3012094 | 0.89 |
AT3G09820.2
|
ADK1
|
adenosine kinase 1 |
| arTal_v1_Chr5_-_5072492_5072492 | 0.89 |
AT5G15580.1
|
LNG1
|
longifolia1 |
| arTal_v1_Chr3_+_6154363_6154363 | 0.89 |
AT3G18000.1
|
XPL1
|
S-adenosyl-L-methionine-dependent methyltransferases superfamily protein |
| arTal_v1_Chr1_+_17065858_17065858 | 0.89 |
AT1G45130.2
|
BGAL5
|
beta-galactosidase 5 |
| arTal_v1_Chr1_+_9351160_9351160 | 0.88 |
AT1G26945.1
|
KDR
|
basic helix-loop-helix (bHLH) DNA-binding superfamily protein |
| arTal_v1_Chr3_+_3011780_3011780 | 0.88 |
AT3G09820.1
|
ADK1
|
adenosine kinase 1 |
| arTal_v1_Chr5_-_20712386_20712473 | 0.88 |
AT5G50915.4
AT5G50915.2 AT5G50915.1 AT5G50915.3 |
AT5G50915
|
basic helix-loop-helix (bHLH) DNA-binding superfamily protein |
| arTal_v1_Chr4_-_17672353_17672353 | 0.88 |
AT4G37610.1
|
BT5
|
BTB and TAZ domain protein 5 |
| arTal_v1_Chr2_+_10072057_10072057 | 0.88 |
AT2G23690.1
|
AT2G23690
|
HTH-type transcriptional regulator |
| arTal_v1_Chr5_+_16127725_16127725 | 0.88 |
AT5G40330.1
|
MYB23
|
myb domain protein 23 |
| arTal_v1_Chr1_+_29413874_29413874 | 0.88 |
AT1G78170.1
|
AT1G78170
|
E3 ubiquitin-protein ligase |
| arTal_v1_Chr1_-_7958464_7958564 | 0.87 |
AT1G22530.2
AT1G22530.1 |
PATL2
|
PATELLIN 2 |
| arTal_v1_Chr3_-_8058764_8058782 | 0.87 |
AT3G22790.3
AT3G22790.2 |
NET1A
|
Kinase interacting (KIP1-like) family protein |
| arTal_v1_Chr4_+_14149849_14149880 | 0.87 |
AT4G28660.1
AT4G28660.2 |
PSB28
|
photosystem II reaction center PSB28 protein |
| arTal_v1_Chr5_+_20303334_20303334 | 0.87 |
AT5G49910.1
|
cpHsc70-2
|
chloroplast heat shock protein 70-2 |
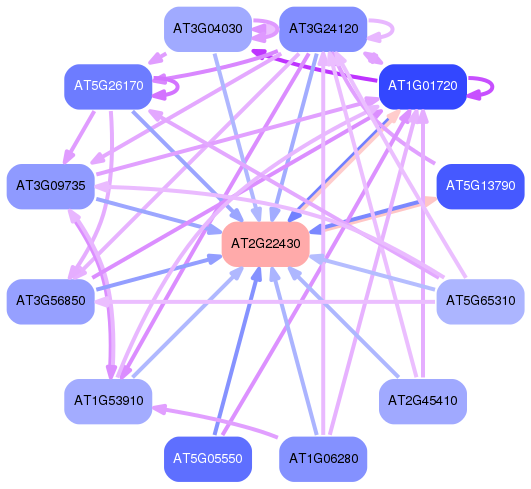
Network of associatons between targets according to the STRING database.

First level regulatory network of AT2G22430
Gene Ontology Analysis
Gene overrepresentation in biological process category:
| Log-likelihood per target | Total log-likelihood | Term | Description |
|---|---|---|---|
| 0.6 | 3.1 | GO:0042218 | 1-aminocyclopropane-1-carboxylate biosynthetic process(GO:0042218) |
| 0.6 | 3.5 | GO:0043447 | alkane biosynthetic process(GO:0043447) |
| 0.5 | 10.0 | GO:0006949 | syncytium formation(GO:0006949) |
| 0.5 | 1.6 | GO:0009996 | negative regulation of cell fate specification(GO:0009996) negative regulation of trichoblast fate specification(GO:0010062) negative regulation of plant epidermal cell differentiation(GO:1903889) |
| 0.5 | 2.0 | GO:0080094 | response to trehalose-6-phosphate(GO:0080094) |
| 0.5 | 1.5 | GO:0009830 | cell wall modification involved in abscission(GO:0009830) cell wall disassembly(GO:0044277) |
| 0.5 | 1.5 | GO:0010198 | synergid death(GO:0010198) |
| 0.5 | 3.3 | GO:0010067 | procambium histogenesis(GO:0010067) |
| 0.4 | 1.3 | GO:0071457 | cellular response to ozone(GO:0071457) |
| 0.4 | 1.7 | GO:1902315 | cell cycle DNA replication initiation(GO:1902292) nuclear cell cycle DNA replication initiation(GO:1902315) mitotic DNA replication initiation(GO:1902975) |
| 0.4 | 1.2 | GO:0006436 | tryptophanyl-tRNA aminoacylation(GO:0006436) |
| 0.4 | 1.2 | GO:0016540 | protein autoprocessing(GO:0016540) |
| 0.4 | 1.6 | GO:0070509 | calcium ion import(GO:0070509) |
| 0.4 | 1.9 | GO:0010226 | response to lithium ion(GO:0010226) |
| 0.4 | 2.3 | GO:0010444 | guard mother cell differentiation(GO:0010444) |
| 0.4 | 1.1 | GO:0009143 | nucleoside triphosphate catabolic process(GO:0009143) deoxyribonucleotide catabolic process(GO:0009264) |
| 0.4 | 2.9 | GO:0016103 | diterpenoid catabolic process(GO:0016103) gibberellin catabolic process(GO:0045487) |
| 0.4 | 1.1 | GO:0010045 | response to nickel cation(GO:0010045) |
| 0.4 | 0.7 | GO:0046938 | phytochelatin metabolic process(GO:0046937) phytochelatin biosynthetic process(GO:0046938) cellular response to cadmium ion(GO:0071276) cellular detoxification of cadmium ion(GO:0098849) |
| 0.3 | 1.4 | GO:0042759 | long-chain fatty acid biosynthetic process(GO:0042759) |
| 0.3 | 2.0 | GO:0090057 | root radial pattern formation(GO:0090057) |
| 0.3 | 4.4 | GO:0010052 | guard cell differentiation(GO:0010052) |
| 0.3 | 1.9 | GO:0009650 | UV protection(GO:0009650) |
| 0.3 | 1.3 | GO:0046741 | transport of virus in host, tissue to tissue(GO:0046741) |
| 0.3 | 0.9 | GO:0019695 | choline metabolic process(GO:0019695) |
| 0.3 | 0.9 | GO:0009233 | menaquinone metabolic process(GO:0009233) menaquinone biosynthetic process(GO:0009234) |
| 0.3 | 0.3 | GO:1902932 | positive regulation of alcohol biosynthetic process(GO:1902932) |
| 0.3 | 2.0 | GO:0010047 | fruit dehiscence(GO:0010047) |
| 0.3 | 0.8 | GO:0090058 | metaxylem development(GO:0090058) |
| 0.3 | 1.4 | GO:0006421 | asparaginyl-tRNA aminoacylation(GO:0006421) |
| 0.3 | 0.8 | GO:2000039 | regulation of trichome morphogenesis(GO:2000039) |
| 0.3 | 0.8 | GO:0046166 | glyceraldehyde-3-phosphate biosynthetic process(GO:0046166) |
| 0.3 | 1.6 | GO:0048629 | trichome patterning(GO:0048629) |
| 0.3 | 0.8 | GO:0035404 | histone-serine phosphorylation(GO:0035404) histone H3-S10 phosphorylation(GO:0043987) |
| 0.3 | 0.5 | GO:0002009 | establishment of planar polarity(GO:0001736) morphogenesis of a polarized epithelium(GO:0001738) morphogenesis of an epithelium(GO:0002009) tissue morphogenesis(GO:0048729) |
| 0.3 | 0.8 | GO:0019593 | hexitol metabolic process(GO:0006059) hexitol biosynthetic process(GO:0019406) mannitol biosynthetic process(GO:0019593) mannitol metabolic process(GO:0019594) |
| 0.2 | 1.5 | GO:0042547 | cell wall modification involved in multidimensional cell growth(GO:0042547) |
| 0.2 | 0.7 | GO:0045717 | negative regulation of fatty acid biosynthetic process(GO:0045717) |
| 0.2 | 0.2 | GO:0071493 | cellular response to UV-B(GO:0071493) |
| 0.2 | 1.5 | GO:0031507 | heterochromatin assembly(GO:0031507) |
| 0.2 | 0.9 | GO:0080003 | thalianol metabolic process(GO:0080003) |
| 0.2 | 0.7 | GO:0010597 | green leaf volatile biosynthetic process(GO:0010597) |
| 0.2 | 0.9 | GO:0015965 | diadenosine polyphosphate metabolic process(GO:0015959) diadenosine tetraphosphate metabolic process(GO:0015965) |
| 0.2 | 2.3 | GO:0009554 | megasporogenesis(GO:0009554) |
| 0.2 | 0.9 | GO:1903321 | negative regulation of protein modification by small protein conjugation or removal(GO:1903321) |
| 0.2 | 1.1 | GO:1904278 | regulation of wax biosynthetic process(GO:1904276) positive regulation of wax biosynthetic process(GO:1904278) |
| 0.2 | 1.5 | GO:0090059 | protoxylem development(GO:0090059) |
| 0.2 | 1.1 | GO:1902299 | pre-replicative complex assembly involved in nuclear cell cycle DNA replication(GO:0006267) pre-replicative complex assembly(GO:0036388) pre-replicative complex assembly involved in cell cycle DNA replication(GO:1902299) |
| 0.2 | 0.4 | GO:0071242 | cellular response to ammonium ion(GO:0071242) |
| 0.2 | 0.9 | GO:0097298 | regulation of nucleus size(GO:0097298) |
| 0.2 | 0.4 | GO:0045901 | positive regulation of protein complex disassembly(GO:0043243) positive regulation of translational elongation(GO:0045901) positive regulation of translational termination(GO:0045905) |
| 0.2 | 2.1 | GO:0009942 | longitudinal axis specification(GO:0009942) |
| 0.2 | 3.7 | GO:0042761 | very long-chain fatty acid biosynthetic process(GO:0042761) |
| 0.2 | 1.0 | GO:0010086 | embryonic root morphogenesis(GO:0010086) |
| 0.2 | 1.0 | GO:0071260 | cellular response to mechanical stimulus(GO:0071260) |
| 0.2 | 0.8 | GO:0034389 | lipid particle organization(GO:0034389) |
| 0.2 | 6.6 | GO:0010143 | cutin biosynthetic process(GO:0010143) |
| 0.2 | 0.2 | GO:0071732 | cellular response to nitric oxide(GO:0071732) |
| 0.2 | 1.9 | GO:0050879 | circumnutation(GO:0010031) multicellular organismal movement(GO:0050879) |
| 0.2 | 0.6 | GO:0010069 | zygote asymmetric cytokinesis in embryo sac(GO:0010069) |
| 0.2 | 3.2 | GO:0016998 | cell wall macromolecule catabolic process(GO:0016998) |
| 0.2 | 0.9 | GO:0019745 | pentacyclic triterpenoid metabolic process(GO:0019742) pentacyclic triterpenoid biosynthetic process(GO:0019745) |
| 0.2 | 0.9 | GO:0046208 | spermine catabolic process(GO:0046208) |
| 0.2 | 1.8 | GO:0030497 | fatty acid elongation(GO:0030497) |
| 0.2 | 14.8 | GO:0045490 | pectin catabolic process(GO:0045490) |
| 0.2 | 0.7 | GO:0010495 | long-distance posttranscriptional gene silencing(GO:0010495) |
| 0.2 | 1.4 | GO:0060774 | auxin mediated signaling pathway involved in phyllotactic patterning(GO:0060774) |
| 0.2 | 1.0 | GO:0000727 | double-strand break repair via break-induced replication(GO:0000727) |
| 0.2 | 0.5 | GO:0015696 | ammonium transport(GO:0015696) |
| 0.2 | 0.7 | GO:0071415 | cellular response to alkaloid(GO:0071312) cellular response to caffeine(GO:0071313) cellular response to purine-containing compound(GO:0071415) negative regulation of cellular response to caffeine(GO:1901181) |
| 0.2 | 0.5 | GO:0010220 | positive regulation of vernalization response(GO:0010220) |
| 0.2 | 0.8 | GO:0051319 | mitotic G1 phase(GO:0000080) mitotic S phase(GO:0000084) mitotic G2 phase(GO:0000085) G1 phase(GO:0051318) G2 phase(GO:0051319) S phase(GO:0051320) interphase(GO:0051325) mitotic interphase(GO:0051329) |
| 0.2 | 0.8 | GO:0002679 | respiratory burst involved in defense response(GO:0002679) respiratory burst(GO:0045730) |
| 0.2 | 0.7 | GO:0098609 | pollen tube adhesion(GO:0009865) cell-cell adhesion(GO:0098609) multi organism cell adhesion(GO:0098740) |
| 0.2 | 0.5 | GO:0006666 | 3-keto-sphinganine metabolic process(GO:0006666) |
| 0.2 | 1.8 | GO:0080086 | stamen filament development(GO:0080086) |
| 0.1 | 0.4 | GO:0036292 | DNA rewinding(GO:0036292) |
| 0.1 | 0.6 | GO:0042450 | arginine biosynthetic process via ornithine(GO:0042450) |
| 0.1 | 3.5 | GO:0009828 | plant-type cell wall loosening(GO:0009828) |
| 0.1 | 1.0 | GO:0090548 | response to nitrate starvation(GO:0090548) |
| 0.1 | 0.6 | GO:0042989 | sequestering of actin monomers(GO:0042989) |
| 0.1 | 0.4 | GO:0046156 | siroheme biosynthetic process(GO:0019354) siroheme metabolic process(GO:0046156) |
| 0.1 | 1.9 | GO:0010413 | glucuronoxylan metabolic process(GO:0010413) glucuronoxylan biosynthetic process(GO:0010417) |
| 0.1 | 0.4 | GO:0090227 | regulation of red or far-red light signaling pathway(GO:0090227) |
| 0.1 | 1.4 | GO:1903426 | regulation of reactive oxygen species biosynthetic process(GO:1903426) |
| 0.1 | 1.7 | GO:1901141 | regulation of lignin biosynthetic process(GO:1901141) |
| 0.1 | 0.7 | GO:0080175 | phragmoplast microtubule organization(GO:0080175) |
| 0.1 | 1.2 | GO:0051513 | regulation of monopolar cell growth(GO:0051513) |
| 0.1 | 0.4 | GO:0006768 | biotin metabolic process(GO:0006768) biotin biosynthetic process(GO:0009102) |
| 0.1 | 0.5 | GO:0000012 | single strand break repair(GO:0000012) |
| 0.1 | 0.5 | GO:0019427 | acetyl-CoA biosynthetic process from acetate(GO:0019427) |
| 0.1 | 0.8 | GO:0006013 | mannose metabolic process(GO:0006013) |
| 0.1 | 0.8 | GO:0009800 | cinnamic acid biosynthetic process(GO:0009800) |
| 0.1 | 0.3 | GO:2000036 | regulation of stem cell population maintenance(GO:2000036) regulation of stem cell differentiation(GO:2000736) |
| 0.1 | 0.9 | GO:0010018 | far-red light signaling pathway(GO:0010018) |
| 0.1 | 3.2 | GO:2000012 | regulation of auxin polar transport(GO:2000012) |
| 0.1 | 0.8 | GO:0006531 | aspartate metabolic process(GO:0006531) |
| 0.1 | 0.4 | GO:1901031 | regulation of response to reactive oxygen species(GO:1901031) |
| 0.1 | 0.6 | GO:0032309 | icosanoid secretion(GO:0032309) arachidonic acid secretion(GO:0050482) icosanoid transport(GO:0071715) fatty acid derivative transport(GO:1901571) arachidonate transport(GO:1903963) |
| 0.1 | 1.0 | GO:0045903 | positive regulation of translational fidelity(GO:0045903) |
| 0.1 | 0.5 | GO:0080170 | hydrogen peroxide transmembrane transport(GO:0080170) |
| 0.1 | 0.4 | GO:0010501 | RNA secondary structure unwinding(GO:0010501) |
| 0.1 | 3.8 | GO:0016106 | sesquiterpenoid biosynthetic process(GO:0016106) |
| 0.1 | 0.5 | GO:0080148 | negative regulation of response to water deprivation(GO:0080148) |
| 0.1 | 0.2 | GO:0019401 | alditol biosynthetic process(GO:0019401) |
| 0.1 | 0.6 | GO:0090116 | C-5 methylation of cytosine(GO:0090116) |
| 0.1 | 2.4 | GO:0042044 | water transport(GO:0006833) fluid transport(GO:0042044) |
| 0.1 | 0.6 | GO:0060151 | peroxisome localization(GO:0060151) |
| 0.1 | 0.6 | GO:2000037 | regulation of stomatal complex patterning(GO:2000037) |
| 0.1 | 0.7 | GO:0044211 | CTP salvage(GO:0044211) |
| 0.1 | 0.8 | GO:0046133 | pyrimidine ribonucleoside catabolic process(GO:0046133) pyrimidine nucleoside catabolic process(GO:0046135) |
| 0.1 | 0.3 | GO:0033567 | DNA replication, Okazaki fragment processing(GO:0033567) |
| 0.1 | 1.4 | GO:0032544 | plastid translation(GO:0032544) |
| 0.1 | 2.2 | GO:0071668 | cell wall assembly(GO:0070726) plant-type cell wall assembly(GO:0071668) |
| 0.1 | 0.3 | GO:0044236 | collagen metabolic process(GO:0032963) multicellular organism metabolic process(GO:0044236) multicellular organismal macromolecule metabolic process(GO:0044259) |
| 0.1 | 0.4 | GO:0009558 | embryo sac cellularization(GO:0009558) |
| 0.1 | 1.0 | GO:1902290 | positive regulation of defense response to oomycetes(GO:1902290) |
| 0.1 | 0.8 | GO:0010199 | organ boundary specification between lateral organs and the meristem(GO:0010199) |
| 0.1 | 1.2 | GO:1901348 | positive regulation of secondary cell wall biogenesis(GO:1901348) |
| 0.1 | 0.7 | GO:0046209 | nitric oxide metabolic process(GO:0046209) |
| 0.1 | 5.2 | GO:0019759 | S-glycoside catabolic process(GO:0016145) glycosinolate catabolic process(GO:0019759) glucosinolate catabolic process(GO:0019762) |
| 0.1 | 0.2 | GO:0046104 | deoxyribonucleoside metabolic process(GO:0009120) thymidine metabolic process(GO:0046104) pyrimidine deoxyribonucleoside metabolic process(GO:0046125) |
| 0.1 | 0.4 | GO:0050992 | dimethylallyl diphosphate biosynthetic process(GO:0050992) dimethylallyl diphosphate metabolic process(GO:0050993) |
| 0.1 | 0.6 | GO:0051571 | positive regulation of histone H3-K4 methylation(GO:0051571) |
| 0.1 | 4.7 | GO:0009809 | lignin biosynthetic process(GO:0009809) |
| 0.1 | 0.6 | GO:0046051 | UTP biosynthetic process(GO:0006228) UTP metabolic process(GO:0046051) |
| 0.1 | 0.4 | GO:0051754 | meiotic sister chromatid cohesion, centromeric(GO:0051754) |
| 0.1 | 0.4 | GO:0046168 | glycerol-3-phosphate catabolic process(GO:0046168) |
| 0.1 | 2.5 | GO:0099518 | vesicle transport along actin filament(GO:0030050) vesicle cytoskeletal trafficking(GO:0099518) |
| 0.1 | 0.7 | GO:1901465 | positive regulation of tetrapyrrole biosynthetic process(GO:1901465) |
| 0.1 | 1.1 | GO:0048579 | negative regulation of long-day photoperiodism, flowering(GO:0048579) |
| 0.1 | 0.7 | GO:0046464 | neutral lipid catabolic process(GO:0046461) acylglycerol catabolic process(GO:0046464) |
| 0.1 | 0.3 | GO:0090549 | response to carbon starvation(GO:0090549) |
| 0.1 | 0.4 | GO:0006556 | S-adenosylmethionine biosynthetic process(GO:0006556) |
| 0.1 | 0.8 | GO:0043410 | positive regulation of MAPK cascade(GO:0043410) |
| 0.1 | 1.6 | GO:0070413 | trehalose metabolism in response to stress(GO:0070413) |
| 0.1 | 0.9 | GO:0031936 | negative regulation of chromatin silencing(GO:0031936) |
| 0.1 | 1.7 | GO:0010082 | regulation of root meristem growth(GO:0010082) |
| 0.1 | 0.8 | GO:0033314 | mitotic DNA replication checkpoint(GO:0033314) |
| 0.1 | 1.4 | GO:0010492 | maintenance of shoot apical meristem identity(GO:0010492) |
| 0.1 | 0.4 | GO:0043433 | negative regulation of sequence-specific DNA binding transcription factor activity(GO:0043433) |
| 0.1 | 0.3 | GO:0010372 | positive regulation of gibberellin biosynthetic process(GO:0010372) |
| 0.1 | 4.2 | GO:0009690 | cytokinin metabolic process(GO:0009690) |
| 0.1 | 0.3 | GO:0006011 | UDP-glucose metabolic process(GO:0006011) |
| 0.1 | 0.4 | GO:0010032 | meiotic chromosome condensation(GO:0010032) |
| 0.1 | 0.3 | GO:0002164 | nematode larval development(GO:0002119) larval development(GO:0002164) regulation of nematode larval development(GO:0061062) |
| 0.1 | 0.3 | GO:0006430 | lysyl-tRNA aminoacylation(GO:0006430) |
| 0.1 | 0.6 | GO:0015837 | amine transport(GO:0015837) regulation of organic acid transport(GO:0032890) regulation of amine transport(GO:0051952) regulation of amino acid transport(GO:0051955) regulation of amino acid export(GO:0080143) |
| 0.1 | 0.9 | GO:0001709 | cell fate determination(GO:0001709) |
| 0.1 | 0.3 | GO:0019586 | uronic acid metabolic process(GO:0006063) galacturonate metabolic process(GO:0019586) |
| 0.1 | 1.1 | GO:0009299 | mRNA transcription(GO:0009299) |
| 0.1 | 0.5 | GO:0051214 | RNA virus induced gene silencing(GO:0051214) |
| 0.1 | 1.3 | GO:0006782 | protoporphyrinogen IX biosynthetic process(GO:0006782) protoporphyrinogen IX metabolic process(GO:0046501) |
| 0.1 | 0.7 | GO:0032922 | circadian regulation of gene expression(GO:0032922) |
| 0.1 | 1.0 | GO:0005987 | sucrose catabolic process(GO:0005987) |
| 0.1 | 0.5 | GO:0009957 | epidermal cell fate specification(GO:0009957) |
| 0.1 | 5.1 | GO:0007018 | microtubule-based movement(GO:0007018) |
| 0.1 | 0.3 | GO:1902457 | negative regulation of stomatal opening(GO:1902457) |
| 0.1 | 0.8 | GO:0010088 | phloem development(GO:0010088) |
| 0.1 | 0.3 | GO:0015675 | nickel cation transport(GO:0015675) |
| 0.1 | 0.4 | GO:0006788 | heme oxidation(GO:0006788) |
| 0.1 | 0.2 | GO:0006272 | leading strand elongation(GO:0006272) |
| 0.1 | 1.7 | GO:0008356 | asymmetric cell division(GO:0008356) |
| 0.1 | 0.8 | GO:2000904 | regulation of starch metabolic process(GO:2000904) |
| 0.1 | 0.2 | GO:0055089 | fatty acid homeostasis(GO:0055089) |
| 0.1 | 0.3 | GO:0016560 | protein import into peroxisome matrix, docking(GO:0016560) protein to membrane docking(GO:0022615) |
| 0.1 | 0.4 | GO:1990019 | protein storage vacuole organization(GO:1990019) |
| 0.1 | 0.2 | GO:0010451 | floral meristem growth(GO:0010451) |
| 0.1 | 0.3 | GO:0046475 | glycerophospholipid catabolic process(GO:0046475) |
| 0.1 | 1.5 | GO:0046785 | microtubule polymerization(GO:0046785) |
| 0.1 | 0.2 | GO:0010541 | acropetal auxin transport(GO:0010541) |
| 0.1 | 0.1 | GO:0045827 | negative regulation of isoprenoid metabolic process(GO:0045827) |
| 0.1 | 1.4 | GO:0009612 | response to mechanical stimulus(GO:0009612) |
| 0.1 | 1.0 | GO:0006353 | DNA-templated transcription, termination(GO:0006353) |
| 0.1 | 0.7 | GO:1904666 | regulation of ubiquitin protein ligase activity(GO:1904666) positive regulation of ubiquitin protein ligase activity(GO:1904668) |
| 0.1 | 6.5 | GO:0006633 | fatty acid biosynthetic process(GO:0006633) |
| 0.1 | 0.7 | GO:0051761 | sesquiterpene metabolic process(GO:0051761) |
| 0.1 | 0.5 | GO:0006526 | arginine biosynthetic process(GO:0006526) |
| 0.1 | 0.4 | GO:1900036 | positive regulation of cellular response to heat(GO:1900036) |
| 0.1 | 0.3 | GO:0006741 | NADP biosynthetic process(GO:0006741) |
| 0.1 | 0.6 | GO:1902223 | L-phenylalanine biosynthetic process(GO:0009094) erythrose 4-phosphate/phosphoenolpyruvate family amino acid biosynthetic process(GO:1902223) |
| 0.1 | 0.5 | GO:0016120 | carotene biosynthetic process(GO:0016120) |
| 0.1 | 0.3 | GO:0046068 | cGMP biosynthetic process(GO:0006182) cGMP metabolic process(GO:0046068) |
| 0.1 | 0.2 | GO:1903890 | atrichoblast differentiation(GO:0010055) positive regulation of trichoblast fate specification(GO:0010063) positive regulation of cell fate specification(GO:0042660) positive regulation of plant epidermal cell differentiation(GO:1903890) |
| 0.1 | 2.0 | GO:0016132 | phytosteroid biosynthetic process(GO:0016129) brassinosteroid biosynthetic process(GO:0016132) |
| 0.1 | 0.2 | GO:0035493 | SNARE complex assembly(GO:0035493) |
| 0.1 | 0.8 | GO:0010274 | hydrotropism(GO:0010274) |
| 0.1 | 0.3 | GO:0010390 | histone monoubiquitination(GO:0010390) |
| 0.1 | 1.0 | GO:2000033 | regulation of seed dormancy process(GO:2000033) |
| 0.1 | 0.2 | GO:0006428 | isoleucyl-tRNA aminoacylation(GO:0006428) |
| 0.1 | 0.2 | GO:0046505 | sulfolipid metabolic process(GO:0046505) sulfolipid biosynthetic process(GO:0046506) |
| 0.1 | 0.6 | GO:0042753 | positive regulation of circadian rhythm(GO:0042753) |
| 0.1 | 0.5 | GO:0006821 | chloride transport(GO:0006821) |
| 0.1 | 0.3 | GO:0048533 | sporocyte differentiation(GO:0048533) |
| 0.1 | 0.2 | GO:0050792 | regulation of viral process(GO:0050792) |
| 0.1 | 0.3 | GO:0010019 | chloroplast-nucleus signaling pathway(GO:0010019) |
| 0.1 | 0.1 | GO:2000757 | negative regulation of histone acetylation(GO:0035067) negative regulation of protein acetylation(GO:1901984) negative regulation of peptidyl-lysine acetylation(GO:2000757) |
| 0.1 | 0.2 | GO:0006435 | threonyl-tRNA aminoacylation(GO:0006435) |
| 0.1 | 1.2 | GO:0010227 | floral organ abscission(GO:0010227) |
| 0.1 | 0.4 | GO:0035434 | copper ion transmembrane transport(GO:0035434) |
| 0.1 | 0.3 | GO:0000710 | meiotic mismatch repair(GO:0000710) |
| 0.1 | 0.2 | GO:0031054 | pre-miRNA processing(GO:0031054) |
| 0.1 | 0.9 | GO:0046451 | lysine biosynthetic process(GO:0009085) lysine biosynthetic process via diaminopimelate(GO:0009089) diaminopimelate metabolic process(GO:0046451) |
| 0.1 | 0.4 | GO:2000762 | regulation of phenylpropanoid metabolic process(GO:2000762) |
| 0.1 | 0.1 | GO:0006598 | polyamine catabolic process(GO:0006598) |
| 0.1 | 0.4 | GO:0006048 | UDP-N-acetylglucosamine biosynthetic process(GO:0006048) |
| 0.1 | 0.1 | GO:0045604 | regulation of epithelial cell differentiation(GO:0030856) regulation of epidermal cell differentiation(GO:0045604) regulation of epidermis development(GO:0045682) |
| 0.1 | 0.2 | GO:0042939 | glutathione transport(GO:0034635) tripeptide transport(GO:0042939) |
| 0.1 | 0.7 | GO:0035336 | long-chain fatty-acyl-CoA metabolic process(GO:0035336) |
| 0.1 | 0.8 | GO:0015976 | carbon utilization(GO:0015976) |
| 0.1 | 1.6 | GO:0060284 | regulation of cell development(GO:0060284) |
| 0.1 | 0.4 | GO:0046368 | GDP-L-fucose biosynthetic process(GO:0042350) GDP-L-fucose metabolic process(GO:0046368) |
| 0.1 | 0.1 | GO:1904589 | regulation of protein import(GO:1904589) |
| 0.1 | 1.2 | GO:0042330 | chemotaxis(GO:0006935) pollen tube guidance(GO:0010183) taxis(GO:0042330) positive chemotaxis(GO:0050918) |
| 0.1 | 0.2 | GO:0010023 | proanthocyanidin biosynthetic process(GO:0010023) |
| 0.1 | 0.3 | GO:0030322 | stabilization of membrane potential(GO:0030322) |
| 0.1 | 0.1 | GO:0009915 | phloem sucrose loading(GO:0009915) |
| 0.0 | 0.2 | GO:1901703 | protein localization involved in auxin polar transport(GO:1901703) |
| 0.0 | 0.3 | GO:0032876 | negative regulation of DNA endoreduplication(GO:0032876) |
| 0.0 | 0.2 | GO:0001682 | tRNA 5'-leader removal(GO:0001682) |
| 0.0 | 0.3 | GO:0071585 | detoxification of cadmium ion(GO:0071585) |
| 0.0 | 0.4 | GO:0080165 | callose deposition in phloem sieve plate(GO:0080165) |
| 0.0 | 0.7 | GO:0006268 | DNA unwinding involved in DNA replication(GO:0006268) |
| 0.0 | 0.2 | GO:0010927 | pollen wall assembly(GO:0010208) cellular component assembly involved in morphogenesis(GO:0010927) extracellular matrix assembly(GO:0085029) |
| 0.0 | 0.4 | GO:0009870 | defense response signaling pathway, resistance gene-dependent(GO:0009870) |
| 0.0 | 0.2 | GO:1990481 | mRNA pseudouridine synthesis(GO:1990481) |
| 0.0 | 0.3 | GO:0034059 | response to anoxia(GO:0034059) |
| 0.0 | 0.6 | GO:0009113 | purine nucleobase biosynthetic process(GO:0009113) |
| 0.0 | 0.1 | GO:0010371 | regulation of gibberellin biosynthetic process(GO:0010371) |
| 0.0 | 2.0 | GO:0045489 | pectin biosynthetic process(GO:0045489) |
| 0.0 | 0.4 | GO:0015868 | purine ribonucleotide transport(GO:0015868) |
| 0.0 | 0.3 | GO:0009635 | response to herbicide(GO:0009635) |
| 0.0 | 0.2 | GO:0009647 | skotomorphogenesis(GO:0009647) |
| 0.0 | 1.0 | GO:0009904 | chloroplast accumulation movement(GO:0009904) |
| 0.0 | 0.2 | GO:1901332 | negative regulation of lateral root development(GO:1901332) |
| 0.0 | 0.2 | GO:0042436 | indole-containing compound catabolic process(GO:0042436) |
| 0.0 | 0.3 | GO:0007205 | protein kinase C-activating G-protein coupled receptor signaling pathway(GO:0007205) |
| 0.0 | 1.1 | GO:0046856 | phosphatidylinositol dephosphorylation(GO:0046856) |
| 0.0 | 0.2 | GO:1901527 | abscisic acid-activated signaling pathway involved in stomatal movement(GO:1901527) |
| 0.0 | 0.5 | GO:0051865 | protein autoubiquitination(GO:0051865) |
| 0.0 | 0.4 | GO:0010152 | pollen maturation(GO:0010152) |
| 0.0 | 0.9 | GO:0080022 | primary root development(GO:0080022) |
| 0.0 | 0.8 | GO:0009294 | genetic transfer(GO:0009292) DNA mediated transformation(GO:0009294) |
| 0.0 | 0.6 | GO:0048465 | petal development(GO:0048441) corolla development(GO:0048465) |
| 0.0 | 0.6 | GO:0019375 | galactolipid biosynthetic process(GO:0019375) |
| 0.0 | 0.2 | GO:0071486 | response to UV-A(GO:0070141) cellular response to high light intensity(GO:0071486) cellular response to UV-A(GO:0071492) |
| 0.0 | 0.3 | GO:0006021 | inositol biosynthetic process(GO:0006021) |
| 0.0 | 0.4 | GO:0048826 | cotyledon morphogenesis(GO:0048826) |
| 0.0 | 0.1 | GO:0010338 | leaf formation(GO:0010338) |
| 0.0 | 0.2 | GO:0071588 | hydrogen peroxide mediated signaling pathway(GO:0071588) |
| 0.0 | 0.4 | GO:1990937 | xylan acetylation(GO:1990937) |
| 0.0 | 0.3 | GO:0006349 | regulation of gene expression by genetic imprinting(GO:0006349) genetic imprinting(GO:0071514) |
| 0.0 | 0.4 | GO:0019287 | isopentenyl diphosphate biosynthetic process, mevalonate pathway(GO:0019287) |
| 0.0 | 0.3 | GO:0009934 | regulation of meristem structural organization(GO:0009934) |
| 0.0 | 1.9 | GO:0007131 | reciprocal meiotic recombination(GO:0007131) reciprocal DNA recombination(GO:0035825) |
| 0.0 | 3.4 | GO:0043086 | negative regulation of catalytic activity(GO:0043086) |
| 0.0 | 0.1 | GO:0030307 | positive regulation of cell growth(GO:0030307) |
| 0.0 | 0.3 | GO:0033619 | membrane protein proteolysis(GO:0033619) |
| 0.0 | 2.1 | GO:0048767 | root hair elongation(GO:0048767) |
| 0.0 | 3.2 | GO:0007015 | actin filament organization(GO:0007015) |
| 0.0 | 0.2 | GO:0015919 | peroxisomal membrane transport(GO:0015919) |
| 0.0 | 0.7 | GO:0009958 | positive gravitropism(GO:0009958) |
| 0.0 | 1.6 | GO:0072596 | protein targeting to chloroplast(GO:0045036) establishment of protein localization to chloroplast(GO:0072596) |
| 0.0 | 0.2 | GO:0009772 | photosynthetic electron transport in photosystem II(GO:0009772) |
| 0.0 | 0.0 | GO:0010254 | nectary development(GO:0010254) |
| 0.0 | 1.7 | GO:0007267 | cell-cell signaling(GO:0007267) |
| 0.0 | 0.1 | GO:0009747 | hexokinase-dependent signaling(GO:0009747) |
| 0.0 | 0.4 | GO:0010497 | plasmodesmata-mediated intercellular transport(GO:0010497) |
| 0.0 | 0.1 | GO:0009088 | threonine biosynthetic process(GO:0009088) |
| 0.0 | 0.4 | GO:0009901 | anther dehiscence(GO:0009901) |
| 0.0 | 0.5 | GO:0018126 | protein hydroxylation(GO:0018126) peptidyl-proline hydroxylation to 4-hydroxy-L-proline(GO:0018401) 4-hydroxyproline metabolic process(GO:0019471) peptidyl-proline hydroxylation(GO:0019511) |
| 0.0 | 0.4 | GO:0016554 | cytidine to uridine editing(GO:0016554) |
| 0.0 | 0.4 | GO:0097354 | protein prenylation(GO:0018342) prenylation(GO:0097354) |
| 0.0 | 0.1 | GO:0010231 | maintenance of seed dormancy(GO:0010231) maintenance of dormancy(GO:0097437) |
| 0.0 | 0.8 | GO:0006284 | base-excision repair(GO:0006284) |
| 0.0 | 0.3 | GO:1902183 | regulation of shoot apical meristem development(GO:1902183) |
| 0.0 | 0.4 | GO:0045492 | xylan biosynthetic process(GO:0045492) |
| 0.0 | 0.1 | GO:0030203 | aminoglycan biosynthetic process(GO:0006023) glycosaminoglycan biosynthetic process(GO:0006024) UDP-glucuronate biosynthetic process(GO:0006065) glycosaminoglycan metabolic process(GO:0030203) UDP-glucuronate metabolic process(GO:0046398) |
| 0.0 | 0.4 | GO:0009231 | riboflavin metabolic process(GO:0006771) riboflavin biosynthetic process(GO:0009231) |
| 0.0 | 0.6 | GO:0010584 | pollen exine formation(GO:0010584) |
| 0.0 | 0.4 | GO:0052803 | histidine biosynthetic process(GO:0000105) histidine metabolic process(GO:0006547) imidazole-containing compound metabolic process(GO:0052803) |
| 0.0 | 0.5 | GO:0030488 | tRNA methylation(GO:0030488) |
| 0.0 | 0.7 | GO:0051225 | spindle assembly(GO:0051225) |
| 0.0 | 0.3 | GO:0010206 | photosystem II repair(GO:0010206) |
| 0.0 | 0.3 | GO:0048658 | anther wall tapetum development(GO:0048658) |
| 0.0 | 0.1 | GO:0010098 | suspensor development(GO:0010098) |
| 0.0 | 0.8 | GO:0006094 | gluconeogenesis(GO:0006094) |
| 0.0 | 0.5 | GO:0000373 | Group II intron splicing(GO:0000373) |
| 0.0 | 0.4 | GO:0010075 | regulation of meristem growth(GO:0010075) |
| 0.0 | 0.1 | GO:0016123 | xanthophyll biosynthetic process(GO:0016123) |
| 0.0 | 0.2 | GO:0006308 | DNA catabolic process(GO:0006308) |
| 0.0 | 0.1 | GO:1904812 | rRNA acetylation involved in maturation of SSU-rRNA(GO:1904812) rRNA acetylation(GO:1990882) RNA acetylation(GO:1990884) |
| 0.0 | 0.1 | GO:0051510 | regulation of unidimensional cell growth(GO:0051510) |
| 0.0 | 0.2 | GO:0006032 | aminoglycan catabolic process(GO:0006026) chitin metabolic process(GO:0006030) chitin catabolic process(GO:0006032) amino sugar catabolic process(GO:0046348) glucosamine-containing compound catabolic process(GO:1901072) |
| 0.0 | 0.3 | GO:0045338 | farnesyl diphosphate metabolic process(GO:0045338) |
| 0.0 | 0.2 | GO:1905177 | tracheary element differentiation(GO:1905177) |
| 0.0 | 0.2 | GO:0043171 | peptide catabolic process(GO:0043171) |
| 0.0 | 0.1 | GO:0070982 | L-asparagine biosynthetic process(GO:0070981) L-asparagine metabolic process(GO:0070982) |
| 0.0 | 0.6 | GO:0048825 | cotyledon development(GO:0048825) |
| 0.0 | 0.4 | GO:0009685 | gibberellin metabolic process(GO:0009685) |
| 0.0 | 0.1 | GO:0090506 | axillary shoot meristem initiation(GO:0090506) |
| 0.0 | 0.1 | GO:0033499 | galactose catabolic process(GO:0019388) galactose catabolic process via UDP-galactose(GO:0033499) |
| 0.0 | 0.3 | GO:0009423 | chorismate biosynthetic process(GO:0009423) |
| 0.0 | 0.1 | GO:0042138 | meiotic DNA double-strand break formation(GO:0042138) |
| 0.0 | 0.1 | GO:0019408 | dolichol biosynthetic process(GO:0019408) |
| 0.0 | 0.1 | GO:0010449 | root meristem growth(GO:0010449) |
| 0.0 | 0.1 | GO:0090646 | mitochondrial tRNA processing(GO:0090646) |
| 0.0 | 0.1 | GO:0006106 | fumarate metabolic process(GO:0006106) |
| 0.0 | 0.5 | GO:0050826 | response to freezing(GO:0050826) |
| 0.0 | 0.4 | GO:0005991 | trehalose metabolic process(GO:0005991) |
| 0.0 | 0.2 | GO:0097577 | intracellular sequestering of iron ion(GO:0006880) sequestering of iron ion(GO:0097577) |
| 0.0 | 0.7 | GO:0010027 | plastid membrane organization(GO:0009668) thylakoid membrane organization(GO:0010027) |
| 0.0 | 0.9 | GO:0006418 | tRNA aminoacylation for protein translation(GO:0006418) |
| 0.0 | 0.5 | GO:0009959 | negative gravitropism(GO:0009959) |
| 0.0 | 0.5 | GO:0031497 | nucleosome assembly(GO:0006334) chromatin assembly(GO:0031497) |
| 0.0 | 0.1 | GO:1902884 | positive regulation of response to oxidative stress(GO:1902884) |
| 0.0 | 0.3 | GO:0051553 | flavone biosynthetic process(GO:0051553) flavonol biosynthetic process(GO:0051555) |
| 0.0 | 0.1 | GO:0071786 | endoplasmic reticulum tubular network organization(GO:0071786) |
| 0.0 | 0.2 | GO:0046294 | formaldehyde catabolic process(GO:0046294) |
| 0.0 | 0.1 | GO:0000055 | ribosomal large subunit export from nucleus(GO:0000055) |
| 0.0 | 0.1 | GO:0046835 | carbohydrate phosphorylation(GO:0046835) |
| 0.0 | 0.3 | GO:0031425 | chloroplast RNA processing(GO:0031425) |
| 0.0 | 0.1 | GO:0001560 | regulation of cell growth by extracellular stimulus(GO:0001560) |
| 0.0 | 0.5 | GO:0009718 | anthocyanin-containing compound biosynthetic process(GO:0009718) |
| 0.0 | 0.4 | GO:0071577 | zinc II ion transmembrane transport(GO:0071577) |
| 0.0 | 0.4 | GO:0043572 | chloroplast fission(GO:0010020) plastid fission(GO:0043572) |
| 0.0 | 0.2 | GO:0009750 | response to fructose(GO:0009750) |
| 0.0 | 0.1 | GO:0010216 | maintenance of DNA methylation(GO:0010216) |
| 0.0 | 0.1 | GO:0002943 | tRNA dihydrouridine synthesis(GO:0002943) |
| 0.0 | 0.2 | GO:0051568 | histone H3-K4 methylation(GO:0051568) |
| 0.0 | 0.4 | GO:0080155 | regulation of fertilization(GO:0080154) regulation of double fertilization forming a zygote and endosperm(GO:0080155) |
| 0.0 | 0.2 | GO:0010037 | response to carbon dioxide(GO:0010037) |
| 0.0 | 0.1 | GO:0006283 | transcription-coupled nucleotide-excision repair(GO:0006283) |
| 0.0 | 0.5 | GO:0005985 | sucrose metabolic process(GO:0005985) |
| 0.0 | 0.7 | GO:0032506 | cytokinesis by cell plate formation(GO:0000911) cytokinetic process(GO:0032506) mitotic cytokinetic process(GO:1902410) |
| 0.0 | 0.3 | GO:0010089 | xylem development(GO:0010089) |
| 0.0 | 0.2 | GO:0006616 | SRP-dependent cotranslational protein targeting to membrane, translocation(GO:0006616) |
| 0.0 | 0.2 | GO:0060321 | acceptance of pollen(GO:0060321) |
| 0.0 | 0.3 | GO:0006108 | malate metabolic process(GO:0006108) |
| 0.0 | 0.2 | GO:0044030 | regulation of DNA methylation(GO:0044030) |
| 0.0 | 0.4 | GO:0043622 | cortical microtubule organization(GO:0043622) |
| 0.0 | 0.1 | GO:0007043 | cell-cell junction assembly(GO:0007043) |
| 0.0 | 0.2 | GO:0010048 | vernalization response(GO:0010048) |
| 0.0 | 1.6 | GO:0042546 | cell wall biogenesis(GO:0042546) |
| 0.0 | 0.4 | GO:0009646 | response to absence of light(GO:0009646) |
| 0.0 | 0.2 | GO:0010305 | leaf vascular tissue pattern formation(GO:0010305) |
| 0.0 | 0.2 | GO:0010187 | negative regulation of seed germination(GO:0010187) |
| 0.0 | 0.5 | GO:0006099 | tricarboxylic acid cycle(GO:0006099) citrate metabolic process(GO:0006101) |
| 0.0 | 0.2 | GO:0019432 | triglyceride biosynthetic process(GO:0019432) |
| 0.0 | 0.1 | GO:0048564 | photosystem I assembly(GO:0048564) |
| 0.0 | 0.2 | GO:1901259 | chloroplast rRNA processing(GO:1901259) |
| 0.0 | 0.1 | GO:0046341 | CDP-diacylglycerol biosynthetic process(GO:0016024) CDP-diacylglycerol metabolic process(GO:0046341) |
| 0.0 | 0.0 | GO:0006493 | protein O-linked glycosylation(GO:0006493) |
| 0.0 | 0.1 | GO:0010103 | stomatal complex morphogenesis(GO:0010103) |
| 0.0 | 0.5 | GO:0006887 | exocytosis(GO:0006887) |
| 0.0 | 0.3 | GO:0016575 | histone deacetylation(GO:0016575) |
| 0.0 | 0.1 | GO:0042549 | photosystem II stabilization(GO:0042549) |
Gene overrepresentation in cellular component category:
| Log-likelihood per target | Total log-likelihood | Term | Description |
|---|---|---|---|
| 0.3 | 1.0 | GO:0009317 | acetyl-CoA carboxylase complex(GO:0009317) |
| 0.3 | 0.8 | GO:0070382 | exocytic vesicle(GO:0070382) |
| 0.2 | 2.4 | GO:0042555 | MCM complex(GO:0042555) |
| 0.2 | 0.8 | GO:0032133 | chromosome passenger complex(GO:0032133) |
| 0.2 | 0.8 | GO:0008622 | epsilon DNA polymerase complex(GO:0008622) |
| 0.2 | 0.5 | GO:0034703 | ion channel complex(GO:0034702) cation channel complex(GO:0034703) |
| 0.2 | 1.2 | GO:0005854 | nascent polypeptide-associated complex(GO:0005854) |
| 0.2 | 0.5 | GO:0031390 | Ctf18 RFC-like complex(GO:0031390) |
| 0.2 | 2.7 | GO:0009531 | secondary cell wall(GO:0009531) |
| 0.2 | 0.5 | GO:0005652 | nuclear lamina(GO:0005652) |
| 0.1 | 0.7 | GO:0033597 | mitotic checkpoint complex(GO:0033597) |
| 0.1 | 0.7 | GO:0048476 | Holliday junction resolvase complex(GO:0048476) |
| 0.1 | 0.4 | GO:0005658 | alpha DNA polymerase:primase complex(GO:0005658) |
| 0.1 | 0.4 | GO:0043668 | pollen wall(GO:0043667) exine(GO:0043668) sexine(GO:0043673) columella(GO:0043674) |
| 0.1 | 0.6 | GO:0000796 | condensin complex(GO:0000796) |
| 0.1 | 0.6 | GO:0071818 | BAT3 complex(GO:0071818) |
| 0.1 | 1.0 | GO:0005850 | eukaryotic translation initiation factor 2 complex(GO:0005850) |
| 0.1 | 0.5 | GO:0009360 | DNA polymerase III complex(GO:0009360) |
| 0.1 | 0.5 | GO:0009346 | citrate lyase complex(GO:0009346) |
| 0.1 | 1.4 | GO:0009986 | cell surface(GO:0009986) |
| 0.1 | 0.7 | GO:0070531 | BRCA1-A complex(GO:0070531) |
| 0.1 | 1.5 | GO:0035838 | growing cell tip(GO:0035838) cell tip(GO:0051286) pollen tube tip(GO:0090404) |
| 0.1 | 1.5 | GO:0016324 | apical plasma membrane(GO:0016324) |
| 0.1 | 0.4 | GO:0046695 | SLIK (SAGA-like) complex(GO:0046695) |
| 0.1 | 21.7 | GO:0031225 | anchored component of membrane(GO:0031225) |
| 0.1 | 1.8 | GO:0005871 | kinesin complex(GO:0005871) |
| 0.1 | 0.6 | GO:0009538 | photosystem I reaction center(GO:0009538) |
| 0.1 | 0.2 | GO:0031012 | extracellular matrix(GO:0031012) |
| 0.1 | 0.2 | GO:0035371 | microtubule plus-end(GO:0035371) |
| 0.1 | 0.7 | GO:0031209 | SCAR complex(GO:0031209) |
| 0.1 | 1.2 | GO:0005875 | microtubule associated complex(GO:0005875) |
| 0.1 | 0.2 | GO:0005853 | eukaryotic translation elongation factor 1 complex(GO:0005853) |
| 0.1 | 0.3 | GO:0009331 | glycerol-3-phosphate dehydrogenase complex(GO:0009331) |
| 0.1 | 0.2 | GO:0033281 | TAT protein transport complex(GO:0033281) |
| 0.1 | 0.5 | GO:0000312 | plastid small ribosomal subunit(GO:0000312) |
| 0.1 | 0.4 | GO:0044613 | nuclear pore central transport channel(GO:0044613) |
| 0.1 | 0.2 | GO:0009925 | basal plasma membrane(GO:0009925) basolateral plasma membrane(GO:0016323) basal part of cell(GO:0045178) |
| 0.1 | 0.3 | GO:0031907 | peroxisomal matrix(GO:0005782) microbody lumen(GO:0031907) |
| 0.1 | 1.2 | GO:0009508 | cytoplasmic chromosome(GO:0000229) plastid chromosome(GO:0009508) |
| 0.1 | 0.2 | GO:0032044 | DSIF complex(GO:0032044) |
| 0.1 | 2.5 | GO:0090406 | pollen tube(GO:0090406) |
| 0.1 | 0.3 | GO:0045298 | tubulin complex(GO:0045298) |
| 0.1 | 16.3 | GO:0048046 | apoplast(GO:0048046) |
| 0.1 | 0.9 | GO:0016459 | myosin complex(GO:0016459) |
| 0.1 | 0.2 | GO:0010316 | pyrophosphate-dependent phosphofructokinase complex(GO:0010316) |
| 0.1 | 1.1 | GO:0009654 | photosystem II oxygen evolving complex(GO:0009654) |
| 0.1 | 0.4 | GO:0000778 | condensed nuclear chromosome kinetochore(GO:0000778) |
| 0.1 | 0.3 | GO:0000922 | spindle pole(GO:0000922) |
| 0.0 | 0.2 | GO:0005719 | nuclear euchromatin(GO:0005719) |
| 0.0 | 7.9 | GO:0009505 | plant-type cell wall(GO:0009505) |
| 0.0 | 0.4 | GO:0000275 | mitochondrial proton-transporting ATP synthase complex, catalytic core F(1)(GO:0000275) |
| 0.0 | 1.4 | GO:0055028 | cortical microtubule(GO:0055028) |
| 0.0 | 0.4 | GO:0017119 | Golgi transport complex(GO:0017119) |
| 0.0 | 3.2 | GO:0005874 | microtubule(GO:0005874) |
| 0.0 | 1.5 | GO:0071010 | U2-type prespliceosome(GO:0071004) prespliceosome(GO:0071010) |
| 0.0 | 0.2 | GO:0070652 | HAUS complex(GO:0070652) |
| 0.0 | 0.2 | GO:0005851 | eukaryotic translation initiation factor 2B complex(GO:0005851) |
| 0.0 | 0.4 | GO:0071014 | post-mRNA release spliceosomal complex(GO:0071014) |
| 0.0 | 0.2 | GO:0044545 | NSL complex(GO:0044545) |
| 0.0 | 0.6 | GO:0005791 | rough endoplasmic reticulum(GO:0005791) |
| 0.0 | 0.5 | GO:0034399 | nuclear periphery(GO:0034399) |
| 0.0 | 0.3 | GO:0005968 | Rab-protein geranylgeranyltransferase complex(GO:0005968) |
| 0.0 | 0.3 | GO:0071556 | integral component of lumenal side of endoplasmic reticulum membrane(GO:0071556) lumenal side of endoplasmic reticulum membrane(GO:0098553) lumenal side of membrane(GO:0098576) |
| 0.0 | 0.6 | GO:0044815 | DNA packaging complex(GO:0044815) |
| 0.0 | 0.3 | GO:0005677 | chromatin silencing complex(GO:0005677) |
| 0.0 | 0.1 | GO:0032299 | ribonuclease H2 complex(GO:0032299) |
| 0.0 | 0.8 | GO:0012511 | monolayer-surrounded lipid storage body(GO:0012511) |
| 0.0 | 2.1 | GO:0015629 | actin cytoskeleton(GO:0015629) |
| 0.0 | 0.4 | GO:0033178 | proton-transporting two-sector ATPase complex, catalytic domain(GO:0033178) |
| 0.0 | 0.0 | GO:0030981 | cortical microtubule cytoskeleton(GO:0030981) |
| 0.0 | 0.5 | GO:0005769 | early endosome(GO:0005769) |
| 0.0 | 0.1 | GO:0000811 | GINS complex(GO:0000811) |
| 0.0 | 0.2 | GO:0038201 | TORC1 complex(GO:0031931) TOR complex(GO:0038201) |
| 0.0 | 63.9 | GO:0005576 | extracellular region(GO:0005576) |
| 0.0 | 0.1 | GO:0000791 | euchromatin(GO:0000791) |
| 0.0 | 0.8 | GO:0000152 | nuclear ubiquitin ligase complex(GO:0000152) |
| 0.0 | 0.6 | GO:0000118 | histone deacetylase complex(GO:0000118) |
| 0.0 | 0.4 | GO:0000145 | exocyst(GO:0000145) |
| 0.0 | 0.1 | GO:0035145 | exon-exon junction complex(GO:0035145) |
| 0.0 | 0.6 | GO:0005811 | lipid particle(GO:0005811) |
| 0.0 | 0.1 | GO:0009840 | chloroplastic endopeptidase Clp complex(GO:0009840) |
| 0.0 | 0.3 | GO:0009574 | preprophase band(GO:0009574) |
| 0.0 | 0.0 | GO:0000015 | phosphopyruvate hydratase complex(GO:0000015) |
| 0.0 | 0.1 | GO:0071458 | integral component of cytoplasmic side of endoplasmic reticulum membrane(GO:0071458) cytoplasmic side of endoplasmic reticulum membrane(GO:0098554) |
| 0.0 | 0.2 | GO:0005742 | mitochondrial outer membrane translocase complex(GO:0005742) |
| 0.0 | 0.1 | GO:0030663 | COPI vesicle coat(GO:0030126) COPI-coated vesicle membrane(GO:0030663) |
| 0.0 | 0.5 | GO:0005643 | nuclear pore(GO:0005643) |
| 0.0 | 7.9 | GO:0009532 | plastid stroma(GO:0009532) |
| 0.0 | 0.1 | GO:0031380 | RNA-directed RNA polymerase complex(GO:0031379) nuclear RNA-directed RNA polymerase complex(GO:0031380) |
Gene overrepresentation in molecular function category:
| Log-likelihood per target | Total log-likelihood | Term | Description |
|---|---|---|---|
| 1.1 | 3.2 | GO:0009924 | octadecanal decarbonylase activity(GO:0009924) aldehyde decarbonylase activity(GO:0071771) aldehyde oxygenase (deformylating) activity(GO:1990465) |
| 0.6 | 1.9 | GO:0003838 | sterol 24-C-methyltransferase activity(GO:0003838) |
| 0.5 | 4.2 | GO:0019137 | thioglucosidase activity(GO:0019137) |
| 0.5 | 1.8 | GO:0052578 | alpha-farnesene synthase activity(GO:0052578) |
| 0.4 | 2.9 | GO:1990137 | plant seed peroxidase activity(GO:1990137) |
| 0.4 | 1.2 | GO:0004830 | tryptophan-tRNA ligase activity(GO:0004830) |
| 0.4 | 2.0 | GO:0004001 | adenosine kinase activity(GO:0004001) |
| 0.4 | 9.6 | GO:0016837 | carbon-oxygen lyase activity, acting on polysaccharides(GO:0016837) pectate lyase activity(GO:0030570) |
| 0.4 | 1.5 | GO:0070330 | oxidoreductase activity, acting on paired donors, with incorporation or reduction of molecular oxygen, reduced flavin or flavoprotein as one donor, and incorporation of one atom of oxygen(GO:0016712) aromatase activity(GO:0070330) |
| 0.3 | 1.0 | GO:0015928 | alpha-L-fucosidase activity(GO:0004560) fucosidase activity(GO:0015928) |
| 0.3 | 1.0 | GO:0009374 | biotin binding(GO:0009374) |
| 0.3 | 4.9 | GO:0004312 | fatty acid synthase activity(GO:0004312) |
| 0.3 | 2.6 | GO:0090447 | glycerol-3-phosphate 2-O-acyltransferase activity(GO:0090447) |
| 0.3 | 2.6 | GO:0052634 | gibberellin 2-beta-dioxygenase activity(GO:0045543) C-19 gibberellin 2-beta-dioxygenase activity(GO:0052634) |
| 0.3 | 1.0 | GO:0008798 | beta-aspartyl-peptidase activity(GO:0008798) |
| 0.3 | 0.9 | GO:0052901 | spermine:oxygen oxidoreductase (spermidine-forming) activity(GO:0052901) |
| 0.3 | 0.9 | GO:0000234 | phosphoethanolamine N-methyltransferase activity(GO:0000234) |
| 0.3 | 1.2 | GO:0050734 | hydroxycinnamoyltransferase activity(GO:0050734) |
| 0.3 | 2.3 | GO:0017116 | ATP-dependent DNA helicase activity(GO:0004003) ATP-dependent helicase activity(GO:0008026) single-stranded DNA-dependent ATP-dependent DNA helicase activity(GO:0017116) single-stranded DNA-dependent ATPase activity(GO:0043142) purine NTP-dependent helicase activity(GO:0070035) |
| 0.3 | 3.1 | GO:0016847 | 1-aminocyclopropane-1-carboxylate synthase activity(GO:0016847) |
| 0.3 | 1.4 | GO:0004816 | asparagine-tRNA ligase activity(GO:0004816) |
| 0.3 | 0.8 | GO:0004807 | triose-phosphate isomerase activity(GO:0004807) |
| 0.3 | 1.9 | GO:0004611 | phosphoenolpyruvate carboxykinase activity(GO:0004611) |
| 0.3 | 3.1 | GO:0047259 | glucomannan 4-beta-mannosyltransferase activity(GO:0047259) |
| 0.3 | 0.8 | GO:0016726 | oxidoreductase activity, acting on CH or CH2 groups, NAD or NADP as acceptor(GO:0016726) |
| 0.3 | 0.5 | GO:0008519 | ammonium transmembrane transporter activity(GO:0008519) |
| 0.3 | 1.0 | GO:0052596 | tryptamine:oxygen oxidoreductase (deaminating) activity(GO:0052593) aminoacetone:oxygen oxidoreductase(deaminating) activity(GO:0052594) aliphatic-amine oxidase activity(GO:0052595) phenethylamine:oxygen oxidoreductase (deaminating) activity(GO:0052596) |
| 0.2 | 3.5 | GO:0008889 | glycerophosphodiester phosphodiesterase activity(GO:0008889) |
| 0.2 | 0.9 | GO:0009885 | transmembrane receptor histidine kinase activity(GO:0009784) transmembrane histidine kinase cytokinin receptor activity(GO:0009885) |
| 0.2 | 1.6 | GO:0045549 | 9-cis-epoxycarotenoid dioxygenase activity(GO:0045549) |
| 0.2 | 1.1 | GO:0031957 | very long-chain fatty acid-CoA ligase activity(GO:0031957) |
| 0.2 | 1.1 | GO:0003785 | actin monomer binding(GO:0003785) |
| 0.2 | 0.6 | GO:0004044 | amidophosphoribosyltransferase activity(GO:0004044) |
| 0.2 | 4.7 | GO:0052716 | hydroquinone:oxygen oxidoreductase activity(GO:0052716) |
| 0.2 | 0.6 | GO:0045485 | omega-6 fatty acid desaturase activity(GO:0045485) |
| 0.2 | 0.8 | GO:0045548 | phenylalanine ammonia-lyase activity(GO:0045548) |
| 0.2 | 0.8 | GO:0035174 | histone serine kinase activity(GO:0035174) histone kinase activity (H3-S10 specific)(GO:0035175) |
| 0.2 | 1.0 | GO:0008131 | primary amine oxidase activity(GO:0008131) |
| 0.2 | 1.3 | GO:0046030 | inositol trisphosphate phosphatase activity(GO:0046030) |
| 0.2 | 0.2 | GO:0016314 | phosphatidylinositol-3,4,5-trisphosphate 3-phosphatase activity(GO:0016314) |
| 0.2 | 4.0 | GO:0005372 | water transmembrane transporter activity(GO:0005372) water channel activity(GO:0015250) |
| 0.2 | 0.9 | GO:0034432 | bis(5'-adenosyl)-pentaphosphatase activity(GO:0034432) |
| 0.2 | 0.6 | GO:0008839 | 4-hydroxy-tetrahydrodipicolinate reductase(GO:0008839) |
| 0.2 | 1.9 | GO:0008199 | ferric iron binding(GO:0008199) |
| 0.2 | 1.2 | GO:1990538 | xylan O-acetyltransferase activity(GO:1990538) |
| 0.2 | 1.0 | GO:0050062 | long-chain-fatty-acyl-CoA reductase activity(GO:0050062) |
| 0.2 | 0.8 | GO:0046509 | 1,2-diacylglycerol 3-beta-galactosyltransferase activity(GO:0046509) |
| 0.2 | 0.5 | GO:0047560 | 3-dehydrosphinganine reductase activity(GO:0047560) |
| 0.2 | 0.8 | GO:0004148 | dihydrolipoyl dehydrogenase activity(GO:0004148) |
| 0.2 | 0.5 | GO:0015173 | aromatic amino acid transmembrane transporter activity(GO:0015173) |
| 0.2 | 0.6 | GO:0047498 | calcium-dependent phospholipase A2 activity(GO:0047498) |
| 0.2 | 1.2 | GO:0004566 | beta-glucuronidase activity(GO:0004566) |
| 0.2 | 0.6 | GO:0016165 | linoleate 13S-lipoxygenase activity(GO:0016165) |
| 0.1 | 1.0 | GO:0016621 | cinnamoyl-CoA reductase activity(GO:0016621) |
| 0.1 | 1.1 | GO:0033946 | xyloglucan-specific endo-beta-1,4-glucanase activity(GO:0033946) |
| 0.1 | 1.3 | GO:0009979 | 16:0 monogalactosyldiacylglycerol desaturase activity(GO:0009979) |
| 0.1 | 0.6 | GO:0008395 | steroid hydroxylase activity(GO:0008395) |
| 0.1 | 0.7 | GO:0035197 | siRNA binding(GO:0035197) |
| 0.1 | 1.0 | GO:0046975 | histone methyltransferase activity (H3-K36 specific)(GO:0046975) |
| 0.1 | 9.1 | GO:0046910 | pectinesterase inhibitor activity(GO:0046910) |
| 0.1 | 1.1 | GO:0004383 | guanylate cyclase activity(GO:0004383) |
| 0.1 | 1.3 | GO:0003886 | DNA (cytosine-5-)-methyltransferase activity(GO:0003886) |
| 0.1 | 1.4 | GO:0047429 | nucleoside-triphosphate diphosphatase activity(GO:0047429) |
| 0.1 | 1.0 | GO:0010011 | auxin binding(GO:0010011) |
| 0.1 | 0.4 | GO:0045437 | uridine nucleosidase activity(GO:0045437) ribosylpyrimidine nucleosidase activity(GO:0050263) |
| 0.1 | 0.3 | GO:0036310 | annealing helicase activity(GO:0036310) |
| 0.1 | 2.9 | GO:0016762 | xyloglucan:xyloglucosyl transferase activity(GO:0016762) |
| 0.1 | 7.5 | GO:0004650 | polygalacturonase activity(GO:0004650) |
| 0.1 | 0.8 | GO:0016756 | glutathione gamma-glutamylcysteinyltransferase activity(GO:0016756) |
| 0.1 | 0.3 | GO:0047912 | galacturonokinase activity(GO:0047912) |
| 0.1 | 0.5 | GO:0003987 | acetate-CoA ligase activity(GO:0003987) |
| 0.1 | 0.4 | GO:0015018 | galactosylgalactosylxylosylprotein 3-beta-glucuronosyltransferase activity(GO:0015018) |
| 0.1 | 1.5 | GO:0004427 | inorganic diphosphatase activity(GO:0004427) |
| 0.1 | 1.3 | GO:0016308 | 1-phosphatidylinositol-4-phosphate 5-kinase activity(GO:0016308) |
| 0.1 | 2.4 | GO:0004568 | chitinase activity(GO:0004568) |
| 0.1 | 0.5 | GO:0050113 | inositol oxygenase activity(GO:0050113) |
| 0.1 | 1.0 | GO:0047372 | acylglycerol lipase activity(GO:0047372) |
| 0.1 | 0.5 | GO:0005366 | myo-inositol:proton symporter activity(GO:0005366) |
| 0.1 | 0.4 | GO:0004367 | glycerol-3-phosphate dehydrogenase [NAD+] activity(GO:0004367) |
| 0.1 | 2.8 | GO:0030898 | microfilament motor activity(GO:0000146) actin-dependent ATPase activity(GO:0030898) |
| 0.1 | 0.6 | GO:0004664 | prephenate dehydratase activity(GO:0004664) arogenate dehydratase activity(GO:0047769) |
| 0.1 | 0.1 | GO:0004335 | galactokinase activity(GO:0004335) |
| 0.1 | 0.7 | GO:0004849 | uridine kinase activity(GO:0004849) |
| 0.1 | 0.8 | GO:0051183 | vitamin transporter activity(GO:0051183) |
| 0.1 | 0.9 | GO:0030976 | thiamine pyrophosphate binding(GO:0030976) |
| 0.1 | 0.3 | GO:0001216 | bacterial-type RNA polymerase transcription factor activity, sequence-specific DNA binding(GO:0001130) bacterial-type RNA polymerase transcriptional activator activity, sequence-specific DNA binding(GO:0001216) |
| 0.1 | 0.4 | GO:0050291 | sphingosine N-acyltransferase activity(GO:0050291) |
| 0.1 | 1.6 | GO:0003825 | alpha,alpha-trehalose-phosphate synthase (UDP-forming) activity(GO:0003825) |
| 0.1 | 0.7 | GO:0070696 | transmembrane receptor protein serine/threonine kinase binding(GO:0070696) |
| 0.1 | 6.6 | GO:0003777 | microtubule motor activity(GO:0003777) |
| 0.1 | 0.8 | GO:0016464 | chloroplast protein-transporting ATPase activity(GO:0016464) |
| 0.1 | 0.4 | GO:0008297 | single-stranded DNA exodeoxyribonuclease activity(GO:0008297) |
| 0.1 | 0.5 | GO:0003878 | ATP citrate synthase activity(GO:0003878) |
| 0.1 | 1.2 | GO:0004709 | MAP kinase kinase kinase activity(GO:0004709) |
| 0.1 | 0.3 | GO:0070259 | tyrosyl-DNA phosphodiesterase activity(GO:0070259) |
| 0.1 | 0.3 | GO:0003849 | 3-deoxy-7-phosphoheptulonate synthase activity(GO:0003849) |
| 0.1 | 0.3 | GO:0004824 | lysine-tRNA ligase activity(GO:0004824) |
| 0.1 | 0.6 | GO:0031492 | nucleosomal DNA binding(GO:0031492) |
| 0.1 | 0.7 | GO:0004559 | alpha-mannosidase activity(GO:0004559) |
| 0.1 | 1.2 | GO:0016872 | intramolecular lyase activity(GO:0016872) |
| 0.1 | 0.4 | GO:0033897 | ribonuclease T2 activity(GO:0033897) |
| 0.1 | 0.7 | GO:0004619 | phosphoglycerate mutase activity(GO:0004619) |
| 0.1 | 0.6 | GO:0008169 | C-methyltransferase activity(GO:0008169) |
| 0.1 | 0.5 | GO:0050105 | L-gulonolactone oxidase activity(GO:0050105) |
| 0.1 | 0.6 | GO:0008083 | growth factor activity(GO:0008083) |
| 0.1 | 0.4 | GO:0043682 | copper-transporting ATPase activity(GO:0043682) |
| 0.1 | 0.6 | GO:0004024 | alcohol dehydrogenase activity, zinc-dependent(GO:0004024) |
| 0.1 | 0.4 | GO:0008835 | diaminohydroxyphosphoribosylaminopyrimidine deaminase activity(GO:0008835) |
| 0.1 | 1.0 | GO:0000822 | inositol hexakisphosphate binding(GO:0000822) |
| 0.1 | 3.7 | GO:0102483 | scopolin beta-glucosidase activity(GO:0102483) |
| 0.1 | 0.4 | GO:0004392 | heme oxygenase (decyclizing) activity(GO:0004392) |
| 0.1 | 1.0 | GO:0002161 | aminoacyl-tRNA editing activity(GO:0002161) |
| 0.1 | 0.4 | GO:0004478 | methionine adenosyltransferase activity(GO:0004478) |
| 0.1 | 0.2 | GO:0004609 | phosphatidylserine decarboxylase activity(GO:0004609) |
| 0.1 | 2.6 | GO:0005179 | hormone activity(GO:0005179) |
| 0.1 | 1.5 | GO:0004864 | protein phosphatase inhibitor activity(GO:0004864) |
| 0.1 | 1.1 | GO:0035250 | UDP-galactosyltransferase activity(GO:0035250) |
| 0.1 | 0.9 | GO:0033926 | glycopeptide alpha-N-acetylgalactosaminidase activity(GO:0033926) |
| 0.1 | 0.9 | GO:0002020 | protease binding(GO:0002020) |
| 0.1 | 0.2 | GO:0008481 | sphinganine kinase activity(GO:0008481) |
| 0.1 | 0.3 | GO:0080116 | glucuronoxylan glucuronosyltransferase activity(GO:0080116) |
| 0.1 | 0.5 | GO:0010328 | auxin influx transmembrane transporter activity(GO:0010328) |
| 0.1 | 0.8 | GO:0003905 | alkylbase DNA N-glycosylase activity(GO:0003905) DNA-3-methyladenine glycosylase activity(GO:0008725) DNA-3-methylbase glycosylase activity(GO:0043733) |
| 0.1 | 0.6 | GO:0048256 | flap endonuclease activity(GO:0048256) |
| 0.1 | 0.4 | GO:0003913 | DNA photolyase activity(GO:0003913) |
| 0.1 | 0.4 | GO:0004126 | cytidine deaminase activity(GO:0004126) |
| 0.1 | 0.7 | GO:1990757 | ubiquitin ligase activator activity(GO:1990757) |
| 0.1 | 0.2 | GO:0019206 | nucleoside kinase activity(GO:0019206) |
| 0.1 | 0.3 | GO:0003774 | motor activity(GO:0003774) |
| 0.1 | 0.8 | GO:0103075 | indole-3-pyruvate monooxygenase activity(GO:0103075) |
| 0.1 | 3.5 | GO:0004185 | serine-type carboxypeptidase activity(GO:0004185) |
| 0.1 | 0.3 | GO:0010277 | chlorophyllide a oxygenase [overall] activity(GO:0010277) |
| 0.1 | 0.5 | GO:0042299 | lupeol synthase activity(GO:0042299) |
| 0.1 | 0.3 | GO:0016463 | cadmium-transporting ATPase activity(GO:0015434) zinc-exporting ATPase activity(GO:0016463) |
| 0.1 | 0.2 | GO:0008253 | 5'-nucleotidase activity(GO:0008253) |
| 0.1 | 2.3 | GO:0008553 | hydrogen-exporting ATPase activity, phosphorylative mechanism(GO:0008553) |
| 0.1 | 0.2 | GO:0002151 | G-quadruplex RNA binding(GO:0002151) |
| 0.1 | 1.0 | GO:0010333 | terpene synthase activity(GO:0010333) |
| 0.1 | 2.4 | GO:0000156 | phosphorelay response regulator activity(GO:0000156) |
| 0.1 | 1.8 | GO:0004089 | carbonate dehydratase activity(GO:0004089) |
| 0.1 | 0.2 | GO:0004829 | threonine-tRNA ligase activity(GO:0004829) |
| 0.1 | 0.8 | GO:0005242 | inward rectifier potassium channel activity(GO:0005242) |
| 0.1 | 0.2 | GO:0016707 | gibberellin 3-beta-dioxygenase activity(GO:0016707) |
| 0.1 | 0.3 | GO:0051996 | farnesyl-diphosphate farnesyltransferase activity(GO:0004310) squalene synthase activity(GO:0051996) |
| 0.1 | 0.4 | GO:0010279 | indole-3-acetic acid amido synthetase activity(GO:0010279) |
| 0.1 | 0.6 | GO:0030060 | L-malate dehydrogenase activity(GO:0030060) |
| 0.1 | 0.5 | GO:0048040 | UDP-glucuronate decarboxylase activity(GO:0048040) |
| 0.1 | 0.8 | GO:0003688 | DNA replication origin binding(GO:0003688) |
| 0.1 | 0.2 | GO:0047334 | diphosphate-fructose-6-phosphate 1-phosphotransferase activity(GO:0047334) |
| 0.1 | 0.6 | GO:0032453 | histone demethylase activity (H3-K4 specific)(GO:0032453) histone demethylase activity (H3-trimethyl-K4 specific)(GO:0034647) |
| 0.1 | 0.2 | GO:0050412 | cinnamate beta-D-glucosyltransferase activity(GO:0050412) |
| 0.1 | 0.2 | GO:0070818 | oxygen-dependent protoporphyrinogen oxidase activity(GO:0004729) protoporphyrinogen oxidase activity(GO:0070818) |
| 0.1 | 0.3 | GO:0022841 | leak channel activity(GO:0022840) potassium ion leak channel activity(GO:0022841) narrow pore channel activity(GO:0022842) |
| 0.0 | 0.1 | GO:0004412 | homoserine dehydrogenase activity(GO:0004412) |
| 0.0 | 1.0 | GO:0005199 | structural constituent of cell wall(GO:0005199) |
| 0.0 | 0.7 | GO:0045551 | cinnamyl-alcohol dehydrogenase activity(GO:0045551) |
| 0.0 | 0.3 | GO:0003909 | DNA ligase activity(GO:0003909) DNA ligase (ATP) activity(GO:0003910) |
| 0.0 | 1.9 | GO:0045735 | nutrient reservoir activity(GO:0045735) |
| 0.0 | 1.8 | GO:0004222 | metalloendopeptidase activity(GO:0004222) |
| 0.0 | 0.2 | GO:0043765 | T/G mismatch-specific endonuclease activity(GO:0043765) |
| 0.0 | 0.3 | GO:0043015 | gamma-tubulin binding(GO:0043015) |
| 0.0 | 0.3 | GO:0004663 | Rab geranylgeranyltransferase activity(GO:0004663) |
| 0.0 | 0.5 | GO:0004784 | superoxide dismutase activity(GO:0004784) oxidoreductase activity, acting on superoxide radicals as acceptor(GO:0016721) |
| 0.0 | 0.3 | GO:0004143 | diacylglycerol kinase activity(GO:0004143) |
| 0.0 | 0.4 | GO:0009378 | four-way junction helicase activity(GO:0009378) |
| 0.0 | 0.6 | GO:0004499 | N,N-dimethylaniline monooxygenase activity(GO:0004499) |
| 0.0 | 0.3 | GO:0004791 | thioredoxin-disulfide reductase activity(GO:0004791) |
| 0.0 | 0.4 | GO:0043495 | protein anchor(GO:0043495) |
| 0.0 | 0.4 | GO:0004869 | cysteine-type endopeptidase inhibitor activity(GO:0004869) |
| 0.0 | 1.2 | GO:0000049 | tRNA binding(GO:0000049) |
| 0.0 | 1.0 | GO:0005385 | zinc ion transmembrane transporter activity(GO:0005385) |
| 0.0 | 0.4 | GO:0070569 | uridylyltransferase activity(GO:0070569) |
| 0.0 | 0.1 | GO:0017077 | oxidative phosphorylation uncoupler activity(GO:0017077) |
| 0.0 | 0.4 | GO:0080019 | fatty-acyl-CoA reductase (alcohol-forming) activity(GO:0080019) |
| 0.0 | 0.5 | GO:0003689 | DNA clamp loader activity(GO:0003689) protein-DNA loading ATPase activity(GO:0033170) |
| 0.0 | 2.9 | GO:0008017 | microtubule binding(GO:0008017) |
| 0.0 | 1.2 | GO:0005200 | structural constituent of cytoskeleton(GO:0005200) |
| 0.0 | 1.2 | GO:0018024 | histone-lysine N-methyltransferase activity(GO:0018024) |
| 0.0 | 0.7 | GO:0005089 | Rho guanyl-nucleotide exchange factor activity(GO:0005089) |
| 0.0 | 0.3 | GO:0003996 | acyl-CoA ligase activity(GO:0003996) |
| 0.0 | 0.3 | GO:0042500 | aspartic endopeptidase activity, intramembrane cleaving(GO:0042500) |
| 0.0 | 0.3 | GO:0010427 | abscisic acid binding(GO:0010427) |
| 0.0 | 3.4 | GO:0003779 | actin binding(GO:0003779) |
| 0.0 | 0.3 | GO:0010294 | abscisic acid glucosyltransferase activity(GO:0010294) |
| 0.0 | 0.5 | GO:0004144 | diacylglycerol O-acyltransferase activity(GO:0004144) |
| 0.0 | 1.0 | GO:0045309 | protein phosphorylated amino acid binding(GO:0045309) phosphoprotein binding(GO:0051219) |
| 0.0 | 0.1 | GO:0004034 | aldose 1-epimerase activity(GO:0004034) |
| 0.0 | 0.2 | GO:0003680 | AT DNA binding(GO:0003680) |
| 0.0 | 0.4 | GO:0016161 | beta-amylase activity(GO:0016161) |
| 0.0 | 0.5 | GO:0031545 | procollagen-proline 4-dioxygenase activity(GO:0004656) procollagen-proline dioxygenase activity(GO:0019798) peptidyl-proline dioxygenase activity(GO:0031543) peptidyl-proline 4-dioxygenase activity(GO:0031545) |
| 0.0 | 0.3 | GO:0046923 | ER retention sequence binding(GO:0046923) |
| 0.0 | 0.2 | GO:0003841 | 1-acylglycerol-3-phosphate O-acyltransferase activity(GO:0003841) lysophosphatidic acid acyltransferase activity(GO:0042171) |
| 0.0 | 0.4 | GO:0042300 | beta-amyrin synthase activity(GO:0042300) |
| 0.0 | 0.3 | GO:0015020 | glucuronosyltransferase activity(GO:0015020) |
| 0.0 | 0.5 | GO:0017056 | structural constituent of nuclear pore(GO:0017056) |
| 0.0 | 0.1 | GO:0008318 | protein prenyltransferase activity(GO:0008318) |
| 0.0 | 0.3 | GO:0004069 | L-aspartate:2-oxoglutarate aminotransferase activity(GO:0004069) |
| 0.0 | 0.2 | GO:0004564 | beta-fructofuranosidase activity(GO:0004564) |
| 0.0 | 1.4 | GO:0004523 | RNA-DNA hybrid ribonuclease activity(GO:0004523) |
| 0.0 | 0.2 | GO:0033836 | flavonol 7-O-beta-glucosyltransferase activity(GO:0033836) |
| 0.0 | 0.2 | GO:0047196 | long-chain-alcohol O-fatty-acyltransferase activity(GO:0047196) |
| 0.0 | 0.4 | GO:0005504 | fatty acid binding(GO:0005504) |
| 0.0 | 0.1 | GO:0046592 | polyamine oxidase activity(GO:0046592) |
| 0.0 | 0.2 | GO:0017048 | Rho GTPase binding(GO:0017048) |
| 0.0 | 0.2 | GO:0004180 | carboxypeptidase activity(GO:0004180) |
| 0.0 | 0.2 | GO:0034237 | protein kinase A regulatory subunit binding(GO:0034237) protein kinase A binding(GO:0051018) Arp2/3 complex binding(GO:0071933) |
| 0.0 | 0.1 | GO:0004108 | citrate (Si)-synthase activity(GO:0004108) citrate synthase activity(GO:0036440) |
| 0.0 | 0.2 | GO:0052691 | UDP-arabinopyranose mutase activity(GO:0052691) |
| 0.0 | 0.4 | GO:0017025 | TBP-class protein binding(GO:0017025) |
| 0.0 | 0.1 | GO:0004071 | aspartate-ammonia ligase activity(GO:0004071) |
| 0.0 | 1.0 | GO:0003678 | DNA helicase activity(GO:0003678) |
| 0.0 | 2.8 | GO:0004252 | serine-type endopeptidase activity(GO:0004252) |
| 0.0 | 0.5 | GO:0043295 | glutathione binding(GO:0043295) oligopeptide binding(GO:1900750) |
| 0.0 | 0.3 | GO:0004806 | triglyceride lipase activity(GO:0004806) |
| 0.0 | 0.3 | GO:0019104 | DNA N-glycosylase activity(GO:0019104) |
| 0.0 | 0.1 | GO:0018488 | aryl-aldehyde oxidase activity(GO:0018488) indole-3-acetaldehyde oxidase activity(GO:0050302) |
| 0.0 | 0.1 | GO:0003979 | UDP-glucose 6-dehydrogenase activity(GO:0003979) |
| 0.0 | 0.7 | GO:0033612 | receptor serine/threonine kinase binding(GO:0033612) |
| 0.0 | 0.1 | GO:0045547 | dehydrodolichyl diphosphate synthase activity(GO:0045547) |
| 0.0 | 0.1 | GO:0042409 | caffeoyl-CoA O-methyltransferase activity(GO:0042409) |
| 0.0 | 0.1 | GO:0016838 | carbon-oxygen lyase activity, acting on phosphates(GO:0016838) |
| 0.0 | 0.1 | GO:0004333 | fumarate hydratase activity(GO:0004333) |
| 0.0 | 0.4 | GO:0003725 | double-stranded RNA binding(GO:0003725) |
| 0.0 | 0.6 | GO:0008810 | cellulase activity(GO:0008810) |
| 0.0 | 0.4 | GO:0050308 | sugar-phosphatase activity(GO:0050308) |
| 0.0 | 0.2 | GO:0004834 | tryptophan synthase activity(GO:0004834) |
| 0.0 | 0.3 | GO:0031369 | translation initiation factor binding(GO:0031369) |
| 0.0 | 1.2 | GO:0001228 | transcriptional activator activity, RNA polymerase II transcription regulatory region sequence-specific binding(GO:0001228) |
| 0.0 | 1.2 | GO:0016836 | hydro-lyase activity(GO:0016836) |
| 0.0 | 0.2 | GO:0043891 | glyceraldehyde-3-phosphate dehydrogenase (NAD+) (phosphorylating) activity(GO:0004365) glyceraldehyde-3-phosphate dehydrogenase (NAD(P)+) (phosphorylating) activity(GO:0043891) |
| 0.0 | 0.2 | GO:0010329 | auxin efflux transmembrane transporter activity(GO:0010329) |
| 0.0 | 0.1 | GO:0050362 | L-tryptophan:2-oxoglutarate aminotransferase activity(GO:0050362) L-tryptophan aminotransferase activity(GO:0070529) L-tryptophan:pyruvate aminotransferase activity(GO:0080097) |
| 0.0 | 0.1 | GO:0052739 | phosphatidylserine 1-acylhydrolase activity(GO:0052739) 1-acyl-2-lysophosphatidylserine acylhydrolase activity(GO:0052740) |
| 0.0 | 0.2 | GO:0000774 | adenyl-nucleotide exchange factor activity(GO:0000774) |
| 0.0 | 0.1 | GO:0004821 | histidine-tRNA ligase activity(GO:0004821) |
| 0.0 | 0.2 | GO:0016307 | phosphatidylinositol phosphate kinase activity(GO:0016307) |
| 0.0 | 0.2 | GO:0034594 | phosphatidylinositol-3,4,5-trisphosphate 5-phosphatase activity(GO:0034485) phosphatidylinositol trisphosphate phosphatase activity(GO:0034594) |
| 0.0 | 0.4 | GO:0042973 | glucan endo-1,3-beta-D-glucosidase activity(GO:0042973) |
| 0.0 | 0.7 | GO:0005262 | calcium channel activity(GO:0005262) |
| 0.0 | 0.1 | GO:0000014 | single-stranded DNA endodeoxyribonuclease activity(GO:0000014) |
| 0.0 | 0.3 | GO:0004675 | transmembrane receptor protein serine/threonine kinase activity(GO:0004675) |
| 0.0 | 0.6 | GO:0004724 | magnesium-dependent protein serine/threonine phosphatase activity(GO:0004724) |
| 0.0 | 0.6 | GO:0031593 | polyubiquitin binding(GO:0031593) |
| 0.0 | 0.3 | GO:0004805 | trehalose-phosphatase activity(GO:0004805) |
| 0.0 | 0.1 | GO:0016812 | hydrolase activity, acting on carbon-nitrogen (but not peptide) bonds, in cyclic amides(GO:0016812) |
| 0.0 | 0.7 | GO:0004190 | aspartic-type endopeptidase activity(GO:0004190) |
| 0.0 | 1.0 | GO:0003743 | translation initiation factor activity(GO:0003743) |
| 0.0 | 0.1 | GO:0004046 | aminoacylase activity(GO:0004046) |
| 0.0 | 2.0 | GO:0009055 | electron carrier activity(GO:0009055) |
| 0.0 | 2.7 | GO:0008134 | transcription factor binding(GO:0008134) |
| 0.0 | 0.6 | GO:0016628 | oxidoreductase activity, acting on the CH-CH group of donors, NAD or NADP as acceptor(GO:0016628) |
| 0.0 | 0.0 | GO:0008936 | nicotinamidase activity(GO:0008936) |
| 0.0 | 0.0 | GO:0008883 | glutamyl-tRNA reductase activity(GO:0008883) |
| 0.0 | 0.1 | GO:0016174 | NAD(P)H oxidase activity(GO:0016174) oxidoreductase activity, acting on NAD(P)H, oxygen as acceptor(GO:0050664) |
| 0.0 | 0.1 | GO:0016151 | nickel cation binding(GO:0016151) |
| 0.0 | 0.1 | GO:0004400 | histidinol-phosphate transaminase activity(GO:0004400) |
| 0.0 | 0.1 | GO:0016653 | oxidoreductase activity, acting on NAD(P)H, heme protein as acceptor(GO:0016653) |
| 0.0 | 0.5 | GO:0016759 | cellulose synthase activity(GO:0016759) |
| 0.0 | 0.6 | GO:0000295 | adenine nucleotide transmembrane transporter activity(GO:0000295) |
| 0.0 | 0.2 | GO:0102338 | 3-oxo-arachidoyl-CoA synthase activity(GO:0102336) 3-oxo-cerotoyl-CoA synthase activity(GO:0102337) 3-oxo-lignoceronyl-CoA synthase activity(GO:0102338) |
| 0.0 | 0.1 | GO:0003968 | RNA-directed RNA polymerase activity(GO:0003968) |
| 0.0 | 0.1 | GO:0047274 | galactinol-sucrose galactosyltransferase activity(GO:0047274) |
| 0.0 | 0.3 | GO:0016876 | aminoacyl-tRNA ligase activity(GO:0004812) ligase activity, forming carbon-oxygen bonds(GO:0016875) ligase activity, forming aminoacyl-tRNA and related compounds(GO:0016876) |
Gene overrepresentation in curated gene sets: canonical pathways category:
| Log-likelihood per target | Total log-likelihood | Term | Description |
|---|---|---|---|
| 0.8 | 3.0 | ST WNT BETA CATENIN PATHWAY | Wnt/beta-catenin Pathway |
| 0.3 | 0.9 | PID TCPTP PATHWAY | Signaling events mediated by TCPTP |
| 0.2 | 0.9 | PID MYC REPRESS PATHWAY | Validated targets of C-MYC transcriptional repression |
| 0.2 | 1.7 | PID ATR PATHWAY | ATR signaling pathway |
| 0.2 | 0.7 | PID BARD1 PATHWAY | BARD1 signaling events |
| 0.1 | 0.4 | PID HNF3B PATHWAY | FOXA2 and FOXA3 transcription factor networks |
| 0.1 | 0.6 | PID HDAC CLASSII PATHWAY | Signaling events mediated by HDAC Class II |
| 0.1 | 0.4 | PID MYC PATHWAY | C-MYC pathway |
| 0.1 | 0.5 | PID REG GR PATHWAY | Glucocorticoid receptor regulatory network |
| 0.1 | 0.8 | PID CMYB PATHWAY | C-MYB transcription factor network |
| 0.1 | 0.5 | PID HES HEY PATHWAY | Notch-mediated HES/HEY network |
| 0.1 | 0.2 | PID FANCONI PATHWAY | Fanconi anemia pathway |
| 0.0 | 0.3 | ST FAS SIGNALING PATHWAY | Fas Signaling Pathway |
| 0.0 | 0.1 | PID S1P S1P1 PATHWAY | S1P1 pathway |
| 0.0 | 0.0 | NABA SECRETED FACTORS | Genes encoding secreted soluble factors |
| 0.0 | 0.0 | NABA MATRISOME ASSOCIATED | Ensemble of genes encoding ECM-associated proteins including ECM-affilaited proteins, ECM regulators and secreted factors |
Gene overrepresentation in curated gene sets: REACTOME pathways category:
| Log-likelihood per target | Total log-likelihood | Term | Description |
|---|---|---|---|
| 0.4 | 2.6 | REACTOME UNWINDING OF DNA | Genes involved in Unwinding of DNA |
| 0.3 | 0.9 | REACTOME SIGNALING BY TGF BETA RECEPTOR COMPLEX | Genes involved in Signaling by TGF-beta Receptor Complex |
| 0.2 | 0.9 | REACTOME GLUCONEOGENESIS | Genes involved in Gluconeogenesis |
| 0.2 | 0.8 | REACTOME G1 S SPECIFIC TRANSCRIPTION | Genes involved in G1/S-Specific Transcription |
| 0.2 | 0.8 | REACTOME VEGF LIGAND RECEPTOR INTERACTIONS | Genes involved in VEGF ligand-receptor interactions |
| 0.2 | 2.8 | REACTOME DEVELOPMENTAL BIOLOGY | Genes involved in Developmental Biology |
| 0.2 | 0.5 | REACTOME HDL MEDIATED LIPID TRANSPORT | Genes involved in HDL-mediated lipid transport |
| 0.1 | 0.4 | REACTOME GENERIC TRANSCRIPTION PATHWAY | Genes involved in Generic Transcription Pathway |
| 0.1 | 1.0 | REACTOME CHEMOKINE RECEPTORS BIND CHEMOKINES | Genes involved in Chemokine receptors bind chemokines |
| 0.1 | 0.5 | REACTOME PEROXISOMAL LIPID METABOLISM | Genes involved in Peroxisomal lipid metabolism |
| 0.1 | 0.2 | REACTOME SPHINGOLIPID DE NOVO BIOSYNTHESIS | Genes involved in Sphingolipid de novo biosynthesis |
| 0.0 | 0.3 | REACTOME RESOLUTION OF AP SITES VIA THE MULTIPLE NUCLEOTIDE PATCH REPLACEMENT PATHWAY | Genes involved in Resolution of AP sites via the multiple-nucleotide patch replacement pathway |
| 0.0 | 0.8 | REACTOME FORMATION OF THE TERNARY COMPLEX AND SUBSEQUENTLY THE 43S COMPLEX | Genes involved in Formation of the ternary complex, and subsequently, the 43S complex |
| 0.0 | 0.5 | REACTOME FACTORS INVOLVED IN MEGAKARYOCYTE DEVELOPMENT AND PLATELET PRODUCTION | Genes involved in Factors involved in megakaryocyte development and platelet production |
| 0.0 | 0.2 | REACTOME MEIOTIC RECOMBINATION | Genes involved in Meiotic Recombination |
| 0.0 | 0.0 | REACTOME DOUBLE STRAND BREAK REPAIR | Genes involved in Double-Strand Break Repair |
| 0.0 | 0.2 | REACTOME ANTIGEN PROCESSING UBIQUITINATION PROTEASOME DEGRADATION | Genes involved in Antigen processing: Ubiquitination & Proteasome degradation |
| 0.0 | 0.2 | REACTOME METABOLISM OF CARBOHYDRATES | Genes involved in Metabolism of carbohydrates |