Project
GSE43616: Time-course of wild-type Arabidopsis leaf
Navigation
Downloads
Results for AT2G21230
Z-value: 0.32
Transcription factors associated with AT2G21230
| Gene Symbol | Gene ID | Gene Info |
|---|---|---|
|
AT2G21230
|
AT2G21230 | Basic-leucine zipper (bZIP) transcription factor family protein |
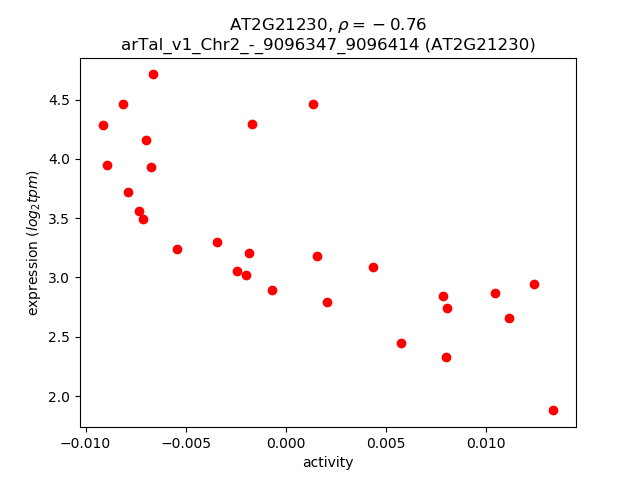
Activity-expression correlation:
| Gene | Promoter | Pearson corr. coef. | P-value | Plot |
|---|---|---|---|---|
| AT2G21230 | arTal_v1_Chr2_-_9096347_9096414 | -0.76 | 2.9e-06 | Click! |
Activity profile of AT2G21230 motif
Sorted Z-values of AT2G21230 motif
| Promoter | Log-likelihood | Transcript | Gene | Gene Info |
|---|---|---|---|---|
| arTal_v1_Chr5_+_24167996_24168072 | 1.16 |
AT5G60020.1
AT5G60020.2 |
LAC17
|
laccase 17 |
| arTal_v1_Chr5_+_24168245_24168245 | 0.88 |
AT5G60020.3
|
LAC17
|
laccase 17 |
| arTal_v1_Chr5_-_5741500_5741500 | 0.77 |
AT5G17420.1
|
IRX3
|
Cellulose synthase family protein |
| arTal_v1_Chr5_+_17714390_17714390 | 0.71 |
AT5G44030.2
AT5G44030.1 |
CESA4
|
cellulose synthase A4 |
| arTal_v1_Chr2_-_15589369_15589369 | 0.51 |
AT2G37090.1
|
IRX9
|
Nucleotide-diphospho-sugar transferases superfamily protein |
| arTal_v1_Chr5_+_17715687_17715687 | 0.44 |
AT5G44030.3
|
CESA4
|
cellulose synthase A4 |
| arTal_v1_Chr4_-_16063070_16063251 | 0.43 |
AT4G33330.2
AT4G33330.1 AT4G33330.5 AT4G33330.3 AT4G33330.4 |
PGSIP3
|
plant glycogenin-like starch initiation protein 3 |
| arTal_v1_Chr3_-_8217080_8217206 | 0.41 |
AT3G23090.1
AT3G23090.2 AT3G23090.4 AT3G23090.3 |
AT3G23090
|
TPX2 (targeting protein for Xklp2) protein family |
| arTal_v1_Chr3_-_8216305_8216305 | 0.25 |
AT3G23090.5
|
AT3G23090
|
TPX2 (targeting protein for Xklp2) protein family |
| arTal_v1_Chr1_-_9510263_9510269 | 0.14 |
AT1G27380.1
AT1G27380.3 AT1G27380.4 |
RIC2
|
ROP-interactive CRIB motif-containing protein 2 |
| arTal_v1_Chr1_-_9510066_9510066 | 0.13 |
AT1G27380.2
|
RIC2
|
ROP-interactive CRIB motif-containing protein 2 |
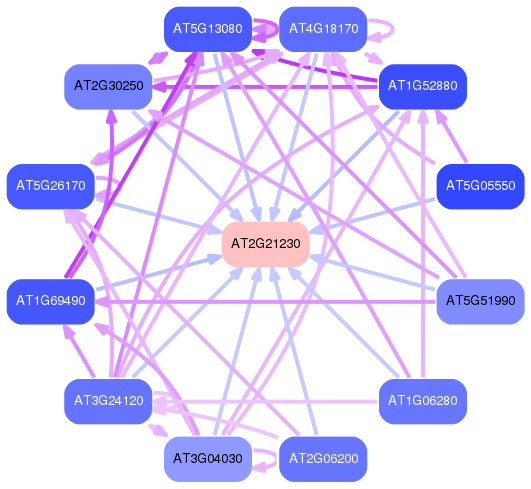
Network of associatons between targets according to the STRING database.

First level regulatory network of AT2G21230
Gene Ontology Analysis
Gene overrepresentation in biological process category:
| Log-likelihood per target | Total log-likelihood | Term | Description |
|---|---|---|---|
| 0.2 | 0.8 | GO:0010395 | rhamnogalacturonan I metabolic process(GO:0010395) |
| 0.1 | 0.9 | GO:0010413 | glucuronoxylan metabolic process(GO:0010413) glucuronoxylan biosynthetic process(GO:0010417) |
| 0.0 | 1.1 | GO:0009833 | plant-type primary cell wall biogenesis(GO:0009833) |
| 0.0 | 1.3 | GO:0009809 | lignin biosynthetic process(GO:0009809) |
Gene overrepresentation in cellular component category:
| Log-likelihood per target | Total log-likelihood | Term | Description |
|---|---|---|---|
| 0.2 | 0.8 | GO:0010330 | cellulose synthase complex(GO:0010330) |
Gene overrepresentation in molecular function category:
| Log-likelihood per target | Total log-likelihood | Term | Description |
|---|---|---|---|
| 0.2 | 0.4 | GO:0080116 | glucuronoxylan glucuronosyltransferase activity(GO:0080116) |
| 0.1 | 0.5 | GO:0047517 | galactosylgalactosylxylosylprotein 3-beta-glucuronosyltransferase activity(GO:0015018) 1,4-beta-D-xylan synthase activity(GO:0047517) |
| 0.1 | 2.0 | GO:0052716 | hydroquinone:oxygen oxidoreductase activity(GO:0052716) |
| 0.1 | 1.9 | GO:0016760 | cellulose synthase (UDP-forming) activity(GO:0016760) |