Project
GSE43616: Time-course of wild-type Arabidopsis leaf
Navigation
Downloads
Results for AT2G02470
Z-value: 0.05
Transcription factors associated with AT2G02470
| Gene Symbol | Gene ID | Gene Info |
|---|---|---|
|
AT2G02470
|
AT2G02470 | alfin-like 6 |
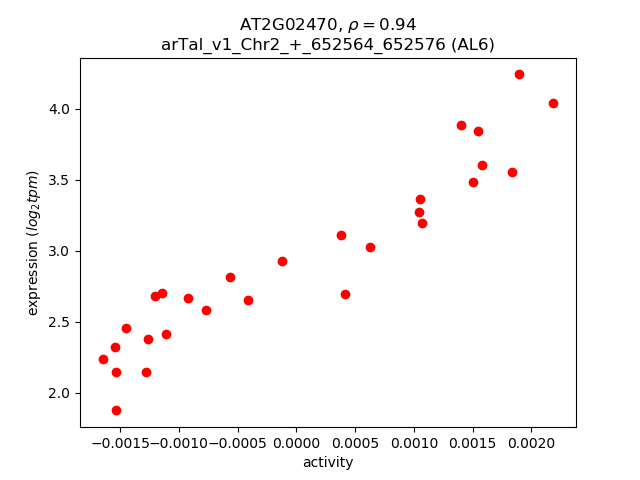
Activity-expression correlation:
| Gene | Promoter | Pearson corr. coef. | P-value | Plot |
|---|---|---|---|---|
| AL6 | arTal_v1_Chr2_+_652564_652576 | 0.94 | 4.4e-14 | Click! |
Activity profile of AT2G02470 motif
Sorted Z-values of AT2G02470 motif
| Promoter | Log-likelihood | Transcript | Gene | Gene Info |
|---|---|---|---|---|
| arTal_v1_Chr1_-_10801093_10801093 | 0.14 |
AT1G30490.1
|
PHV
|
Homeobox-leucine zipper family protein / lipid-binding START domain-containing protein |
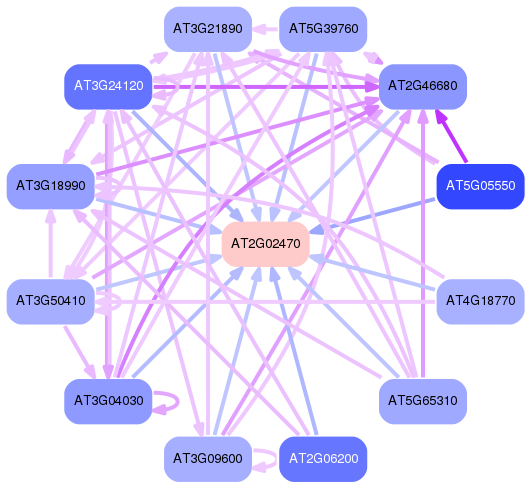
Network of associatons between targets according to the STRING database.

First level regulatory network of AT2G02470
Gene Ontology Analysis
Gene overrepresentation in biological process category:
| Log-likelihood per target | Total log-likelihood | Term | Description |
|---|---|---|---|
| 0.0 | 0.1 | GO:0009855 | determination of bilateral symmetry(GO:0009855) |