Project
GSE43616: Time-course of wild-type Arabidopsis leaf
Navigation
Downloads
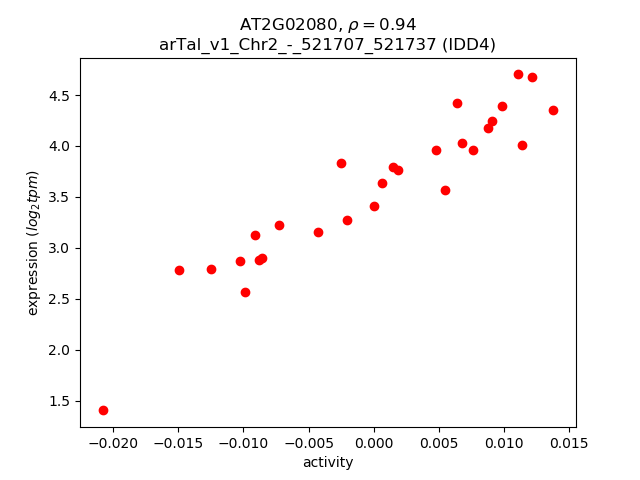
Results for AT2G02080
Z-value: 1.17
Transcription factors associated with AT2G02080
| Gene Symbol | Gene ID | Gene Info |
|---|---|---|
|
AT2G02080
|
AT2G02080 | indeterminate(ID)-domain 4 |
Activity-expression correlation:
| Gene | Promoter | Pearson corr. coef. | P-value | Plot |
|---|---|---|---|---|
| IDD4 | arTal_v1_Chr2_-_521707_521737 | 0.94 | 5.5e-14 | Click! |
Activity profile of AT2G02080 motif
Sorted Z-values of AT2G02080 motif
| Promoter | Log-likelihood | Transcript | Gene | Gene Info |
|---|---|---|---|---|
| arTal_v1_Chr3_+_18873911_18873911 | 4.06 |
AT3G50770.1
|
CML41
|
calmodulin-like 41 |
| arTal_v1_Chr3_-_21189859_21189967 | 3.99 |
AT3G57260.1
AT3G57260.2 |
BGL2
|
beta-1,3-glucanase 2 |
| arTal_v1_Chr4_-_9201643_9201643 | 3.18 |
AT4G16260.2
AT4G16260.1 |
AT4G16260
|
Glycosyl hydrolase superfamily protein |
| arTal_v1_Chr2_-_18077517_18077517 | 3.16 |
AT2G43570.1
|
CHI
|
chitinase |
| arTal_v1_Chr5_+_18613239_18613239 | 3.13 |
AT5G45890.1
|
SAG12
|
senescence-associated gene 12 |
| arTal_v1_Chr3_-_8007836_8007836 | 3.07 |
AT3G22600.1
|
AT3G22600
|
Bifunctional inhibitor/lipid-transfer protein/seed storage 2S albumin superfamily protein |
| arTal_v1_Chr2_+_6213972_6213972 | 2.90 |
AT2G14560.2
AT2G14560.1 |
LURP1
|
LURP-one-like protein (DUF567) |
| arTal_v1_Chr1_+_23887809_23887809 | 2.89 |
AT1G64360.1
|
AT1G64360
|
hypothetical protein |
| arTal_v1_Chr3_+_19239305_19239412 | 2.88 |
AT3G51860.1
AT3G51860.2 |
CAX3
|
cation exchanger 3 |
| arTal_v1_Chr2_+_6213617_6213676 | 2.82 |
AT2G14560.3
AT2G14560.4 |
LURP1
|
LURP-one-like protein (DUF567) |
| arTal_v1_Chr3_-_20769324_20769410 | 2.80 |
AT3G55970.2
AT3G55970.1 |
JRG21
|
jasmonate-regulated gene 21 |
| arTal_v1_Chr4_+_285876_285876 | 2.75 |
AT4G00700.2
AT4G00700.1 |
AT4G00700
|
C2 calcium/lipid-binding plant phosphoribosyltransferase family protein |
| arTal_v1_Chr5_-_15859911_15859911 | 2.70 |
AT5G39610.1
|
NAC6
|
NAC domain containing protein 6 |
| arTal_v1_Chr2_-_15599951_15599951 | 2.70 |
AT2G37130.2
|
AT2G37130
|
Peroxidase superfamily protein |
| arTal_v1_Chr2_-_15600154_15600154 | 2.65 |
AT2G37130.1
|
AT2G37130
|
Peroxidase superfamily protein |
| arTal_v1_Chr5_-_2176446_2176446 | 2.59 |
AT5G07010.1
|
ST2A
|
sulfotransferase 2A |
| arTal_v1_Chr3_+_9208861_9208941 | 2.58 |
AT3G25290.1
AT3G25290.2 |
AT3G25290
|
Auxin-responsive family protein |
| arTal_v1_Chr3_-_3197457_3197457 | 2.56 |
AT3G10320.1
|
AT3G10320
|
Glycosyltransferase family 61 protein |
| arTal_v1_Chr5_+_2204206_2204248 | 2.56 |
AT5G07100.5
AT5G07100.3 AT5G07100.4 AT5G07100.2 AT5G07100.1 |
WRKY26
|
WRKY DNA-binding protein 26 |
| arTal_v1_Chr5_+_18390942_18390942 | 2.53 |
AT5G45380.1
|
DUR3
|
urea-proton symporter DEGRADATION OF UREA 3 (DUR3) |
| arTal_v1_Chr2_+_18641563_18641563 | 2.47 |
AT2G45210.1
|
SAUR36
|
SAUR-like auxin-responsive protein family |
| arTal_v1_Chr1_+_30150897_30151006 | 2.42 |
AT1G80160.3
AT1G80160.1 AT1G80160.2 |
GLYI7
|
Lactoylglutathione lyase / glyoxalase I family protein |
| arTal_v1_Chr5_-_21265460_21265460 | 2.42 |
AT5G52390.1
|
AT5G52390
|
PAR1 protein |
| arTal_v1_Chr2_-_18646606_18646606 | 2.41 |
AT2G45220.1
|
AT2G45220
|
Plant invertase/pectin methylesterase inhibitor superfamily |
| arTal_v1_Chr4_-_12853845_12853845 | 2.41 |
AT4G25000.1
|
AMY1
|
alpha-amylase-like protein |
| arTal_v1_Chr4_-_7406994_7406994 | 2.37 |
AT4G12480.1
|
EARLI1
|
Bifunctional inhibitor/lipid-transfer protein/seed storage 2S albumin superfamily protein |
| arTal_v1_Chr3_+_5234457_5234457 | 2.37 |
AT3G15500.1
|
NAC3
|
NAC domain containing protein 3 |
| arTal_v1_Chr3_-_2699257_2699257 | 2.34 |
AT3G08860.2
|
PYD4
|
PYRIMIDINE 4 |
| arTal_v1_Chr2_+_18289824_18289824 | 2.33 |
AT2G44240.1
|
AT2G44240
|
NEP-interacting protein (DUF239) |
| arTal_v1_Chr2_+_8097420_8097420 | 2.30 |
AT2G18690.2
AT2G18690.1 |
AT2G18690
|
transmembrane protein |
| arTal_v1_Chr4_+_1464467_1464467 | 2.27 |
AT4G03320.1
|
Tic20-IV
|
translocon at the inner envelope membrane of chloroplasts 20-IV |
| arTal_v1_Chr3_-_2699420_2699420 | 2.27 |
AT3G08860.1
|
PYD4
|
PYRIMIDINE 4 |
| arTal_v1_Chr1_+_7439171_7439171 | 2.25 |
AT1G21250.1
|
WAK1
|
cell wall-associated kinase |
| arTal_v1_Chr2_+_7606728_7606905 | 2.24 |
AT2G17500.2
AT2G17500.1 AT2G17500.3 AT2G17500.4 |
AT2G17500
|
Auxin efflux carrier family protein |
| arTal_v1_Chr1_-_29622445_29622447 | 2.23 |
AT1G78780.1
AT1G78780.2 AT1G78780.4 |
AT1G78780
|
pathogenesis-related family protein |
| arTal_v1_Chr2_+_1966806_1966816 | 2.22 |
AT2G05380.1
AT2G05380.2 |
GRP3S
|
glycine-rich protein 3 short isoform |
| arTal_v1_Chr5_-_8659352_8659352 | 2.21 |
AT5G25110.1
|
CIPK25
|
CBL-interacting protein kinase 25 |
| arTal_v1_Chr5_-_25089603_25089626 | 2.19 |
AT5G62480.3
AT5G62480.2 AT5G62480.1 |
GSTU9
|
glutathione S-transferase tau 9 |
| arTal_v1_Chr3_-_18294621_18294621 | 2.17 |
AT3G49340.1
|
AT3G49340
|
Cysteine proteinases superfamily protein |
| arTal_v1_Chr2_+_7693596_7693596 | 2.15 |
AT2G17710.1
|
AT2G17710
|
Big1 |
| arTal_v1_Chr2_-_19166949_19166967 | 2.13 |
AT2G46680.2
AT2G46680.1 |
HB-7
|
homeobox 7 |
| arTal_v1_Chr2_+_14783254_14783254 | 2.11 |
AT2G35070.1
AT2G35070.2 |
AT2G35070
|
transmembrane protein |
| arTal_v1_Chr5_+_25616625_25616625 | 2.10 |
AT5G64000.2
AT5G64000.1 |
SAL2
|
Inositol monophosphatase family protein |
| arTal_v1_Chr5_-_6042938_6043014 | 2.09 |
AT5G18270.2
AT5G18270.1 |
ANAC087
|
NAC domain containing protein 87 |
| arTal_v1_Chr1_+_3288087_3288087 | 2.09 |
AT1G10070.3
AT1G10070.2 AT1G10070.1 |
BCAT-2
|
branched-chain amino acid transaminase 2 |
| arTal_v1_Chr1_+_26122080_26122080 | 2.06 |
AT1G69490.1
|
NAP
|
NAC-like, activated by AP3/PI |
| arTal_v1_Chr1_+_21345445_21345445 | 2.06 |
AT1G57630.1
|
AT1G57630
|
Toll-Interleukin-Resistance (TIR) domain family protein |
| arTal_v1_Chr1_-_21235292_21235292 | 2.06 |
AT1G56650.1
|
PAP1
|
production of anthocyanin pigment 1 |
| arTal_v1_Chr5_+_7138762_7138762 | 2.06 |
AT5G21020.2
|
AT5G21020
|
transmembrane protein |
| arTal_v1_Chr3_+_18634546_18634546 | 2.05 |
AT3G50260.1
|
CEJ1
|
cooperatively regulated by ethylene and jasmonate 1 |
| arTal_v1_Chr4_-_11588373_11588373 | 2.05 |
AT4G21840.1
|
MSRB8
|
methionine sulfoxide reductase B8 |
| arTal_v1_Chr1_-_5645443_5645443 | 2.04 |
AT1G16510.1
|
AT1G16510
|
SAUR-like auxin-responsive protein family |
| arTal_v1_Chr5_+_16290386_16290386 | 2.02 |
AT5G40690.1
|
AT5G40690
|
histone-lysine N-methyltransferase trithorax-like protein |
| arTal_v1_Chr2_-_10585216_10585216 | 2.01 |
AT2G24850.1
|
TAT3
|
tyrosine aminotransferase 3 |
| arTal_v1_Chr2_+_16298110_16298110 | 2.01 |
AT2G39030.1
|
NATA1
|
Acyl-CoA N-acyltransferases (NAT) superfamily protein |
| arTal_v1_Chr3_-_4657723_4657723 | 1.99 |
AT3G14060.1
|
AT3G14060
|
hypothetical protein |
| arTal_v1_Chr3_+_5243432_5243432 | 1.98 |
AT3G15510.1
|
NAC2
|
NAC domain containing protein 2 |
| arTal_v1_Chr3_-_1055196_1055196 | 1.98 |
AT3G04060.1
|
NAC046
|
NAC domain containing protein 46 |
| arTal_v1_Chr2_+_1966610_1966610 | 1.98 |
AT2G05380.3
|
GRP3S
|
glycine-rich protein 3 short isoform |
| arTal_v1_Chr3_+_9892791_9892791 | 1.96 |
AT3G26840.1
|
PES2
|
Esterase/lipase/thioesterase family protein |
| arTal_v1_Chr3_+_995217_995217 | 1.96 |
AT3G03870.1
|
AT3G03870
|
transmembrane protein |
| arTal_v1_Chr1_+_24359328_24359434 | 1.96 |
AT1G65510.2
AT1G65510.1 |
AT1G65510
|
transmembrane protein |
| arTal_v1_Chr3_+_995062_995062 | 1.96 |
AT3G03870.2
|
AT3G03870
|
transmembrane protein |
| arTal_v1_Chr4_+_7304323_7304323 | 1.95 |
AT4G12290.2
|
AT4G12290
|
Copper amine oxidase family protein |
| arTal_v1_Chr1_-_19698482_19698482 | 1.94 |
AT1G52890.1
|
NAC019
|
NAC domain containing protein 19 |
| arTal_v1_Chr4_+_7303985_7303985 | 1.93 |
AT4G12290.1
|
AT4G12290
|
Copper amine oxidase family protein |
| arTal_v1_Chr4_+_15828228_15828228 | 1.92 |
AT4G32810.1
AT4G32810.2 |
CCD8
|
carotenoid cleavage dioxygenase 8 |
| arTal_v1_Chr3_+_23289243_23289243 | 1.92 |
AT3G63010.1
|
GID1B
|
alpha/beta-Hydrolases superfamily protein |
| arTal_v1_Chr1_-_9848015_9848015 | 1.92 |
AT1G28190.1
|
AT1G28190
|
hypothetical protein |
| arTal_v1_Chr2_-_1548999_1548999 | 1.91 |
AT2G04460.1
|
AT2G04460
|
|
| arTal_v1_Chr1_-_20949281_20949281 | 1.90 |
AT1G56010.2
|
NAC1
|
NAC domain containing protein 1 |
| arTal_v1_Chr2_-_14541617_14541617 | 1.90 |
AT2G34500.1
|
CYP710A1
|
cytochrome P450, family 710, subfamily A, polypeptide 1 |
| arTal_v1_Chr4_-_14820595_14820595 | 1.88 |
AT4G30270.1
|
XTH24
|
xyloglucan endotransglucosylase/hydrolase 24 |
| arTal_v1_Chr4_-_15941493_15941493 | 1.88 |
AT4G33040.1
|
AT4G33040
|
Thioredoxin superfamily protein |
| arTal_v1_Chr2_+_17251819_17251819 | 1.87 |
AT2G41380.1
|
AT2G41380
|
S-adenosyl-L-methionine-dependent methyltransferases superfamily protein |
| arTal_v1_Chr1_+_5389952_5389952 | 1.87 |
AT1G15670.1
|
AT1G15670
|
Galactose oxidase/kelch repeat superfamily protein |
| arTal_v1_Chr1_+_5869543_5869543 | 1.87 |
AT1G17170.1
|
GSTU24
|
glutathione S-transferase TAU 24 |
| arTal_v1_Chr1_-_513698_513721 | 1.87 |
AT1G02470.2
AT1G02470.1 |
AT1G02470
|
Polyketide cyclase/dehydrase and lipid transport superfamily protein |
| arTal_v1_Chr1_+_630374_630505 | 1.86 |
AT1G02850.3
AT1G02850.2 AT1G02850.1 AT1G02850.5 AT1G02850.4 |
BGLU11
|
beta glucosidase 11 |
| arTal_v1_Chr1_+_12917070_12917070 | 1.85 |
AT1G35230.1
|
AGP5
|
arabinogalactan protein 5 |
| arTal_v1_Chr4_+_12461907_12461907 | 1.85 |
AT4G24000.1
|
CSLG2
|
cellulose synthase like G2 |
| arTal_v1_Chr1_+_20876440_20876440 | 1.84 |
AT1G55850.1
|
CSLE1
|
cellulose synthase like E1 |
| arTal_v1_Chr3_-_16866261_16866261 | 1.84 |
AT3G45860.1
|
CRK4
|
cysteine-rich RLK (RECEPTOR-like protein kinase) 4 |
| arTal_v1_Chr3_+_22925742_22925742 | 1.82 |
AT3G61900.1
|
AT3G61900
|
SAUR-like auxin-responsive protein family |
| arTal_v1_Chr4_+_17440177_17440177 | 1.82 |
AT4G36990.1
|
HSF4
|
heat shock factor 4 |
| arTal_v1_Chr1_+_10892445_10892445 | 1.81 |
AT1G30700.1
|
AT1G30700
|
FAD-binding Berberine family protein |
| arTal_v1_Chr1_-_10356482_10356482 | 1.80 |
AT1G29640.1
|
AT1G29640
|
senescence regulator (Protein of unknown function, DUF584) |
| arTal_v1_Chr4_-_12018492_12018492 | 1.79 |
AT4G22920.1
|
NYE1
|
non-yellowing 1 |
| arTal_v1_Chr5_+_1672070_1672096 | 1.79 |
AT5G05600.1
AT5G05600.2 |
AT5G05600
|
2-oxoglutarate (2OG) and Fe(II)-dependent oxygenase superfamily protein |
| arTal_v1_Chr1_+_28740540_28740540 | 1.79 |
AT1G76590.1
|
AT1G76590
|
PLATZ transcription factor family protein |
| arTal_v1_Chr2_-_14146471_14146555 | 1.78 |
AT2G33380.2
AT2G33380.1 |
RD20
|
Caleosin-related family protein |
| arTal_v1_Chr5_-_5862462_5862475 | 1.78 |
AT5G17760.2
AT5G17760.1 |
AT5G17760
|
P-loop containing nucleoside triphosphate hydrolases superfamily protein |
| arTal_v1_Chr2_-_13862614_13862614 | 1.78 |
AT2G32680.1
|
RLP23
|
receptor like protein 23 |
| arTal_v1_Chr4_-_12018643_12018643 | 1.78 |
AT4G22920.2
|
NYE1
|
non-yellowing 1 |
| arTal_v1_Chr3_-_1063103_1063234 | 1.78 |
AT3G04070.2
AT3G04070.1 |
NAC047
|
NAC domain containing protein 47 |
| arTal_v1_Chr2_-_11233295_11233388 | 1.77 |
AT2G26400.1
AT2G26400.4 AT2G26400.2 AT2G26400.3 |
ARD3
|
acireductone dioxygenase 3 |
| arTal_v1_Chr3_-_4269691_4269691 | 1.76 |
AT3G13229.1
|
AT3G13229
|
kinesin-like protein (DUF868) |
| arTal_v1_Chr1_-_460696_460831 | 1.75 |
AT1G02310.1
AT1G02310.2 |
MAN1
|
Glycosyl hydrolase superfamily protein |
| arTal_v1_Chr3_-_23150606_23150606 | 1.75 |
AT3G62590.1
|
AT3G62590
|
alpha/beta-Hydrolases superfamily protein |
| arTal_v1_Chr1_-_11418464_11418464 | 1.75 |
AT1G31820.1
|
PUT1
|
Amino acid permease family protein |
| arTal_v1_Chr1_+_8164959_8164959 | 1.75 |
AT1G23040.3
AT1G23040.2 |
AT1G23040
|
hydroxyproline-rich glycoprotein family protein |
| arTal_v1_Chr5_-_763322_763322 | 1.74 |
AT5G03210.1
|
DIP2
|
E3 ubiquitin-protein ligase |
| arTal_v1_Chr4_-_14393381_14393381 | 1.74 |
AT4G29190.1
|
OZF2
|
Zinc finger C-x8-C-x5-C-x3-H type family protein |
| arTal_v1_Chr4_-_8273903_8273903 | 1.73 |
AT4G14365.1
|
XBAT34
|
hypothetical protein |
| arTal_v1_Chr5_+_12558154_12558154 | 1.73 |
AT5G33290.1
|
XGD1
|
xylogalacturonan deficient 1 |
| arTal_v1_Chr2_-_12905338_12905338 | 1.72 |
AT2G30250.1
|
WRKY25
|
WRKY DNA-binding protein 25 |
| arTal_v1_Chr1_-_977761_977911 | 1.72 |
AT1G03850.1
AT1G03850.2 AT1G03850.3 |
GRXS13
|
Glutaredoxin family protein |
| arTal_v1_Chr4_-_16942060_16942060 | 1.72 |
AT4G35750.1
|
AT4G35750
|
SEC14 cytosolic factor family protein / phosphoglyceride transfer family protein |
| arTal_v1_Chr2_-_852321_852321 | 1.72 |
AT2G02930.1
|
GSTF3
|
glutathione S-transferase F3 |
| arTal_v1_Chr5_-_9000345_9000345 | 1.71 |
AT5G25820.1
|
AT5G25820
|
Exostosin family protein |
| arTal_v1_Chr5_+_22467337_22467337 | 1.70 |
AT5G55450.1
|
AT5G55450
|
Bifunctional inhibitor/lipid-transfer protein/seed storage 2S albumin superfamily protein |
| arTal_v1_Chr3_+_18465318_18465318 | 1.70 |
AT3G49780.1
|
PSK4
|
phytosulfokine 4 precursor |
| arTal_v1_Chr3_-_10047453_10047453 | 1.70 |
AT3G27210.1
|
AT3G27210
|
hypothetical protein |
| arTal_v1_Chr2_-_15092353_15092415 | 1.70 |
AT2G35940.3
AT2G35940.1 |
BLH1
|
BEL1-like homeodomain 1 |
| arTal_v1_Chr5_+_8752684_8752684 | 1.69 |
AT5G25260.1
|
AT5G25260
|
SPFH/Band 7/PHB domain-containing membrane-associated protein family |
| arTal_v1_Chr1_+_202103_202136 | 1.68 |
AT1G01560.3
AT1G01560.2 AT1G01560.1 AT1G01560.4 |
MPK11
|
MAP kinase 11 |
| arTal_v1_Chr4_-_6718550_6718550 | 1.68 |
AT4G10960.1
|
UGE5
|
UDP-D-glucose/UDP-D-galactose 4-epimerase 5 |
| arTal_v1_Chr1_+_20617313_20617313 | 1.67 |
AT1G55265.1
|
AT1G55265
|
DUF538 family protein, putative (Protein of unknown function, DUF538) |
| arTal_v1_Chr2_+_9254378_9254378 | 1.67 |
AT2G21640.1
|
AT2G21640
|
marker for oxidative stress response protein |
| arTal_v1_Chr2_-_15092178_15092178 | 1.67 |
AT2G35940.2
|
BLH1
|
BEL1-like homeodomain 1 |
| arTal_v1_Chr1_+_7823066_7823066 | 1.67 |
AT1G22160.1
|
AT1G22160
|
senescence-associated family protein (DUF581) |
| arTal_v1_Chr5_-_1508927_1508927 | 1.66 |
AT5G05110.1
|
AT5G05110
|
Cystatin/monellin family protein |
| arTal_v1_Chr5_+_15501126_15501184 | 1.66 |
AT5G38710.1
AT5G38710.2 |
AT5G38710
|
Methylenetetrahydrofolate reductase family protein |
| arTal_v1_Chr1_-_20948969_20948969 | 1.65 |
AT1G56010.1
|
NAC1
|
NAC domain containing protein 1 |
| arTal_v1_Chr2_-_9538963_9538963 | 1.65 |
AT2G22470.1
|
AGP2
|
arabinogalactan protein 2 |
| arTal_v1_Chr3_-_7576623_7576721 | 1.65 |
AT3G21500.1
AT3G21500.3 AT3G21500.2 |
DXPS1
|
1-deoxy-D-xylulose 5-phosphate synthase 1 |
| arTal_v1_Chr3_+_21380648_21380648 | 1.65 |
AT3G57680.1
AT3G57680.2 |
AT3G57680
|
Peptidase S41 family protein |
| arTal_v1_Chr5_+_21383979_21384017 | 1.64 |
AT5G52750.2
AT5G52750.1 |
AT5G52750
|
Heavy metal transport/detoxification superfamily protein |
| arTal_v1_Chr2_+_12767585_12767585 | 1.64 |
AT2G29950.1
|
ELF4-L1
|
ELF4-like 1 |
| arTal_v1_Chr1_+_8164782_8164782 | 1.64 |
AT1G23040.1
|
AT1G23040
|
hydroxyproline-rich glycoprotein family protein |
| arTal_v1_Chr1_-_23690807_23690807 | 1.64 |
AT1G63840.1
|
AT1G63840
|
RING/U-box superfamily protein |
| arTal_v1_Chr2_-_7256831_7256831 | 1.63 |
AT2G16720.1
|
MYB7
|
myb domain protein 7 |
| arTal_v1_Chr1_+_28296886_28296886 | 1.63 |
AT1G75400.1
|
AT1G75400
|
RING/U-box superfamily protein |
| arTal_v1_Chr5_+_23003909_23003909 | 1.63 |
AT5G56870.1
|
BGAL4
|
beta-galactosidase 4 |
| arTal_v1_Chr1_-_23262002_23262002 | 1.62 |
AT1G62810.1
|
CuAO1
|
Copper amine oxidase family protein |
| arTal_v1_Chr1_+_7949476_7949476 | 1.62 |
AT1G22500.1
|
ATL15
|
RING/U-box superfamily protein |
| arTal_v1_Chr2_-_17882636_17882636 | 1.61 |
AT2G43000.1
AT2G43000.2 |
NAC042
|
NAC domain containing protein 42 |
| arTal_v1_Chr3_-_1660380_1660429 | 1.61 |
AT3G05675.3
AT3G05675.2 AT3G05675.1 |
AT3G05675
|
BTB/POZ domain-containing protein |
| arTal_v1_Chr5_-_5904380_5904380 | 1.61 |
AT5G17860.2
|
CAX7
|
calcium exchanger 7 |
| arTal_v1_Chr1_-_27119918_27119918 | 1.60 |
AT1G72070.1
|
AT1G72070
|
Chaperone DnaJ-domain superfamily protein |
| arTal_v1_Chr5_-_4183354_4183354 | 1.60 |
AT5G13170.1
|
SAG29
|
senescence-associated gene 29 |
| arTal_v1_Chr2_+_11247160_11247160 | 1.59 |
AT2G26440.1
|
AT2G26440
|
Plant invertase/pectin methylesterase inhibitor superfamily |
| arTal_v1_Chr5_-_5759817_5759817 | 1.59 |
AT5G17460.3
AT5G17460.2 AT5G17460.1 |
AT5G17460
|
glutamyl-tRNA (Gln) amidotransferase subunit C |
| arTal_v1_Chr5_-_25813620_25813648 | 1.59 |
AT5G64570.3
AT5G64570.2 AT5G64570.1 |
XYL4
|
beta-D-xylosidase 4 |
| arTal_v1_Chr5_-_5904532_5904532 | 1.59 |
AT5G17860.1
|
CAX7
|
calcium exchanger 7 |
| arTal_v1_Chr1_-_10806317_10806428 | 1.58 |
AT1G30500.1
AT1G30500.2 |
NF-YA7
|
nuclear factor Y, subunit A7 |
| arTal_v1_Chr1_-_6101983_6101983 | 1.57 |
AT1G17744.1
|
AT1G17744
|
hypothetical protein |
| arTal_v1_Chr3_-_11030906_11030906 | 1.57 |
AT3G29034.1
|
AT3G29034
|
transmembrane protein |
| arTal_v1_Chr3_+_4346330_4346330 | 1.57 |
AT3G13380.1
|
BRL3
|
BRI1-like 3 |
| arTal_v1_Chr2_-_16014991_16014991 | 1.57 |
AT2G38240.1
|
AT2G38240
|
2-oxoglutarate (2OG) and Fe(II)-dependent oxygenase superfamily protein |
| arTal_v1_Chr1_+_13220471_13220471 | 1.57 |
AT1G35710.1
|
AT1G35710
|
kinase family with leucine-rich repeat domain-containing protein |
| arTal_v1_Chr3_+_5705541_5705541 | 1.55 |
AT3G16770.1
|
EBP
|
ethylene-responsive element binding protein |
| arTal_v1_Chr5_+_23584789_23584789 | 1.55 |
AT5G58350.1
|
WNK4
|
with no lysine (K) kinase 4 |
| arTal_v1_Chr4_+_18029196_18029198 | 1.55 |
AT4G38560.1
AT4G38560.2 |
AT4G38560
|
phospholipase-like protein (PEARLI 4) family protein |
| arTal_v1_Chr1_+_12346138_12346232 | 1.54 |
AT1G33960.2
AT1G33960.1 |
AIG1
|
P-loop containing nucleoside triphosphate hydrolases superfamily protein |
| arTal_v1_Chr4_+_17597110_17597110 | 1.53 |
AT4G37430.1
|
CYP91A2
|
cytochrome P450, family 91, subfamily A, polypeptide 2 |
| arTal_v1_Chr1_+_12448543_12448726 | 1.53 |
AT1G34180.1
AT1G34180.3 AT1G34180.2 AT1G34180.4 |
NAC016
|
NAC domain containing protein 16 |
| arTal_v1_Chr2_-_243649_243649 | 1.52 |
AT2G01540.1
|
AT2G01540
|
Calcium-dependent lipid-binding (CaLB domain) family protein |
| arTal_v1_Chr5_+_4268532_4268532 | 1.52 |
AT5G13320.3
|
PBS3
|
Auxin-responsive GH3 family protein |
| arTal_v1_Chr3_-_4474364_4474378 | 1.52 |
AT3G13672.2
AT3G13672.1 |
AT3G13672
|
TRAF-like superfamily protein |
| arTal_v1_Chr5_-_16021916_16021916 | 1.52 |
AT5G40010.1
|
AATP1
|
AAA-ATPase 1 |
| arTal_v1_Chr1_-_8711578_8711578 | 1.52 |
AT1G24575.1
|
AT1G24575
|
DEAD-box ATP-dependent RNA helicase-like protein |
| arTal_v1_Chr5_+_9038860_9038860 | 1.52 |
AT5G25910.1
|
RLP52
|
receptor like protein 52 |
| arTal_v1_Chr1_-_24874758_24874766 | 1.51 |
AT1G66700.1
AT1G66700.3 |
PXMT1
|
S-adenosyl-L-methionine-dependent methyltransferases superfamily protein |
| arTal_v1_Chr1_+_24485046_24485101 | 1.51 |
AT1G65820.1
AT1G65820.3 AT1G65820.2 |
AT1G65820
|
microsomal glutathione s-transferase |
| arTal_v1_Chr5_-_23281271_23281271 | 1.51 |
AT5G57480.1
|
AT5G57480
|
P-loop containing nucleoside triphosphate hydrolases superfamily protein |
| arTal_v1_Chr3_-_2890520_2890574 | 1.51 |
AT3G09390.2
AT3G09390.1 |
MT2A
|
metallothionein 2A |
| arTal_v1_Chr5_-_3405571_3405571 | 1.50 |
AT5G10770.1
|
AT5G10770
|
Eukaryotic aspartyl protease family protein |
| arTal_v1_Chr2_-_15425129_15425129 | 1.50 |
AT2G36800.1
|
DOGT1
|
don-glucosyltransferase 1 |
| arTal_v1_Chr4_+_13959872_13959970 | 1.50 |
AT4G28085.1
AT4G28085.2 |
AT4G28085
|
transmembrane protein |
| arTal_v1_Chr1_-_10139228_10139228 | 1.50 |
AT1G29050.1
|
TBL38
|
TRICHOME BIREFRINGENCE-LIKE 38 |
| arTal_v1_Chr3_-_18241341_18241341 | 1.50 |
AT3G49210.2
|
AT3G49210
|
O-acyltransferase (WSD1-like) family protein |
| arTal_v1_Chr1_-_24362054_24362054 | 1.50 |
AT1G65520.1
|
ECI1
|
delta(3), delta(2)-enoyl CoA isomerase 1 |
| arTal_v1_Chr5_+_2854857_2854857 | 1.50 |
AT5G08760.1
|
AT5G08760
|
transmembrane protein |
| arTal_v1_Chr2_-_8850111_8850111 | 1.50 |
AT2G20560.1
|
AT2G20560
|
DNAJ heat shock family protein |
| arTal_v1_Chr5_+_4268316_4268316 | 1.49 |
AT5G13320.2
|
PBS3
|
Auxin-responsive GH3 family protein |
| arTal_v1_Chr5_-_19299174_19299174 | 1.49 |
AT5G47590.1
AT5G47590.2 |
AT5G47590
|
Heat shock protein HSP20/alpha crystallin family |
| arTal_v1_Chr1_-_28927391_28927391 | 1.49 |
AT1G76980.2
AT1G76980.1 |
AT1G76980
|
patatin-like phospholipase domain protein |
| arTal_v1_Chr1_+_9748506_9748506 | 1.49 |
AT1G27980.1
|
DPL1
|
dihydrosphingosine phosphate lyase |
| arTal_v1_Chr1_+_22824414_22824414 | 1.48 |
AT1G61800.2
AT1G61800.1 |
GPT2
|
glucose-6-phosphate/phosphate translocator 2 |
| arTal_v1_Chr3_-_9632009_9632145 | 1.47 |
AT3G26280.1
AT3G26280.2 |
CYP71B4
|
cytochrome P450, family 71, subfamily B, polypeptide 4 |
| arTal_v1_Chr1_-_30142697_30142697 | 1.47 |
AT1G80130.1
|
AT1G80130
|
Tetratricopeptide repeat (TPR)-like superfamily protein |
| arTal_v1_Chr3_-_1678968_1679061 | 1.47 |
AT3G05690.2
AT3G05690.1 |
NF-YA2
|
nuclear factor Y, subunit A2 |
| arTal_v1_Chr1_-_26338818_26338818 | 1.47 |
AT1G69930.1
|
GSTU11
|
glutathione S-transferase TAU 11 |
| arTal_v1_Chr3_-_8119490_8119490 | 1.47 |
AT3G22910.1
|
AT3G22910
|
ATPase E1-E2 type family protein / haloacid dehalogenase-like hydrolase family protein |
| arTal_v1_Chr4_+_12463312_12463312 | 1.47 |
AT4G24000.2
|
CSLG2
|
cellulose synthase like G2 |
| arTal_v1_Chr4_+_13653579_13653579 | 1.47 |
AT4G27260.1
|
WES1
|
Auxin-responsive GH3 family protein |
| arTal_v1_Chr1_+_25487682_25487714 | 1.47 |
AT1G67980.1
AT1G67980.2 |
CCOAMT
|
caffeoyl-CoA 3-O-methyltransferase |
| arTal_v1_Chr2_+_11263889_11263889 | 1.47 |
AT2G26480.1
|
UGT76D1
|
UDP-glucosyl transferase 76D1 |
| arTal_v1_Chr1_+_24468770_24468804 | 1.46 |
AT1G65790.2
AT1G65790.1 AT1G65790.3 |
RK1
|
receptor kinase 1 |
| arTal_v1_Chr5_-_763480_763480 | 1.46 |
AT5G03210.2
|
DIP2
|
E3 ubiquitin-protein ligase |
| arTal_v1_Chr4_-_10714745_10714745 | 1.46 |
AT4G19700.1
|
RING
|
SBP (S-ribonuclease binding protein) family protein |
| arTal_v1_Chr3_+_6097201_6097201 | 1.46 |
AT3G17820.1
|
GLN1.3
|
glutamine synthetase 1.3 |
| arTal_v1_Chr1_-_19278603_19278798 | 1.46 |
AT1G51890.4
AT1G51890.5 AT1G51890.3 AT1G51890.2 AT1G51890.1 |
AT1G51890
|
Leucine-rich repeat protein kinase family protein |
| arTal_v1_Chr4_-_437591_437605 | 1.45 |
AT4G01010.1
AT4G01010.2 |
CNGC13
|
cyclic nucleotide-gated channel 13 |
| arTal_v1_Chr3_-_18241524_18241524 | 1.45 |
AT3G49210.1
|
AT3G49210
|
O-acyltransferase (WSD1-like) family protein |
| arTal_v1_Chr1_+_22198266_22198266 | 1.44 |
AT1G60190.1
|
PUB19
|
ARM repeat superfamily protein |
| arTal_v1_Chr1_+_2442570_2442570 | 1.44 |
AT1G07900.1
|
LBD1
|
LOB domain-containing protein 1 |
| arTal_v1_Chr2_-_7910040_7910040 | 1.44 |
AT2G18170.1
|
MPK7
|
MAP kinase 7 |
| arTal_v1_Chr2_+_7516330_7516330 | 1.44 |
AT2G17290.2
AT2G17290.1 |
CPK6
|
Calcium-dependent protein kinase family protein |
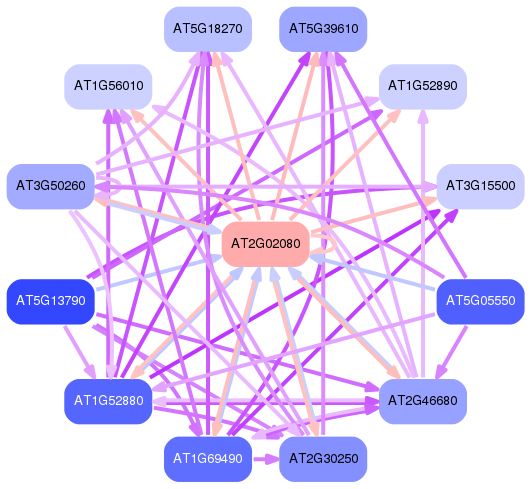
Network of associatons between targets according to the STRING database.

First level regulatory network of AT2G02080
Gene Ontology Analysis
Gene overrepresentation in biological process category:
| Log-likelihood per target | Total log-likelihood | Term | Description |
|---|---|---|---|
| 1.5 | 4.4 | GO:0016046 | detection of fungus(GO:0016046) |
| 1.0 | 5.1 | GO:0051091 | positive regulation of sequence-specific DNA binding transcription factor activity(GO:0051091) |
| 1.0 | 5.0 | GO:0010201 | response to continuous far red light stimulus by the high-irradiance response system(GO:0010201) |
| 1.0 | 4.0 | GO:0010351 | lithium ion transport(GO:0010351) |
| 1.0 | 2.9 | GO:0002215 | defense response to nematode(GO:0002215) |
| 0.9 | 3.6 | GO:0010272 | response to silver ion(GO:0010272) |
| 0.8 | 2.5 | GO:0015840 | urea transport(GO:0015840) |
| 0.8 | 2.3 | GO:0031115 | negative regulation of microtubule polymerization(GO:0031115) |
| 0.7 | 4.5 | GO:0051176 | positive regulation of sulfur metabolic process(GO:0051176) |
| 0.7 | 2.2 | GO:1902000 | homogentisate metabolic process(GO:1901999) homogentisate catabolic process(GO:1902000) |
| 0.7 | 2.1 | GO:1902347 | response to strigolactone(GO:1902347) |
| 0.7 | 1.4 | GO:0035865 | cellular response to potassium ion(GO:0035865) |
| 0.7 | 1.3 | GO:0043290 | sesquiterpenoid catabolic process(GO:0016107) apocarotenoid catabolic process(GO:0043290) abscisic acid catabolic process(GO:0046345) |
| 0.7 | 2.0 | GO:0016118 | tetraterpenoid catabolic process(GO:0016110) carotenoid catabolic process(GO:0016118) xanthophyll catabolic process(GO:0016124) |
| 0.6 | 2.6 | GO:0048838 | release of seed from dormancy(GO:0048838) exit from dormancy(GO:0097438) |
| 0.6 | 1.9 | GO:0015696 | ammonium transport(GO:0015696) |
| 0.6 | 3.0 | GO:0006809 | nitric oxide biosynthetic process(GO:0006809) |
| 0.6 | 1.8 | GO:0009221 | pyrimidine deoxyribonucleoside triphosphate metabolic process(GO:0009211) pyrimidine deoxyribonucleotide metabolic process(GO:0009219) pyrimidine deoxyribonucleotide biosynthetic process(GO:0009221) 2'-deoxyribonucleotide biosynthetic process(GO:0009265) deoxyribose phosphate biosynthetic process(GO:0046385) |
| 0.6 | 1.8 | GO:0032491 | detection of molecule of fungal origin(GO:0032491) |
| 0.6 | 3.5 | GO:0080187 | floral organ senescence(GO:0080187) |
| 0.6 | 4.1 | GO:0006597 | spermine biosynthetic process(GO:0006597) |
| 0.6 | 1.7 | GO:0017014 | protein nitrosylation(GO:0017014) peptidyl-cysteine S-nitrosylation(GO:0018119) peptidyl-cysteine S-trans-nitrosylation(GO:0035606) |
| 0.6 | 1.7 | GO:0015717 | triose phosphate transport(GO:0015717) triose phosphate transmembrane transport(GO:0035436) |
| 0.6 | 1.1 | GO:0018874 | benzoate metabolic process(GO:0018874) |
| 0.6 | 2.8 | GO:1902418 | (+)-abscisic acid D-glucopyranosyl ester transmembrane transport(GO:1902418) |
| 0.5 | 1.5 | GO:0010597 | green leaf volatile biosynthetic process(GO:0010597) |
| 0.5 | 1.5 | GO:0009945 | radial axis specification(GO:0009945) |
| 0.5 | 6.5 | GO:1900057 | positive regulation of leaf senescence(GO:1900057) |
| 0.5 | 2.5 | GO:0015846 | polyamine transport(GO:0015846) |
| 0.5 | 2.0 | GO:0033306 | phytol metabolic process(GO:0033306) |
| 0.5 | 1.0 | GO:0019336 | phenol-containing compound catabolic process(GO:0019336) |
| 0.5 | 3.9 | GO:0030149 | sphingolipid catabolic process(GO:0030149) |
| 0.5 | 3.8 | GO:0009939 | positive regulation of gibberellic acid mediated signaling pathway(GO:0009939) |
| 0.5 | 2.8 | GO:0015785 | UDP-galactose transport(GO:0015785) UDP-galactose transmembrane transport(GO:0072334) |
| 0.5 | 1.8 | GO:0033512 | lysine catabolic process(GO:0006554) L-lysine catabolic process to acetyl-CoA(GO:0019474) L-lysine catabolic process(GO:0019477) L-lysine catabolic process to acetyl-CoA via saccharopine(GO:0033512) L-lysine metabolic process(GO:0046440) |
| 0.5 | 0.5 | GO:0019482 | beta-alanine metabolic process(GO:0019482) |
| 0.5 | 2.7 | GO:0043090 | amino acid import(GO:0043090) |
| 0.4 | 1.3 | GO:0015802 | basic amino acid transport(GO:0015802) |
| 0.4 | 5.6 | GO:1900056 | negative regulation of leaf senescence(GO:1900056) |
| 0.4 | 1.7 | GO:0019322 | pentose biosynthetic process(GO:0019322) arabinose biosynthetic process(GO:0019567) |
| 0.4 | 1.2 | GO:0010446 | response to alkaline pH(GO:0010446) |
| 0.4 | 3.1 | GO:0042360 | vitamin E biosynthetic process(GO:0010189) vitamin E metabolic process(GO:0042360) |
| 0.4 | 0.4 | GO:0075733 | intracellular transport of virus(GO:0075733) |
| 0.4 | 0.4 | GO:0034058 | endosomal vesicle fusion(GO:0034058) |
| 0.4 | 1.1 | GO:0060776 | simple leaf morphogenesis(GO:0060776) |
| 0.4 | 1.9 | GO:0006531 | 2-oxoglutarate metabolic process(GO:0006103) aspartate metabolic process(GO:0006531) |
| 0.4 | 1.1 | GO:1904062 | regulation of potassium ion transmembrane transport(GO:1901379) regulation of cation transmembrane transport(GO:1904062) |
| 0.4 | 1.4 | GO:0016099 | monoterpenoid metabolic process(GO:0016098) monoterpenoid biosynthetic process(GO:0016099) |
| 0.4 | 1.4 | GO:0046786 | viral replication complex formation and maintenance(GO:0046786) |
| 0.4 | 2.1 | GO:0043409 | negative regulation of MAP kinase activity(GO:0043407) negative regulation of MAPK cascade(GO:0043409) |
| 0.3 | 2.1 | GO:0034087 | establishment of mitotic sister chromatid cohesion(GO:0034087) establishment of protein localization to chromosome(GO:0070199) rDNA condensation(GO:0070550) establishment of protein localization to chromatin(GO:0071169) transcriptional activation by promoter-enhancer looping(GO:0071733) gene looping(GO:0090202) dsDNA loop formation(GO:0090579) |
| 0.3 | 0.3 | GO:0010617 | circadian regulation of calcium ion oscillation(GO:0010617) |
| 0.3 | 3.4 | GO:0090158 | endoplasmic reticulum membrane organization(GO:0090158) |
| 0.3 | 3.0 | GO:0010188 | response to microbial phytotoxin(GO:0010188) |
| 0.3 | 1.0 | GO:0000050 | urea cycle(GO:0000050) |
| 0.3 | 1.3 | GO:0034720 | histone H3-K4 demethylation(GO:0034720) |
| 0.3 | 0.3 | GO:0006808 | regulation of nitrogen utilization(GO:0006808) |
| 0.3 | 4.5 | GO:0001676 | long-chain fatty acid metabolic process(GO:0001676) |
| 0.3 | 1.6 | GO:0015824 | proline transport(GO:0015824) |
| 0.3 | 0.9 | GO:0090213 | regulation of radial pattern formation(GO:0090213) |
| 0.3 | 3.5 | GO:0070370 | cellular heat acclimation(GO:0070370) |
| 0.3 | 3.1 | GO:0031204 | posttranslational protein targeting to membrane, translocation(GO:0031204) |
| 0.3 | 0.9 | GO:0034051 | negative regulation of plant-type hypersensitive response(GO:0034051) |
| 0.3 | 0.9 | GO:0045002 | DNA double-strand break processing involved in repair via single-strand annealing(GO:0010792) double-strand break repair via single-strand annealing(GO:0045002) |
| 0.3 | 1.8 | GO:1901332 | negative regulation of lateral root development(GO:1901332) |
| 0.3 | 0.9 | GO:0010322 | regulation of isopentenyl diphosphate biosynthetic process, methylerythritol 4-phosphate pathway(GO:0010322) |
| 0.3 | 3.6 | GO:0048317 | seed morphogenesis(GO:0048317) |
| 0.3 | 0.9 | GO:0046203 | spermidine catabolic process(GO:0046203) |
| 0.3 | 0.6 | GO:0006501 | C-terminal protein lipidation(GO:0006501) |
| 0.3 | 2.7 | GO:0050691 | regulation of defense response to virus by host(GO:0050691) |
| 0.3 | 0.9 | GO:0048833 | specification of organ number(GO:0048832) specification of floral organ number(GO:0048833) |
| 0.3 | 5.3 | GO:1900426 | positive regulation of defense response to bacterium(GO:1900426) |
| 0.3 | 1.8 | GO:0071267 | L-methionine biosynthetic process from methylthioadenosine(GO:0019509) amino acid salvage(GO:0043102) L-methionine salvage(GO:0071267) |
| 0.3 | 2.1 | GO:0009745 | sucrose mediated signaling(GO:0009745) |
| 0.3 | 0.9 | GO:1902289 | negative regulation of defense response to oomycetes(GO:1902289) |
| 0.3 | 1.8 | GO:0006145 | purine nucleobase catabolic process(GO:0006145) |
| 0.3 | 0.6 | GO:1901334 | lactone metabolic process(GO:1901334) lactone biosynthetic process(GO:1901336) strigolactone metabolic process(GO:1901600) strigolactone biosynthetic process(GO:1901601) |
| 0.3 | 1.2 | GO:0010336 | gibberellic acid homeostasis(GO:0010336) |
| 0.3 | 4.6 | GO:0015996 | chlorophyll catabolic process(GO:0015996) |
| 0.3 | 2.0 | GO:2000068 | regulation of defense response to insect(GO:2000068) |
| 0.3 | 2.5 | GO:0042753 | positive regulation of circadian rhythm(GO:0042753) |
| 0.3 | 1.1 | GO:0045332 | phospholipid translocation(GO:0045332) |
| 0.3 | 1.1 | GO:0035494 | SNARE complex disassembly(GO:0035494) |
| 0.3 | 3.0 | GO:0006878 | cellular copper ion homeostasis(GO:0006878) |
| 0.3 | 2.5 | GO:0051410 | detoxification of nitrogen compound(GO:0051410) |
| 0.3 | 0.5 | GO:0032957 | inositol trisphosphate metabolic process(GO:0032957) |
| 0.3 | 1.3 | GO:0080024 | indolebutyric acid metabolic process(GO:0080024) |
| 0.3 | 2.7 | GO:0009608 | response to symbiont(GO:0009608) |
| 0.3 | 1.1 | GO:0055073 | cadmium ion homeostasis(GO:0055073) |
| 0.3 | 1.0 | GO:0048480 | stigma development(GO:0048480) |
| 0.3 | 1.3 | GO:0009590 | detection of gravity(GO:0009590) |
| 0.3 | 5.4 | GO:0010072 | primary shoot apical meristem specification(GO:0010072) |
| 0.3 | 1.8 | GO:0030007 | cellular potassium ion homeostasis(GO:0030007) |
| 0.3 | 1.3 | GO:0048577 | negative regulation of short-day photoperiodism, flowering(GO:0048577) |
| 0.2 | 2.2 | GO:1902456 | regulation of stomatal opening(GO:1902456) |
| 0.2 | 1.0 | GO:0050792 | regulation of symbiosis, encompassing mutualism through parasitism(GO:0043903) regulation of viral process(GO:0050792) |
| 0.2 | 1.2 | GO:0019566 | arabinose metabolic process(GO:0019566) |
| 0.2 | 1.5 | GO:0052317 | camalexin biosynthetic process(GO:0010120) camalexin metabolic process(GO:0052317) |
| 0.2 | 1.4 | GO:0005513 | detection of calcium ion(GO:0005513) |
| 0.2 | 0.9 | GO:0097054 | L-glutamate biosynthetic process(GO:0097054) |
| 0.2 | 2.6 | GO:0045116 | protein neddylation(GO:0045116) |
| 0.2 | 0.2 | GO:0042178 | xenobiotic catabolic process(GO:0042178) |
| 0.2 | 0.9 | GO:0015692 | lead ion transport(GO:0015692) |
| 0.2 | 0.7 | GO:0006984 | ER-nucleus signaling pathway(GO:0006984) |
| 0.2 | 9.4 | GO:0009789 | positive regulation of abscisic acid-activated signaling pathway(GO:0009789) |
| 0.2 | 0.9 | GO:0009268 | response to pH(GO:0009268) |
| 0.2 | 2.0 | GO:0080183 | response to photooxidative stress(GO:0080183) |
| 0.2 | 2.6 | GO:0016558 | protein import into peroxisome matrix(GO:0016558) |
| 0.2 | 1.3 | GO:0070920 | regulation of production of small RNA involved in gene silencing by RNA(GO:0070920) |
| 0.2 | 0.7 | GO:0071422 | thiosulfate transport(GO:0015709) succinate transmembrane transport(GO:0071422) |
| 0.2 | 3.1 | GO:0010262 | somatic embryogenesis(GO:0010262) |
| 0.2 | 0.9 | GO:0010148 | transpiration(GO:0010148) |
| 0.2 | 2.8 | GO:0010050 | vegetative phase change(GO:0010050) |
| 0.2 | 1.7 | GO:0045903 | positive regulation of translational fidelity(GO:0045903) |
| 0.2 | 1.1 | GO:0015940 | pantothenate metabolic process(GO:0015939) pantothenate biosynthetic process(GO:0015940) |
| 0.2 | 1.3 | GO:1900425 | negative regulation of defense response to bacterium(GO:1900425) |
| 0.2 | 0.6 | GO:0019365 | pyridine nucleotide salvage(GO:0019365) |
| 0.2 | 0.6 | GO:0009584 | detection of visible light(GO:0009584) |
| 0.2 | 0.6 | GO:0010185 | regulation of cellular defense response(GO:0010185) |
| 0.2 | 1.4 | GO:0006542 | glutamine biosynthetic process(GO:0006542) |
| 0.2 | 1.6 | GO:0009061 | anaerobic respiration(GO:0009061) |
| 0.2 | 1.2 | GO:0006624 | vacuolar protein processing(GO:0006624) |
| 0.2 | 1.2 | GO:2000105 | positive regulation of DNA endoreduplication(GO:0032877) positive regulation of DNA-dependent DNA replication(GO:2000105) |
| 0.2 | 1.8 | GO:1903829 | positive regulation of protein transport(GO:0051222) positive regulation of intracellular protein transport(GO:0090316) positive regulation of cellular protein localization(GO:1903829) positive regulation of establishment of protein localization(GO:1904951) |
| 0.2 | 0.4 | GO:0080182 | histone H3-K4 trimethylation(GO:0080182) |
| 0.2 | 0.6 | GO:0046459 | short-chain fatty acid metabolic process(GO:0046459) |
| 0.2 | 2.2 | GO:0010161 | red light signaling pathway(GO:0010161) |
| 0.2 | 0.6 | GO:0010289 | homogalacturonan biosynthetic process(GO:0010289) |
| 0.2 | 0.6 | GO:2000785 | regulation of macroautophagy(GO:0016241) regulation of autophagosome assembly(GO:2000785) |
| 0.2 | 0.6 | GO:0002188 | translation reinitiation(GO:0002188) |
| 0.2 | 8.4 | GO:0090487 | toxin catabolic process(GO:0009407) secondary metabolite catabolic process(GO:0090487) |
| 0.2 | 0.9 | GO:0051601 | exocyst localization(GO:0051601) |
| 0.2 | 1.5 | GO:0032456 | endocytic recycling(GO:0032456) |
| 0.2 | 0.4 | GO:1902222 | L-phenylalanine catabolic process(GO:0006559) erythrose 4-phosphate/phosphoenolpyruvate family amino acid catabolic process(GO:1902222) |
| 0.2 | 2.0 | GO:0043162 | ubiquitin-dependent protein catabolic process via the multivesicular body sorting pathway(GO:0043162) |
| 0.2 | 0.6 | GO:0000973 | posttranscriptional tethering of RNA polymerase II gene DNA at nuclear periphery(GO:0000973) |
| 0.2 | 0.7 | GO:0002164 | nematode larval development(GO:0002119) larval development(GO:0002164) regulation of nematode larval development(GO:0061062) |
| 0.2 | 0.9 | GO:0010395 | rhamnogalacturonan I metabolic process(GO:0010395) |
| 0.2 | 6.2 | GO:0035304 | regulation of protein dephosphorylation(GO:0035304) |
| 0.2 | 2.9 | GO:0015770 | sucrose transport(GO:0015770) |
| 0.2 | 0.5 | GO:0036115 | fatty-acyl-CoA catabolic process(GO:0036115) malonyl-CoA catabolic process(GO:2001294) |
| 0.2 | 0.4 | GO:0006527 | arginine catabolic process(GO:0006527) |
| 0.2 | 0.7 | GO:0055075 | potassium ion homeostasis(GO:0055075) |
| 0.2 | 0.5 | GO:0045901 | positive regulation of translational elongation(GO:0045901) positive regulation of translational termination(GO:0045905) |
| 0.2 | 0.5 | GO:0022610 | cell adhesion(GO:0007155) biological adhesion(GO:0022610) |
| 0.2 | 0.9 | GO:0033591 | response to L-ascorbic acid(GO:0033591) |
| 0.2 | 6.9 | GO:0072666 | protein targeting to vacuole(GO:0006623) protein localization to vacuole(GO:0072665) establishment of protein localization to vacuole(GO:0072666) |
| 0.2 | 0.5 | GO:0018065 | protein-cofactor linkage(GO:0018065) |
| 0.2 | 1.1 | GO:0010438 | cellular response to sulfur starvation(GO:0010438) |
| 0.2 | 0.5 | GO:0008333 | lysosomal transport(GO:0007041) endosome to lysosome transport(GO:0008333) |
| 0.2 | 0.9 | GO:0048442 | sepal development(GO:0048442) flower calyx development(GO:0048464) |
| 0.2 | 0.5 | GO:1990069 | stomatal opening(GO:1990069) |
| 0.2 | 1.0 | GO:1990118 | sodium ion transmembrane transport(GO:0035725) sodium ion import(GO:0097369) inorganic cation import into cell(GO:0098659) sodium ion import across plasma membrane(GO:0098719) inorganic ion import into cell(GO:0099587) sodium ion import into cell(GO:1990118) |
| 0.2 | 1.4 | GO:0031222 | arabinan catabolic process(GO:0031222) |
| 0.2 | 2.9 | GO:0019374 | galactolipid metabolic process(GO:0019374) |
| 0.2 | 1.4 | GO:0045851 | pH reduction(GO:0045851) |
| 0.2 | 0.9 | GO:0006183 | GTP biosynthetic process(GO:0006183) |
| 0.2 | 2.2 | GO:0071712 | ER-associated misfolded protein catabolic process(GO:0071712) |
| 0.2 | 1.2 | GO:0006591 | ornithine metabolic process(GO:0006591) |
| 0.2 | 0.5 | GO:0033120 | positive regulation of RNA splicing(GO:0033120) positive regulation of mRNA processing(GO:0050685) positive regulation of mRNA metabolic process(GO:1903313) |
| 0.2 | 1.5 | GO:0006308 | DNA catabolic process(GO:0006308) |
| 0.2 | 0.8 | GO:0046218 | tryptophan catabolic process(GO:0006569) indolalkylamine catabolic process(GO:0046218) |
| 0.2 | 0.5 | GO:0045694 | regulation of embryo sac egg cell differentiation(GO:0045694) |
| 0.2 | 6.2 | GO:0043562 | cellular response to nitrogen levels(GO:0043562) |
| 0.2 | 1.0 | GO:0009970 | cellular response to sulfate starvation(GO:0009970) |
| 0.2 | 0.8 | GO:0010601 | positive regulation of auxin biosynthetic process(GO:0010601) |
| 0.2 | 2.3 | GO:0080027 | response to herbivore(GO:0080027) |
| 0.2 | 0.5 | GO:0010184 | cytokinin transport(GO:0010184) |
| 0.2 | 6.8 | GO:2000022 | regulation of jasmonic acid mediated signaling pathway(GO:2000022) |
| 0.2 | 0.8 | GO:0009759 | indole glucosinolate biosynthetic process(GO:0009759) |
| 0.2 | 2.1 | GO:0080036 | regulation of cytokinin-activated signaling pathway(GO:0080036) |
| 0.2 | 3.6 | GO:0009269 | response to desiccation(GO:0009269) |
| 0.2 | 0.9 | GO:0010076 | maintenance of floral meristem identity(GO:0010076) |
| 0.2 | 1.2 | GO:0097428 | protein maturation by iron-sulfur cluster transfer(GO:0097428) |
| 0.2 | 0.8 | GO:0009800 | cinnamic acid biosynthetic process(GO:0009800) |
| 0.2 | 3.4 | GO:0030968 | endoplasmic reticulum unfolded protein response(GO:0030968) |
| 0.2 | 0.8 | GO:0007231 | osmosensory signaling pathway(GO:0007231) |
| 0.2 | 2.9 | GO:0071545 | inositol phosphate dephosphorylation(GO:0046855) inositol phosphate catabolic process(GO:0071545) |
| 0.2 | 0.5 | GO:0017145 | stem cell division(GO:0017145) |
| 0.2 | 0.6 | GO:0080001 | mucilage extrusion from seed coat(GO:0080001) |
| 0.1 | 0.4 | GO:0035246 | peptidyl-arginine methylation, to asymmetrical-dimethyl arginine(GO:0019919) peptidyl-arginine N-methylation(GO:0035246) peptidyl-arginine omega-N-methylation(GO:0035247) |
| 0.1 | 1.6 | GO:1902074 | response to salt(GO:1902074) |
| 0.1 | 1.3 | GO:1903830 | magnesium ion transmembrane transport(GO:1903830) |
| 0.1 | 0.6 | GO:0042256 | mature ribosome assembly(GO:0042256) |
| 0.1 | 0.4 | GO:1904031 | positive regulation of cyclin-dependent protein serine/threonine kinase activity(GO:0045737) positive regulation of cyclin-dependent protein kinase activity(GO:1904031) |
| 0.1 | 0.6 | GO:1900458 | negative regulation of brassinosteroid mediated signaling pathway(GO:1900458) |
| 0.1 | 0.7 | GO:0000965 | mitochondrial RNA 3'-end processing(GO:0000965) |
| 0.1 | 0.6 | GO:0010587 | miRNA catabolic process(GO:0010587) |
| 0.1 | 0.4 | GO:2000072 | regulation of defense response to fungus, incompatible interaction(GO:2000072) |
| 0.1 | 3.0 | GO:0071230 | cellular response to amino acid stimulus(GO:0071230) |
| 0.1 | 0.4 | GO:2000029 | regulation of proanthocyanidin biosynthetic process(GO:2000029) |
| 0.1 | 3.3 | GO:0009682 | induced systemic resistance(GO:0009682) |
| 0.1 | 0.6 | GO:0015693 | magnesium ion transport(GO:0015693) |
| 0.1 | 0.6 | GO:0048587 | regulation of short-day photoperiodism, flowering(GO:0048587) |
| 0.1 | 1.7 | GO:0010077 | maintenance of inflorescence meristem identity(GO:0010077) |
| 0.1 | 0.1 | GO:0090355 | positive regulation of auxin metabolic process(GO:0090355) |
| 0.1 | 1.1 | GO:0046685 | response to arsenic-containing substance(GO:0046685) |
| 0.1 | 4.3 | GO:0071804 | cellular potassium ion transport(GO:0071804) potassium ion transmembrane transport(GO:0071805) |
| 0.1 | 1.1 | GO:0007584 | response to nutrient(GO:0007584) |
| 0.1 | 4.3 | GO:0009833 | plant-type primary cell wall biogenesis(GO:0009833) |
| 0.1 | 0.6 | GO:0070509 | calcium ion import(GO:0070509) |
| 0.1 | 0.6 | GO:0006182 | cGMP biosynthetic process(GO:0006182) cGMP metabolic process(GO:0046068) |
| 0.1 | 1.7 | GO:0042343 | indole glucosinolate metabolic process(GO:0042343) |
| 0.1 | 2.7 | GO:0071472 | cellular response to salt stress(GO:0071472) |
| 0.1 | 1.8 | GO:0009937 | regulation of gibberellic acid mediated signaling pathway(GO:0009937) |
| 0.1 | 0.3 | GO:0043617 | cellular response to sucrose starvation(GO:0043617) |
| 0.1 | 0.9 | GO:0032781 | positive regulation of ATPase activity(GO:0032781) |
| 0.1 | 1.1 | GO:0031930 | mitochondria-nucleus signaling pathway(GO:0031930) |
| 0.1 | 0.5 | GO:1900384 | regulation of flavonol biosynthetic process(GO:1900384) |
| 0.1 | 0.5 | GO:0016320 | endoplasmic reticulum membrane fusion(GO:0016320) |
| 0.1 | 2.0 | GO:0009098 | leucine biosynthetic process(GO:0009098) |
| 0.1 | 0.4 | GO:0010507 | negative regulation of autophagy(GO:0010507) |
| 0.1 | 0.7 | GO:0042149 | cellular response to glucose starvation(GO:0042149) |
| 0.1 | 15.9 | GO:0009751 | response to salicylic acid(GO:0009751) |
| 0.1 | 1.5 | GO:0060261 | regulation of transcription initiation from RNA polymerase II promoter(GO:0060260) positive regulation of transcription initiation from RNA polymerase II promoter(GO:0060261) positive regulation of DNA-templated transcription, initiation(GO:2000144) |
| 0.1 | 1.7 | GO:0000165 | MAPK cascade(GO:0000165) |
| 0.1 | 0.4 | GO:0051098 | regulation of binding(GO:0051098) |
| 0.1 | 0.4 | GO:0017062 | respiratory chain complex III assembly(GO:0017062) mitochondrial respiratory chain complex III assembly(GO:0034551) mitochondrial respiratory chain complex III biogenesis(GO:0097033) |
| 0.1 | 7.2 | GO:0009749 | response to glucose(GO:0009749) |
| 0.1 | 1.0 | GO:0008535 | respiratory chain complex IV assembly(GO:0008535) mitochondrial respiratory chain complex IV assembly(GO:0033617) mitochondrial respiratory chain complex IV biogenesis(GO:0097034) |
| 0.1 | 0.3 | GO:0010213 | non-photoreactive DNA repair(GO:0010213) |
| 0.1 | 3.6 | GO:0006635 | fatty acid beta-oxidation(GO:0006635) |
| 0.1 | 0.7 | GO:0042276 | error-prone translesion synthesis(GO:0042276) |
| 0.1 | 0.7 | GO:0000082 | G1/S transition of mitotic cell cycle(GO:0000082) |
| 0.1 | 1.0 | GO:0097035 | regulation of membrane lipid distribution(GO:0097035) |
| 0.1 | 1.3 | GO:0015749 | monosaccharide transport(GO:0015749) |
| 0.1 | 0.6 | GO:0060919 | auxin influx(GO:0060919) |
| 0.1 | 1.9 | GO:0006857 | oligopeptide transport(GO:0006857) peptide transport(GO:0015833) |
| 0.1 | 0.4 | GO:0070922 | miRNA loading onto RISC involved in gene silencing by miRNA(GO:0035280) small RNA loading onto RISC(GO:0070922) |
| 0.1 | 0.4 | GO:0010586 | miRNA metabolic process(GO:0010586) |
| 0.1 | 1.8 | GO:0000266 | mitochondrial fission(GO:0000266) |
| 0.1 | 0.8 | GO:0048363 | mucilage pectin metabolic process(GO:0048363) |
| 0.1 | 0.4 | GO:0006513 | protein monoubiquitination(GO:0006513) |
| 0.1 | 11.4 | GO:0007568 | aging(GO:0007568) |
| 0.1 | 0.7 | GO:0048530 | fruit morphogenesis(GO:0048530) |
| 0.1 | 1.0 | GO:0006086 | acetyl-CoA biosynthetic process from pyruvate(GO:0006086) |
| 0.1 | 2.9 | GO:0098754 | detoxification(GO:0098754) |
| 0.1 | 3.4 | GO:0016144 | S-glycoside biosynthetic process(GO:0016144) glycosinolate biosynthetic process(GO:0019758) glucosinolate biosynthetic process(GO:0019761) |
| 0.1 | 0.9 | GO:0044375 | regulation of peroxisome size(GO:0044375) |
| 0.1 | 0.2 | GO:0032025 | response to cobalt ion(GO:0032025) |
| 0.1 | 0.8 | GO:0000304 | response to singlet oxygen(GO:0000304) |
| 0.1 | 2.0 | GO:0050779 | RNA destabilization(GO:0050779) mRNA destabilization(GO:0061157) |
| 0.1 | 0.4 | GO:0080119 | ER body organization(GO:0080119) |
| 0.1 | 0.2 | GO:0009261 | purine ribonucleotide catabolic process(GO:0009154) ribonucleotide catabolic process(GO:0009261) coenzyme A catabolic process(GO:0015938) nucleoside bisphosphate catabolic process(GO:0033869) ribonucleoside bisphosphate catabolic process(GO:0034031) purine nucleoside bisphosphate catabolic process(GO:0034034) |
| 0.1 | 0.5 | GO:0006307 | DNA dealkylation involved in DNA repair(GO:0006307) |
| 0.1 | 0.5 | GO:0071108 | protein K63-linked deubiquitination(GO:0070536) protein K48-linked deubiquitination(GO:0071108) |
| 0.1 | 0.8 | GO:1901527 | abscisic acid-activated signaling pathway involved in stomatal movement(GO:1901527) |
| 0.1 | 1.2 | GO:0051814 | movement in host(GO:0044000) transport of virus in multicellular host(GO:0046739) movement in other organism involved in symbiotic interaction(GO:0051814) movement in host environment(GO:0052126) movement in environment of other organism involved in symbiotic interaction(GO:0052192) |
| 0.1 | 0.8 | GO:0010112 | regulation of systemic acquired resistance(GO:0010112) |
| 0.1 | 1.1 | GO:0033683 | nucleotide-excision repair, DNA incision(GO:0033683) |
| 0.1 | 0.3 | GO:0006015 | 5-phosphoribose 1-diphosphate biosynthetic process(GO:0006015) 5-phosphoribose 1-diphosphate metabolic process(GO:0046391) |
| 0.1 | 0.2 | GO:0018279 | peptidyl-asparagine modification(GO:0018196) protein N-linked glycosylation via asparagine(GO:0018279) |
| 0.1 | 0.7 | GO:0070813 | hydrogen sulfide metabolic process(GO:0070813) |
| 0.1 | 1.4 | GO:0015706 | nitrate transport(GO:0015706) |
| 0.1 | 0.6 | GO:0050777 | negative regulation of immune response(GO:0050777) |
| 0.1 | 1.3 | GO:0043069 | negative regulation of programmed cell death(GO:0043069) |
| 0.1 | 0.5 | GO:0070125 | mitochondrial translational elongation(GO:0070125) |
| 0.1 | 3.8 | GO:0009626 | plant-type hypersensitive response(GO:0009626) host programmed cell death induced by symbiont(GO:0034050) |
| 0.1 | 0.4 | GO:0051455 | attachment of spindle microtubules to kinetochore involved in meiotic chromosome segregation(GO:0051316) attachment of spindle microtubules to kinetochore involved in homologous chromosome segregation(GO:0051455) microtubule cytoskeleton organization involved in homologous chromosome segregation(GO:0090172) |
| 0.1 | 0.4 | GO:0000455 | enzyme-directed rRNA pseudouridine synthesis(GO:0000455) |
| 0.1 | 1.0 | GO:1903959 | regulation of anion transmembrane transport(GO:1903959) |
| 0.1 | 0.4 | GO:0040031 | snRNA modification(GO:0040031) |
| 0.1 | 0.4 | GO:0055129 | L-proline biosynthetic process(GO:0055129) |
| 0.1 | 0.3 | GO:0006493 | protein O-linked glycosylation(GO:0006493) |
| 0.1 | 2.6 | GO:0006012 | galactose metabolic process(GO:0006012) |
| 0.1 | 0.4 | GO:0006419 | alanyl-tRNA aminoacylation(GO:0006419) |
| 0.1 | 1.1 | GO:0006646 | phosphatidylethanolamine biosynthetic process(GO:0006646) phosphatidylethanolamine metabolic process(GO:0046337) |
| 0.1 | 0.8 | GO:1901371 | regulation of leaf morphogenesis(GO:1901371) |
| 0.1 | 0.5 | GO:0080009 | mRNA methylation(GO:0080009) |
| 0.1 | 1.3 | GO:0019511 | protein hydroxylation(GO:0018126) peptidyl-proline hydroxylation to 4-hydroxy-L-proline(GO:0018401) 4-hydroxyproline metabolic process(GO:0019471) peptidyl-proline hydroxylation(GO:0019511) |
| 0.1 | 0.4 | GO:0006651 | diacylglycerol biosynthetic process(GO:0006651) |
| 0.1 | 0.9 | GO:0032511 | late endosome to vacuole transport via multivesicular body sorting pathway(GO:0032511) |
| 0.1 | 0.4 | GO:0046146 | tetrahydrobiopterin biosynthetic process(GO:0006729) tetrahydrobiopterin metabolic process(GO:0046146) |
| 0.1 | 0.5 | GO:0018027 | peptidyl-lysine dimethylation(GO:0018027) |
| 0.1 | 0.5 | GO:0009726 | detection of hormone stimulus(GO:0009720) detection of endogenous stimulus(GO:0009726) |
| 0.1 | 0.4 | GO:1990481 | mRNA pseudouridine synthesis(GO:1990481) |
| 0.1 | 0.3 | GO:0001672 | regulation of chromatin assembly or disassembly(GO:0001672) |
| 0.1 | 0.8 | GO:0033319 | UDP-D-xylose metabolic process(GO:0033319) UDP-D-xylose biosynthetic process(GO:0033320) |
| 0.1 | 0.2 | GO:0000290 | deadenylation-dependent decapping of nuclear-transcribed mRNA(GO:0000290) |
| 0.1 | 1.2 | GO:0043248 | proteasome assembly(GO:0043248) |
| 0.1 | 0.8 | GO:0006490 | oligosaccharide-lipid intermediate biosynthetic process(GO:0006490) |
| 0.1 | 0.2 | GO:0052544 | defense response by callose deposition in cell wall(GO:0052544) |
| 0.1 | 0.4 | GO:0010019 | chloroplast-nucleus signaling pathway(GO:0010019) |
| 0.1 | 0.3 | GO:0034219 | carbohydrate transmembrane transport(GO:0034219) |
| 0.1 | 1.3 | GO:0010048 | vernalization response(GO:0010048) |
| 0.1 | 1.1 | GO:0010193 | response to ozone(GO:0010193) |
| 0.1 | 0.3 | GO:1901998 | tetracycline transport(GO:0015904) antibiotic transport(GO:0042891) toxin transport(GO:1901998) |
| 0.1 | 1.9 | GO:0006568 | tryptophan metabolic process(GO:0006568) indolalkylamine metabolic process(GO:0006586) |
| 0.1 | 1.3 | GO:0046856 | phosphatidylinositol dephosphorylation(GO:0046856) |
| 0.1 | 0.3 | GO:0046838 | phosphorylated carbohydrate dephosphorylation(GO:0046838) |
| 0.1 | 1.6 | GO:0006914 | autophagy(GO:0006914) |
| 0.1 | 1.6 | GO:0033108 | mitochondrial respiratory chain complex assembly(GO:0033108) |
| 0.1 | 1.1 | GO:0010039 | response to iron ion(GO:0010039) |
| 0.1 | 3.1 | GO:0009911 | positive regulation of flower development(GO:0009911) |
| 0.1 | 0.2 | GO:0035264 | multicellular organism growth(GO:0035264) |
| 0.1 | 0.4 | GO:0019419 | sulfate reduction(GO:0019419) |
| 0.1 | 4.2 | GO:0006972 | hyperosmotic response(GO:0006972) |
| 0.1 | 0.2 | GO:0016540 | protein autoprocessing(GO:0016540) |
| 0.1 | 0.2 | GO:0008334 | histone mRNA metabolic process(GO:0008334) |
| 0.1 | 1.1 | GO:0035437 | maintenance of protein localization in endoplasmic reticulum(GO:0035437) cytoplasmic sequestering of protein(GO:0051220) |
| 0.1 | 0.9 | GO:0052325 | cell wall pectin biosynthetic process(GO:0052325) |
| 0.1 | 0.5 | GO:0050898 | nitrile metabolic process(GO:0050898) nitrile biosynthetic process(GO:0080028) |
| 0.1 | 0.2 | GO:0009920 | cell plate formation involved in plant-type cell wall biogenesis(GO:0009920) |
| 0.1 | 4.4 | GO:0009624 | response to nematode(GO:0009624) |
| 0.1 | 0.3 | GO:0000212 | meiotic spindle organization(GO:0000212) |
| 0.1 | 0.4 | GO:0098876 | vesicle-mediated transport to the plasma membrane(GO:0098876) |
| 0.1 | 0.6 | GO:0006121 | mitochondrial electron transport, succinate to ubiquinone(GO:0006121) |
| 0.1 | 0.5 | GO:0043171 | peptide catabolic process(GO:0043171) |
| 0.1 | 0.4 | GO:0000479 | endonucleolytic cleavage of tricistronic rRNA transcript (SSU-rRNA, 5.8S rRNA, LSU-rRNA)(GO:0000479) |
| 0.1 | 0.2 | GO:1990641 | response to iron ion starvation(GO:1990641) |
| 0.1 | 0.2 | GO:0033615 | mitochondrial proton-transporting ATP synthase complex assembly(GO:0033615) |
| 0.1 | 1.0 | GO:0046513 | ceramide biosynthetic process(GO:0046513) |
| 0.1 | 0.6 | GO:0002757 | immune response-activating signal transduction(GO:0002757) innate immune response-activating signal transduction(GO:0002758) immune response-regulating signaling pathway(GO:0002764) |
| 0.1 | 0.4 | GO:0010078 | maintenance of root meristem identity(GO:0010078) |
| 0.1 | 0.2 | GO:0071763 | nuclear membrane organization(GO:0071763) |
| 0.1 | 0.4 | GO:0006370 | 7-methylguanosine mRNA capping(GO:0006370) |
| 0.1 | 0.8 | GO:0006102 | isocitrate metabolic process(GO:0006102) |
| 0.1 | 0.8 | GO:0007031 | peroxisome organization(GO:0007031) |
| 0.1 | 0.5 | GO:0051014 | actin filament severing(GO:0051014) |
| 0.1 | 0.3 | GO:0097576 | regulation of vacuole fusion, non-autophagic(GO:0032889) vacuole fusion, non-autophagic(GO:0042144) vacuole fusion(GO:0097576) |
| 0.1 | 1.4 | GO:0050826 | response to freezing(GO:0050826) |
| 0.1 | 0.2 | GO:0055047 | generative cell mitosis(GO:0055047) |
| 0.1 | 0.5 | GO:0006048 | UDP-N-acetylglucosamine biosynthetic process(GO:0006048) |
| 0.1 | 1.7 | GO:0002239 | response to oomycetes(GO:0002239) |
| 0.1 | 0.3 | GO:1990414 | replication-born double-strand break repair via sister chromatid exchange(GO:1990414) |
| 0.1 | 3.1 | GO:0000381 | regulation of alternative mRNA splicing, via spliceosome(GO:0000381) |
| 0.1 | 1.5 | GO:0010252 | auxin homeostasis(GO:0010252) |
| 0.1 | 0.6 | GO:0016574 | histone ubiquitination(GO:0016574) |
| 0.1 | 0.4 | GO:0051788 | response to misfolded protein(GO:0051788) |
| 0.1 | 0.3 | GO:1902626 | assembly of large subunit precursor of preribosome(GO:1902626) |
| 0.1 | 0.5 | GO:0015914 | phospholipid transport(GO:0015914) |
| 0.1 | 4.3 | GO:0016579 | protein deubiquitination(GO:0016579) |
| 0.1 | 1.6 | GO:0010286 | heat acclimation(GO:0010286) |
| 0.1 | 0.3 | GO:0000289 | nuclear-transcribed mRNA poly(A) tail shortening(GO:0000289) |
| 0.1 | 1.7 | GO:0007166 | cell surface receptor signaling pathway(GO:0007166) |
| 0.1 | 0.8 | GO:0009625 | response to insect(GO:0009625) |
| 0.1 | 0.2 | GO:0071481 | cellular response to X-ray(GO:0071481) |
| 0.1 | 0.5 | GO:0006264 | mitochondrial DNA replication(GO:0006264) |
| 0.1 | 0.2 | GO:0006177 | GMP biosynthetic process(GO:0006177) GMP metabolic process(GO:0046037) |
| 0.1 | 0.3 | GO:0016255 | attachment of GPI anchor to protein(GO:0016255) |
| 0.1 | 0.3 | GO:0006662 | glycerol ether metabolic process(GO:0006662) |
| 0.1 | 0.2 | GO:0008298 | intracellular mRNA localization(GO:0008298) |
| 0.1 | 0.2 | GO:0010264 | myo-inositol hexakisphosphate biosynthetic process(GO:0010264) myo-inositol hexakisphosphate metabolic process(GO:0033517) |
| 0.1 | 0.4 | GO:0048354 | mucilage biosynthetic process involved in seed coat development(GO:0048354) |
| 0.1 | 1.1 | GO:0007030 | Golgi organization(GO:0007030) |
| 0.1 | 0.3 | GO:0042851 | alanine metabolic process(GO:0006522) alanine catabolic process(GO:0006524) pyruvate family amino acid metabolic process(GO:0009078) pyruvate family amino acid catabolic process(GO:0009080) L-alanine metabolic process(GO:0042851) L-alanine catabolic process(GO:0042853) |
| 0.1 | 0.2 | GO:0043633 | polyadenylation-dependent RNA catabolic process(GO:0043633) polyadenylation-dependent ncRNA catabolic process(GO:0043634) nuclear ncRNA surveillance(GO:0071029) nuclear polyadenylation-dependent rRNA catabolic process(GO:0071035) nuclear polyadenylation-dependent ncRNA catabolic process(GO:0071046) |
| 0.1 | 0.5 | GO:0045836 | positive regulation of meiotic nuclear division(GO:0045836) |
| 0.1 | 0.2 | GO:1900369 | negative regulation of gene silencing by RNA(GO:0060967) negative regulation of RNA interference(GO:1900369) |
| 0.1 | 3.0 | GO:0009615 | response to virus(GO:0009615) |
| 0.1 | 14.7 | GO:0006979 | response to oxidative stress(GO:0006979) |
| 0.1 | 1.4 | GO:0000462 | maturation of SSU-rRNA from tricistronic rRNA transcript (SSU-rRNA, 5.8S rRNA, LSU-rRNA)(GO:0000462) |
| 0.1 | 0.3 | GO:0006346 | methylation-dependent chromatin silencing(GO:0006346) |
| 0.1 | 0.4 | GO:0051131 | chaperone-mediated protein complex assembly(GO:0051131) |
| 0.1 | 0.4 | GO:0045144 | meiotic sister chromatid segregation(GO:0045144) meiotic sister chromatid cohesion(GO:0051177) |
| 0.1 | 0.3 | GO:0071786 | endoplasmic reticulum tubular network organization(GO:0071786) |
| 0.1 | 1.2 | GO:0010499 | proteasomal ubiquitin-independent protein catabolic process(GO:0010499) |
| 0.1 | 1.0 | GO:0045037 | protein import into chloroplast stroma(GO:0045037) |
| 0.1 | 0.3 | GO:0016926 | protein desumoylation(GO:0016926) |
| 0.1 | 0.2 | GO:0006283 | transcription-coupled nucleotide-excision repair(GO:0006283) |
| 0.1 | 2.8 | GO:0048544 | recognition of pollen(GO:0048544) |
| 0.0 | 0.1 | GO:0015800 | acidic amino acid transport(GO:0015800) |
| 0.0 | 0.1 | GO:0043132 | NAD transport(GO:0043132) |
| 0.0 | 1.2 | GO:0030150 | protein import into mitochondrial matrix(GO:0030150) |
| 0.0 | 4.4 | GO:0018105 | peptidyl-serine phosphorylation(GO:0018105) peptidyl-serine modification(GO:0018209) |
| 0.0 | 0.7 | GO:0006465 | signal peptide processing(GO:0006465) |
| 0.0 | 0.2 | GO:1901535 | regulation of DNA demethylation(GO:1901535) |
| 0.0 | 0.5 | GO:0070646 | protein modification by small protein removal(GO:0070646) |
| 0.0 | 0.4 | GO:0018344 | protein geranylgeranylation(GO:0018344) |
| 0.0 | 1.2 | GO:0090630 | activation of GTPase activity(GO:0090630) |
| 0.0 | 1.3 | GO:0010043 | response to zinc ion(GO:0010043) |
| 0.0 | 3.7 | GO:0000209 | protein polyubiquitination(GO:0000209) |
| 0.0 | 0.6 | GO:0010152 | pollen maturation(GO:0010152) |
| 0.0 | 2.4 | GO:0006333 | chromatin assembly or disassembly(GO:0006333) |
| 0.0 | 0.1 | GO:0071323 | cellular response to chitin(GO:0071323) |
| 0.0 | 0.2 | GO:1990428 | miRNA transport(GO:1990428) |
| 0.0 | 0.3 | GO:0006552 | leucine catabolic process(GO:0006552) |
| 0.0 | 0.1 | GO:0042126 | nitrate metabolic process(GO:0042126) nitrate assimilation(GO:0042128) |
| 0.0 | 0.3 | GO:0042430 | indole-containing compound metabolic process(GO:0042430) |
| 0.0 | 0.1 | GO:1900457 | regulation of brassinosteroid mediated signaling pathway(GO:1900457) |
| 0.0 | 0.5 | GO:0009051 | pentose-phosphate shunt, oxidative branch(GO:0009051) |
| 0.0 | 0.2 | GO:0006855 | drug transmembrane transport(GO:0006855) |
| 0.0 | 0.5 | GO:0051026 | chiasma assembly(GO:0051026) |
| 0.0 | 1.9 | GO:0006413 | translational initiation(GO:0006413) |
| 0.0 | 1.3 | GO:0010017 | red or far-red light signaling pathway(GO:0010017) |
| 0.0 | 0.9 | GO:0016117 | tetraterpenoid biosynthetic process(GO:0016109) carotenoid biosynthetic process(GO:0016117) |
| 0.0 | 0.2 | GO:0043484 | regulation of RNA splicing(GO:0043484) |
| 0.0 | 1.0 | GO:0090305 | nucleic acid phosphodiester bond hydrolysis(GO:0090305) |
| 0.0 | 0.2 | GO:0072595 | maintenance of protein localization in organelle(GO:0072595) |
| 0.0 | 0.2 | GO:1905157 | positive regulation of photosynthesis(GO:1905157) |
| 0.0 | 0.2 | GO:0009052 | pentose-phosphate shunt, non-oxidative branch(GO:0009052) |
| 0.0 | 1.0 | GO:0006897 | endocytosis(GO:0006897) |
| 0.0 | 0.3 | GO:0070129 | regulation of mitochondrial translation(GO:0070129) positive regulation of mitochondrial translation(GO:0070131) |
| 0.0 | 1.2 | GO:0006367 | transcription initiation from RNA polymerase II promoter(GO:0006367) |
| 0.0 | 0.6 | GO:0018231 | peptidyl-L-cysteine S-palmitoylation(GO:0018230) peptidyl-S-diacylglycerol-L-cysteine biosynthetic process from peptidyl-cysteine(GO:0018231) |
| 0.0 | 0.4 | GO:0052542 | defense response by callose deposition(GO:0052542) |
| 0.0 | 0.6 | GO:0034976 | response to endoplasmic reticulum stress(GO:0034976) |
| 0.0 | 0.4 | GO:0042147 | retrograde transport, endosome to Golgi(GO:0042147) |
| 0.0 | 1.4 | GO:0009694 | jasmonic acid metabolic process(GO:0009694) |
| 0.0 | 9.2 | GO:0051603 | proteolysis involved in cellular protein catabolic process(GO:0051603) |
| 0.0 | 10.2 | GO:0016567 | protein ubiquitination(GO:0016567) |
| 0.0 | 0.3 | GO:0051553 | flavone biosynthetic process(GO:0051553) flavonol biosynthetic process(GO:0051555) |
| 0.0 | 0.3 | GO:0009895 | negative regulation of catabolic process(GO:0009895) negative regulation of protein catabolic process(GO:0042177) |
| 0.0 | 5.2 | GO:0042742 | defense response to bacterium(GO:0042742) |
| 0.0 | 0.5 | GO:0006406 | mRNA export from nucleus(GO:0006406) mRNA-containing ribonucleoprotein complex export from nucleus(GO:0071427) |
| 0.0 | 0.2 | GO:0071586 | CAAX-box protein processing(GO:0071586) CAAX-box protein maturation(GO:0080120) |
| 0.0 | 0.2 | GO:0042351 | 'de novo' GDP-L-fucose biosynthetic process(GO:0042351) |
| 0.0 | 0.5 | GO:0043649 | dicarboxylic acid catabolic process(GO:0043649) |
| 0.0 | 0.7 | GO:0006383 | transcription from RNA polymerase III promoter(GO:0006383) |
| 0.0 | 0.2 | GO:0032104 | regulation of response to extracellular stimulus(GO:0032104) regulation of response to nutrient levels(GO:0032107) |
| 0.0 | 1.9 | GO:0042594 | response to starvation(GO:0042594) |
| 0.0 | 0.5 | GO:0051017 | actin filament bundle assembly(GO:0051017) actin filament bundle organization(GO:0061572) |
| 0.0 | 1.2 | GO:0009873 | ethylene-activated signaling pathway(GO:0009873) |
| 0.0 | 0.7 | GO:0006101 | tricarboxylic acid cycle(GO:0006099) citrate metabolic process(GO:0006101) |
| 0.0 | 0.4 | GO:0035999 | tetrahydrofolate interconversion(GO:0035999) |
| 0.0 | 1.1 | GO:0006338 | chromatin remodeling(GO:0006338) |
| 0.0 | 0.1 | GO:0044259 | collagen metabolic process(GO:0032963) multicellular organism metabolic process(GO:0044236) multicellular organismal macromolecule metabolic process(GO:0044259) |
| 0.0 | 0.1 | GO:0001578 | microtubule bundle formation(GO:0001578) |
| 0.0 | 0.2 | GO:0090333 | regulation of stomatal closure(GO:0090333) |
| 0.0 | 0.3 | GO:0006574 | valine catabolic process(GO:0006574) |
| 0.0 | 0.1 | GO:0080142 | regulation of salicylic acid biosynthetic process(GO:0080142) |
| 0.0 | 0.1 | GO:0030030 | cell projection organization(GO:0030030) cell projection assembly(GO:0030031) |
| 0.0 | 0.1 | GO:0071963 | establishment or maintenance of cell polarity regulating cell shape(GO:0071963) regulation of establishment or maintenance of cell polarity regulating cell shape(GO:2000769) |
| 0.0 | 0.4 | GO:0030490 | maturation of SSU-rRNA(GO:0030490) |
| 0.0 | 0.3 | GO:0000460 | maturation of 5.8S rRNA(GO:0000460) |
| 0.0 | 0.3 | GO:0048496 | maintenance of organ identity(GO:0048496) maintenance of floral organ identity(GO:0048497) |
| 0.0 | 0.1 | GO:1901006 | ubiquinone-6 metabolic process(GO:1901004) ubiquinone-6 biosynthetic process(GO:1901006) |
| 0.0 | 0.3 | GO:0001522 | pseudouridine synthesis(GO:0001522) |
| 0.0 | 0.0 | GO:0010501 | RNA secondary structure unwinding(GO:0010501) |
| 0.0 | 0.1 | GO:0009969 | xyloglucan biosynthetic process(GO:0009969) |
| 0.0 | 0.5 | GO:0043549 | regulation of kinase activity(GO:0043549) regulation of protein kinase activity(GO:0045859) |
| 0.0 | 1.0 | GO:0019932 | second-messenger-mediated signaling(GO:0019932) |
| 0.0 | 0.1 | GO:0009855 | determination of bilateral symmetry(GO:0009855) |
| 0.0 | 0.1 | GO:0030522 | blue light signaling pathway(GO:0009785) intracellular receptor signaling pathway(GO:0030522) |
| 0.0 | 0.3 | GO:0045927 | positive regulation of growth(GO:0045927) |
| 0.0 | 0.6 | GO:0000413 | protein peptidyl-prolyl isomerization(GO:0000413) |
| 0.0 | 0.4 | GO:0006874 | cellular calcium ion homeostasis(GO:0006874) calcium ion homeostasis(GO:0055074) |
| 0.0 | 0.2 | GO:0043967 | histone H4 acetylation(GO:0043967) |
| 0.0 | 0.4 | GO:0000245 | spliceosomal complex assembly(GO:0000245) |
| 0.0 | 0.1 | GO:0031348 | negative regulation of defense response(GO:0031348) |
| 0.0 | 2.6 | GO:0071456 | cellular response to hypoxia(GO:0071456) |
| 0.0 | 0.3 | GO:0031163 | iron-sulfur cluster assembly(GO:0016226) metallo-sulfur cluster assembly(GO:0031163) |
| 0.0 | 0.4 | GO:0016575 | histone deacetylation(GO:0016575) |
| 0.0 | 0.1 | GO:0045739 | positive regulation of DNA repair(GO:0045739) positive regulation of response to DNA damage stimulus(GO:2001022) |
| 0.0 | 0.1 | GO:0006361 | transcription initiation from RNA polymerase I promoter(GO:0006361) |
| 0.0 | 0.5 | GO:0006888 | ER to Golgi vesicle-mediated transport(GO:0006888) |
| 0.0 | 1.6 | GO:0006486 | protein glycosylation(GO:0006486) macromolecule glycosylation(GO:0043413) |
| 0.0 | 0.1 | GO:0010230 | alternative respiration(GO:0010230) |
| 0.0 | 0.2 | GO:0032968 | positive regulation of transcription elongation from RNA polymerase II promoter(GO:0032968) |
| 0.0 | 0.1 | GO:0032366 | intracellular sterol transport(GO:0032366) |
| 0.0 | 0.3 | GO:0006506 | GPI anchor metabolic process(GO:0006505) GPI anchor biosynthetic process(GO:0006506) |
| 0.0 | 0.1 | GO:0006120 | mitochondrial electron transport, NADH to ubiquinone(GO:0006120) |
| 0.0 | 0.2 | GO:0080156 | mitochondrial mRNA modification(GO:0080156) |
| 0.0 | 0.2 | GO:0000956 | nuclear-transcribed mRNA catabolic process(GO:0000956) |
| 0.0 | 0.7 | GO:0009611 | response to wounding(GO:0009611) |
| 0.0 | 0.1 | GO:0017004 | cytochrome complex assembly(GO:0017004) |
Gene overrepresentation in cellular component category:
| Log-likelihood per target | Total log-likelihood | Term | Description |
|---|---|---|---|
| 0.4 | 1.7 | GO:0034663 | endoplasmic reticulum chaperone complex(GO:0034663) |
| 0.4 | 2.4 | GO:0031205 | endoplasmic reticulum Sec complex(GO:0031205) |
| 0.4 | 6.7 | GO:0016602 | CCAAT-binding factor complex(GO:0016602) |
| 0.3 | 0.7 | GO:0033263 | CORVET complex(GO:0033263) |
| 0.3 | 2.7 | GO:0000813 | ESCRT I complex(GO:0000813) |
| 0.3 | 1.4 | GO:0034657 | GID complex(GO:0034657) |
| 0.3 | 1.4 | GO:0035061 | interchromatin granule(GO:0035061) |
| 0.3 | 0.8 | GO:0034066 | RIC1-RGP1 guanyl-nucleotide exchange factor complex(GO:0034066) |
| 0.3 | 1.1 | GO:0005967 | mitochondrial pyruvate dehydrogenase complex(GO:0005967) |
| 0.3 | 1.8 | GO:0090395 | plant cell papilla(GO:0090395) |
| 0.3 | 0.8 | GO:0009514 | glyoxysome(GO:0009514) |
| 0.2 | 0.7 | GO:0005674 | transcription factor TFIIF complex(GO:0005674) |
| 0.2 | 2.4 | GO:0005788 | endoplasmic reticulum lumen(GO:0005788) |
| 0.2 | 0.6 | GO:0098576 | integral component of lumenal side of endoplasmic reticulum membrane(GO:0071556) lumenal side of endoplasmic reticulum membrane(GO:0098553) lumenal side of membrane(GO:0098576) |
| 0.2 | 0.6 | GO:0034274 | Atg12-Atg5-Atg16 complex(GO:0034274) |
| 0.2 | 1.2 | GO:0000164 | protein phosphatase type 1 complex(GO:0000164) |
| 0.2 | 0.9 | GO:0030906 | retromer, cargo-selective complex(GO:0030906) |
| 0.2 | 0.6 | GO:0034703 | ion channel complex(GO:0034702) cation channel complex(GO:0034703) |
| 0.2 | 0.9 | GO:0005677 | chromatin silencing complex(GO:0005677) |
| 0.2 | 2.8 | GO:0030125 | clathrin vesicle coat(GO:0030125) |
| 0.2 | 0.7 | GO:0000220 | vacuolar proton-transporting V-type ATPase, V0 domain(GO:0000220) |
| 0.2 | 0.5 | GO:0042709 | succinate-CoA ligase complex(GO:0042709) |
| 0.2 | 6.9 | GO:0005764 | lysosome(GO:0005764) |
| 0.2 | 0.5 | GO:0030427 | site of polarized growth(GO:0030427) |
| 0.2 | 0.3 | GO:0055037 | recycling endosome(GO:0055037) |
| 0.2 | 1.9 | GO:0070062 | extracellular organelle(GO:0043230) extracellular exosome(GO:0070062) extracellular vesicle(GO:1903561) |
| 0.2 | 0.3 | GO:0030136 | clathrin-coated vesicle(GO:0030136) |
| 0.2 | 1.8 | GO:0033179 | proton-transporting V-type ATPase, V0 domain(GO:0033179) |
| 0.1 | 1.2 | GO:0070390 | transcription export complex 2(GO:0070390) |
| 0.1 | 1.2 | GO:0030118 | clathrin coat(GO:0030118) |
| 0.1 | 0.6 | GO:0097550 | transcriptional preinitiation complex(GO:0097550) |
| 0.1 | 1.0 | GO:0030897 | HOPS complex(GO:0030897) |
| 0.1 | 0.7 | GO:0016471 | vacuolar proton-transporting V-type ATPase complex(GO:0016471) |
| 0.1 | 4.8 | GO:0030173 | integral component of Golgi membrane(GO:0030173) intrinsic component of Golgi membrane(GO:0031228) |
| 0.1 | 0.7 | GO:0071541 | eukaryotic translation initiation factor 3 complex, eIF3m(GO:0071541) |
| 0.1 | 1.5 | GO:1902562 | NuA4 histone acetyltransferase complex(GO:0035267) H4/H2A histone acetyltransferase complex(GO:0043189) H4 histone acetyltransferase complex(GO:1902562) |
| 0.1 | 1.0 | GO:0030127 | COPII vesicle coat(GO:0030127) |
| 0.1 | 9.0 | GO:0019005 | SCF ubiquitin ligase complex(GO:0019005) |
| 0.1 | 0.3 | GO:0005775 | vacuolar lumen(GO:0005775) |
| 0.1 | 1.0 | GO:0017119 | Golgi transport complex(GO:0017119) |
| 0.1 | 0.8 | GO:0005776 | autophagosome(GO:0005776) |
| 0.1 | 0.7 | GO:0043078 | megasporocyte nucleus(GO:0043076) polar nucleus(GO:0043078) |
| 0.1 | 5.3 | GO:0016592 | mediator complex(GO:0016592) |
| 0.1 | 2.3 | GO:0031965 | nuclear membrane(GO:0031965) |
| 0.1 | 3.3 | GO:1903293 | protein serine/threonine phosphatase complex(GO:0008287) phosphatase complex(GO:1903293) |
| 0.1 | 4.2 | GO:0000137 | Golgi cis cisterna(GO:0000137) |
| 0.1 | 1.2 | GO:0072546 | ER membrane protein complex(GO:0072546) |
| 0.1 | 0.3 | GO:0030874 | nucleolar chromatin(GO:0030874) |
| 0.1 | 1.2 | GO:0000326 | storage vacuole(GO:0000322) protein storage vacuole(GO:0000326) |
| 0.1 | 0.5 | GO:0031907 | peroxisomal matrix(GO:0005782) microbody lumen(GO:0031907) |
| 0.1 | 0.6 | GO:0034098 | VCP-NPL4-UFD1 AAA ATPase complex(GO:0034098) |
| 0.1 | 0.3 | GO:0035101 | FACT complex(GO:0035101) |
| 0.1 | 0.3 | GO:0031417 | N-terminal protein acetyltransferase complex(GO:0031414) NatC complex(GO:0031417) |
| 0.1 | 0.3 | GO:0002189 | ribose phosphate diphosphokinase complex(GO:0002189) |
| 0.1 | 1.5 | GO:0031231 | integral component of peroxisomal membrane(GO:0005779) intrinsic component of peroxisomal membrane(GO:0031231) |
| 0.1 | 0.7 | GO:0042406 | extrinsic component of endoplasmic reticulum membrane(GO:0042406) |
| 0.1 | 0.6 | GO:0001405 | presequence translocase-associated import motor(GO:0001405) |
| 0.1 | 1.0 | GO:0008278 | cohesin complex(GO:0008278) |
| 0.1 | 0.5 | GO:0071256 | translocon complex(GO:0071256) |
| 0.1 | 0.8 | GO:0045252 | oxoglutarate dehydrogenase complex(GO:0045252) |
| 0.1 | 0.7 | GO:0030140 | trans-Golgi network transport vesicle(GO:0030140) |
| 0.1 | 0.8 | GO:0030688 | preribosome, small subunit precursor(GO:0030688) |
| 0.1 | 3.2 | GO:0009504 | cell plate(GO:0009504) |
| 0.1 | 0.5 | GO:0030904 | retromer complex(GO:0030904) |
| 0.1 | 5.1 | GO:0009707 | chloroplast outer membrane(GO:0009707) |
| 0.1 | 0.5 | GO:0017053 | transcriptional repressor complex(GO:0017053) |
| 0.1 | 0.9 | GO:0016272 | prefoldin complex(GO:0016272) |
| 0.1 | 0.6 | GO:0016514 | SWI/SNF complex(GO:0016514) BAF-type complex(GO:0090544) |
| 0.1 | 0.7 | GO:0030134 | ER to Golgi transport vesicle(GO:0030134) |
| 0.1 | 0.8 | GO:0035861 | site of double-strand break(GO:0035861) |
| 0.1 | 11.4 | GO:0000325 | plant-type vacuole(GO:0000325) |
| 0.1 | 1.0 | GO:0005793 | endoplasmic reticulum-Golgi intermediate compartment(GO:0005793) |
| 0.1 | 0.9 | GO:0000109 | nucleotide-excision repair complex(GO:0000109) |
| 0.1 | 0.7 | GO:0031588 | nucleotide-activated protein kinase complex(GO:0031588) |
| 0.1 | 7.1 | GO:0005887 | integral component of plasma membrane(GO:0005887) |
| 0.1 | 0.9 | GO:0071007 | U2-type catalytic step 2 spliceosome(GO:0071007) |
| 0.1 | 1.4 | GO:0031012 | extracellular matrix(GO:0031012) |
| 0.1 | 0.5 | GO:0031428 | box C/D snoRNP complex(GO:0031428) |
| 0.1 | 0.4 | GO:0042645 | mitochondrial nucleoid(GO:0042645) |
| 0.1 | 0.4 | GO:0000974 | Prp19 complex(GO:0000974) |
| 0.1 | 0.4 | GO:0030062 | mitochondrial alpha-ketoglutarate dehydrogenase complex(GO:0005947) mitochondrial tricarboxylic acid cycle enzyme complex(GO:0030062) |
| 0.1 | 0.4 | GO:0030286 | dynein complex(GO:0030286) |
| 0.1 | 1.1 | GO:0008540 | proteasome regulatory particle, base subcomplex(GO:0008540) |
| 0.1 | 0.6 | GO:0008250 | oligosaccharyltransferase complex(GO:0008250) |
| 0.1 | 6.4 | GO:0016604 | nuclear body(GO:0016604) |
| 0.1 | 0.2 | GO:0033290 | eukaryotic 48S preinitiation complex(GO:0033290) multi-eIF complex(GO:0043614) |
| 0.1 | 2.7 | GO:0005770 | late endosome(GO:0005770) |
| 0.1 | 0.6 | GO:0030014 | CCR4-NOT complex(GO:0030014) |
| 0.1 | 0.7 | GO:0000127 | transcription factor TFIIIC complex(GO:0000127) |
| 0.1 | 1.1 | GO:0005758 | mitochondrial intermembrane space(GO:0005758) |
| 0.1 | 0.3 | GO:0031352 | intrinsic component of plastid inner membrane(GO:0031352) integral component of plastid inner membrane(GO:0031353) intrinsic component of chloroplast inner membrane(GO:0031356) integral component of chloroplast inner membrane(GO:0031357) |
| 0.1 | 1.0 | GO:0000177 | cytoplasmic exosome (RNase complex)(GO:0000177) |
| 0.1 | 1.5 | GO:0000145 | exocyst(GO:0000145) |
| 0.1 | 1.8 | GO:0000932 | cytoplasmic mRNA processing body(GO:0000932) |
| 0.1 | 0.3 | GO:0042765 | GPI-anchor transamidase complex(GO:0042765) |
| 0.1 | 0.6 | GO:0005688 | U6 snRNP(GO:0005688) |
| 0.1 | 1.2 | GO:0005778 | peroxisomal membrane(GO:0005778) microbody membrane(GO:0031903) microbody part(GO:0044438) peroxisomal part(GO:0044439) |
| 0.1 | 0.3 | GO:0044545 | NSL complex(GO:0044545) |
| 0.1 | 1.9 | GO:0000139 | Golgi membrane(GO:0000139) |
| 0.1 | 3.7 | GO:0005635 | nuclear envelope(GO:0005635) |
| 0.1 | 0.4 | GO:0005956 | protein kinase CK2 complex(GO:0005956) |
| 0.1 | 0.2 | GO:0005672 | transcription factor TFIIA complex(GO:0005672) |
| 0.1 | 0.3 | GO:0098554 | integral component of cytoplasmic side of endoplasmic reticulum membrane(GO:0071458) cytoplasmic side of endoplasmic reticulum membrane(GO:0098554) |
| 0.1 | 0.6 | GO:0005749 | mitochondrial respiratory chain complex II, succinate dehydrogenase complex (ubiquinone)(GO:0005749) succinate dehydrogenase complex (ubiquinone)(GO:0045257) fumarate reductase complex(GO:0045283) |
| 0.0 | 0.6 | GO:0032588 | trans-Golgi network membrane(GO:0032588) |
| 0.0 | 0.8 | GO:0019773 | proteasome core complex, alpha-subunit complex(GO:0019773) |
| 0.0 | 0.3 | GO:0031298 | replication fork protection complex(GO:0031298) |
| 0.0 | 0.4 | GO:0005834 | heterotrimeric G-protein complex(GO:0005834) |
| 0.0 | 0.7 | GO:0030687 | preribosome, large subunit precursor(GO:0030687) |
| 0.0 | 5.6 | GO:0044217 | host(GO:0018995) host cell part(GO:0033643) host intracellular part(GO:0033646) host intracellular organelle(GO:0033647) host intracellular membrane-bounded organelle(GO:0033648) host cell nucleus(GO:0042025) intracellular region of host(GO:0043656) host cell(GO:0043657) other organism(GO:0044215) other organism cell(GO:0044216) other organism part(GO:0044217) |
| 0.0 | 13.0 | GO:0005777 | peroxisome(GO:0005777) microbody(GO:0042579) |
| 0.0 | 0.3 | GO:0005968 | Rab-protein geranylgeranyltransferase complex(GO:0005968) |
| 0.0 | 0.3 | GO:0032541 | cortical endoplasmic reticulum(GO:0032541) endoplasmic reticulum tubular network(GO:0071782) endoplasmic reticulum subcompartment(GO:0098827) |
| 0.0 | 7.8 | GO:0005789 | endoplasmic reticulum membrane(GO:0005789) |
| 0.0 | 0.6 | GO:0008541 | proteasome regulatory particle, lid subcomplex(GO:0008541) |
| 0.0 | 0.2 | GO:0046695 | SLIK (SAGA-like) complex(GO:0046695) |
| 0.0 | 1.0 | GO:0000502 | proteasome complex(GO:0000502) |
| 0.0 | 3.2 | GO:0005746 | mitochondrial respiratory chain(GO:0005746) |
| 0.0 | 7.5 | GO:0000151 | ubiquitin ligase complex(GO:0000151) |
| 0.0 | 0.9 | GO:0012511 | monolayer-surrounded lipid storage body(GO:0012511) |
| 0.0 | 2.3 | GO:0005768 | endosome(GO:0005768) |
| 0.0 | 0.2 | GO:0005664 | origin recognition complex(GO:0000808) nuclear origin of replication recognition complex(GO:0005664) |
| 0.0 | 0.9 | GO:0032040 | small-subunit processome(GO:0032040) |
| 0.0 | 0.1 | GO:0005853 | eukaryotic translation elongation factor 1 complex(GO:0005853) |
| 0.0 | 0.2 | GO:0045239 | tricarboxylic acid cycle enzyme complex(GO:0045239) |
| 0.0 | 0.2 | GO:0000276 | mitochondrial proton-transporting ATP synthase complex, coupling factor F(o)(GO:0000276) |
| 0.0 | 1.0 | GO:0031201 | SNARE complex(GO:0031201) |
| 0.0 | 7.1 | GO:0005654 | nucleoplasm(GO:0005654) |
| 0.0 | 0.3 | GO:0071011 | precatalytic spliceosome(GO:0071011) |
| 0.0 | 0.7 | GO:0005762 | mitochondrial large ribosomal subunit(GO:0005762) |
| 0.0 | 1.4 | GO:0005741 | mitochondrial outer membrane(GO:0005741) |
| 0.0 | 0.6 | GO:0005852 | eukaryotic translation initiation factor 3 complex(GO:0005852) |
| 0.0 | 3.6 | GO:0000785 | chromatin(GO:0000785) |
| 0.0 | 1.4 | GO:0090406 | pollen tube(GO:0090406) |
| 0.0 | 0.3 | GO:0010494 | cytoplasmic stress granule(GO:0010494) |
| 0.0 | 0.3 | GO:0005885 | Arp2/3 protein complex(GO:0005885) |
| 0.0 | 5.5 | GO:0098791 | Golgi subcompartment(GO:0098791) |
| 0.0 | 6.3 | GO:0005774 | vacuolar membrane(GO:0005774) |
| 0.0 | 0.1 | GO:0005884 | actin filament(GO:0005884) |
| 0.0 | 0.2 | GO:0008180 | COP9 signalosome(GO:0008180) |
| 0.0 | 0.1 | GO:0071014 | post-mRNA release spliceosomal complex(GO:0071014) |
| 0.0 | 0.3 | GO:0032592 | integral component of mitochondrial membrane(GO:0032592) |
| 0.0 | 0.1 | GO:0048471 | perinuclear region of cytoplasm(GO:0048471) |
| 0.0 | 0.2 | GO:0000784 | chromosome, telomeric region(GO:0000781) nuclear chromosome, telomeric region(GO:0000784) |
| 0.0 | 0.1 | GO:0070552 | BRISC complex(GO:0070552) |
Gene overrepresentation in molecular function category:
| Log-likelihood per target | Total log-likelihood | Term | Description |
|---|---|---|---|
| 1.5 | 4.4 | GO:0052625 | 4-aminobenzoate amino acid synthetase activity(GO:0052625) benzoate amino acid synthetase activity(GO:0052626) vanillate amino acid synthetase activity(GO:0052627) 4-hydroxybenzoate amino acid synthetase activity(GO:0052628) |
| 1.0 | 6.0 | GO:0070547 | L-tyrosine:2-oxoglutarate aminotransferase activity(GO:0004838) L-tyrosine aminotransferase activity(GO:0070547) |
| 1.0 | 2.9 | GO:0050403 | trans-zeatin O-beta-D-glucosyltransferase activity(GO:0050403) cis-zeatin O-beta-D-glucosyltransferase activity(GO:0050502) |
| 0.9 | 1.9 | GO:0008519 | ammonium transmembrane transporter activity(GO:0008519) |
| 0.9 | 3.8 | GO:0005432 | calcium:sodium antiporter activity(GO:0005432) |
| 0.9 | 2.8 | GO:0010331 | gibberellin binding(GO:0010331) |
| 0.8 | 4.2 | GO:0016768 | spermine synthase activity(GO:0016768) |
| 0.8 | 2.5 | GO:0015204 | urea transmembrane transporter activity(GO:0015204) |
| 0.8 | 2.5 | GO:0000249 | C-22 sterol desaturase activity(GO:0000249) |
| 0.8 | 3.2 | GO:0016856 | racemase and epimerase activity, acting on hydroxy acids and derivatives(GO:0016856) |
| 0.8 | 2.3 | GO:0050736 | O-malonyltransferase activity(GO:0050736) |
| 0.7 | 2.9 | GO:0004556 | alpha-amylase activity(GO:0004556) |
| 0.6 | 2.6 | GO:0016034 | maleylacetoacetate isomerase activity(GO:0016034) |
| 0.6 | 4.2 | GO:0010279 | indole-3-acetic acid amido synthetase activity(GO:0010279) |
| 0.6 | 1.8 | GO:0010297 | heteropolysaccharide binding(GO:0010297) |
| 0.6 | 1.7 | GO:0035605 | peptidyl-cysteine S-nitrosylase activity(GO:0035605) |
| 0.6 | 2.3 | GO:0016920 | pyroglutamyl-peptidase activity(GO:0016920) |
| 0.6 | 1.7 | GO:0015119 | hexose phosphate transmembrane transporter activity(GO:0015119) glucose-6-phosphate transmembrane transporter activity(GO:0015152) |
| 0.6 | 2.8 | GO:1902417 | (+)-abscisic acid D-glucopyranosyl ester transmembrane transporter activity(GO:1902417) |
| 0.5 | 3.3 | GO:0015369 | calcium:proton antiporter activity(GO:0015369) |
| 0.5 | 1.6 | GO:0045140 | inositol phosphoceramide synthase activity(GO:0045140) |
| 0.5 | 2.1 | GO:0008934 | inositol monophosphate 1-phosphatase activity(GO:0008934) inositol monophosphate phosphatase activity(GO:0052834) |
| 0.5 | 2.5 | GO:0015203 | polyamine transmembrane transporter activity(GO:0015203) |
| 0.5 | 2.0 | GO:0031516 | far-red light photoreceptor activity(GO:0031516) |
| 0.5 | 1.4 | GO:0052640 | salicylic acid glucosyltransferase (glucoside-forming) activity(GO:0052640) |
| 0.5 | 1.8 | GO:0004149 | dihydrolipoyllysine-residue succinyltransferase activity(GO:0004149) succinyltransferase activity(GO:0016748) S-succinyltransferase activity(GO:0016751) |
| 0.4 | 2.2 | GO:0010295 | (+)-abscisic acid 8'-hydroxylase activity(GO:0010295) |
| 0.4 | 1.7 | GO:0015603 | iron chelate transmembrane transporter activity(GO:0015603) iron-nicotianamine transmembrane transporter activity(GO:0051980) |
| 0.4 | 2.6 | GO:0080109 | indole-3-acetonitrile nitrile hydratase activity(GO:0080109) |
| 0.4 | 1.3 | GO:0043325 | phosphatidylinositol-3,4-bisphosphate binding(GO:0043325) |
| 0.4 | 4.6 | GO:0008453 | alanine-glyoxylate transaminase activity(GO:0008453) |
| 0.4 | 1.2 | GO:0019788 | NEDD8 transferase activity(GO:0019788) |
| 0.4 | 1.2 | GO:0051752 | phosphoglucan, water dikinase activity(GO:0051752) |
| 0.4 | 1.2 | GO:0010354 | homogentisate prenyltransferase activity(GO:0010354) |
| 0.4 | 1.6 | GO:0052596 | tryptamine:oxygen oxidoreductase (deaminating) activity(GO:0052593) aminoacetone:oxygen oxidoreductase(deaminating) activity(GO:0052594) aliphatic-amine oxidase activity(GO:0052595) phenethylamine:oxygen oxidoreductase (deaminating) activity(GO:0052596) |
| 0.4 | 2.8 | GO:0005459 | UDP-galactose transmembrane transporter activity(GO:0005459) |
| 0.4 | 2.0 | GO:0015186 | L-glutamine transmembrane transporter activity(GO:0015186) |
| 0.4 | 1.6 | GO:0004385 | guanylate kinase activity(GO:0004385) |
| 0.4 | 1.6 | GO:0016985 | mannan endo-1,4-beta-mannosidase activity(GO:0016985) |
| 0.4 | 2.2 | GO:0005483 | soluble NSF attachment protein activity(GO:0005483) |
| 0.4 | 1.5 | GO:0042409 | caffeoyl-CoA O-methyltransferase activity(GO:0042409) |
| 0.4 | 4.0 | GO:0102360 | daphnetin 3-O-glucosyltransferase activity(GO:0102360) |
| 0.4 | 0.4 | GO:0009883 | red or far-red light photoreceptor activity(GO:0009883) |
| 0.4 | 1.1 | GO:0003864 | 3-methyl-2-oxobutanoate hydroxymethyltransferase activity(GO:0003864) |
| 0.3 | 1.0 | GO:0008428 | ribonuclease inhibitor activity(GO:0008428) 4-hydroxy-4-methyl-2-oxoglutarate aldolase activity(GO:0047443) |
| 0.3 | 2.4 | GO:0008157 | protein phosphatase 1 binding(GO:0008157) |
| 0.3 | 1.3 | GO:0080103 | 4-methylthiopropyl glucosinolate S-oxygenase activity(GO:0080103) |
| 0.3 | 2.4 | GO:0050551 | myrcene synthase activity(GO:0050551) |
| 0.3 | 1.0 | GO:0004450 | isocitrate dehydrogenase (NADP+) activity(GO:0004450) |
| 0.3 | 2.0 | GO:0030527 | structural constituent of chromatin(GO:0030527) |
| 0.3 | 1.6 | GO:0015193 | L-proline transmembrane transporter activity(GO:0015193) |
| 0.3 | 0.9 | GO:0016643 | glutamate synthase (ferredoxin) activity(GO:0016041) oxidoreductase activity, acting on the CH-NH2 group of donors, iron-sulfur protein as acceptor(GO:0016643) |
| 0.3 | 0.9 | GO:0008661 | 1-deoxy-D-xylulose-5-phosphate synthase activity(GO:0008661) |
| 0.3 | 0.9 | GO:0000403 | Y-form DNA binding(GO:0000403) flap-structured DNA binding(GO:0070336) |
| 0.3 | 0.6 | GO:0051019 | mitogen-activated protein kinase binding(GO:0051019) |
| 0.3 | 2.1 | GO:0033549 | MAP kinase phosphatase activity(GO:0033549) |
| 0.3 | 1.8 | GO:0009041 | uridylate kinase activity(GO:0009041) |
| 0.3 | 2.9 | GO:0005086 | ARF guanyl-nucleotide exchange factor activity(GO:0005086) |
| 0.3 | 1.4 | GO:0004028 | 3-chloroallyl aldehyde dehydrogenase activity(GO:0004028) |
| 0.3 | 1.1 | GO:0097363 | protein O-GlcNAc transferase activity(GO:0097363) |
| 0.3 | 1.7 | GO:0004848 | ureidoglycolate hydrolase activity(GO:0004848) |
| 0.3 | 0.8 | GO:0050302 | aryl-aldehyde oxidase activity(GO:0018488) indole-3-acetaldehyde oxidase activity(GO:0050302) |
| 0.3 | 0.8 | GO:0052901 | spermine:oxygen oxidoreductase (spermidine-forming) activity(GO:0052901) |
| 0.3 | 1.1 | GO:0047782 | coniferin beta-glucosidase activity(GO:0047782) |
| 0.3 | 2.4 | GO:0009881 | photoreceptor activity(GO:0009881) blue light photoreceptor activity(GO:0009882) |
| 0.3 | 2.1 | GO:0001653 | peptide receptor activity(GO:0001653) |
| 0.3 | 3.9 | GO:0003978 | UDP-glucose 4-epimerase activity(GO:0003978) |
| 0.3 | 0.8 | GO:0031418 | L-ascorbic acid binding(GO:0031418) |
| 0.3 | 0.8 | GO:0031210 | phosphatidylcholine binding(GO:0031210) quaternary ammonium group binding(GO:0050997) |
| 0.3 | 2.8 | GO:0033743 | peptide-methionine (R)-S-oxide reductase activity(GO:0033743) |
| 0.3 | 0.8 | GO:0016726 | oxidoreductase activity, acting on CH or CH2 groups, NAD or NADP as acceptor(GO:0016726) |
| 0.2 | 5.0 | GO:1900750 | glutathione binding(GO:0043295) oligopeptide binding(GO:1900750) |
| 0.2 | 1.9 | GO:0004069 | L-aspartate:2-oxoglutarate aminotransferase activity(GO:0004069) |
| 0.2 | 1.0 | GO:0004348 | glucosylceramidase activity(GO:0004348) |
| 0.2 | 0.7 | GO:0016661 | oxidoreductase activity, acting on other nitrogenous compounds as donors(GO:0016661) |
| 0.2 | 1.2 | GO:0046509 | 1,2-diacylglycerol 3-beta-galactosyltransferase activity(GO:0046509) |
| 0.2 | 1.4 | GO:0015175 | neutral amino acid transmembrane transporter activity(GO:0015175) |
| 0.2 | 0.7 | GO:0016767 | geranylgeranyl-diphosphate geranylgeranyltransferase activity(GO:0016767) |
| 0.2 | 2.2 | GO:0035198 | miRNA binding(GO:0035198) |
| 0.2 | 2.0 | GO:0004602 | glutathione peroxidase activity(GO:0004602) |
| 0.2 | 2.7 | GO:0004714 | transmembrane receptor protein tyrosine kinase activity(GO:0004714) |
| 0.2 | 0.7 | GO:0015117 | thiosulfate transmembrane transporter activity(GO:0015117) |
| 0.2 | 1.3 | GO:0052656 | L-leucine transaminase activity(GO:0052654) L-valine transaminase activity(GO:0052655) L-isoleucine transaminase activity(GO:0052656) |
| 0.2 | 1.5 | GO:0008239 | dipeptidyl-peptidase activity(GO:0008239) |
| 0.2 | 0.4 | GO:0009678 | hydrogen-translocating pyrophosphatase activity(GO:0009678) |
| 0.2 | 1.1 | GO:0003959 | NADPH dehydrogenase activity(GO:0003959) |
| 0.2 | 0.6 | GO:0004046 | aminoacylase activity(GO:0004046) |
| 0.2 | 2.9 | GO:0004144 | diacylglycerol O-acyltransferase activity(GO:0004144) |
| 0.2 | 0.6 | GO:0004438 | phosphatidylinositol-3-phosphatase activity(GO:0004438) phosphatidylinositol-3,5-bisphosphate 3-phosphatase activity(GO:0052629) |
| 0.2 | 1.4 | GO:0004356 | glutamate-ammonia ligase activity(GO:0004356) |
| 0.2 | 0.4 | GO:0080002 | UDP-glucose:4-aminobenzoate acylglucosyltransferase activity(GO:0080002) |
| 0.2 | 2.6 | GO:0009044 | xylan 1,4-beta-xylosidase activity(GO:0009044) |
| 0.2 | 0.8 | GO:0004534 | 5'-3' exoribonuclease activity(GO:0004534) |
| 0.2 | 2.4 | GO:0015145 | monosaccharide transmembrane transporter activity(GO:0015145) |
| 0.2 | 1.0 | GO:0005354 | galactose transmembrane transporter activity(GO:0005354) |
| 0.2 | 2.2 | GO:0008526 | phosphatidylinositol transporter activity(GO:0008526) |
| 0.2 | 1.4 | GO:0010178 | IAA-amino acid conjugate hydrolase activity(GO:0010178) |
| 0.2 | 0.6 | GO:0004353 | glutamate dehydrogenase [NAD(P)+] activity(GO:0004353) |
| 0.2 | 0.8 | GO:0004791 | thioredoxin-disulfide reductase activity(GO:0004791) |
| 0.2 | 0.6 | GO:0015292 | uniporter activity(GO:0015292) |
| 0.2 | 3.4 | GO:0008144 | drug binding(GO:0008144) |
| 0.2 | 0.7 | GO:0052924 | trans-octaprenyltranstransferase activity(GO:0050347) all-trans-nonaprenyl-diphosphate synthase (geranylgeranyl-diphosphate specific) activity(GO:0052924) |
| 0.2 | 0.9 | GO:0030371 | translation repressor activity(GO:0030371) |
| 0.2 | 1.1 | GO:0030544 | Hsp70 protein binding(GO:0030544) |
| 0.2 | 0.5 | GO:0032131 | alkylated DNA binding(GO:0032131) |
| 0.2 | 0.5 | GO:0052725 | inositol-1,3,4-trisphosphate 6-kinase activity(GO:0052725) |
| 0.2 | 0.5 | GO:0004609 | phosphatidylserine decarboxylase activity(GO:0004609) |
| 0.2 | 0.2 | GO:0047493 | sphingomyelin synthase activity(GO:0033188) ceramide cholinephosphotransferase activity(GO:0047493) |
| 0.2 | 2.6 | GO:0008195 | phosphatidate phosphatase activity(GO:0008195) |
| 0.2 | 0.5 | GO:0019781 | NEDD8 activating enzyme activity(GO:0019781) |
| 0.2 | 0.5 | GO:0004776 | succinate-CoA ligase activity(GO:0004774) succinate-CoA ligase (ADP-forming) activity(GO:0004775) succinate-CoA ligase (GDP-forming) activity(GO:0004776) |
| 0.2 | 1.2 | GO:0001671 | ATPase activator activity(GO:0001671) |
| 0.2 | 1.0 | GO:0016813 | hydrolase activity, acting on carbon-nitrogen (but not peptide) bonds, in linear amidines(GO:0016813) |
| 0.2 | 0.8 | GO:0043682 | copper-transporting ATPase activity(GO:0043682) |
| 0.2 | 1.1 | GO:0003872 | 6-phosphofructokinase activity(GO:0003872) |
| 0.2 | 1.3 | GO:0008296 | 3'-5'-exodeoxyribonuclease activity(GO:0008296) |
| 0.2 | 2.1 | GO:0019902 | phosphatase binding(GO:0019902) |
| 0.2 | 2.4 | GO:0004427 | inorganic diphosphatase activity(GO:0004427) |
| 0.2 | 1.1 | GO:0008177 | succinate dehydrogenase (ubiquinone) activity(GO:0008177) |
| 0.2 | 1.1 | GO:0004739 | pyruvate dehydrogenase (acetyl-transferring) activity(GO:0004739) |
| 0.2 | 0.8 | GO:0016629 | 12-oxophytodienoate reductase activity(GO:0016629) |
| 0.2 | 0.6 | GO:0004048 | anthranilate phosphoribosyltransferase activity(GO:0004048) |
| 0.2 | 0.6 | GO:0005247 | voltage-gated chloride channel activity(GO:0005247) chloride channel activity(GO:0005254) |
| 0.2 | 0.5 | GO:0046920 | alpha-(1->3)-fucosyltransferase activity(GO:0046920) |
| 0.2 | 0.9 | GO:0004930 | G-protein coupled receptor activity(GO:0004930) |
| 0.2 | 0.5 | GO:0008517 | folic acid transporter activity(GO:0008517) |
| 0.2 | 1.4 | GO:0010436 | carotenoid dioxygenase activity(GO:0010436) |
| 0.2 | 0.6 | GO:0008460 | dTDP-glucose 4,6-dehydratase activity(GO:0008460) |
| 0.2 | 2.0 | GO:0032440 | 2-alkenal reductase [NAD(P)] activity(GO:0032440) |
| 0.2 | 1.4 | GO:0004869 | cysteine-type endopeptidase inhibitor activity(GO:0004869) |
| 0.1 | 0.9 | GO:0017112 | Rab guanyl-nucleotide exchange factor activity(GO:0017112) |
| 0.1 | 1.5 | GO:0005375 | copper ion transmembrane transporter activity(GO:0005375) |
| 0.1 | 0.4 | GO:0016277 | [myelin basic protein]-arginine N-methyltransferase activity(GO:0016277) |
| 0.1 | 1.2 | GO:0003997 | acyl-CoA oxidase activity(GO:0003997) |
| 0.1 | 0.4 | GO:0061575 | cyclin-dependent protein serine/threonine kinase activator activity(GO:0061575) |
| 0.1 | 0.4 | GO:0008936 | nicotinamidase activity(GO:0008936) |
| 0.1 | 0.6 | GO:0016882 | cyclo-ligase activity(GO:0016882) |
| 0.1 | 0.7 | GO:0016312 | inositol bisphosphate phosphatase activity(GO:0016312) |
| 0.1 | 2.0 | GO:0015095 | magnesium ion transmembrane transporter activity(GO:0015095) |
| 0.1 | 4.6 | GO:0016760 | cellulose synthase (UDP-forming) activity(GO:0016760) |
| 0.1 | 2.0 | GO:0008134 | transcription factor binding(GO:0008134) |
| 0.1 | 7.6 | GO:0010857 | calmodulin-dependent protein kinase activity(GO:0004683) calcium-dependent protein serine/threonine kinase activity(GO:0009931) calcium-dependent protein kinase activity(GO:0010857) |
| 0.1 | 2.1 | GO:0031543 | peptidyl-proline dioxygenase activity(GO:0031543) |
| 0.1 | 0.3 | GO:0004021 | L-alanine:2-oxoglutarate aminotransferase activity(GO:0004021) alanine-oxo-acid transaminase activity(GO:0047635) |
| 0.1 | 0.7 | GO:0031956 | medium-chain fatty acid-CoA ligase activity(GO:0031956) |
| 0.1 | 0.5 | GO:0016165 | linoleate 13S-lipoxygenase activity(GO:0016165) |
| 0.1 | 1.1 | GO:0009916 | alternative oxidase activity(GO:0009916) |
| 0.1 | 9.4 | GO:0004197 | cysteine-type endopeptidase activity(GO:0004197) |
| 0.1 | 2.8 | GO:0042973 | glucan endo-1,3-beta-D-glucosidase activity(GO:0042973) |
| 0.1 | 0.8 | GO:0004376 | glycolipid mannosyltransferase activity(GO:0004376) |
| 0.1 | 3.0 | GO:0043424 | protein histidine kinase binding(GO:0043424) |
| 0.1 | 0.4 | GO:0050412 | cinnamate beta-D-glucosyltransferase activity(GO:0050412) |
| 0.1 | 6.3 | GO:0017137 | Rab GTPase binding(GO:0017137) |
| 0.1 | 2.1 | GO:0008515 | sucrose transmembrane transporter activity(GO:0008515) |
| 0.1 | 0.7 | GO:0004679 | AMP-activated protein kinase activity(GO:0004679) |
| 0.1 | 0.5 | GO:0034722 | gamma-glutamyl-peptidase activity(GO:0034722) |
| 0.1 | 2.2 | GO:0035064 | methylated histone binding(GO:0035064) |
| 0.1 | 8.3 | GO:0042910 | xenobiotic transporter activity(GO:0042910) |
| 0.1 | 1.5 | GO:0003950 | NAD+ ADP-ribosyltransferase activity(GO:0003950) |
| 0.1 | 1.1 | GO:0017136 | NAD-dependent histone deacetylase activity(GO:0017136) histone deacetylase activity (H3-K14 specific)(GO:0031078) NAD-dependent histone deacetylase activity (H3-K14 specific)(GO:0032041) NAD-dependent protein deacetylase activity(GO:0034979) |
| 0.1 | 3.0 | GO:0008066 | glutamate receptor activity(GO:0008066) |
| 0.1 | 0.6 | GO:0005544 | calcium-dependent phospholipid binding(GO:0005544) |
| 0.1 | 0.9 | GO:0004834 | tryptophan synthase activity(GO:0004834) |
| 0.1 | 1.2 | GO:0016702 | oxidoreductase activity, acting on single donors with incorporation of molecular oxygen, incorporation of two atoms of oxygen(GO:0016702) |
| 0.1 | 4.7 | GO:0004707 | MAP kinase activity(GO:0004707) |
| 0.1 | 0.5 | GO:0050291 | sphingosine N-acyltransferase activity(GO:0050291) |
| 0.1 | 1.6 | GO:0005388 | calcium-transporting ATPase activity(GO:0005388) |
| 0.1 | 0.4 | GO:0016972 | flavin-linked sulfhydryl oxidase activity(GO:0016971) thiol oxidase activity(GO:0016972) |
| 0.1 | 0.4 | GO:0004140 | dephospho-CoA kinase activity(GO:0004140) |
| 0.1 | 0.4 | GO:0004651 | mRNA guanylyltransferase activity(GO:0004484) polynucleotide 5'-phosphatase activity(GO:0004651) RNA guanylyltransferase activity(GO:0008192) polynucleotide phosphatase activity(GO:0098518) |
| 0.1 | 0.5 | GO:0000268 | peroxisome targeting sequence binding(GO:0000268) |
| 0.1 | 1.2 | GO:0004708 | MAP kinase kinase activity(GO:0004708) |
| 0.1 | 0.3 | GO:0001054 | RNA polymerase I activity(GO:0001054) RNA polymerase III activity(GO:0001056) |
| 0.1 | 0.5 | GO:0005457 | GDP-fucose transmembrane transporter activity(GO:0005457) |
| 0.1 | 1.1 | GO:0035252 | UDP-xylosyltransferase activity(GO:0035252) |
| 0.1 | 0.5 | GO:0030291 | cyclin-dependent protein serine/threonine kinase inhibitor activity(GO:0004861) protein serine/threonine kinase inhibitor activity(GO:0030291) |
| 0.1 | 0.3 | GO:0008265 | Mo-molybdopterin cofactor sulfurase activity(GO:0008265) |
| 0.1 | 0.6 | GO:0050664 | NAD(P)H oxidase activity(GO:0016174) oxidoreductase activity, acting on NAD(P)H, oxygen as acceptor(GO:0050664) |
| 0.1 | 0.9 | GO:0015140 | malate transmembrane transporter activity(GO:0015140) |
| 0.1 | 1.3 | GO:0015112 | nitrate transmembrane transporter activity(GO:0015112) |
| 0.1 | 1.2 | GO:0047617 | acyl-CoA hydrolase activity(GO:0047617) |
| 0.1 | 2.0 | GO:0015386 | potassium:proton antiporter activity(GO:0015386) |
| 0.1 | 0.3 | GO:0008490 | arsenite secondary active transmembrane transporter activity(GO:0008490) arsenite-transmembrane transporting ATPase activity(GO:0015446) anion transmembrane-transporting ATPase activity(GO:0043225) |
| 0.1 | 0.5 | GO:0003977 | UDP-N-acetylglucosamine diphosphorylase activity(GO:0003977) |
| 0.1 | 0.8 | GO:0030332 | cyclin binding(GO:0030332) |
| 0.1 | 1.5 | GO:0070290 | phospholipase D activity(GO:0004630) N-acylphosphatidylethanolamine-specific phospholipase D activity(GO:0070290) |
| 0.1 | 0.3 | GO:0046480 | galactolipid galactosyltransferase activity(GO:0046480) |
| 0.1 | 0.6 | GO:0050017 | L-3-cyanoalanine synthase activity(GO:0050017) |
| 0.1 | 0.4 | GO:0004057 | arginyltransferase activity(GO:0004057) |
| 0.1 | 0.3 | GO:0004749 | ribose phosphate diphosphokinase activity(GO:0004749) |
| 0.1 | 0.5 | GO:0017176 | phosphatidylinositol N-acetylglucosaminyltransferase activity(GO:0017176) |
| 0.1 | 0.5 | GO:0036440 | citrate (Si)-synthase activity(GO:0004108) citrate synthase activity(GO:0036440) |
| 0.1 | 0.3 | GO:0003861 | 3-isopropylmalate dehydratase activity(GO:0003861) |
| 0.1 | 0.9 | GO:0004084 | branched-chain-amino-acid transaminase activity(GO:0004084) |
| 0.1 | 0.4 | GO:0033741 | adenylyl-sulfate reductase activity(GO:0009973) adenylyl-sulfate reductase (glutathione) activity(GO:0033741) |
| 0.1 | 2.3 | GO:0097602 | cullin family protein binding(GO:0097602) |
| 0.1 | 0.4 | GO:0004350 | glutamate 5-kinase activity(GO:0004349) glutamate-5-semialdehyde dehydrogenase activity(GO:0004350) |
| 0.1 | 0.3 | GO:0070003 | threonine-type endopeptidase activity(GO:0004298) threonine-type peptidase activity(GO:0070003) |
| 0.1 | 0.8 | GO:0004715 | non-membrane spanning protein tyrosine kinase activity(GO:0004715) |
| 0.1 | 1.8 | GO:1901981 | phosphatidylinositol phosphate binding(GO:1901981) |
| 0.1 | 0.4 | GO:0004813 | alanine-tRNA ligase activity(GO:0004813) |
| 0.1 | 0.7 | GO:1990137 | plant seed peroxidase activity(GO:1990137) |
| 0.1 | 4.0 | GO:0080043 | quercetin 3-O-glucosyltransferase activity(GO:0080043) |
| 0.1 | 11.9 | GO:0046982 | protein heterodimerization activity(GO:0046982) |
| 0.1 | 0.7 | GO:0016812 | hydrolase activity, acting on carbon-nitrogen (but not peptide) bonds, in cyclic amides(GO:0016812) |
| 0.1 | 4.9 | GO:0061631 | ubiquitin conjugating enzyme activity(GO:0061631) |
| 0.1 | 3.4 | GO:0005096 | GTPase activator activity(GO:0005096) |
| 0.1 | 0.5 | GO:0022841 | leak channel activity(GO:0022840) potassium ion leak channel activity(GO:0022841) narrow pore channel activity(GO:0022842) |
| 0.1 | 3.5 | GO:0004364 | glutathione transferase activity(GO:0004364) |
| 0.1 | 0.4 | GO:0004181 | metallocarboxypeptidase activity(GO:0004181) |
| 0.1 | 0.4 | GO:0003852 | 2-isopropylmalate synthase activity(GO:0003852) |
| 0.1 | 1.0 | GO:0004713 | protein tyrosine kinase activity(GO:0004713) |
| 0.1 | 0.3 | GO:0004106 | chorismate mutase activity(GO:0004106) |
| 0.1 | 4.1 | GO:0015079 | potassium ion transmembrane transporter activity(GO:0015079) |
| 0.1 | 4.4 | GO:0016413 | O-acetyltransferase activity(GO:0016413) |
| 0.1 | 0.3 | GO:0047517 | galactosylgalactosylxylosylprotein 3-beta-glucuronosyltransferase activity(GO:0015018) 1,4-beta-D-xylan synthase activity(GO:0047517) |
| 0.1 | 0.4 | GO:0003863 | 3-methyl-2-oxobutanoate dehydrogenase (2-methylpropanoyl-transferring) activity(GO:0003863) |
| 0.1 | 0.2 | GO:0080046 | quercetin 4'-O-glucosyltransferase activity(GO:0080046) |
| 0.1 | 0.4 | GO:0098599 | palmitoyl hydrolase activity(GO:0098599) |
| 0.1 | 0.3 | GO:0043425 | bHLH transcription factor binding(GO:0043425) |
| 0.1 | 0.5 | GO:0043878 | glyceraldehyde-3-phosphate dehydrogenase (NAD+) (non-phosphorylating) activity(GO:0043878) |
| 0.1 | 0.4 | GO:1901618 | myo-inositol transmembrane transporter activity(GO:0005365) myo-inositol:proton symporter activity(GO:0005366) polyol transmembrane transporter activity(GO:0015166) alcohol transmembrane transporter activity(GO:0015665) organic hydroxy compound transmembrane transporter activity(GO:1901618) |
| 0.1 | 1.7 | GO:0030276 | clathrin binding(GO:0030276) |
| 0.1 | 2.6 | GO:0031490 | chromatin DNA binding(GO:0031490) |
| 0.1 | 0.3 | GO:0002151 | G-quadruplex RNA binding(GO:0002151) |
| 0.1 | 1.7 | GO:0051787 | misfolded protein binding(GO:0051787) |
| 0.1 | 1.1 | GO:0070122 | isopeptidase activity(GO:0070122) |
| 0.1 | 0.7 | GO:0009815 | 1-aminocyclopropane-1-carboxylate oxidase activity(GO:0009815) |
| 0.1 | 0.3 | GO:0043995 | histone acetyltransferase activity (H4-K5 specific)(GO:0043995) |
| 0.1 | 0.2 | GO:0008798 | beta-aspartyl-peptidase activity(GO:0008798) |
| 0.1 | 0.4 | GO:0004535 | poly(A)-specific ribonuclease activity(GO:0004535) |
| 0.1 | 0.4 | GO:0031683 | G-protein coupled receptor binding(GO:0001664) G-protein beta/gamma-subunit complex binding(GO:0031683) |
| 0.1 | 0.5 | GO:0017057 | 6-phosphogluconolactonase activity(GO:0017057) |
| 0.1 | 0.2 | GO:0010291 | carotene beta-ring hydroxylase activity(GO:0010291) |
| 0.1 | 0.4 | GO:0003933 | GTP cyclohydrolase activity(GO:0003933) |
| 0.1 | 0.2 | GO:0003986 | acetyl-CoA hydrolase activity(GO:0003986) |
| 0.1 | 0.7 | GO:0016538 | cyclin-dependent protein serine/threonine kinase regulator activity(GO:0016538) |
| 0.1 | 0.9 | GO:0004675 | transmembrane receptor protein serine/threonine kinase activity(GO:0004675) |
| 0.1 | 0.4 | GO:0045505 | dynein binding(GO:0045502) dynein intermediate chain binding(GO:0045505) dynein light intermediate chain binding(GO:0051959) |
| 0.1 | 0.9 | GO:0051879 | Hsp90 protein binding(GO:0051879) |
| 0.1 | 0.3 | GO:0015924 | mannosyl-oligosaccharide mannosidase activity(GO:0015924) |
| 0.1 | 0.4 | GO:0047627 | hydrolase activity, acting on acid anhydrides, in sulfonyl-containing anhydrides(GO:0016819) adenylylsulfatase activity(GO:0047627) |
| 0.1 | 0.4 | GO:0022829 | porin activity(GO:0015288) wide pore channel activity(GO:0022829) |
| 0.1 | 2.9 | GO:0019888 | protein phosphatase regulator activity(GO:0019888) |
| 0.1 | 0.8 | GO:0032452 | histone demethylase activity(GO:0032452) histone demethylase activity (H3-K4 specific)(GO:0032453) histone demethylase activity (H3-trimethyl-K4 specific)(GO:0034647) |
| 0.1 | 0.9 | GO:0008536 | Ran GTPase binding(GO:0008536) |
| 0.1 | 0.3 | GO:0030523 | dihydrolipoamide S-acyltransferase activity(GO:0030523) |
| 0.1 | 1.0 | GO:0031491 | nucleosome binding(GO:0031491) |
| 0.1 | 0.5 | GO:0030623 | U5 snRNA binding(GO:0030623) |
| 0.1 | 4.6 | GO:0051213 | dioxygenase activity(GO:0051213) |
| 0.1 | 0.1 | GO:0005034 | osmosensor activity(GO:0005034) |
| 0.1 | 4.2 | GO:0043130 | ubiquitin-like protein binding(GO:0032182) ubiquitin binding(GO:0043130) |
| 0.1 | 0.2 | GO:0045430 | chalcone isomerase activity(GO:0045430) |
| 0.1 | 0.5 | GO:0060229 | phospholipase activator activity(GO:0016004) lipase activator activity(GO:0060229) |
| 0.1 | 7.3 | GO:0000978 | RNA polymerase II core promoter proximal region sequence-specific DNA binding(GO:0000978) |
| 0.1 | 4.8 | GO:0019900 | kinase binding(GO:0019900) |
| 0.1 | 0.3 | GO:0001102 | RNA polymerase II activating transcription factor binding(GO:0001102) |
| 0.1 | 1.1 | GO:0003746 | translation elongation factor activity(GO:0003746) |
| 0.1 | 0.9 | GO:0044389 | ubiquitin protein ligase binding(GO:0031625) ubiquitin-like protein ligase binding(GO:0044389) |
| 0.1 | 0.3 | GO:0004177 | aminopeptidase activity(GO:0004177) |
| 0.1 | 0.4 | GO:0004123 | cystathionine gamma-lyase activity(GO:0004123) |
| 0.1 | 0.2 | GO:0004000 | adenosine deaminase activity(GO:0004000) tRNA-specific adenosine deaminase activity(GO:0008251) |
| 0.1 | 8.7 | GO:0061630 | ubiquitin protein ligase activity(GO:0061630) |
| 0.1 | 0.2 | GO:0004751 | ribose-5-phosphate isomerase activity(GO:0004751) |
| 0.1 | 0.2 | GO:0008174 | mRNA methyltransferase activity(GO:0008174) |
| 0.1 | 1.1 | GO:0003684 | damaged DNA binding(GO:0003684) |
| 0.1 | 0.3 | GO:0017070 | U6 snRNA binding(GO:0017070) |
| 0.1 | 0.4 | GO:0032029 | myosin tail binding(GO:0032029) myosin heavy chain binding(GO:0032036) myosin XI tail binding(GO:0080115) |
| 0.1 | 0.3 | GO:0019825 | oxygen binding(GO:0019825) |
| 0.1 | 1.8 | GO:0016832 | aldehyde-lyase activity(GO:0016832) |
| 0.1 | 1.1 | GO:0034593 | phosphatidylinositol-4,5-bisphosphate 5-phosphatase activity(GO:0004439) phosphatidylinositol bisphosphate phosphatase activity(GO:0034593) phosphatidylinositol phosphate 5-phosphatase activity(GO:0034595) |
| 0.1 | 0.6 | GO:0052747 | sinapyl alcohol dehydrogenase activity(GO:0052747) |
| 0.1 | 10.3 | GO:0004842 | ubiquitin-protein transferase activity(GO:0004842) |
| 0.1 | 1.7 | GO:0015035 | protein disulfide oxidoreductase activity(GO:0015035) disulfide oxidoreductase activity(GO:0015036) |
| 0.0 | 0.3 | GO:0004383 | guanylate cyclase activity(GO:0004383) |
| 0.0 | 0.9 | GO:0009982 | pseudouridine synthase activity(GO:0009982) |
| 0.0 | 0.2 | GO:0008253 | 5'-nucleotidase activity(GO:0008253) |
| 0.0 | 0.1 | GO:0004034 | aldose 1-epimerase activity(GO:0004034) |
| 0.0 | 0.4 | GO:0017069 | snRNA binding(GO:0017069) |
| 0.0 | 1.1 | GO:0031386 | protein tag(GO:0031386) |
| 0.0 | 1.5 | GO:0003713 | transcription coactivator activity(GO:0003713) |
| 0.0 | 1.2 | GO:0016671 | oxidoreductase activity, acting on a sulfur group of donors, disulfide as acceptor(GO:0016671) |
| 0.0 | 1.3 | GO:0043022 | ribosome binding(GO:0043022) |
| 0.0 | 6.5 | GO:0005516 | calmodulin binding(GO:0005516) |
| 0.0 | 0.4 | GO:0004017 | adenylate kinase activity(GO:0004017) nucleotide kinase activity(GO:0019201) |
| 0.0 | 0.2 | GO:0004335 | galactokinase activity(GO:0004335) |
| 0.0 | 0.4 | GO:0035673 | oligopeptide transmembrane transporter activity(GO:0035673) peptide transmembrane transporter activity(GO:1904680) |
| 0.0 | 2.1 | GO:0008234 | cysteine-type peptidase activity(GO:0008234) |
| 0.0 | 0.2 | GO:0004473 | malate dehydrogenase (decarboxylating) (NADP+) activity(GO:0004473) |
| 0.0 | 0.3 | GO:0016775 | protein histidine kinase activity(GO:0004673) phosphotransferase activity, nitrogenous group as acceptor(GO:0016775) |
| 0.0 | 0.7 | GO:0004022 | alcohol dehydrogenase (NAD) activity(GO:0004022) |
| 0.0 | 1.0 | GO:0045309 | protein phosphorylated amino acid binding(GO:0045309) phosphoprotein binding(GO:0051219) |
| 0.0 | 0.1 | GO:0035242 | protein-arginine omega-N asymmetric methyltransferase activity(GO:0035242) |
| 0.0 | 3.9 | GO:0004722 | protein serine/threonine phosphatase activity(GO:0004722) |
| 0.0 | 5.6 | GO:0005509 | calcium ion binding(GO:0005509) |
| 0.0 | 0.6 | GO:0019707 | protein-cysteine S-palmitoyltransferase activity(GO:0019706) protein-cysteine S-acyltransferase activity(GO:0019707) |
| 0.0 | 0.2 | GO:0004333 | fumarate hydratase activity(GO:0004333) |
| 0.0 | 3.5 | GO:0015078 | hydrogen ion transmembrane transporter activity(GO:0015078) |
| 0.0 | 2.3 | GO:0000989 | transcription factor activity, transcription factor binding(GO:0000989) transcription cofactor activity(GO:0003712) |
| 0.0 | 0.3 | GO:0016208 | AMP binding(GO:0016208) |
| 0.0 | 2.7 | GO:0003682 | chromatin binding(GO:0003682) |
| 0.0 | 0.2 | GO:0000702 | oxidized base lesion DNA N-glycosylase activity(GO:0000702) |
| 0.0 | 1.5 | GO:0005319 | lipid transporter activity(GO:0005319) |
| 0.0 | 0.2 | GO:0004614 | phosphoglucomutase activity(GO:0004614) |
| 0.0 | 0.2 | GO:0003691 | double-stranded telomeric DNA binding(GO:0003691) |
| 0.0 | 0.6 | GO:0030515 | snoRNA binding(GO:0030515) |
| 0.0 | 0.4 | GO:0032451 | demethylase activity(GO:0032451) |
| 0.0 | 0.4 | GO:0017025 | TBP-class protein binding(GO:0017025) |
| 0.0 | 0.5 | GO:0003756 | protein disulfide isomerase activity(GO:0003756) intramolecular oxidoreductase activity, transposing S-S bonds(GO:0016864) |
| 0.0 | 1.2 | GO:0008080 | N-acetyltransferase activity(GO:0008080) |
| 0.0 | 0.2 | GO:0016889 | endodeoxyribonuclease activity, producing 3'-phosphomonoesters(GO:0016889) |
| 0.0 | 0.3 | GO:0003860 | 3-hydroxyisobutyryl-CoA hydrolase activity(GO:0003860) |
| 0.0 | 0.3 | GO:0004032 | alditol:NADP+ 1-oxidoreductase activity(GO:0004032) |
| 0.0 | 0.3 | GO:0000210 | NAD+ diphosphatase activity(GO:0000210) |
| 0.0 | 0.3 | GO:0004430 | 1-phosphatidylinositol 4-kinase activity(GO:0004430) |
| 0.0 | 1.0 | GO:0001228 | transcriptional activator activity, RNA polymerase II transcription regulatory region sequence-specific binding(GO:0001228) |
| 0.0 | 0.4 | GO:0043175 | RNA polymerase core enzyme binding(GO:0043175) |
| 0.0 | 1.3 | GO:0102483 | scopolin beta-glucosidase activity(GO:0102483) |
| 0.0 | 0.3 | GO:2001070 | starch binding(GO:2001070) |
| 0.0 | 0.6 | GO:0051539 | 4 iron, 4 sulfur cluster binding(GO:0051539) |
| 0.0 | 0.1 | GO:0010385 | double-stranded methylated DNA binding(GO:0010385) |
| 0.0 | 0.2 | GO:0042500 | aspartic endopeptidase activity, intramembrane cleaving(GO:0042500) |
| 0.0 | 0.2 | GO:0005471 | ATP:ADP antiporter activity(GO:0005471) |
| 0.0 | 8.0 | GO:0020037 | heme binding(GO:0020037) |
| 0.0 | 0.3 | GO:0015174 | basic amino acid transmembrane transporter activity(GO:0015174) |
| 0.0 | 0.1 | GO:0001046 | core promoter sequence-specific DNA binding(GO:0001046) core promoter binding(GO:0001047) |
| 0.0 | 0.6 | GO:0035091 | phosphatidylinositol binding(GO:0035091) |
| 0.0 | 6.6 | GO:0004674 | protein serine/threonine kinase activity(GO:0004674) |
| 0.0 | 0.2 | GO:0017091 | AU-rich element binding(GO:0017091) |
| 0.0 | 0.1 | GO:0000285 | 1-phosphatidylinositol-3-phosphate 5-kinase activity(GO:0000285) |
| 0.0 | 1.0 | GO:0019843 | rRNA binding(GO:0019843) |
| 0.0 | 0.2 | GO:0070403 | NAD+ binding(GO:0070403) |
| 0.0 | 0.5 | GO:0015297 | antiporter activity(GO:0015297) |
| 0.0 | 0.6 | GO:0003690 | double-stranded DNA binding(GO:0003690) |
| 0.0 | 0.0 | GO:0047209 | coniferyl-alcohol glucosyltransferase activity(GO:0047209) |
| 0.0 | 0.1 | GO:0046537 | 2,3-bisphosphoglycerate-independent phosphoglycerate mutase activity(GO:0046537) |
| 0.0 | 0.1 | GO:0042895 | tetracycline transporter activity(GO:0008493) toxin transporter activity(GO:0019534) antibiotic transporter activity(GO:0042895) |
| 0.0 | 0.0 | GO:0046423 | allene-oxide cyclase activity(GO:0046423) |
| 0.0 | 0.1 | GO:0047938 | glucose-6-phosphate 1-epimerase activity(GO:0047938) |
| 0.0 | 0.1 | GO:0005262 | calcium channel activity(GO:0005262) |
| 0.0 | 8.2 | GO:0043565 | sequence-specific DNA binding(GO:0043565) |
Gene overrepresentation in curated gene sets: canonical pathways category:
| Log-likelihood per target | Total log-likelihood | Term | Description |
|---|---|---|---|
| 0.7 | 2.0 | SIG PIP3 SIGNALING IN CARDIAC MYOCTES | Genes related to PIP3 signaling in cardiac myocytes |
| 0.4 | 1.9 | PID CIRCADIAN PATHWAY | Circadian rhythm pathway |
| 0.2 | 0.9 | SA G1 AND S PHASES | Cdk2, 4, and 6 bind cyclin D in G1, while cdk2/cyclin E promotes the G1/S transition. |
| 0.2 | 0.5 | SIG CHEMOTAXIS | Genes related to chemotaxis |
| 0.2 | 0.5 | PID HNF3B PATHWAY | FOXA2 and FOXA3 transcription factor networks |
| 0.2 | 0.6 | PID ERBB1 DOWNSTREAM PATHWAY | ErbB1 downstream signaling |
| 0.1 | 0.6 | PID IL4 2PATHWAY | IL4-mediated signaling events |
| 0.1 | 0.7 | PID S1P META PATHWAY | Sphingosine 1-phosphate (S1P) pathway |
| 0.1 | 0.8 | PID AP1 PATHWAY | AP-1 transcription factor network |
| 0.1 | 0.9 | PID MTOR 4PATHWAY | mTOR signaling pathway |
| 0.1 | 0.4 | PID TAP63 PATHWAY | Validated transcriptional targets of TAp63 isoforms |
| 0.1 | 0.1 | PID MYC REPRESS PATHWAY | Validated targets of C-MYC transcriptional repression |
| 0.1 | 0.1 | PID EPHA2 FWD PATHWAY | EPHA2 forward signaling |
| 0.1 | 0.9 | PID RAC1 PATHWAY | RAC1 signaling pathway |
| 0.1 | 1.0 | PID CXCR4 PATHWAY | CXCR4-mediated signaling events |
| 0.1 | 0.2 | ST B CELL ANTIGEN RECEPTOR | B Cell Antigen Receptor |
| 0.0 | 0.3 | PID CMYB PATHWAY | C-MYB transcription factor network |
| 0.0 | 0.1 | PID TELOMERASE PATHWAY | Regulation of Telomerase |
| 0.0 | 0.0 | PID REELIN PATHWAY | Reelin signaling pathway |
Gene overrepresentation in curated gene sets: REACTOME pathways category:
| Log-likelihood per target | Total log-likelihood | Term | Description |
|---|---|---|---|
| 0.5 | 2.1 | REACTOME BMAL1 CLOCK NPAS2 ACTIVATES CIRCADIAN EXPRESSION | Genes involved in BMAL1:CLOCK/NPAS2 Activates Circadian Expression |
| 0.5 | 4.2 | REACTOME METABOLISM OF AMINO ACIDS AND DERIVATIVES | Genes involved in Metabolism of amino acids and derivatives |
| 0.5 | 2.6 | REACTOME RECYCLING OF BILE ACIDS AND SALTS | Genes involved in Recycling of bile acids and salts |
| 0.4 | 1.7 | REACTOME METABOLISM OF NUCLEOTIDES | Genes involved in Metabolism of nucleotides |
| 0.3 | 1.9 | REACTOME GLYCEROPHOSPHOLIPID BIOSYNTHESIS | Genes involved in Glycerophospholipid biosynthesis |
| 0.3 | 0.9 | REACTOME TRNA AMINOACYLATION | Genes involved in tRNA Aminoacylation |
| 0.3 | 1.4 | REACTOME L1CAM INTERACTIONS | Genes involved in L1CAM interactions |
| 0.2 | 0.7 | REACTOME HDL MEDIATED LIPID TRANSPORT | Genes involved in HDL-mediated lipid transport |
| 0.2 | 0.8 | REACTOME INTRINSIC PATHWAY FOR APOPTOSIS | Genes involved in Intrinsic Pathway for Apoptosis |
| 0.2 | 0.6 | REACTOME INTEGRATION OF ENERGY METABOLISM | Genes involved in Integration of energy metabolism |
| 0.2 | 1.7 | REACTOME FATTY ACID TRIACYLGLYCEROL AND KETONE BODY METABOLISM | Genes involved in Fatty acid, triacylglycerol, and ketone body metabolism |
| 0.2 | 0.5 | REACTOME SYNTHESIS OF PIPS AT THE GOLGI MEMBRANE | Genes involved in Synthesis of PIPs at the Golgi membrane |
| 0.2 | 4.9 | REACTOME ABC FAMILY PROTEINS MEDIATED TRANSPORT | Genes involved in ABC-family proteins mediated transport |
| 0.2 | 1.4 | REACTOME INTERFERON SIGNALING | Genes involved in Interferon Signaling |
| 0.2 | 0.5 | REACTOME IL1 SIGNALING | Genes involved in Interleukin-1 signaling |
| 0.2 | 0.5 | REACTOME NRAGE SIGNALS DEATH THROUGH JNK | Genes involved in NRAGE signals death through JNK |
| 0.1 | 0.2 | REACTOME ABACAVIR TRANSPORT AND METABOLISM | Genes involved in Abacavir transport and metabolism |
| 0.1 | 0.5 | REACTOME SIGNALING BY RHO GTPASES | Genes involved in Signaling by Rho GTPases |
| 0.1 | 0.5 | REACTOME FORMATION OF INCISION COMPLEX IN GG NER | Genes involved in Formation of incision complex in GG-NER |
| 0.1 | 1.3 | REACTOME METABOLISM OF LIPIDS AND LIPOPROTEINS | Genes involved in Metabolism of lipids and lipoproteins |
| 0.1 | 0.2 | REACTOME MRNA DECAY BY 5 TO 3 EXORIBONUCLEASE | Genes involved in mRNA Decay by 5' to 3' Exoribonuclease |
| 0.1 | 0.5 | REACTOME RNA POL II PRE TRANSCRIPTION EVENTS | Genes involved in RNA Polymerase II Pre-transcription Events |
| 0.0 | 0.2 | REACTOME E2F ENABLED INHIBITION OF PRE REPLICATION COMPLEX FORMATION | Genes involved in E2F-enabled inhibition of pre-replication complex formation |
| 0.0 | 0.1 | REACTOME ASSOCIATION OF TRIC CCT WITH TARGET PROTEINS DURING BIOSYNTHESIS | Genes involved in Association of TriC/CCT with target proteins during biosynthesis |
| 0.0 | 0.2 | REACTOME INNATE IMMUNE SYSTEM | Genes involved in Innate Immune System |