Project
GSE43616: Time-course of wild-type Arabidopsis leaf
Navigation
Downloads
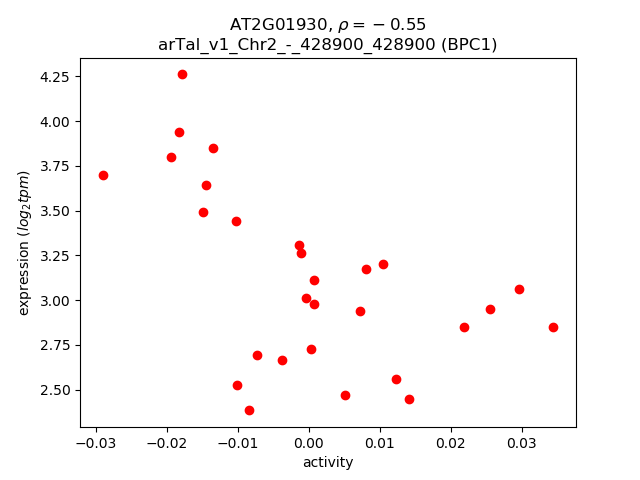
Results for AT2G01930
Z-value: 1.00
Transcription factors associated with AT2G01930
| Gene Symbol | Gene ID | Gene Info |
|---|---|---|
|
AT2G01930
|
AT2G01930 | basic pentacysteine1 |
Activity-expression correlation:
| Gene | Promoter | Pearson corr. coef. | P-value | Plot |
|---|---|---|---|---|
| BPC1 | arTal_v1_Chr2_-_428900_428900 | -0.55 | 2.5e-03 | Click! |
Activity profile of AT2G01930 motif
Sorted Z-values of AT2G01930 motif
| Promoter | Log-likelihood | Transcript | Gene | Gene Info |
|---|---|---|---|---|
| arTal_v1_Chr2_-_18744322_18744322 | 4.12 |
AT2G45470.1
|
FLA8
|
FASCICLIN-like arabinogalactan protein 8 |
| arTal_v1_Chr2_+_2199151_2199151 | 3.49 |
AT2G05790.1
|
AT2G05790
|
O-Glycosyl hydrolases family 17 protein |
| arTal_v1_Chr5_+_26767599_26767599 | 3.21 |
AT5G67070.1
|
RALFL34
|
ralf-like 34 |
| arTal_v1_Chr2_-_1800472_1800472 | 3.16 |
AT2G05070.1
|
LHCB2.2
|
photosystem II light harvesting complex protein 2.2 |
| arTal_v1_Chr3_-_6882235_6882315 | 2.92 |
AT3G19820.3
AT3G19820.1 AT3G19820.2 |
DWF1
|
cell elongation protein / DWARF1 / DIMINUTO (DIM) |
| arTal_v1_Chr2_-_12433796_12433796 | 2.92 |
AT2G28950.1
|
EXPA6
|
expansin A6 |
| arTal_v1_Chr2_+_1676999_1676999 | 2.85 |
AT2G04780.2
|
FLA7
|
FASCICLIN-like arabinoogalactan 7 |
| arTal_v1_Chr2_+_15059763_15059763 | 2.82 |
AT2G35860.1
|
FLA16
|
FASCICLIN-like arabinogalactan protein 16 precursor |
| arTal_v1_Chr1_+_17918207_17918207 | 2.81 |
AT1G48480.1
|
RKL1
|
receptor-like kinase 1 |
| arTal_v1_Chr2_+_1676717_1676717 | 2.79 |
AT2G04780.1
|
FLA7
|
FASCICLIN-like arabinoogalactan 7 |
| arTal_v1_Chr1_+_907523_907651 | 2.69 |
AT1G03630.1
AT1G03630.2 |
POR C
|
protochlorophyllide oxidoreductase C |
| arTal_v1_Chr1_+_27452748_27452766 | 2.57 |
AT1G72970.1
AT1G72970.2 |
HTH
|
Glucose-methanol-choline (GMC) oxidoreductase family protein |
| arTal_v1_Chr3_-_23328789_23328789 | 2.47 |
AT3G63140.1
|
CSP41A
|
chloroplast stem-loop binding protein of 41 kDa |
| arTal_v1_Chr4_-_12772438_12772479 | 2.44 |
AT4G24780.1
AT4G24780.2 |
AT4G24780
|
Pectin lyase-like superfamily protein |
| arTal_v1_Chr5_-_990630_990630 | 2.43 |
AT5G03760.1
|
ATCSLA09
|
Nucleotide-diphospho-sugar transferases superfamily protein |
| arTal_v1_Chr4_+_16357421_16357421 | 2.32 |
AT4G34160.1
|
CYCD3%3B1
|
CYCLIN D3;1 |
| arTal_v1_Chr3_+_2563803_2563803 | 2.32 |
AT3G08030.1
|
AT3G08030
|
DNA-directed RNA polymerase subunit beta (Protein of unknown function, DUF642) |
| arTal_v1_Chr3_+_2564153_2564153 | 2.28 |
AT3G08030.2
|
AT3G08030
|
DNA-directed RNA polymerase subunit beta (Protein of unknown function, DUF642) |
| arTal_v1_Chr5_-_18371021_18371021 | 2.27 |
AT5G45340.2
AT5G45340.1 |
CYP707A3
|
cytochrome P450, family 707, subfamily A, polypeptide 3 |
| arTal_v1_Chr4_-_16384468_16384468 | 2.26 |
AT4G34220.1
|
AT4G34220
|
Leucine-rich repeat protein kinase family protein |
| arTal_v1_Chr2_-_11214662_11214662 | 2.26 |
AT2G26330.1
|
ER
|
Leucine-rich receptor-like protein kinase family protein |
| arTal_v1_Chr1_-_15607966_15607966 | 2.26 |
AT1G41830.1
|
SKS6
|
SKU5-similar 6 |
| arTal_v1_Chr3_-_21949796_21949796 | 2.14 |
AT3G59400.1
|
GUN4
|
protein GENOMES UNCOUPLED 4 |
| arTal_v1_Chr2_-_12646057_12646057 | 2.13 |
AT2G29550.1
|
TUB7
|
tubulin beta-7 chain |
| arTal_v1_Chr1_+_23911024_23911024 | 2.10 |
AT1G64390.1
|
GH9C2
|
glycosyl hydrolase 9C2 |
| arTal_v1_Chr5_-_5146458_5146458 | 2.10 |
AT5G15780.1
|
AT5G15780
|
Pollen Ole e 1 allergen and extensin family protein |
| arTal_v1_Chr2_+_2322215_2322222 | 2.09 |
AT2G05990.1
AT2G05990.2 |
MOD1
|
NAD(P)-binding Rossmann-fold superfamily protein |
| arTal_v1_Chr2_+_19521774_19521774 | 2.07 |
AT2G47590.1
|
PHR2
|
photolyase/blue-light receptor 2 |
| arTal_v1_Chr2_-_12277417_12277417 | 2.07 |
AT2G28630.2
|
KCS12
|
3-ketoacyl-CoA synthase 12 |
| arTal_v1_Chr5_-_345457_345457 | 2.06 |
AT5G01890.1
|
AT5G01890
|
Leucine-rich receptor-like protein kinase family protein |
| arTal_v1_Chr5_+_6457026_6457026 | 2.02 |
AT5G19190.1
|
AT5G19190
|
hypothetical protein |
| arTal_v1_Chr2_-_12277245_12277245 | 2.01 |
AT2G28630.1
|
KCS12
|
3-ketoacyl-CoA synthase 12 |
| arTal_v1_Chr2_-_18914739_18914739 | 2.01 |
AT2G45970.1
|
CYP86A8
|
cytochrome P450, family 86, subfamily A, polypeptide 8 |
| arTal_v1_Chr3_+_6154363_6154363 | 2.01 |
AT3G18000.1
|
XPL1
|
S-adenosyl-L-methionine-dependent methyltransferases superfamily protein |
| arTal_v1_Chr2_+_9034056_9034056 | 1.98 |
AT2G21050.1
|
LAX2
|
like AUXIN RESISTANT 2 |
| arTal_v1_Chr4_+_17986384_17986384 | 1.97 |
AT4G38430.1
|
ROPGEF1
|
rho guanyl-nucleotide exchange factor 1 |
| arTal_v1_Chr1_+_18351324_18351324 | 1.94 |
AT1G49580.1
|
AT1G49580
|
Calcium-dependent protein kinase (CDPK) family protein |
| arTal_v1_Chr2_+_19469571_19469612 | 1.94 |
AT2G47440.2
AT2G47440.1 |
AT2G47440
|
Tetratricopeptide repeat (TPR)-like superfamily protein |
| arTal_v1_Chr2_-_12785037_12785037 | 1.94 |
AT2G29980.2
|
FAD3
|
fatty acid desaturase 3 |
| arTal_v1_Chr3_+_20344785_20344785 | 1.93 |
AT3G54920.1
|
PMR6
|
Pectin lyase-like superfamily protein |
| arTal_v1_Chr2_-_12785190_12785190 | 1.91 |
AT2G29980.1
|
FAD3
|
fatty acid desaturase 3 |
| arTal_v1_Chr2_+_15980848_15980848 | 1.91 |
AT2G38140.1
|
PSRP4
|
plastid-specific ribosomal protein 4 |
| arTal_v1_Chr4_-_15312987_15312987 | 1.89 |
AT4G31590.1
|
CSLC5
|
Cellulose-synthase-like C5 |
| arTal_v1_Chr2_+_18691664_18691664 | 1.88 |
AT2G45340.1
|
AT2G45340
|
Leucine-rich repeat protein kinase family protein |
| arTal_v1_Chr5_+_5431584_5431584 | 1.88 |
AT5G16590.1
|
AT5G16590
|
Leucine-rich repeat protein kinase family protein |
| arTal_v1_Chr3_+_21948851_21948851 | 1.87 |
AT3G59410.3
|
GCN2
|
protein kinase family protein |
| arTal_v1_Chr4_-_407142_407142 | 1.87 |
AT4G00950.1
|
MEE47
|
hypothetical protein (DUF688) |
| arTal_v1_Chr5_+_7778017_7778095 | 1.86 |
AT5G23120.2
AT5G23120.1 |
HCF136
|
photosystem II stability/assembly factor, chloroplast (HCF136) |
| arTal_v1_Chr3_-_22256177_22256177 | 1.86 |
AT3G60220.1
|
ATL4
|
TOXICOS EN LEVADURA 4 |
| arTal_v1_Chr1_-_6421188_6421188 | 1.82 |
AT1G18650.1
AT1G18650.2 |
PDCB3
|
plasmodesmata callose-binding protein 3 |
| arTal_v1_Chr3_+_2612175_2612175 | 1.81 |
AT3G08600.1
|
AT3G08600
|
transmembrane protein, putative (DUF1191) |
| arTal_v1_Chr4_-_18510555_18510555 | 1.81 |
AT4G39900.1
|
AT4G39900
|
adenine deaminase |
| arTal_v1_Chr3_+_22745514_22745514 | 1.79 |
AT3G61470.1
|
LHCA2
|
photosystem I light harvesting complex protein |
| arTal_v1_Chr4_-_8454144_8454159 | 1.73 |
AT4G14740.4
AT4G14740.2 AT4G14740.1 |
AT4G14740
|
auxin canalization protein (DUF828) |
| arTal_v1_Chr5_-_21873454_21873454 | 1.70 |
AT5G53880.1
|
AT5G53880
|
hypothetical protein |
| arTal_v1_Chr3_-_10877578_10877578 | 1.70 |
AT3G28860.1
|
ABCB19
|
ATP binding cassette subfamily B19 |
| arTal_v1_Chr3_-_18834834_18834834 | 1.70 |
AT3G50685.1
|
AT3G50685
|
anti-muellerian hormone type-2 receptor |
| arTal_v1_Chr5_-_5833989_5834000 | 1.69 |
AT5G17700.2
AT5G17700.1 AT5G17700.3 |
AT5G17700
|
MATE efflux family protein |
| arTal_v1_Chr1_+_19879405_19879405 | 1.67 |
AT1G53300.1
|
TTL1
|
tetratricopetide-repeat thioredoxin-like 1 |
| arTal_v1_Chr1_+_19857351_19857351 | 1.67 |
AT1G53250.1
|
AT1G53250
|
histone-lysine N-methyltransferase, H3 lysine-79 specific-like protein |
| arTal_v1_Chr2_+_12000239_12000388 | 1.67 |
AT2G28150.2
AT2G28150.3 |
AT2G28150
|
UPSTREAM OF FLC protein (DUF966) |
| arTal_v1_Chr5_+_25727126_25727268 | 1.66 |
AT5G64330.1
AT5G64330.2 AT5G64330.3 |
NPH3
|
Phototropic-responsive NPH3 family protein |
| arTal_v1_Chr4_+_10259600_10259600 | 1.66 |
AT4G18640.1
|
MRH1
|
Leucine-rich repeat protein kinase family protein |
| arTal_v1_Chr3_-_7066729_7066729 | 1.66 |
AT3G20260.1
|
AT3G20260
|
DUF1666 family protein (DUF1666) |
| arTal_v1_Chr5_-_24640639_24640765 | 1.66 |
AT5G61270.3
AT5G61270.1 AT5G61270.2 |
PIF7
|
phytochrome-interacting factor7 |
| arTal_v1_Chr2_+_15117015_15117015 | 1.63 |
AT2G36000.2
AT2G36000.1 |
EMB3114
|
Mitochondrial transcription termination factor family protein |
| arTal_v1_Chr2_+_11481326_11481326 | 1.63 |
AT2G26910.1
|
ABCG32
|
pleiotropic drug resistance 4 |
| arTal_v1_Chr3_-_21760390_21760390 | 1.60 |
AT3G58850.1
|
PAR2
|
phy rapidly regulated 2 |
| arTal_v1_Chr1_+_8333472_8333472 | 1.60 |
AT1G23480.4
AT1G23480.2 |
CSLA03
|
cellulose synthase-like A3 |
| arTal_v1_Chr3_+_2167730_2167730 | 1.59 |
AT3G06868.1
|
AT3G06868
|
vitellogenin-like protein |
| arTal_v1_Chr3_-_17658353_17658353 | 1.59 |
AT3G47860.1
|
CHL
|
chloroplastic lipocalin |
| arTal_v1_Chr4_-_11785937_11785937 | 1.59 |
AT4G22290.1
|
AT4G22290
|
Ubiquitin-specific protease family C19-related protein |
| arTal_v1_Chr1_+_7680390_7680481 | 1.59 |
AT1G21880.2
AT1G21880.1 |
LYM1
|
lysm domain GPI-anchored protein 1 precursor |
| arTal_v1_Chr2_-_1021186_1021186 | 1.58 |
AT2G03350.1
|
AT2G03350
|
DUF538 family protein (Protein of unknown function, DUF538) |
| arTal_v1_Chr2_+_12834821_12834860 | 1.57 |
AT2G30070.2
AT2G30070.1 |
KT1
|
potassium transporter 1 |
| arTal_v1_Chr2_-_9224432_9224496 | 1.56 |
AT2G21540.2
AT2G21540.3 AT2G21540.4 AT2G21540.5 |
SFH3
|
SEC14-like 3 |
| arTal_v1_Chr2_-_17161293_17161294 | 1.54 |
AT2G41170.2
AT2G41170.1 AT2G41170.3 |
AT2G41170
|
F-box family protein |
| arTal_v1_Chr3_-_18883033_18883033 | 1.53 |
AT3G50800.1
|
AT3G50800
|
hypothetical protein |
| arTal_v1_Chr4_+_17739514_17739514 | 1.51 |
AT4G37750.1
|
ANT
|
Integrase-type DNA-binding superfamily protein |
| arTal_v1_Chr5_-_25081141_25081141 | 1.51 |
AT5G62470.2
|
MYB96
|
myb domain protein 96 |
| arTal_v1_Chr5_+_16127725_16127725 | 1.51 |
AT5G40330.1
|
MYB23
|
myb domain protein 23 |
| arTal_v1_Chr2_-_18706266_18706401 | 1.51 |
AT2G45400.4
AT2G45400.2 AT2G45400.1 |
BEN1
|
NAD(P)-binding Rossmann-fold superfamily protein |
| arTal_v1_Chr1_-_29147498_29147646 | 1.50 |
AT1G77580.1
AT1G77580.3 AT1G77580.4 AT1G77580.2 |
AT1G77580
|
filament-like protein (DUF869) |
| arTal_v1_Chr1_+_4384304_4384318 | 1.49 |
AT1G12860.1
AT1G12860.2 AT1G12860.3 |
SCRM2
|
basic helix-loop-helix (bHLH) DNA-binding superfamily protein |
| arTal_v1_Chr2_-_7523177_7523177 | 1.49 |
AT2G17300.1
|
AT2G17300
|
hypothetical protein |
| arTal_v1_Chr2_-_18630779_18630779 | 1.46 |
AT2G45190.1
|
AFO
|
Plant-specific transcription factor YABBY family protein |
| arTal_v1_Chr5_-_16831618_16831618 | 1.45 |
AT5G42100.1
|
BG_PPAP
|
beta-1,3-glucanase |
| arTal_v1_Chr2_-_18630428_18630428 | 1.45 |
AT2G45190.2
|
AFO
|
Plant-specific transcription factor YABBY family protein |
| arTal_v1_Chr5_+_4156501_4156501 | 1.44 |
AT5G13100.1
|
AT5G13100
|
Gap junction beta-4 protein |
| arTal_v1_Chr5_-_27504_27504 | 1.44 |
AT5G01075.1
|
AT5G01075
|
Glycosyl hydrolase family 35 protein |
| arTal_v1_Chr5_-_25080858_25080858 | 1.44 |
AT5G62470.1
|
MYB96
|
myb domain protein 96 |
| arTal_v1_Chr5_-_16831239_16831239 | 1.43 |
AT5G42100.2
|
BG_PPAP
|
beta-1,3-glucanase |
| arTal_v1_Chr3_-_5227935_5227935 | 1.41 |
AT3G15480.1
|
AT3G15480
|
fiber (DUF1218) |
| arTal_v1_Chr5_+_3550300_3550300 | 1.40 |
AT5G11160.1
AT5G11160.2 |
APT5
|
adenine phosphoribosyltransferase 5 |
| arTal_v1_Chr2_+_11999736_11999736 | 1.39 |
AT2G28150.1
|
AT2G28150
|
UPSTREAM OF FLC protein (DUF966) |
| arTal_v1_Chr3_-_23367592_23367592 | 1.38 |
AT3G63240.1
AT3G63240.2 |
AT3G63240
|
DNAse I-like superfamily protein |
| arTal_v1_Chr2_+_13824663_13824664 | 1.38 |
AT2G32560.1
AT2G32560.2 |
AT2G32560
|
F-box family protein |
| arTal_v1_Chr5_-_4344792_4344792 | 1.38 |
AT5G13520.1
|
AT5G13520
|
peptidase M1 family protein |
| arTal_v1_Chr4_-_8453179_8453179 | 1.36 |
AT4G14740.3
|
AT4G14740
|
auxin canalization protein (DUF828) |
| arTal_v1_Chr4_+_10414428_10414463 | 1.36 |
AT4G19020.1
AT4G19020.2 |
CMT2
|
chromomethylase 2 |
| arTal_v1_Chr5_-_22080341_22080341 | 1.35 |
AT5G54380.1
|
THE1
|
protein kinase family protein |
| arTal_v1_Chr5_-_16267406_16267406 | 1.35 |
AT5G40610.1
|
GPDHp
|
NAD-dependent glycerol-3-phosphate dehydrogenase family protein |
| arTal_v1_Chr4_-_10309591_10309591 | 1.35 |
AT4G18760.1
|
RLP51
|
receptor like protein 51 |
| arTal_v1_Chr5_-_21997326_21997326 | 1.32 |
AT5G54200.1
|
AT5G54200
|
Transducin/WD40 repeat-like superfamily protein |
| arTal_v1_Chr4_+_1374160_1374160 | 1.31 |
AT4G03100.1
|
AT4G03100
|
Rho GTPase activating protein with PAK-box/P21-Rho-binding domain-containing protein |
| arTal_v1_Chr4_+_1440146_1440177 | 1.31 |
AT4G03280.1
AT4G03280.2 |
PETC
|
photosynthetic electron transfer C |
| arTal_v1_Chr5_-_10455681_10455807 | 1.30 |
AT5G28490.1
AT5G28491.1 |
LSH1
AT5G28491
|
LIGHT-DEPENDENT SHORT HYPOCOTYLS-like protein (DUF640) hypothetical protein |
| arTal_v1_Chr5_-_2845530_2845530 | 1.30 |
AT5G08720.1
|
AT5G08720
|
polyketide cyclase/dehydrase/lipid transporter |
| arTal_v1_Chr5_+_19031301_19031350 | 1.30 |
AT5G46880.1
AT5G46880.3 |
HB-7
|
homeobox-7 |
| arTal_v1_Chr3_+_20547661_20547661 | 1.29 |
AT3G55420.1
|
AT3G55420
|
hypothetical protein |
| arTal_v1_Chr5_-_5841690_5841858 | 1.28 |
AT5G17710.1
AT5G17710.3 AT5G17710.2 |
EMB1241
|
Co-chaperone GrpE family protein |
| arTal_v1_Chr3_-_11924574_11924617 | 1.28 |
AT3G30300.1
AT3G30300.2 |
AT3G30300
|
O-fucosyltransferase family protein |
| arTal_v1_Chr2_-_18013252_18013252 | 1.28 |
AT2G43360.1
|
BIO2
|
Radical SAM superfamily protein |
| arTal_v1_Chr4_+_14866763_14866763 | 1.27 |
AT4G30400.1
|
AT4G30400
|
RING/U-box superfamily protein |
| arTal_v1_Chr2_+_17446744_17446744 | 1.27 |
AT2G41820.1
|
AT2G41820
|
Leucine-rich repeat protein kinase family protein |
| arTal_v1_Chr1_+_8333696_8333696 | 1.25 |
AT1G23480.3
|
CSLA03
|
cellulose synthase-like A3 |
| arTal_v1_Chr1_+_26061774_26061774 | 1.25 |
AT1G69320.1
|
CLE10
|
CLAVATA3/ESR-RELATED 10 |
| arTal_v1_Chr2_-_18778374_18778374 | 1.24 |
AT2G45560.3
AT2G45560.2 |
CYP76C1
|
cytochrome P450, family 76, subfamily C, polypeptide 1 |
| arTal_v1_Chr2_-_18778676_18778676 | 1.23 |
AT2G45560.1
|
CYP76C1
|
cytochrome P450, family 76, subfamily C, polypeptide 1 |
| arTal_v1_Chr1_-_1611815_1611840 | 1.23 |
AT1G05470.2
AT1G05470.1 |
CVP2
|
DNAse I-like superfamily protein |
| arTal_v1_Chr1_+_20061405_20061482 | 1.22 |
AT1G53730.2
AT1G53730.1 |
SRF6
|
STRUBBELIG-receptor family 6 |
| arTal_v1_Chr4_+_10883921_10883921 | 1.22 |
AT4G20140.1
|
GSO1
|
Leucine-rich repeat transmembrane protein kinase |
| arTal_v1_Chr3_-_18817405_18817405 | 1.21 |
AT3G50660.1
AT3G50660.2 |
DWF4
|
Cytochrome P450 superfamily protein |
| arTal_v1_Chr5_-_24589580_24589580 | 1.21 |
AT5G61130.1
|
PDCB1
|
plasmodesmata callose-binding protein 1 |
| arTal_v1_Chr1_-_9024081_9024081 | 1.21 |
AT1G26100.1
|
AT1G26100
|
Cytochrome b561/ferric reductase transmembrane protein family |
| arTal_v1_Chr5_-_573634_573634 | 1.21 |
AT5G02550.1
|
AT5G02550
|
hypothetical protein |
| arTal_v1_Chr3_-_19281345_19281393 | 1.20 |
AT3G51950.3
AT3G51950.1 AT3G51950.2 |
AT3G51950
|
Zinc finger (CCCH-type) family protein / RNA recognition motif (RRM)-containing protein |
| arTal_v1_Chr5_-_25716901_25716901 | 1.20 |
AT5G64290.1
|
DIT2.1
|
dicarboxylate transport 2.1 |
| arTal_v1_Chr1_+_9351160_9351160 | 1.20 |
AT1G26945.1
|
KDR
|
basic helix-loop-helix (bHLH) DNA-binding superfamily protein |
| arTal_v1_Chr5_+_23144947_23144947 | 1.19 |
AT5G57130.1
|
AT5G57130
|
Clp amino terminal domain-containing protein |
| arTal_v1_Chr1_-_4940695_4940695 | 1.18 |
AT1G14440.2
|
HB31
|
homeobox protein 31 |
| arTal_v1_Chr5_+_10477771_10477771 | 1.17 |
AT5G28500.2
|
AT5G28500
|
rubisco accumulation factor-like protein |
| arTal_v1_Chr5_+_10477556_10477556 | 1.17 |
AT5G28500.1
|
AT5G28500
|
rubisco accumulation factor-like protein |
| arTal_v1_Chr4_-_16154722_16154742 | 1.16 |
AT4G33625.2
AT4G33625.3 AT4G33625.1 |
AT4G33625
|
vacuole protein |
| arTal_v1_Chr3_-_19280823_19280823 | 1.15 |
AT3G51950.4
|
AT3G51950
|
Zinc finger (CCCH-type) family protein / RNA recognition motif (RRM)-containing protein |
| arTal_v1_Chr4_+_13985023_13985023 | 1.14 |
AT4G28190.2
|
ULT1
|
Developmental regulator, ULTRAPETALA |
| arTal_v1_Chr1_+_9996713_9996713 | 1.13 |
AT1G28440.1
|
HSL1
|
HAESA-like 1 |
| arTal_v1_Chr1_-_23542198_23542233 | 1.11 |
AT1G63480.6
AT1G63480.7 AT1G63480.4 AT1G63480.5 AT1G63480.3 AT1G63480.1 AT1G63480.2 |
AT1G63480
|
AT hook motif DNA-binding family protein |
| arTal_v1_Chr1_+_8332862_8332862 | 1.11 |
AT1G23480.1
|
CSLA03
|
cellulose synthase-like A3 |
| arTal_v1_Chr4_-_75384_75384 | 1.09 |
AT4G00180.2
|
YAB3
|
Plant-specific transcription factor YABBY family protein |
| arTal_v1_Chr2_-_19407098_19407098 | 1.09 |
AT2G47260.1
|
WRKY23
|
WRKY DNA-binding protein 23 |
| arTal_v1_Chr3_-_19686984_19686984 | 1.08 |
AT3G53100.1
|
AT3G53100
|
GDSL-like Lipase/Acylhydrolase superfamily protein |
| arTal_v1_Chr4_-_75576_75576 | 1.08 |
AT4G00180.1
|
YAB3
|
Plant-specific transcription factor YABBY family protein |
| arTal_v1_Chr4_-_2482447_2482447 | 1.07 |
AT4G04890.1
|
PDF2
|
protodermal factor 2 |
| arTal_v1_Chr4_+_13984695_13984695 | 1.07 |
AT4G28190.1
|
ULT1
|
Developmental regulator, ULTRAPETALA |
| arTal_v1_Chr4_+_17472980_17473004 | 1.07 |
AT4G37080.4
AT4G37080.3 |
AT4G37080
|
ternary complex factor MIP1 leucine-zipper protein (Protein of unknown function, DUF547) |
| arTal_v1_Chr4_-_16533001_16533034 | 1.06 |
AT4G34610.2
AT4G34610.4 |
BLH6
|
BEL1-like homeodomain 6 |
| arTal_v1_Chr5_+_20993424_20993493 | 1.06 |
AT5G51670.1
AT5G51670.2 |
AT5G51670
|
hypothetical protein (DUF668) |
| arTal_v1_Chr1_+_23614340_23614384 | 1.05 |
AT1G63680.2
AT1G63680.1 AT1G63680.3 |
MURE
|
ALBINO OR PALE-GREEN 13 |
| arTal_v1_Chr4_-_8271136_8271176 | 1.05 |
AT4G14360.1
AT4G14360.2 |
AT4G14360
|
S-adenosyl-L-methionine-dependent methyltransferases superfamily protein |
| arTal_v1_Chr2_+_18145439_18145439 | 1.05 |
AT2G43800.1
|
AT2G43800
|
Actin-binding FH2 (formin homology 2) family protein |
| arTal_v1_Chr5_-_4074619_4074619 | 1.04 |
AT5G12900.1
|
AT5G12900
|
DNA double-strand break repair RAD50 ATPase |
| arTal_v1_Chr1_+_25861094_25861094 | 1.04 |
AT1G68810.1
|
AT1G68810
|
basic helix-loop-helix (bHLH) DNA-binding superfamily protein |
| arTal_v1_Chr5_+_25881033_25881033 | 1.04 |
AT5G64740.1
|
CESA6
|
cellulose synthase 6 |
| arTal_v1_Chr3_+_4403355_4403355 | 1.04 |
AT3G13510.1
|
AT3G13510
|
carboxyl-terminal peptidase, putative (DUF239) |
| arTal_v1_Chr1_-_4941332_4941332 | 1.04 |
AT1G14440.1
|
HB31
|
homeobox protein 31 |
| arTal_v1_Chr4_-_16533362_16533362 | 1.04 |
AT4G34610.1
AT4G34610.3 |
BLH6
|
BEL1-like homeodomain 6 |
| arTal_v1_Chr2_+_14985470_14985488 | 1.04 |
AT2G35650.1
AT2G35650.2 AT2G35650.3 |
CSLA07
|
cellulose synthase like |
| arTal_v1_Chr4_-_2481590_2481590 | 1.03 |
AT4G04890.2
|
PDF2
|
protodermal factor 2 |
| arTal_v1_Chr5_+_22907264_22907264 | 1.03 |
AT5G56590.1
|
AT5G56590
|
O-Glycosyl hydrolases family 17 protein |
| arTal_v1_Chr5_+_26136002_26136002 | 1.02 |
AT5G65410.1
|
HB25
|
homeobox protein 25 |
| arTal_v1_Chr2_-_18184089_18184089 | 1.02 |
AT2G43900.1
AT2G43900.2 |
5PTase12
|
Endonuclease/exonuclease/phosphatase family protein |
| arTal_v1_Chr4_-_17530589_17530589 | 1.01 |
AT4G37250.1
|
AT4G37250
|
Leucine-rich repeat protein kinase family protein |
| arTal_v1_Chr5_+_22889073_22889083 | 1.01 |
AT5G56530.2
AT5G56530.1 |
AT5G56530
|
tRNA-splicing ligase (DUF239) |
| arTal_v1_Chr2_-_9223946_9223946 | 1.00 |
AT2G21540.6
|
SFH3
|
SEC14-like 3 |
| arTal_v1_Chr1_-_2302021_2302021 | 1.00 |
AT1G07490.1
|
RTFL3
|
ROTUNDIFOLIA like 3 |
| arTal_v1_Chr3_-_1832190_1832190 | 0.98 |
AT3G06070.1
|
AT3G06070
|
hypothetical protein |
| arTal_v1_Chr3_+_18155087_18155087 | 0.97 |
AT3G48980.2
|
AT3G48980
|
O-glucosyltransferase rumi-like protein (DUF821) |
| arTal_v1_Chr2_-_9224152_9224152 | 0.97 |
AT2G21540.1
|
SFH3
|
SEC14-like 3 |
| arTal_v1_Chr3_+_18155416_18155416 | 0.97 |
AT3G48980.1
|
AT3G48980
|
O-glucosyltransferase rumi-like protein (DUF821) |
| arTal_v1_Chr5_+_19030844_19030844 | 0.97 |
AT5G46880.2
|
HB-7
|
homeobox-7 |
| arTal_v1_Chr5_+_8589457_8589457 | 0.95 |
AT5G24930.1
|
COL4
|
zinc finger CONSTANS-like protein |
| arTal_v1_Chr2_+_18582697_18582697 | 0.95 |
AT2G45050.1
|
GATA2
|
GATA transcription factor 2 |
| arTal_v1_Chr5_-_21044194_21044194 | 0.95 |
AT5G51795.1
|
AT5G51795
|
DNA/RNA-binding protein Kin17, conserved region |
| arTal_v1_Chr2_+_15972876_15972993 | 0.94 |
AT2G38120.1
AT2G38120.2 |
AUX1
|
Transmembrane amino acid transporter family protein |
| arTal_v1_Chr5_-_9470337_9470403 | 0.94 |
AT5G26910.3
AT5G26910.1 AT5G26910.4 AT5G26910.2 |
TRM8
|
GPI-anchored adhesin-like protein |
| arTal_v1_Chr1_+_29173409_29173409 | 0.93 |
AT1G77630.1
|
LYM3
|
Peptidoglycan-binding LysM domain-containing protein |
| arTal_v1_Chr4_+_18053360_18053360 | 0.93 |
AT4G38620.1
|
MYB4
|
myb domain protein 4 |
| arTal_v1_Chr3_+_19000677_19000856 | 0.92 |
AT3G51150.2
AT3G51150.3 AT3G51150.1 |
AT3G51150
|
ATP binding microtubule motor family protein |
| arTal_v1_Chr4_+_17473272_17473272 | 0.91 |
AT4G37080.2
|
AT4G37080
|
ternary complex factor MIP1 leucine-zipper protein (Protein of unknown function, DUF547) |
| arTal_v1_Chr3_-_6044504_6044609 | 0.91 |
AT3G17680.2
AT3G17680.1 |
AT3G17680
|
Kinase interacting (KIP1-like) family protein |
| arTal_v1_Chr1_-_28133025_28133025 | 0.90 |
AT1G74890.1
|
ARR15
|
response regulator 15 |
| arTal_v1_Chr2_-_18873972_18873972 | 0.90 |
AT2G45850.3
AT2G45850.1 |
AT2G45850
|
AT hook motif DNA-binding family protein |
| arTal_v1_Chr3_-_3863250_3863250 | 0.89 |
AT3G12120.1
|
FAD2
|
fatty acid desaturase 2 |
| arTal_v1_Chr4_+_2804403_2804451 | 0.89 |
AT4G05520.1
AT4G05520.2 |
EHD2
|
EPS15 homology domain 2 |
| arTal_v1_Chr1_-_11629573_11629573 | 0.89 |
AT1G32240.3
|
KAN2
|
Homeodomain-like superfamily protein |
| arTal_v1_Chr2_-_16963215_16963215 | 0.88 |
AT2G40640.3
AT2G40640.6 AT2G40640.7 AT2G40640.8 AT2G40640.5 AT2G40640.1 AT2G40640.4 AT2G40640.9 AT2G40640.2 |
AT2G40640
|
RING/U-box superfamily protein |
| arTal_v1_Chr4_+_929869_929869 | 0.87 |
AT4G02100.1
|
AT4G02100
|
Heat shock protein DnaJ with tetratricopeptide repeat-containing protein |
| arTal_v1_Chr1_-_25622593_25622593 | 0.87 |
AT1G68360.1
|
AT1G68360
|
C2H2 and C2HC zinc fingers superfamily protein |
| arTal_v1_Chr1_+_1748259_1748259 | 0.87 |
AT1G05810.2
|
RABA5E
|
Rab GTPase-like A5A protein |
| arTal_v1_Chr1_-_6165820_6165820 | 0.86 |
AT1G17920.1
AT1G17920.2 |
HDG12
|
homeodomain GLABROUS 12 |
| arTal_v1_Chr5_-_2232527_2232527 | 0.86 |
AT5G07180.2
|
ERL2
|
ERECTA-like 2 |
| arTal_v1_Chr3_-_7213401_7213474 | 0.86 |
AT3G20640.2
AT3G20640.4 AT3G20640.3 AT3G20640.1 |
AT3G20640
|
basic helix-loop-helix (bHLH) DNA-binding superfamily protein |
| arTal_v1_Chr1_-_3306907_3306956 | 0.86 |
AT1G10120.2
AT1G10120.1 |
AT1G10120
|
basic helix-loop-helix (bHLH) DNA-binding superfamily protein |
| arTal_v1_Chr4_+_17473769_17473769 | 0.86 |
AT4G37080.1
|
AT4G37080
|
ternary complex factor MIP1 leucine-zipper protein (Protein of unknown function, DUF547) |
| arTal_v1_Chr2_-_18873684_18873684 | 0.85 |
AT2G45850.2
|
AT2G45850
|
AT hook motif DNA-binding family protein |
| arTal_v1_Chr2_+_14986023_14986023 | 0.85 |
AT2G35650.4
|
CSLA07
|
cellulose synthase like |
| arTal_v1_Chr3_-_3862498_3862498 | 0.85 |
AT3G12120.2
|
FAD2
|
fatty acid desaturase 2 |
| arTal_v1_Chr5_-_23668886_23668886 | 0.85 |
AT5G58550.1
|
EOL2
|
ETO1-like 2 |
| arTal_v1_Chr2_-_18705625_18705625 | 0.85 |
AT2G45400.3
|
BEN1
|
NAD(P)-binding Rossmann-fold superfamily protein |
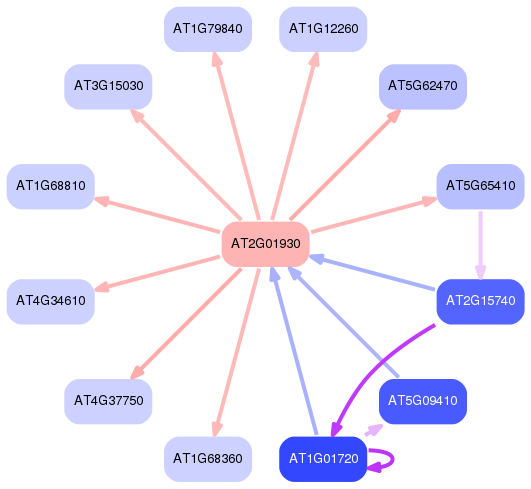
Network of associatons between targets according to the STRING database.

First level regulatory network of AT2G01930
Gene Ontology Analysis
Gene overrepresentation in biological process category:
| Log-likelihood per target | Total log-likelihood | Term | Description |
|---|---|---|---|
| 1.0 | 5.1 | GO:0010450 | inflorescence meristem growth(GO:0010450) |
| 0.7 | 2.1 | GO:1903889 | negative regulation of cell fate specification(GO:0009996) negative regulation of trichoblast fate specification(GO:0010062) negative regulation of plant epidermal cell differentiation(GO:1903889) |
| 0.7 | 2.0 | GO:0019695 | choline metabolic process(GO:0019695) |
| 0.6 | 1.7 | GO:0010541 | acropetal auxin transport(GO:0010541) |
| 0.6 | 1.7 | GO:0010080 | regulation of floral meristem growth(GO:0010080) |
| 0.5 | 1.6 | GO:0080051 | cutin transport(GO:0080051) |
| 0.5 | 3.2 | GO:1903428 | photosynthesis, light harvesting in photosystem II(GO:0009769) positive regulation of reactive oxygen species biosynthetic process(GO:1903428) |
| 0.5 | 3.3 | GO:1904278 | regulation of wax biosynthetic process(GO:1904276) positive regulation of wax biosynthetic process(GO:1904278) |
| 0.5 | 2.4 | GO:0090030 | regulation of brassinosteroid biosynthetic process(GO:0010422) regulation of steroid metabolic process(GO:0019218) regulation of steroid biosynthetic process(GO:0050810) regulation of steroid hormone biosynthetic process(GO:0090030) |
| 0.5 | 2.3 | GO:0048281 | inflorescence morphogenesis(GO:0048281) |
| 0.4 | 1.3 | GO:0010447 | response to acidic pH(GO:0010447) |
| 0.4 | 6.3 | GO:0048497 | maintenance of organ identity(GO:0048496) maintenance of floral organ identity(GO:0048497) |
| 0.4 | 1.2 | GO:0035404 | histone-serine phosphorylation(GO:0035404) histone H3-S10 phosphorylation(GO:0043987) |
| 0.4 | 2.3 | GO:0046345 | sesquiterpenoid catabolic process(GO:0016107) apocarotenoid catabolic process(GO:0043290) abscisic acid catabolic process(GO:0046345) |
| 0.4 | 1.1 | GO:2000029 | regulation of proanthocyanidin biosynthetic process(GO:2000029) |
| 0.4 | 1.8 | GO:0051320 | mitotic G1 phase(GO:0000080) mitotic S phase(GO:0000084) mitotic G2 phase(GO:0000085) G1 phase(GO:0051318) G2 phase(GO:0051319) S phase(GO:0051320) interphase(GO:0051325) mitotic interphase(GO:0051329) |
| 0.3 | 2.1 | GO:0000719 | photoreactive repair(GO:0000719) |
| 0.3 | 1.4 | GO:0046168 | glycerol-3-phosphate catabolic process(GO:0046168) |
| 0.3 | 4.4 | GO:0032544 | plastid translation(GO:0032544) |
| 0.3 | 2.0 | GO:0051098 | regulation of binding(GO:0051098) |
| 0.3 | 1.9 | GO:0042547 | cell wall modification involved in multidimensional cell growth(GO:0042547) |
| 0.3 | 1.0 | GO:0040019 | positive regulation of embryonic development(GO:0040019) |
| 0.3 | 1.3 | GO:0009102 | biotin metabolic process(GO:0006768) biotin biosynthetic process(GO:0009102) |
| 0.3 | 1.6 | GO:1901562 | negative regulation of fatty acid metabolic process(GO:0045922) response to paraquat(GO:1901562) |
| 0.3 | 2.1 | GO:0010019 | chloroplast-nucleus signaling pathway(GO:0010019) |
| 0.3 | 1.5 | GO:0010444 | guard mother cell differentiation(GO:0010444) |
| 0.3 | 1.5 | GO:0048629 | trichome patterning(GO:0048629) |
| 0.2 | 1.2 | GO:2001295 | malonyl-CoA biosynthetic process(GO:2001295) |
| 0.2 | 2.6 | GO:0010158 | abaxial cell fate specification(GO:0010158) |
| 0.2 | 0.7 | GO:0090392 | regulation of multicellular organism growth(GO:0040014) sepal giant cell differentiation(GO:0090392) regulation of adaxial/abaxial pattern formation(GO:2000011) |
| 0.2 | 6.1 | GO:0006636 | unsaturated fatty acid biosynthetic process(GO:0006636) |
| 0.2 | 1.4 | GO:0090116 | C-5 methylation of cytosine(GO:0090116) |
| 0.2 | 0.6 | GO:0042539 | hypotonic salinity response(GO:0042539) |
| 0.2 | 0.6 | GO:0010116 | positive regulation of abscisic acid biosynthetic process(GO:0010116) |
| 0.2 | 1.2 | GO:0042659 | regulation of cell fate specification(GO:0042659) |
| 0.2 | 0.8 | GO:0051457 | maintenance of protein location in nucleus(GO:0051457) |
| 0.2 | 5.0 | GO:0046856 | phosphatidylinositol dephosphorylation(GO:0046856) |
| 0.2 | 0.5 | GO:0048729 | establishment of planar polarity(GO:0001736) morphogenesis of a polarized epithelium(GO:0001738) morphogenesis of an epithelium(GO:0002009) tissue morphogenesis(GO:0048729) |
| 0.2 | 4.9 | GO:0016132 | phytosteroid biosynthetic process(GO:0016129) brassinosteroid biosynthetic process(GO:0016132) |
| 0.2 | 1.4 | GO:0006168 | adenine salvage(GO:0006168) purine nucleobase salvage(GO:0043096) |
| 0.2 | 1.6 | GO:0019676 | ammonia assimilation cycle(GO:0019676) |
| 0.2 | 2.9 | GO:0006949 | syncytium formation(GO:0006949) |
| 0.2 | 0.8 | GO:0010244 | response to low fluence blue light stimulus by blue low-fluence system(GO:0010244) |
| 0.2 | 1.4 | GO:1902290 | positive regulation of defense response to oomycetes(GO:1902290) |
| 0.1 | 1.0 | GO:0046621 | negative regulation of organ growth(GO:0046621) |
| 0.1 | 0.4 | GO:0010433 | bract morphogenesis(GO:0010433) bract formation(GO:0010434) |
| 0.1 | 1.1 | GO:1901703 | protein localization involved in auxin polar transport(GO:1901703) |
| 0.1 | 0.8 | GO:0043447 | alkane biosynthetic process(GO:0043447) |
| 0.1 | 1.3 | GO:0010196 | nonphotochemical quenching(GO:0010196) energy quenching(GO:1990066) |
| 0.1 | 0.5 | GO:0042450 | arginine biosynthetic process via ornithine(GO:0042450) |
| 0.1 | 0.4 | GO:0031114 | regulation of microtubule depolymerization(GO:0031114) |
| 0.1 | 7.6 | GO:0007267 | cell-cell signaling(GO:0007267) |
| 0.1 | 2.8 | GO:0010103 | stomatal complex morphogenesis(GO:0010103) |
| 0.1 | 0.7 | GO:0009662 | etioplast organization(GO:0009662) |
| 0.1 | 1.4 | GO:0080086 | stamen filament development(GO:0080086) |
| 0.1 | 0.9 | GO:0051653 | establishment of mitotic spindle orientation(GO:0000132) establishment of mitotic spindle localization(GO:0040001) establishment of spindle localization(GO:0051293) establishment of spindle orientation(GO:0051294) spindle localization(GO:0051653) |
| 0.1 | 0.8 | GO:0032351 | negative regulation of hormone metabolic process(GO:0032351) negative regulation of auxin metabolic process(GO:0090356) |
| 0.1 | 1.0 | GO:0010371 | regulation of gibberellin biosynthetic process(GO:0010371) |
| 0.1 | 1.8 | GO:0009768 | photosynthesis, light harvesting in photosystem I(GO:0009768) |
| 0.1 | 1.8 | GO:0009299 | mRNA transcription(GO:0009299) |
| 0.1 | 0.6 | GO:0046208 | spermine catabolic process(GO:0046208) |
| 0.1 | 1.9 | GO:0010215 | cellulose microfibril organization(GO:0010215) |
| 0.1 | 2.1 | GO:0048826 | cotyledon morphogenesis(GO:0048826) |
| 0.1 | 0.7 | GO:0033383 | geranyl diphosphate metabolic process(GO:0033383) geranyl diphosphate biosynthetic process(GO:0033384) |
| 0.1 | 0.3 | GO:0008645 | hexose transport(GO:0008645) fructose transport(GO:0015755) vacuolar transmembrane transport(GO:0034486) |
| 0.1 | 1.7 | GO:2000762 | regulation of phenylpropanoid metabolic process(GO:2000762) |
| 0.1 | 0.5 | GO:0006449 | regulation of translational termination(GO:0006449) |
| 0.1 | 7.5 | GO:0009834 | plant-type secondary cell wall biogenesis(GO:0009834) |
| 0.1 | 1.7 | GO:0009704 | de-etiolation(GO:0009704) |
| 0.1 | 2.2 | GO:0009294 | genetic transfer(GO:0009292) DNA mediated transformation(GO:0009294) |
| 0.1 | 2.5 | GO:0071483 | cellular response to blue light(GO:0071483) |
| 0.1 | 0.4 | GO:1901181 | cellular response to alkaloid(GO:0071312) cellular response to caffeine(GO:0071313) cellular response to purine-containing compound(GO:0071415) negative regulation of cellular response to caffeine(GO:1901181) |
| 0.1 | 0.8 | GO:2000114 | regulation of establishment of cell polarity(GO:2000114) |
| 0.1 | 1.4 | GO:0009641 | shade avoidance(GO:0009641) |
| 0.1 | 0.6 | GO:0006048 | UDP-N-acetylglucosamine biosynthetic process(GO:0006048) |
| 0.1 | 1.2 | GO:0010192 | mucilage biosynthetic process(GO:0010192) |
| 0.1 | 0.4 | GO:0071588 | hydrogen peroxide mediated signaling pathway(GO:0071588) |
| 0.1 | 0.2 | GO:2000692 | negative regulation of seed maturation(GO:2000692) |
| 0.1 | 1.6 | GO:2000034 | regulation of seed maturation(GO:2000034) |
| 0.1 | 0.7 | GO:0007076 | mitotic chromosome condensation(GO:0007076) |
| 0.1 | 0.6 | GO:0006662 | glycerol ether metabolic process(GO:0006662) |
| 0.1 | 0.5 | GO:0070301 | cellular response to hydrogen peroxide(GO:0070301) |
| 0.1 | 6.5 | GO:0006633 | fatty acid biosynthetic process(GO:0006633) |
| 0.1 | 2.4 | GO:0048574 | long-day photoperiodism, flowering(GO:0048574) |
| 0.1 | 3.0 | GO:0015995 | chlorophyll biosynthetic process(GO:0015995) |
| 0.1 | 0.2 | GO:0071492 | response to UV-A(GO:0070141) cellular response to UV-A(GO:0071492) |
| 0.1 | 0.3 | GO:0051571 | positive regulation of histone H3-K4 methylation(GO:0051571) |
| 0.0 | 0.7 | GO:0010274 | hydrotropism(GO:0010274) |
| 0.0 | 0.4 | GO:0032922 | circadian regulation of gene expression(GO:0032922) |
| 0.0 | 1.1 | GO:0043572 | chloroplast fission(GO:0010020) plastid fission(GO:0043572) |
| 0.0 | 0.3 | GO:0032456 | endocytic recycling(GO:0032456) |
| 0.0 | 3.1 | GO:0007018 | microtubule-based movement(GO:0007018) |
| 0.0 | 0.8 | GO:0048015 | phosphatidylinositol-mediated signaling(GO:0048015) |
| 0.0 | 1.0 | GO:0009833 | plant-type primary cell wall biogenesis(GO:0009833) |
| 0.0 | 0.2 | GO:0048480 | style development(GO:0048479) stigma development(GO:0048480) |
| 0.0 | 0.9 | GO:0051260 | protein homooligomerization(GO:0051260) |
| 0.0 | 0.3 | GO:0009920 | cell plate formation involved in plant-type cell wall biogenesis(GO:0009920) |
| 0.0 | 0.3 | GO:0009942 | longitudinal axis specification(GO:0009942) |
| 0.0 | 1.2 | GO:0052543 | callose deposition in cell wall(GO:0052543) |
| 0.0 | 0.3 | GO:0010304 | PSII associated light-harvesting complex II catabolic process(GO:0010304) |
| 0.0 | 0.8 | GO:0030244 | cellulose biosynthetic process(GO:0030244) |
| 0.0 | 1.5 | GO:0071804 | cellular potassium ion transport(GO:0071804) potassium ion transmembrane transport(GO:0071805) |
| 0.0 | 0.5 | GO:0009944 | polarity specification of adaxial/abaxial axis(GO:0009944) specification of axis polarity(GO:0065001) |
| 0.0 | 0.4 | GO:1901371 | regulation of leaf morphogenesis(GO:1901371) |
| 0.0 | 2.5 | GO:0016579 | protein deubiquitination(GO:0016579) |
| 0.0 | 0.6 | GO:0006833 | water transport(GO:0006833) fluid transport(GO:0042044) |
| 0.0 | 0.7 | GO:0010143 | cutin biosynthetic process(GO:0010143) |
| 0.0 | 0.6 | GO:0032968 | positive regulation of transcription elongation from RNA polymerase II promoter(GO:0032968) |
| 0.0 | 0.7 | GO:0009828 | plant-type cell wall loosening(GO:0009828) |
| 0.0 | 0.3 | GO:0016925 | protein sumoylation(GO:0016925) |
| 0.0 | 1.5 | GO:0007276 | gamete generation(GO:0007276) |
| 0.0 | 1.4 | GO:0009817 | defense response to fungus, incompatible interaction(GO:0009817) |
| 0.0 | 0.3 | GO:0015770 | sucrose transport(GO:0015770) |
| 0.0 | 0.8 | GO:0005992 | trehalose biosynthetic process(GO:0005992) |
| 0.0 | 0.0 | GO:0048833 | specification of organ number(GO:0048832) specification of floral organ number(GO:0048833) |
| 0.0 | 0.9 | GO:0016485 | protein processing(GO:0016485) |
| 0.0 | 1.1 | GO:0009567 | fertilization(GO:0009566) double fertilization forming a zygote and endosperm(GO:0009567) |
| 0.0 | 0.1 | GO:0034035 | guanosine tetraphosphate metabolic process(GO:0015969) purine ribonucleoside bisphosphate metabolic process(GO:0034035) |
| 0.0 | 0.1 | GO:0060860 | regulation of floral organ abscission(GO:0060860) negative regulation of floral organ abscission(GO:0060862) |
| 0.0 | 0.2 | GO:0030307 | positive regulation of cell growth(GO:0030307) |
| 0.0 | 2.0 | GO:0000226 | microtubule cytoskeleton organization(GO:0000226) |
| 0.0 | 0.3 | GO:0006268 | DNA unwinding involved in DNA replication(GO:0006268) |
| 0.0 | 0.4 | GO:0007186 | G-protein coupled receptor signaling pathway(GO:0007186) |
| 0.0 | 2.9 | GO:0009657 | plastid organization(GO:0009657) |
| 0.0 | 0.9 | GO:0006887 | exocytosis(GO:0006887) |
| 0.0 | 0.5 | GO:0006606 | protein import into nucleus(GO:0006606) protein targeting to nucleus(GO:0044744) |
| 0.0 | 0.3 | GO:0008356 | asymmetric cell division(GO:0008356) |
| 0.0 | 1.3 | GO:0006631 | fatty acid metabolic process(GO:0006631) |
| 0.0 | 0.5 | GO:0009911 | positive regulation of flower development(GO:0009911) |
| 0.0 | 0.5 | GO:0048653 | anther development(GO:0048653) |
| 0.0 | 0.1 | GO:0030308 | negative regulation of cell growth(GO:0030308) |
Gene overrepresentation in cellular component category:
| Log-likelihood per target | Total log-likelihood | Term | Description |
|---|---|---|---|
| 0.4 | 3.2 | GO:0030076 | thylakoid light-harvesting complex(GO:0009503) PSII associated light-harvesting complex II(GO:0009517) light-harvesting complex(GO:0030076) |
| 0.3 | 1.2 | GO:0032133 | chromosome passenger complex(GO:0032133) |
| 0.3 | 1.4 | GO:0009331 | glycerol-3-phosphate dehydrogenase complex(GO:0009331) |
| 0.3 | 1.9 | GO:0009533 | chloroplast stromal thylakoid(GO:0009533) |
| 0.3 | 1.0 | GO:0010330 | cellulose synthase complex(GO:0010330) |
| 0.2 | 1.5 | GO:0009360 | DNA polymerase III complex(GO:0009360) |
| 0.2 | 1.3 | GO:0001405 | presequence translocase-associated import motor(GO:0001405) |
| 0.2 | 2.1 | GO:0016272 | prefoldin complex(GO:0016272) |
| 0.2 | 2.1 | GO:0045298 | tubulin complex(GO:0045298) |
| 0.2 | 0.5 | GO:0044614 | nuclear pore cytoplasmic filaments(GO:0044614) |
| 0.1 | 23.1 | GO:0046658 | anchored component of plasma membrane(GO:0046658) |
| 0.1 | 3.5 | GO:0016324 | apical plasma membrane(GO:0016324) |
| 0.1 | 1.8 | GO:0009522 | photosystem I(GO:0009522) |
| 0.1 | 1.2 | GO:0048226 | Casparian strip(GO:0048226) |
| 0.1 | 0.7 | GO:0000796 | condensin complex(GO:0000796) |
| 0.1 | 0.3 | GO:1990752 | microtubule plus-end(GO:0035371) microtubule end(GO:1990752) |
| 0.1 | 1.3 | GO:0070069 | cytochrome complex(GO:0070069) |
| 0.1 | 0.7 | GO:0000427 | plastid-encoded plastid RNA polymerase complex(GO:0000427) |
| 0.1 | 2.5 | GO:0010319 | stromule(GO:0010319) |
| 0.1 | 0.9 | GO:0009986 | cell surface(GO:0009986) |
| 0.0 | 0.8 | GO:0005871 | kinesin complex(GO:0005871) |
| 0.0 | 1.1 | GO:0042644 | chloroplast nucleoid(GO:0042644) |
| 0.0 | 1.0 | GO:0005881 | cytoplasmic microtubule(GO:0005881) |
| 0.0 | 1.6 | GO:0031977 | thylakoid lumen(GO:0031977) |
| 0.0 | 1.9 | GO:0016607 | nuclear speck(GO:0016607) |
| 0.0 | 0.1 | GO:0016323 | basal plasma membrane(GO:0009925) basolateral plasma membrane(GO:0016323) basal part of cell(GO:0045178) |
| 0.0 | 1.7 | GO:0090406 | pollen tube(GO:0090406) |
| 0.0 | 7.0 | GO:0048046 | apoplast(GO:0048046) |
| 0.0 | 0.6 | GO:0046540 | U4/U6 x U5 tri-snRNP complex(GO:0046540) |
| 0.0 | 0.6 | GO:0000307 | cyclin-dependent protein kinase holoenzyme complex(GO:0000307) |
| 0.0 | 0.8 | GO:0016604 | nuclear body(GO:0016604) |
| 0.0 | 6.8 | GO:0009579 | thylakoid(GO:0009579) |
| 0.0 | 0.3 | GO:0032588 | trans-Golgi network membrane(GO:0032588) |
| 0.0 | 1.9 | GO:0031225 | anchored component of membrane(GO:0031225) |
| 0.0 | 0.5 | GO:0005643 | nuclear pore(GO:0005643) |
| 0.0 | 6.2 | GO:0009570 | chloroplast stroma(GO:0009570) |
| 0.0 | 0.8 | GO:0005797 | Golgi medial cisterna(GO:0005797) |
| 0.0 | 1.3 | GO:0005887 | integral component of plasma membrane(GO:0005887) |
| 0.0 | 2.6 | GO:0005802 | trans-Golgi network(GO:0005802) |
| 0.0 | 0.6 | GO:0031201 | SNARE complex(GO:0031201) |
Gene overrepresentation in molecular function category:
| Log-likelihood per target | Total log-likelihood | Term | Description |
|---|---|---|---|
| 0.9 | 2.7 | GO:0016630 | protochlorophyllide reductase activity(GO:0016630) |
| 0.7 | 8.7 | GO:0047259 | glucomannan 4-beta-mannosyltransferase activity(GO:0047259) |
| 0.7 | 2.0 | GO:0000234 | phosphoethanolamine N-methyltransferase activity(GO:0000234) |
| 0.6 | 2.6 | GO:0046593 | mandelonitrile lyase activity(GO:0046593) |
| 0.6 | 1.7 | GO:0045485 | omega-6 fatty acid desaturase activity(GO:0045485) |
| 0.5 | 3.8 | GO:0001872 | (1->3)-beta-D-glucan binding(GO:0001872) |
| 0.5 | 2.0 | GO:0016712 | oxidoreductase activity, acting on paired donors, with incorporation or reduction of molecular oxygen, reduced flavin or flavoprotein as one donor, and incorporation of one atom of oxygen(GO:0016712) aromatase activity(GO:0070330) |
| 0.5 | 2.3 | GO:0010295 | (+)-abscisic acid 8'-hydroxylase activity(GO:0010295) |
| 0.4 | 2.9 | GO:0046030 | inositol trisphosphate phosphatase activity(GO:0046030) |
| 0.3 | 2.1 | GO:0003913 | DNA photolyase activity(GO:0003913) |
| 0.3 | 1.4 | GO:0004367 | glycerol-3-phosphate dehydrogenase [NAD+] activity(GO:0004367) |
| 0.3 | 4.4 | GO:0042389 | omega-3 fatty acid desaturase activity(GO:0042389) |
| 0.3 | 3.5 | GO:0008526 | phosphatidylinositol transporter activity(GO:0008526) |
| 0.3 | 1.3 | GO:0070283 | radical SAM enzyme activity(GO:0070283) |
| 0.3 | 1.2 | GO:0004075 | biotin carboxylase activity(GO:0004075) |
| 0.3 | 1.2 | GO:0035175 | histone serine kinase activity(GO:0035174) histone kinase activity (H3-S10 specific)(GO:0035175) |
| 0.3 | 1.2 | GO:0008395 | steroid hydroxylase activity(GO:0008395) |
| 0.3 | 1.4 | GO:0016801 | hydrolase activity, acting on ether bonds(GO:0016801) |
| 0.3 | 0.8 | GO:0001130 | bacterial-type RNA polymerase transcription factor activity, sequence-specific DNA binding(GO:0001130) bacterial-type RNA polymerase transcriptional activator activity, sequence-specific DNA binding(GO:0001216) |
| 0.2 | 1.2 | GO:0015367 | oxoglutarate:malate antiporter activity(GO:0015367) |
| 0.2 | 3.4 | GO:0004312 | fatty acid synthase activity(GO:0004312) |
| 0.2 | 4.1 | GO:0102336 | 3-oxo-arachidoyl-CoA synthase activity(GO:0102336) 3-oxo-cerotoyl-CoA synthase activity(GO:0102337) 3-oxo-lignoceronyl-CoA synthase activity(GO:0102338) |
| 0.2 | 0.4 | GO:0019789 | SUMO transferase activity(GO:0019789) |
| 0.2 | 5.1 | GO:0016168 | chlorophyll binding(GO:0016168) |
| 0.2 | 0.6 | GO:0004347 | glucose-6-phosphate isomerase activity(GO:0004347) |
| 0.2 | 3.9 | GO:0042973 | glucan endo-1,3-beta-D-glucosidase activity(GO:0042973) |
| 0.2 | 1.4 | GO:0003999 | adenine phosphoribosyltransferase activity(GO:0003999) |
| 0.2 | 2.1 | GO:0034485 | phosphatidylinositol-3,4,5-trisphosphate 5-phosphatase activity(GO:0034485) |
| 0.1 | 2.2 | GO:0005242 | inward rectifier potassium channel activity(GO:0005242) |
| 0.1 | 1.4 | GO:0003886 | DNA (cytosine-5-)-methyltransferase activity(GO:0003886) |
| 0.1 | 0.4 | GO:0051010 | microtubule plus-end binding(GO:0051010) |
| 0.1 | 5.9 | GO:0033612 | receptor serine/threonine kinase binding(GO:0033612) |
| 0.1 | 2.6 | GO:0080161 | auxin transmembrane transporter activity(GO:0080161) |
| 0.1 | 0.6 | GO:0003977 | UDP-N-acetylglucosamine diphosphorylase activity(GO:0003977) |
| 0.1 | 1.5 | GO:0033170 | DNA clamp loader activity(GO:0003689) protein-DNA loading ATPase activity(GO:0033170) |
| 0.1 | 1.3 | GO:0000774 | adenyl-nucleotide exchange factor activity(GO:0000774) |
| 0.1 | 2.7 | GO:0008810 | cellulase activity(GO:0008810) |
| 0.1 | 0.3 | GO:0015292 | uniporter activity(GO:0015292) |
| 0.1 | 0.3 | GO:0010280 | UDP-L-rhamnose synthase activity(GO:0010280) UDP-glucose 4,6-dehydratase activity(GO:0050377) |
| 0.1 | 2.0 | GO:0005089 | Rho guanyl-nucleotide exchange factor activity(GO:0005089) |
| 0.1 | 3.2 | GO:0005179 | hormone activity(GO:0005179) |
| 0.1 | 0.4 | GO:0016040 | glutamate synthase activity(GO:0015930) glutamate synthase (NADH) activity(GO:0016040) glutamate synthase activity, NAD(P)H as acceptor(GO:0045181) |
| 0.1 | 3.5 | GO:0016759 | cellulose synthase activity(GO:0016759) |
| 0.1 | 2.1 | GO:0030570 | carbon-oxygen lyase activity, acting on polysaccharides(GO:0016837) pectate lyase activity(GO:0030570) |
| 0.1 | 0.7 | GO:0090447 | glycerol-3-phosphate 2-O-acyltransferase activity(GO:0090447) |
| 0.1 | 0.6 | GO:0046592 | polyamine oxidase activity(GO:0046592) |
| 0.1 | 0.8 | GO:0004435 | phosphatidylinositol phospholipase C activity(GO:0004435) |
| 0.1 | 0.7 | GO:0004337 | geranyltranstransferase activity(GO:0004337) |
| 0.1 | 2.2 | GO:0008266 | poly(U) RNA binding(GO:0008266) |
| 0.1 | 0.7 | GO:0017070 | U6 snRNA binding(GO:0017070) |
| 0.1 | 2.1 | GO:0044183 | protein binding involved in protein folding(GO:0044183) |
| 0.1 | 2.1 | GO:0005200 | structural constituent of cytoskeleton(GO:0005200) |
| 0.1 | 0.3 | GO:0010313 | phytochrome binding(GO:0010313) |
| 0.1 | 0.5 | GO:0043539 | protein serine/threonine kinase activator activity(GO:0043539) |
| 0.1 | 2.9 | GO:0071949 | FAD binding(GO:0071949) |
| 0.1 | 0.6 | GO:0008574 | ATP-dependent microtubule motor activity, plus-end-directed(GO:0008574) |
| 0.1 | 0.6 | GO:0047134 | protein-disulfide reductase activity(GO:0047134) |
| 0.1 | 0.7 | GO:0016308 | 1-phosphatidylinositol-4-phosphate 5-kinase activity(GO:0016308) |
| 0.0 | 3.1 | GO:0003777 | microtubule motor activity(GO:0003777) |
| 0.0 | 0.8 | GO:0061608 | nuclear import signal receptor activity(GO:0061608) |
| 0.0 | 0.7 | GO:0004029 | aldehyde dehydrogenase (NAD) activity(GO:0004029) |
| 0.0 | 0.6 | GO:0008409 | 5'-3' exonuclease activity(GO:0008409) |
| 0.0 | 0.5 | GO:0005452 | inorganic anion exchanger activity(GO:0005452) |
| 0.0 | 0.5 | GO:0008252 | nucleotidase activity(GO:0008252) |
| 0.0 | 1.3 | GO:0000049 | tRNA binding(GO:0000049) |
| 0.0 | 0.8 | GO:0030276 | clathrin binding(GO:0030276) |
| 0.0 | 0.5 | GO:0017056 | structural constituent of nuclear pore(GO:0017056) |
| 0.0 | 0.3 | GO:0009378 | four-way junction helicase activity(GO:0009378) |
| 0.0 | 0.6 | GO:0005249 | voltage-gated potassium channel activity(GO:0005249) |
| 0.0 | 0.5 | GO:0016872 | intramolecular lyase activity(GO:0016872) |
| 0.0 | 2.5 | GO:0101005 | ubiquitinyl hydrolase activity(GO:0101005) |
| 0.0 | 0.8 | GO:0004805 | trehalose-phosphatase activity(GO:0004805) |
| 0.0 | 0.1 | GO:0070182 | DNA polymerase binding(GO:0070182) |
| 0.0 | 0.6 | GO:0005372 | water transmembrane transporter activity(GO:0005372) water channel activity(GO:0015250) |
| 0.0 | 0.5 | GO:0031369 | translation initiation factor binding(GO:0031369) |
| 0.0 | 0.6 | GO:0008353 | RNA polymerase II carboxy-terminal domain kinase activity(GO:0008353) |
| 0.0 | 1.6 | GO:0042910 | xenobiotic transporter activity(GO:0042910) |
| 0.0 | 0.3 | GO:0008515 | sucrose transmembrane transporter activity(GO:0008515) |
| 0.0 | 0.1 | GO:0008728 | GTP diphosphokinase activity(GO:0008728) |
| 0.0 | 0.2 | GO:0103075 | indole-3-pyruvate monooxygenase activity(GO:0103075) |
| 0.0 | 2.1 | GO:0009055 | electron carrier activity(GO:0009055) |
| 0.0 | 0.6 | GO:0016597 | amino acid binding(GO:0016597) |
| 0.0 | 0.3 | GO:0000155 | phosphorelay sensor kinase activity(GO:0000155) |
| 0.0 | 0.7 | GO:0004197 | cysteine-type endopeptidase activity(GO:0004197) |
| 0.0 | 5.2 | GO:0046906 | tetrapyrrole binding(GO:0046906) |
| 0.0 | 4.2 | GO:0000981 | RNA polymerase II transcription factor activity, sequence-specific DNA binding(GO:0000981) |
| 0.0 | 0.6 | GO:0045735 | nutrient reservoir activity(GO:0045735) |
| 0.0 | 0.3 | GO:0004176 | ATP-dependent peptidase activity(GO:0004176) |
| 0.0 | 1.6 | GO:0005525 | GTP binding(GO:0005525) guanyl nucleotide binding(GO:0019001) guanyl ribonucleotide binding(GO:0032561) |
| 0.0 | 0.6 | GO:0005484 | SNAP receptor activity(GO:0005484) |
| 0.0 | 0.4 | GO:0004707 | MAP kinase activity(GO:0004707) |
| 0.0 | 0.5 | GO:0003713 | transcription coactivator activity(GO:0003713) |
| 0.0 | 1.7 | GO:0016616 | oxidoreductase activity, acting on the CH-OH group of donors, NAD or NADP as acceptor(GO:0016616) |
Gene overrepresentation in curated gene sets: canonical pathways category:
| Log-likelihood per target | Total log-likelihood | Term | Description |
|---|---|---|---|
| 0.4 | 1.2 | PID TCPTP PATHWAY | Signaling events mediated by TCPTP |
| 0.2 | 1.0 | PID AP1 PATHWAY | AP-1 transcription factor network |
| 0.1 | 0.4 | PID PI3KCI PATHWAY | Class I PI3K signaling events |
Gene overrepresentation in curated gene sets: REACTOME pathways category:
| Log-likelihood per target | Total log-likelihood | Term | Description |
|---|---|---|---|
| 0.3 | 1.2 | REACTOME VEGF LIGAND RECEPTOR INTERACTIONS | Genes involved in VEGF ligand-receptor interactions |
| 0.0 | 0.8 | REACTOME FACTORS INVOLVED IN MEGAKARYOCYTE DEVELOPMENT AND PLATELET PRODUCTION | Genes involved in Factors involved in megakaryocyte development and platelet production |
| 0.0 | 0.3 | REACTOME METABOLISM OF AMINO ACIDS AND DERIVATIVES | Genes involved in Metabolism of amino acids and derivatives |