Project
GSE43616: Time-course of wild-type Arabidopsis leaf
Navigation
Downloads
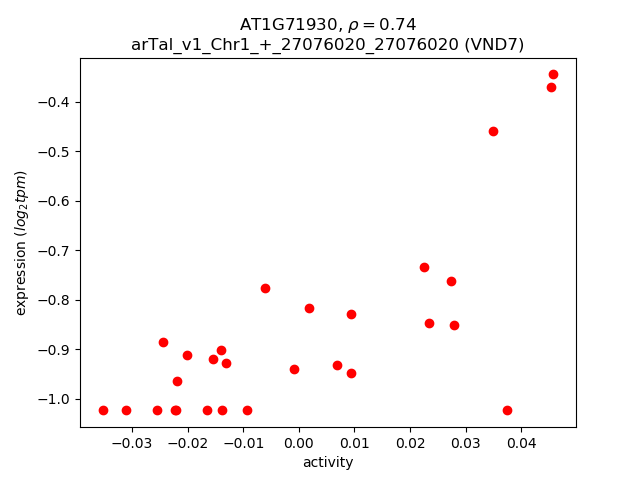
Results for AT1G71930
Z-value: 1.22
Transcription factors associated with AT1G71930
| Gene Symbol | Gene ID | Gene Info |
|---|---|---|
|
AT1G71930
|
AT1G71930 | vascular related NAC-domain protein 7 |
Activity-expression correlation:
| Gene | Promoter | Pearson corr. coef. | P-value | Plot |
|---|---|---|---|---|
| VND7 | arTal_v1_Chr1_+_27076020_27076020 | 0.74 | 5.9e-06 | Click! |
Activity profile of AT1G71930 motif
Sorted Z-values of AT1G71930 motif
| Promoter | Log-likelihood | Transcript | Gene | Gene Info |
|---|---|---|---|---|
| arTal_v1_Chr4_+_16810482_16810482 | 5.31 |
AT4G35350.2
AT4G35350.1 |
XCP1
|
xylem cysteine peptidase 1 |
| arTal_v1_Chr1_+_7252111_7252111 | 5.19 |
AT1G20850.1
|
XCP2
|
xylem cysteine peptidase 2 |
| arTal_v1_Chr1_+_310169_310169 | 4.75 |
AT1G01900.1
|
SBTI1.1
|
subtilase family protein |
| arTal_v1_Chr5_-_753657_753657 | 4.38 |
AT5G03170.1
|
FLA11
|
FASCICLIN-like arabinogalactan-protein 11 |
| arTal_v1_Chr2_+_15934244_15934244 | 3.84 |
AT2G38080.1
|
IRX12
|
Laccase/Diphenol oxidase family protein |
| arTal_v1_Chr3_-_5777841_5777841 | 2.70 |
AT3G16920.1
|
CTL2
|
chitinase-like protein |
| arTal_v1_Chr4_-_10316886_10316886 | 2.59 |
AT4G18780.1
|
IRX1
|
cellulose synthase family protein |
| arTal_v1_Chr3_-_5778052_5778052 | 2.44 |
AT3G16920.2
|
CTL2
|
chitinase-like protein |
| arTal_v1_Chr4_-_5162774_5162867 | 2.25 |
AT4G08160.2
AT4G08160.1 |
AT4G08160
|
glycosyl hydrolase family 10 protein / carbohydrate-binding domain-containing protein |
| arTal_v1_Chr5_+_17714390_17714390 | 2.21 |
AT5G44030.2
AT5G44030.1 |
CESA4
|
cellulose synthase A4 |
| arTal_v1_Chr2_-_12338836_12338933 | 2.09 |
AT2G28760.3
AT2G28760.1 AT2G28760.4 |
UXS6
|
UDP-XYL synthase 6 |
| arTal_v1_Chr5_-_23917873_23917998 | 1.78 |
AT5G59290.3
AT5G59290.2 |
UXS3
|
UDP-glucuronic acid decarboxylase 3 |
| arTal_v1_Chr1_+_29508951_29508951 | 1.75 |
AT1G78430.1
|
RIP4
|
ROP interactive partner 2 |
| arTal_v1_Chr1_-_9293862_9293862 | 1.73 |
AT1G26820.1
|
RNS3
|
ribonuclease 3 |
| arTal_v1_Chr5_-_23918266_23918267 | 1.69 |
AT5G59290.1
AT5G59290.4 |
UXS3
|
UDP-glucuronic acid decarboxylase 3 |
| arTal_v1_Chr5_+_1153740_1153740 | 1.59 |
AT5G04200.1
|
MC9
|
metacaspase 9 |
| arTal_v1_Chr5_+_17715687_17715687 | 1.30 |
AT5G44030.3
|
CESA4
|
cellulose synthase A4 |
| arTal_v1_Chr2_-_12339217_12339217 | 1.27 |
AT2G28760.2
|
UXS6
|
UDP-XYL synthase 6 |
| arTal_v1_Chr4_-_16063070_16063251 | 1.25 |
AT4G33330.2
AT4G33330.1 AT4G33330.5 AT4G33330.3 AT4G33330.4 |
PGSIP3
|
plant glycogenin-like starch initiation protein 3 |
| arTal_v1_Chr5_-_13238884_13238884 | 1.17 |
AT5G34940.2
|
GUS3
|
glucuronidase 3 |
| arTal_v1_Chr1_+_23337167_23337167 | 1.17 |
AT1G62990.1
|
KNAT7
|
homeobox knotted-like protein |
| arTal_v1_Chr5_-_13238718_13238718 | 1.10 |
AT5G34940.3
|
GUS3
|
glucuronidase 3 |
| arTal_v1_Chr1_+_10010124_10010124 | 1.06 |
AT1G28470.1
|
NAC010
|
NAC domain containing protein 10 |
| arTal_v1_Chr2_-_19222916_19222916 | 0.95 |
AT2G46770.1
|
NST1
|
NAC (No Apical Meristem) domain transcriptional regulator superfamily protein |
| arTal_v1_Chr5_-_13238457_13238457 | 0.93 |
AT5G34940.1
|
GUS3
|
glucuronidase 3 |
| arTal_v1_Chr1_+_27076020_27076020 | 0.89 |
AT1G71930.1
|
VND7
|
vascular related NAC-domain protein 7 |
| arTal_v1_Chr5_-_13237662_13237662 | 0.87 |
AT5G34940.4
|
GUS3
|
glucuronidase 3 |
| arTal_v1_Chr1_-_23721774_23721774 | 0.85 |
AT1G63910.1
|
AtMYB103
|
myb domain protein 103 |
| arTal_v1_Chr2_-_14644355_14644355 | 0.82 |
AT2G34710.1
|
PHB
|
Homeobox-leucine zipper family protein / lipid-binding START domain-containing protein |
| arTal_v1_Chr4_-_717579_717603 | 0.77 |
AT4G01680.3
AT4G01680.1 |
MYB55
|
myb domain protein 55 |
| arTal_v1_Chr1_+_27074702_27074702 | 0.75 |
AT1G71930.2
|
VND7
|
vascular related NAC-domain protein 7 |
| arTal_v1_Chr3_-_2578276_2578276 | 0.60 |
AT3G08500.1
|
MYB83
|
myb domain protein 83 |
| arTal_v1_Chr4_-_717415_717415 | 0.56 |
AT4G01680.2
|
MYB55
|
myb domain protein 55 |
| arTal_v1_Chr5_+_18643540_18643540 | 0.49 |
AT5G45970.1
|
RAC2
|
RAC-like 2 |
| arTal_v1_Chr2_+_13841180_13841180 | 0.31 |
AT2G32620.4
|
CSLB02
|
cellulose synthase-like B |
| arTal_v1_Chr2_+_13840687_13840687 | 0.31 |
AT2G32620.2
AT2G32620.1 AT2G32620.3 |
CSLB02
|
cellulose synthase-like B |
| arTal_v1_Chr5_-_4065075_4065075 | 0.19 |
AT5G12870.1
|
MYB46
|
myb domain protein 46 |
| arTal_v1_Chr2_+_13836117_13836117 | 0.19 |
AT2G32610.1
|
CSLB01
|
cellulose synthase-like B1 |
| arTal_v1_Chr1_-_9531489_9531489 | 0.16 |
AT1G27440.1
|
GUT2
|
Exostosin family protein |
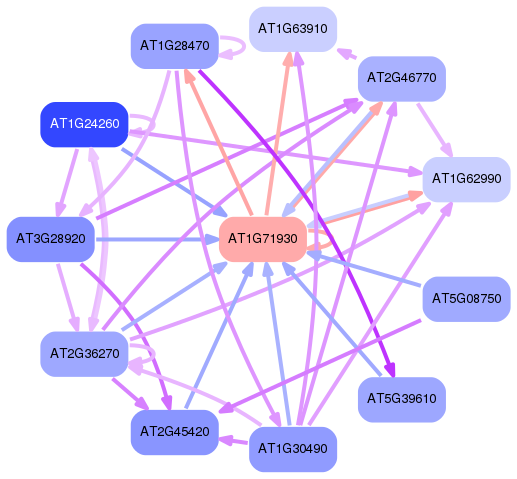
Network of associatons between targets according to the STRING database.

First level regulatory network of AT1G71930
Gene Ontology Analysis
Gene overrepresentation in biological process category:
| Log-likelihood per target | Total log-likelihood | Term | Description |
|---|---|---|---|
| 1.5 | 10.5 | GO:0010623 | programmed cell death involved in cell development(GO:0010623) |
| 0.8 | 6.8 | GO:0033319 | UDP-D-xylose metabolic process(GO:0033319) UDP-D-xylose biosynthetic process(GO:0033320) |
| 0.6 | 2.6 | GO:0010116 | positive regulation of abscisic acid biosynthetic process(GO:0010116) |
| 0.3 | 5.1 | GO:0006026 | aminoglycan catabolic process(GO:0006026) chitin metabolic process(GO:0006030) chitin catabolic process(GO:0006032) amino sugar catabolic process(GO:0046348) glucosamine-containing compound catabolic process(GO:1901072) |
| 0.2 | 1.6 | GO:0090059 | protoxylem development(GO:0090059) |
| 0.2 | 0.8 | GO:1900378 | positive regulation of secondary metabolite biosynthetic process(GO:1900378) |
| 0.2 | 16.8 | GO:0009834 | plant-type secondary cell wall biogenesis(GO:0009834) |
| 0.1 | 2.3 | GO:0045493 | xylan catabolic process(GO:0045493) |
| 0.1 | 0.5 | GO:0009855 | determination of bilateral symmetry(GO:0009855) |
| 0.0 | 0.8 | GO:0009833 | plant-type primary cell wall biogenesis(GO:0009833) |
| 0.0 | 1.7 | GO:0006401 | RNA catabolic process(GO:0006401) |
| 0.0 | 0.5 | GO:0008360 | regulation of cell shape(GO:0008360) |
| 0.0 | 1.3 | GO:0010119 | regulation of stomatal movement(GO:0010119) |
Gene overrepresentation in cellular component category:
| Log-likelihood per target | Total log-likelihood | Term | Description |
|---|---|---|---|
| 0.3 | 10.5 | GO:0005764 | lysosome(GO:0005764) |
| 0.2 | 4.8 | GO:0031012 | extracellular matrix(GO:0031012) |
| 0.0 | 6.9 | GO:0005802 | trans-Golgi network(GO:0005802) |
| 0.0 | 4.1 | GO:0009505 | plant-type cell wall(GO:0009505) |
| 0.0 | 4.4 | GO:0031225 | anchored component of membrane(GO:0031225) |
Gene overrepresentation in molecular function category:
| Log-likelihood per target | Total log-likelihood | Term | Description |
|---|---|---|---|
| 0.6 | 6.8 | GO:0048040 | UDP-glucuronate decarboxylase activity(GO:0048040) |
| 0.5 | 4.1 | GO:0004566 | beta-glucuronidase activity(GO:0004566) |
| 0.4 | 1.4 | GO:0080116 | glucuronoxylan glucuronosyltransferase activity(GO:0080116) |
| 0.3 | 1.7 | GO:0033897 | ribonuclease T2 activity(GO:0033897) |
| 0.2 | 5.1 | GO:0004568 | chitinase activity(GO:0004568) |
| 0.2 | 6.9 | GO:0016760 | cellulose synthase (UDP-forming) activity(GO:0016760) |
| 0.2 | 2.3 | GO:0031176 | endo-1,4-beta-xylanase activity(GO:0031176) |
| 0.2 | 3.8 | GO:0052716 | hydroquinone:oxygen oxidoreductase activity(GO:0052716) |
| 0.1 | 9.6 | GO:0004197 | cysteine-type endopeptidase activity(GO:0004197) |
| 0.0 | 4.8 | GO:0004252 | serine-type endopeptidase activity(GO:0004252) |
| 0.0 | 1.6 | GO:0008234 | cysteine-type peptidase activity(GO:0008234) |
| 0.0 | 1.6 | GO:0046982 | protein heterodimerization activity(GO:0046982) |
Gene overrepresentation in curated gene sets: canonical pathways category:
| Log-likelihood per target | Total log-likelihood | Term | Description |
|---|---|---|---|
| 0.1 | 0.5 | PID IL8 CXCR2 PATHWAY | IL8- and CXCR2-mediated signaling events |
Gene overrepresentation in curated gene sets: REACTOME pathways category:
| Log-likelihood per target | Total log-likelihood | Term | Description |
|---|---|---|---|
| 0.2 | 0.5 | REACTOME SEMAPHORIN INTERACTIONS | Genes involved in Semaphorin interactions |