Project
GSE43616: Time-course of wild-type Arabidopsis leaf
Navigation
Downloads
Results for AT1G70920
Z-value: 2.49
Transcription factors associated with AT1G70920
| Gene Symbol | Gene ID | Gene Info |
|---|---|---|
|
AT1G70920
|
AT1G70920 | homeobox-leucine zipper protein 18 |
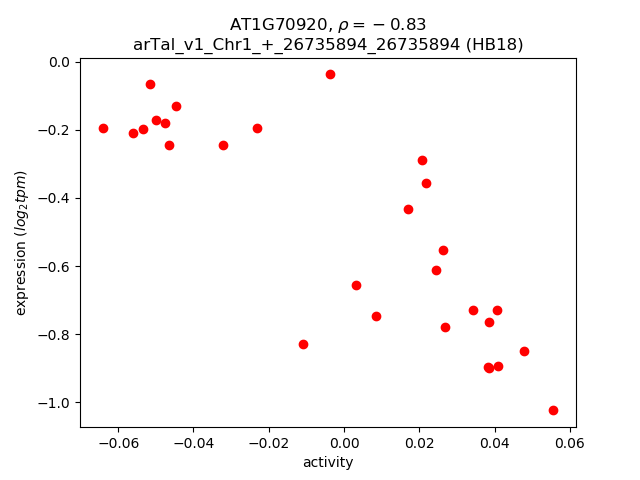
Activity-expression correlation:
| Gene | Promoter | Pearson corr. coef. | P-value | Plot |
|---|---|---|---|---|
| HB18 | arTal_v1_Chr1_+_26735894_26735894 | -0.83 | 4.8e-08 | Click! |
Activity profile of AT1G70920 motif
Sorted Z-values of AT1G70920 motif
| Promoter | Log-likelihood | Transcript | Gene | Gene Info |
|---|---|---|---|---|
| arTal_v1_Chr4_-_18098633_18098633 | 16.74 |
AT4G38770.1
|
PRP4
|
proline-rich protein 4 |
| arTal_v1_Chr1_-_4090857_4090857 | 13.05 |
AT1G12090.1
|
ELP
|
extensin-like protein |
| arTal_v1_Chr1_+_10371675_10371675 | 11.64 |
AT1G29660.1
|
AT1G29660
|
GDSL-like Lipase/Acylhydrolase superfamily protein |
| arTal_v1_Chr3_-_4008018_4008018 | 11.15 |
AT3G12610.1
|
DRT100
|
Leucine-rich repeat (LRR) family protein |
| arTal_v1_Chr4_+_12660687_12660687 | 10.32 |
AT4G24510.1
|
CER2
|
HXXXD-type acyl-transferase family protein |
| arTal_v1_Chr1_-_1043887_1043887 | 9.47 |
AT1G04040.1
|
AT1G04040
|
HAD superfamily, subfamily IIIB acid phosphatase |
| arTal_v1_Chr4_-_17606924_17607050 | 9.35 |
AT4G37450.1
AT4G37450.2 |
AGP18
|
arabinogalactan protein 18 |
| arTal_v1_Chr1_+_26141726_26141836 | 9.15 |
AT1G69530.2
AT1G69530.1 AT1G69530.3 AT1G69530.5 AT1G69530.4 |
EXPA1
|
expansin A1 |
| arTal_v1_Chr1_-_4530222_4530222 | 8.93 |
AT1G13250.1
|
GATL3
|
galacturonosyltransferase-like 3 |
| arTal_v1_Chr5_+_3889906_3889906 | 8.86 |
AT5G12050.1
|
AT5G12050
|
rho GTPase-activating protein |
| arTal_v1_Chr2_-_15483706_15483788 | 8.68 |
AT2G36885.2
AT2G36885.1 |
AT2G36885
|
translation initiation factor |
| arTal_v1_Chr2_+_1676999_1676999 | 8.61 |
AT2G04780.2
|
FLA7
|
FASCICLIN-like arabinoogalactan 7 |
| arTal_v1_Chr5_-_8707885_8707885 | 8.52 |
AT5G25190.1
|
ESE3
|
Integrase-type DNA-binding superfamily protein |
| arTal_v1_Chr2_+_1676717_1676717 | 8.40 |
AT2G04780.1
|
FLA7
|
FASCICLIN-like arabinoogalactan 7 |
| arTal_v1_Chr2_+_19243348_19243427 | 8.34 |
AT2G46820.1
AT2G46820.2 |
PSI-P
|
photosystem I P subunit |
| arTal_v1_Chr5_-_5966785_5966785 | 8.26 |
AT5G18020.1
|
SAUR20
|
SAUR-like auxin-responsive protein family |
| arTal_v1_Chr1_+_5058583_5058680 | 8.13 |
AT1G14700.4
AT1G14700.1 AT1G14700.3 AT1G14700.2 |
PAP3
|
purple acid phosphatase 3 |
| arTal_v1_Chr3_+_3698658_3698658 | 7.84 |
AT3G11700.1
|
FLA18
|
FASCICLIN-like arabinogalactan protein 18 precursor |
| arTal_v1_Chr5_+_2680401_2680401 | 7.70 |
AT5G08330.1
|
TCP11
|
TCP family transcription factor |
| arTal_v1_Chr2_-_12173951_12173991 | 7.69 |
AT2G28470.2
AT2G28470.4 AT2G28470.1 AT2G28470.3 |
BGAL8
|
beta-galactosidase 8 |
| arTal_v1_Chr1_+_28428671_28428671 | 7.55 |
AT1G75710.1
|
AT1G75710
|
C2H2-like zinc finger protein |
| arTal_v1_Chr2_+_14216771_14216771 | 7.50 |
AT2G33570.1
|
GALS1
|
glycosyltransferase family protein (DUF23) |
| arTal_v1_Chr4_+_15819489_15819489 | 7.24 |
AT4G32800.1
|
AT4G32800
|
Integrase-type DNA-binding superfamily protein |
| arTal_v1_Chr3_-_4042075_4042075 | 7.11 |
AT3G12710.1
|
AT3G12710
|
DNA glycosylase superfamily protein |
| arTal_v1_Chr1_+_7696427_7696427 | 6.98 |
AT1G21910.1
|
DREB26
|
Integrase-type DNA-binding superfamily protein |
| arTal_v1_Chr5_+_22474142_22474142 | 6.82 |
AT5G55480.1
|
SVL1
|
SHV3-like 1 |
| arTal_v1_Chr3_-_2216483_2216483 | 6.78 |
AT3G07010.1
AT3G07010.2 |
AT3G07010
|
Pectin lyase-like superfamily protein |
| arTal_v1_Chr1_+_1136078_1136078 | 6.64 |
AT1G04250.1
|
AXR3
|
AUX/IAA transcriptional regulator family protein |
| arTal_v1_Chr4_-_10278794_10278794 | 6.61 |
AT4G18670.1
|
AT4G18670
|
Leucine-rich repeat (LRR) family protein |
| arTal_v1_Chr1_-_22317070_22317070 | 6.45 |
AT1G60590.1
|
AT1G60590
|
Pectin lyase-like superfamily protein |
| arTal_v1_Chr5_+_6387341_6387489 | 6.41 |
AT5G19090.1
AT5G19090.4 AT5G19090.3 AT5G19090.2 |
AT5G19090
|
Heavy metal transport/detoxification superfamily protein |
| arTal_v1_Chr1_-_18690503_18690503 | 6.34 |
AT1G50450.1
|
AT1G50450
|
Saccharopine dehydrogenase |
| arTal_v1_Chr3_-_6980523_6980523 | 6.26 |
AT3G20015.1
|
AT3G20015
|
Eukaryotic aspartyl protease family protein |
| arTal_v1_Chr5_-_7047446_7047446 | 6.18 |
AT5G20820.1
|
AT5G20820
|
SAUR-like auxin-responsive protein family |
| arTal_v1_Chr4_+_5550404_5550404 | 6.15 |
AT4G08685.1
|
SAH7
|
Pollen Ole e 1 allergen and extensin family protein |
| arTal_v1_Chr4_-_8350030_8350030 | 6.13 |
AT4G14550.4
|
IAA14
|
indole-3-acetic acid inducible 14 |
| arTal_v1_Chr4_-_15312987_15312987 | 6.12 |
AT4G31590.1
|
CSLC5
|
Cellulose-synthase-like C5 |
| arTal_v1_Chr2_+_9034056_9034056 | 6.07 |
AT2G21050.1
|
LAX2
|
like AUXIN RESISTANT 2 |
| arTal_v1_Chr5_-_20940895_20940895 | 6.06 |
AT5G51550.1
|
EXL3
|
EXORDIUM like 3 |
| arTal_v1_Chr1_+_18290942_18290979 | 6.06 |
AT1G49430.1
AT1G49430.2 |
LACS2
|
long-chain acyl-CoA synthetase 2 |
| arTal_v1_Chr3_+_19713799_19713799 | 6.06 |
AT3G53190.1
|
AT3G53190
|
Pectin lyase-like superfamily protein |
| arTal_v1_Chr5_+_24240810_24240810 | 5.95 |
AT5G60200.1
|
TMO6
|
TARGET OF MONOPTEROS 6 |
| arTal_v1_Chr3_-_22256177_22256177 | 5.88 |
AT3G60220.1
|
ATL4
|
TOXICOS EN LEVADURA 4 |
| arTal_v1_Chr3_-_6855513_6855590 | 5.88 |
AT3G19720.3
AT3G19720.2 AT3G19720.1 |
ARC5
|
P-loop containing nucleoside triphosphate hydrolases superfamily protein |
| arTal_v1_Chr1_-_1307973_1307973 | 5.86 |
AT1G04680.1
|
AT1G04680
|
Pectin lyase-like superfamily protein |
| arTal_v1_Chr5_+_15957368_15957368 | 5.82 |
AT5G39860.1
|
PRE1
|
basic helix-loop-helix (bHLH) DNA-binding family protein |
| arTal_v1_Chr3_+_22745514_22745514 | 5.80 |
AT3G61470.1
|
LHCA2
|
photosystem I light harvesting complex protein |
| arTal_v1_Chr1_-_3518035_3518035 | 5.71 |
AT1G10640.1
|
AT1G10640
|
Pectin lyase-like superfamily protein |
| arTal_v1_Chr4_-_8350263_8350263 | 5.69 |
AT4G14550.1
AT4G14550.2 AT4G14550.3 |
IAA14
|
indole-3-acetic acid inducible 14 |
| arTal_v1_Chr4_+_12376122_12376194 | 5.60 |
AT4G23750.1
AT4G23750.2 |
CRF2
|
cytokinin response factor 2 |
| arTal_v1_Chr5_-_9242854_9242854 | 5.59 |
AT5G26330.1
|
AT5G26330
|
Cupredoxin superfamily protein |
| arTal_v1_Chr5_+_17722402_17722402 | 5.55 |
AT5G44050.1
|
AT5G44050
|
MATE efflux family protein |
| arTal_v1_Chr3_-_2407634_2407634 | 5.23 |
AT3G07540.1
|
AT3G07540
|
Actin-binding FH2 (formin homology 2) family protein |
| arTal_v1_Chr2_-_1021186_1021186 | 5.23 |
AT2G03350.1
|
AT2G03350
|
DUF538 family protein (Protein of unknown function, DUF538) |
| arTal_v1_Chr4_+_10231218_10231218 | 5.20 |
AT4G18570.2
AT4G18570.1 |
AT4G18570
|
Tetratricopeptide repeat (TPR)-like superfamily protein |
| arTal_v1_Chr3_-_10129937_10129937 | 5.16 |
AT3G27360.1
|
AT3G27360
|
Histone superfamily protein |
| arTal_v1_Chr2_-_19622251_19622301 | 5.07 |
AT2G47940.2
AT2G47940.1 |
DEG2
|
DEGP protease 2 |
| arTal_v1_Chr2_-_16391073_16391176 | 5.02 |
AT2G39250.2
AT2G39250.1 |
SNZ
|
Integrase-type DNA-binding superfamily protein |
| arTal_v1_Chr3_+_1727151_1727151 | 5.01 |
AT3G05800.1
|
AIF1
|
AtBS1(activation-tagged BRI1 suppressor 1)-interacting factor 1 |
| arTal_v1_Chr2_-_12173679_12173679 | 4.96 |
AT2G28470.5
|
BGAL8
|
beta-galactosidase 8 |
| arTal_v1_Chr2_+_16775424_16775424 | 4.90 |
AT2G40150.1
|
TBL28
|
TRICHOME BIREFRINGENCE-LIKE 28 |
| arTal_v1_Chr5_+_7168106_7168106 | 4.86 |
AT5G21100.1
|
AT5G21100
|
Plant L-ascorbate oxidase |
| arTal_v1_Chr5_+_880148_880148 | 4.79 |
AT5G03510.1
|
AT5G03510
|
C2H2-type zinc finger family protein |
| arTal_v1_Chr4_-_12068538_12068624 | 4.77 |
AT4G23020.2
AT4G23020.1 |
TRM11
|
hypothetical protein |
| arTal_v1_Chr5_+_6387735_6387735 | 4.74 |
AT5G19090.5
|
AT5G19090
|
Heavy metal transport/detoxification superfamily protein |
| arTal_v1_Chr1_+_11349697_11349697 | 4.74 |
AT1G31710.1
|
AT1G31710
|
Copper amine oxidase family protein |
| arTal_v1_Chr1_+_21136835_21136835 | 4.72 |
AT1G56430.1
|
NAS4
|
nicotianamine synthase 4 |
| arTal_v1_Chr2_-_9699915_9699944 | 4.71 |
AT2G22795.3
AT2G22795.2 AT2G22795.1 |
AT2G22795
|
hypothetical protein |
| arTal_v1_Chr2_+_417427_417427 | 4.67 |
AT2G01910.2
|
ATMAP65-6
|
Microtubule associated protein (MAP65/ASE1) family protein |
| arTal_v1_Chr2_+_17446744_17446744 | 4.63 |
AT2G41820.1
|
AT2G41820
|
Leucine-rich repeat protein kinase family protein |
| arTal_v1_Chr1_+_4157654_4157654 | 4.59 |
AT1G12244.1
|
AT1G12244
|
Polynucleotidyl transferase, ribonuclease H-like superfamily protein |
| arTal_v1_Chr1_+_4688018_4688018 | 4.56 |
AT1G13670.1
|
AT1G13670
|
hypothetical protein |
| arTal_v1_Chr2_+_416021_416021 | 4.46 |
AT2G01910.1
|
ATMAP65-6
|
Microtubule associated protein (MAP65/ASE1) family protein |
| arTal_v1_Chr3_-_1643174_1643253 | 4.42 |
AT3G05640.2
AT3G05640.1 AT3G05640.3 |
AT3G05640
|
Protein phosphatase 2C family protein |
| arTal_v1_Chr4_+_11424666_11424666 | 4.37 |
AT4G21445.1
|
AT4G21445
|
receptor-interacting protein |
| arTal_v1_Chr1_+_5136874_5136874 | 4.34 |
AT1G14890.1
|
AT1G14890
|
Plant invertase/pectin methylesterase inhibitor superfamily protein |
| arTal_v1_Chr4_-_17242030_17242168 | 4.33 |
AT4G36530.1
AT4G36530.2 |
AT4G36530
|
alpha/beta-Hydrolases superfamily protein |
| arTal_v1_Chr1_+_29871326_29871326 | 4.28 |
AT1G79420.1
|
AT1G79420
|
C-type mannose receptor (DUF620) |
| arTal_v1_Chr4_-_5162774_5162867 | 4.26 |
AT4G08160.2
AT4G08160.1 |
AT4G08160
|
glycosyl hydrolase family 10 protein / carbohydrate-binding domain-containing protein |
| arTal_v1_Chr5_+_1399395_1399395 | 4.24 |
AT5G04820.1
|
OFP13
|
ovate family protein 13 |
| arTal_v1_Chr2_-_13864596_13864710 | 4.24 |
AT2G32690.2
AT2G32690.3 AT2G32690.5 AT2G32690.4 AT2G32690.1 |
GRP23
|
glycine-rich protein 23 |
| arTal_v1_Chr1_-_20357879_20357879 | 4.24 |
AT1G54500.1
|
AT1G54500
|
Rubredoxin-like superfamily protein |
| arTal_v1_Chr2_-_918671_918671 | 4.22 |
AT2G03090.1
|
EXPA15
|
expansin A15 |
| arTal_v1_Chr1_-_158823_158823 | 4.20 |
AT1G01430.1
|
TBL25
|
TRICHOME BIREFRINGENCE-LIKE 25 |
| arTal_v1_Chr4_+_18296388_18296388 | 4.19 |
AT4G39350.1
|
CESA2
|
cellulose synthase A2 |
| arTal_v1_Chr3_+_19412019_19412019 | 4.18 |
AT3G52360.1
|
AT3G52360
|
transmembrane protein |
| arTal_v1_Chr1_-_3931701_3931701 | 4.16 |
AT1G11670.1
|
AT1G11670
|
MATE efflux family protein |
| arTal_v1_Chr2_-_16603059_16603061 | 4.11 |
AT2G39800.2
AT2G39800.4 AT2G39800.3 |
P5CS1
|
delta1-pyrroline-5-carboxylate synthase 1 |
| arTal_v1_Chr1_+_23696720_23696720 | 4.11 |
AT1G63850.1
|
AT1G63850
|
BTB/POZ domain-containing protein |
| arTal_v1_Chr2_-_16603319_16603319 | 4.08 |
AT2G39800.1
|
P5CS1
|
delta1-pyrroline-5-carboxylate synthase 1 |
| arTal_v1_Chr2_-_11290360_11290361 | 4.06 |
AT2G26540.1
AT2G26540.2 AT2G26540.3 |
HEMD
|
uroporphyrinogen-III synthase family protein |
| arTal_v1_Chr1_-_22382422_22382422 | 4.04 |
AT1G60790.1
|
TBL2
|
trichome birefringence-like protein (DUF828) |
| arTal_v1_Chr3_-_19281345_19281393 | 4.01 |
AT3G51950.3
AT3G51950.1 AT3G51950.2 |
AT3G51950
|
Zinc finger (CCCH-type) family protein / RNA recognition motif (RRM)-containing protein |
| arTal_v1_Chr5_-_26129547_26129547 | 4.00 |
AT5G65390.1
|
AGP7
|
arabinogalactan protein 7 |
| arTal_v1_Chr2_+_11041331_11041331 | 3.99 |
AT2G25900.2
AT2G25900.1 |
ATCTH
|
Zinc finger C-x8-C-x5-C-x3-H type family protein |
| arTal_v1_Chr3_+_4510965_4510965 | 3.98 |
AT3G13750.1
|
BGAL1
|
beta galactosidase 1 |
| arTal_v1_Chr3_-_16740546_16740546 | 3.93 |
AT3G45610.1
|
DOF6
|
Dof-type zinc finger DNA-binding family protein |
| arTal_v1_Chr5_+_98533_98533 | 3.91 |
AT5G01240.2
|
LAX1
|
like AUXIN RESISTANT 1 |
| arTal_v1_Chr4_+_10883921_10883921 | 3.90 |
AT4G20140.1
|
GSO1
|
Leucine-rich repeat transmembrane protein kinase |
| arTal_v1_Chr1_-_25395249_25395249 | 3.88 |
AT1G67740.1
|
PSBY
|
photosystem II BY |
| arTal_v1_Chr3_-_19280823_19280823 | 3.86 |
AT3G51950.4
|
AT3G51950
|
Zinc finger (CCCH-type) family protein / RNA recognition motif (RRM)-containing protein |
| arTal_v1_Chr5_+_97536_97536 | 3.85 |
AT5G01240.1
|
LAX1
|
like AUXIN RESISTANT 1 |
| arTal_v1_Chr1_+_17835032_17835032 | 3.79 |
AT1G48280.1
|
AT1G48280
|
hydroxyproline-rich glycoprotein family protein |
| arTal_v1_Chr1_-_2392500_2392628 | 3.79 |
AT1G07720.1
AT1G07720.2 |
KCS3
|
3-ketoacyl-CoA synthase 3 |
| arTal_v1_Chr1_-_10664570_10664668 | 3.71 |
AT1G30280.2
AT1G30280.3 AT1G30280.1 |
AT1G30280
|
Chaperone DnaJ-domain superfamily protein |
| arTal_v1_Chr1_+_5875295_5875295 | 3.71 |
AT1G17190.1
|
GSTU26
|
glutathione S-transferase tau 26 |
| arTal_v1_Chr1_+_29703055_29703055 | 3.69 |
AT1G78970.3
AT1G78970.1 |
LUP1
|
lupeol synthase 1 |
| arTal_v1_Chr3_-_16292362_16292464 | 3.61 |
AT3G44735.1
AT3G44735.2 |
PSK3
|
PHYTOSULFOKINE 3 PRECURSOR |
| arTal_v1_Chr5_-_20489727_20489727 | 3.61 |
AT5G50335.1
|
AT5G50335
|
hypothetical protein |
| arTal_v1_Chr3_+_6744377_6744377 | 3.59 |
AT3G19450.1
|
ATCAD4
|
GroES-like zinc-binding alcohol dehydrogenase family protein |
| arTal_v1_Chr4_+_18130237_18130237 | 3.58 |
AT4G38860.1
|
AT4G38860
|
SAUR-like auxin-responsive protein family |
| arTal_v1_Chr1_-_22336994_22336994 | 3.55 |
AT1G60630.1
|
AT1G60630
|
Leucine-rich repeat protein kinase family protein |
| arTal_v1_Chr5_+_25050679_25050679 | 3.54 |
AT5G62380.2
|
NAC101
|
NAC-domain protein 101 |
| arTal_v1_Chr4_-_10572412_10572516 | 3.53 |
AT4G19380.1
AT4G19380.2 |
AT4G19380
|
Long-chain fatty alcohol dehydrogenase family protein |
| arTal_v1_Chr1_+_9996713_9996713 | 3.53 |
AT1G28440.1
|
HSL1
|
HAESA-like 1 |
| arTal_v1_Chr1_-_20043498_20043626 | 3.53 |
AT1G53690.2
AT1G53690.1 |
AT1G53690
|
DNA directed RNA polymerase, 7 kDa subunit |
| arTal_v1_Chr5_-_21154395_21154395 | 3.52 |
AT5G52060.1
|
BAG1
|
BCL-2-associated athanogene 1 |
| arTal_v1_Chr5_+_6947789_6947789 | 3.51 |
AT5G20540.1
|
BRXL4
|
BREVIS RADIX-like 4 |
| arTal_v1_Chr1_-_23892193_23892193 | 3.51 |
AT1G64380.1
|
AT1G64380
|
Integrase-type DNA-binding superfamily protein |
| arTal_v1_Chr2_-_8730525_8730525 | 3.51 |
AT2G20240.1
|
TRM17
|
GPI-anchored adhesin-like protein, putative (DUF3741) |
| arTal_v1_Chr2_+_18490030_18490030 | 3.48 |
AT2G44830.3
|
AT2G44830
|
Protein kinase superfamily protein |
| arTal_v1_Chr1_+_20061405_20061482 | 3.48 |
AT1G53730.2
AT1G53730.1 |
SRF6
|
STRUBBELIG-receptor family 6 |
| arTal_v1_Chr2_+_18489875_18489875 | 3.43 |
AT2G44830.1
|
AT2G44830
|
Protein kinase superfamily protein |
| arTal_v1_Chr3_+_18340934_18340976 | 3.35 |
AT3G49470.1
AT3G49470.2 |
NACA2
|
nascent polypeptide-associated complex subunit alpha-like protein 2 |
| arTal_v1_Chr2_+_18489607_18489607 | 3.34 |
AT2G44830.2
|
AT2G44830
|
Protein kinase superfamily protein |
| arTal_v1_Chr4_+_9284910_9284910 | 3.34 |
AT4G16460.1
|
AT4G16460
|
zinc finger CCCH domain protein |
| arTal_v1_Chr2_-_13682308_13682333 | 3.29 |
AT2G32230.1
AT2G32230.2 |
PRORP1
|
proteinaceous RNase P 1 |
| arTal_v1_Chr3_-_7984833_7984833 | 3.28 |
AT3G22540.1
|
AT3G22540
|
hypothetical protein (DUF1677) |
| arTal_v1_Chr5_-_24377206_24377206 | 3.28 |
AT5G60660.1
|
PIP2%3B4
|
plasma membrane intrinsic protein 2;4 |
| arTal_v1_Chr4_+_9285188_9285197 | 3.27 |
AT4G16460.3
AT4G16460.2 |
AT4G16460
|
zinc finger CCCH domain protein |
| arTal_v1_Chr4_+_1329548_1329548 | 3.27 |
AT4G03010.1
|
AT4G03010
|
RNI-like superfamily protein |
| arTal_v1_Chr4_-_18334893_18334893 | 3.24 |
AT4G39410.1
|
WRKY13
|
WRKY DNA-binding protein 13 |
| arTal_v1_Chr2_+_18524311_18524370 | 3.23 |
AT2G44920.2
AT2G44920.1 |
AT2G44920
|
Tetratricopeptide repeat (TPR)-like superfamily protein |
| arTal_v1_Chr5_+_25050152_25050152 | 3.23 |
AT5G62380.1
|
NAC101
|
NAC-domain protein 101 |
| arTal_v1_Chr3_-_8217080_8217206 | 3.22 |
AT3G23090.1
AT3G23090.2 AT3G23090.4 AT3G23090.3 |
AT3G23090
|
TPX2 (targeting protein for Xklp2) protein family |
| arTal_v1_Chr2_-_19361162_19361162 | 3.22 |
AT2G47160.2
|
BOR1
|
HCO3- transporter family |
| arTal_v1_Chr2_-_19361328_19361328 | 3.19 |
AT2G47160.1
|
BOR1
|
HCO3- transporter family |
| arTal_v1_Chr4_-_6567740_6567740 | 3.18 |
AT4G10630.1
|
AT4G10630
|
Glutaredoxin family protein |
| arTal_v1_Chr5_-_21095702_21095702 | 3.18 |
AT5G51910.1
|
AT5G51910
|
TCP family transcription factor |
| arTal_v1_Chr1_-_1696191_1696191 | 3.18 |
AT1G05660.1
|
AT1G05660
|
Pectin lyase-like superfamily protein |
| arTal_v1_Chr5_+_3476820_3476820 | 3.14 |
AT5G10990.1
|
AT5G10990
|
SAUR-like auxin-responsive protein family |
| arTal_v1_Chr5_-_21095891_21095891 | 3.08 |
AT5G51910.2
|
AT5G51910
|
TCP family transcription factor |
| arTal_v1_Chr3_-_2343697_2343697 | 3.05 |
AT3G07340.2
AT3G07340.1 |
AT3G07340
|
basic helix-loop-helix (bHLH) DNA-binding superfamily protein |
| arTal_v1_Chr5_-_18601661_18601661 | 3.04 |
AT5G45850.1
|
AT5G45850
|
hypothetical protein (DUF688) |
| arTal_v1_Chr1_-_28557615_28557615 | 3.03 |
AT1G76110.1
|
AT1G76110
|
HMG (high mobility group) box protein with ARID/BRIGHT DNA-binding domain-containing protein |
| arTal_v1_Chr2_+_9089226_9089226 | 3.01 |
AT2G21220.1
|
AT2G21220
|
SAUR-like auxin-responsive protein family |
| arTal_v1_Chr1_+_24824356_24824496 | 3.01 |
AT1G66540.1
AT1G66540.2 |
AT1G66540
|
Cytochrome P450 superfamily protein |
| arTal_v1_Chr1_-_29203418_29203418 | 2.99 |
AT1G77690.1
|
LAX3
|
like AUX1 3 |
| arTal_v1_Chr3_-_9805781_9805781 | 2.98 |
AT3G26690.2
AT3G26690.1 |
NUDX13
|
nudix hydrolase homolog 13 |
| arTal_v1_Chr5_-_2622900_2622900 | 2.97 |
AT5G08150.1
|
SOB5
|
suppressor of phytochrome b 5 |
| arTal_v1_Chr1_+_29703330_29703330 | 2.94 |
AT1G78970.2
|
LUP1
|
lupeol synthase 1 |
| arTal_v1_Chr1_+_4908249_4908255 | 2.91 |
AT1G14350.1
AT1G14350.4 |
FLP
|
Duplicated homeodomain-like superfamily protein |
| arTal_v1_Chr1_-_24529313_24529362 | 2.90 |
AT1G65920.2
AT1G65920.1 |
AT1G65920
|
Regulator of chromosome condensation (RCC1) family with FYVE zinc finger domain-containing protein |
| arTal_v1_Chr5_+_19174589_19174589 | 2.88 |
AT5G47225.1
|
AT5G47225
|
|
| arTal_v1_Chr1_-_22885052_22885125 | 2.87 |
AT1G61900.3
AT1G61900.2 AT1G61900.1 |
AT1G61900
|
hypothetical protein |
| arTal_v1_Chr1_-_18626441_18626441 | 2.85 |
AT1G50280.1
AT1G50280.2 |
AT1G50280
|
Phototropic-responsive NPH3 family protein |
| arTal_v1_Chr1_+_26403341_26403368 | 2.84 |
AT1G70100.2
AT1G70100.5 AT1G70100.6 |
AT1G70100
|
neurofilament heavy protein |
| arTal_v1_Chr1_+_24554413_24554413 | 2.84 |
AT1G65960.4
|
GAD2
|
glutamate decarboxylase 2 |
| arTal_v1_Chr1_+_4907887_4907917 | 2.83 |
AT1G14350.2
AT1G14350.3 |
FLP
|
Duplicated homeodomain-like superfamily protein |
| arTal_v1_Chr1_+_26402978_26403083 | 2.81 |
AT1G70100.1
AT1G70100.3 AT1G70100.4 |
AT1G70100
|
neurofilament heavy protein |
| arTal_v1_Chr3_+_6496135_6496198 | 2.80 |
AT3G18840.2
AT3G18840.3 |
AT3G18840
|
LOW protein: PPR containing-like protein |
| arTal_v1_Chr3_-_1131094_1131099 | 2.77 |
AT3G04280.3
AT3G04280.2 AT3G04280.1 |
RR22
|
response regulator 22 |
| arTal_v1_Chr1_+_24551807_24551807 | 2.77 |
AT1G65960.3
AT1G65960.1 |
GAD2
|
glutamate decarboxylase 2 |
| arTal_v1_Chr1_+_12472868_12472868 | 2.77 |
AT1G34245.1
|
EPF2
|
Putative membrane lipoprotein |
| arTal_v1_Chr3_+_21238223_21238223 | 2.76 |
AT3G57400.1
|
AT3G57400
|
transmembrane protein |
| arTal_v1_Chr1_+_3086101_3086101 | 2.76 |
AT1G09540.1
|
MYB61
|
myb domain protein 61 |
| arTal_v1_Chr2_+_12477966_12477966 | 2.75 |
AT2G29050.1
|
RBL1
|
RHOMBOID-like 1 |
| arTal_v1_Chr2_+_15379660_15379660 | 2.74 |
AT2G36690.1
|
AT2G36690
|
2-oxoglutarate (2OG) and Fe(II)-dependent oxygenase superfamily protein |
| arTal_v1_Chr5_-_23016015_23016015 | 2.74 |
AT5G56890.1
|
AT5G56890
|
Protein kinase superfamily protein |
| arTal_v1_Chr2_+_15379846_15379846 | 2.74 |
AT2G36690.2
|
AT2G36690
|
2-oxoglutarate (2OG) and Fe(II)-dependent oxygenase superfamily protein |
| arTal_v1_Chr2_+_11014789_11014789 | 2.71 |
AT2G25820.1
|
ESE2
|
Integrase-type DNA-binding superfamily protein |
| arTal_v1_Chr1_+_24614817_24614817 | 2.71 |
AT1G66130.1
|
AT1G66130
|
NAD(P)-binding Rossmann-fold superfamily protein |
| arTal_v1_Chr1_-_19634039_19634051 | 2.70 |
AT1G52700.2
AT1G52700.3 AT1G52700.4 AT1G52700.1 |
AT1G52700
|
alpha/beta-Hydrolases superfamily protein |
| arTal_v1_Chr1_+_24552003_24552003 | 2.70 |
AT1G65960.2
|
GAD2
|
glutamate decarboxylase 2 |
| arTal_v1_Chr2_-_19222916_19222916 | 2.69 |
AT2G46770.1
|
NST1
|
NAC (No Apical Meristem) domain transcriptional regulator superfamily protein |
| arTal_v1_Chr2_+_12478146_12478146 | 2.69 |
AT2G29050.2
|
RBL1
|
RHOMBOID-like 1 |
| arTal_v1_Chr3_+_7031171_7031284 | 2.67 |
AT3G20150.1
AT3G20150.2 |
AT3G20150
|
Kinesin motor family protein |
| arTal_v1_Chr1_+_27192740_27192902 | 2.67 |
AT1G72250.3
AT1G72250.4 AT1G72250.2 AT1G72250.1 |
AT1G72250
|
Di-glucose binding protein with Kinesin motor domain-containing protein |
| arTal_v1_Chr4_+_729863_729887 | 2.65 |
AT4G01690.1
AT4G01690.2 |
PPOX
|
Flavin containing amine oxidoreductase family |
| arTal_v1_Chr4_-_18173840_18173840 | 2.65 |
AT4G39000.1
|
GH9B17
|
glycosyl hydrolase 9B17 |
| arTal_v1_Chr4_-_8138392_8138392 | 2.65 |
AT4G14130.1
|
XTH15
|
xyloglucan endotransglucosylase/hydrolase 15 |
| arTal_v1_Chr4_+_749307_749307 | 2.63 |
AT4G01730.1
|
AT4G01730
|
DHHC-type zinc finger family protein |
| arTal_v1_Chr5_+_8589457_8589457 | 2.62 |
AT5G24930.1
|
COL4
|
zinc finger CONSTANS-like protein |
| arTal_v1_Chr1_-_24807557_24807557 | 2.61 |
AT1G66480.1
|
AT1G66480
|
plastid movement impaired 2 |
| arTal_v1_Chr5_-_18640401_18640401 | 2.60 |
AT5G45960.1
|
AT5G45960
|
GDSL-like Lipase/Acylhydrolase superfamily protein |
| arTal_v1_Chr1_-_29499682_29499682 | 2.60 |
AT1G78400.1
|
AT1G78400
|
Pectin lyase-like superfamily protein |
| arTal_v1_Chr2_-_368357_368357 | 2.52 |
AT2G01830.5
AT2G01830.2 AT2G01830.4 |
WOL
|
CHASE domain containing histidine kinase protein |
| arTal_v1_Chr1_+_12180483_12180483 | 2.50 |
AT1G33600.1
|
AT1G33600
|
Leucine-rich repeat (LRR) family protein |
| arTal_v1_Chr3_+_5025383_5025383 | 2.49 |
AT3G14940.2
|
PPC3
|
phosphoenolpyruvate carboxylase 3 |
| arTal_v1_Chr4_-_16631339_16631370 | 2.48 |
AT4G34900.3
AT4G34900.2 AT4G34900.1 |
XDH2
|
xanthine dehydrogenase 2 |
| arTal_v1_Chr1_+_27767178_27767178 | 2.48 |
AT1G73850.2
|
AT1G73850
|
DNA ligase (DUF1666) |
| arTal_v1_Chr3_+_7789901_7789993 | 2.47 |
AT3G22104.2
AT3G22104.3 |
AT3G22104
|
Phototropic-responsive NPH3 family protein |
| arTal_v1_Chr1_+_12180776_12180776 | 2.47 |
AT1G33600.2
|
AT1G33600
|
Leucine-rich repeat (LRR) family protein |
| arTal_v1_Chr3_+_5025184_5025184 | 2.47 |
AT3G14940.1
|
PPC3
|
phosphoenolpyruvate carboxylase 3 |
| arTal_v1_Chr1_-_4208951_4208999 | 2.46 |
AT1G12370.3
AT1G12370.1 AT1G12370.2 |
PHR1
|
photolyase 1 |
| arTal_v1_Chr3_-_21897787_21897787 | 2.46 |
AT3G59230.1
|
AT3G59230
|
RNI-like superfamily protein |
| arTal_v1_Chr1_+_27766941_27766941 | 2.46 |
AT1G73850.1
|
AT1G73850
|
DNA ligase (DUF1666) |
| arTal_v1_Chr5_+_8584535_8584535 | 2.46 |
AT5G24920.1
|
GDU5
|
glutamine dumper 5 |
| arTal_v1_Chr4_-_18451293_18451305 | 2.45 |
AT4G39770.2
AT4G39770.1 |
TPPH
|
Haloacid dehalogenase-like hydrolase (HAD) superfamily protein |
| arTal_v1_Chr5_-_4121427_4121489 | 2.45 |
AT5G13000.2
AT5G13000.1 |
GSL12
|
glucan synthase-like 12 |
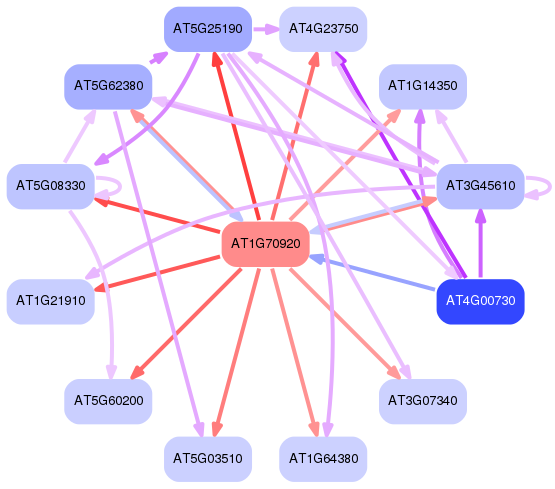
Network of associatons between targets according to the STRING database.

First level regulatory network of AT1G70920
Gene Ontology Analysis
Gene overrepresentation in biological process category:
| Log-likelihood per target | Total log-likelihood | Term | Description |
|---|---|---|---|
| 2.3 | 13.6 | GO:0009650 | UV protection(GO:0009650) |
| 2.3 | 6.8 | GO:0090058 | metaxylem development(GO:0090058) |
| 1.6 | 4.9 | GO:0050687 | negative regulation of immune effector process(GO:0002698) negative regulation of defense response to virus(GO:0050687) |
| 1.6 | 8.0 | GO:0010086 | embryonic root morphogenesis(GO:0010086) |
| 1.5 | 9.1 | GO:0031116 | positive regulation of microtubule polymerization(GO:0031116) |
| 1.4 | 5.7 | GO:0050878 | regulation of body fluid levels(GO:0050878) multicellular organismal water homeostasis(GO:0050891) |
| 1.4 | 9.9 | GO:0090057 | root radial pattern formation(GO:0090057) |
| 1.4 | 8.2 | GO:0055129 | L-proline biosynthetic process(GO:0055129) |
| 1.3 | 6.6 | GO:0019745 | pentacyclic triterpenoid metabolic process(GO:0019742) pentacyclic triterpenoid biosynthetic process(GO:0019745) |
| 1.3 | 6.5 | GO:0000085 | mitotic G1 phase(GO:0000080) mitotic S phase(GO:0000084) mitotic G2 phase(GO:0000085) G1 phase(GO:0051318) G2 phase(GO:0051319) S phase(GO:0051320) interphase(GO:0051325) mitotic interphase(GO:0051329) |
| 1.3 | 6.4 | GO:0046713 | borate transport(GO:0046713) |
| 1.2 | 4.7 | GO:0030417 | nicotianamine metabolic process(GO:0030417) nicotianamine biosynthetic process(GO:0030418) tricarboxylic acid biosynthetic process(GO:0072351) |
| 1.1 | 4.4 | GO:1905157 | positive regulation of photosynthesis(GO:1905157) |
| 1.1 | 3.2 | GO:0080145 | cysteine homeostasis(GO:0080145) |
| 0.9 | 16.8 | GO:0048829 | root cap development(GO:0048829) |
| 0.9 | 9.3 | GO:0009554 | megasporogenesis(GO:0009554) |
| 0.9 | 2.7 | GO:0042817 | pyridoxal metabolic process(GO:0042817) |
| 0.7 | 2.2 | GO:0010541 | acropetal auxin transport(GO:0010541) |
| 0.7 | 13.4 | GO:0006949 | syncytium formation(GO:0006949) |
| 0.7 | 9.6 | GO:0010052 | guard cell differentiation(GO:0010052) |
| 0.7 | 3.3 | GO:0001682 | tRNA 5'-leader removal(GO:0001682) |
| 0.6 | 11.7 | GO:0042761 | very long-chain fatty acid biosynthetic process(GO:0042761) |
| 0.6 | 3.2 | GO:0045597 | positive regulation of cell differentiation(GO:0045597) |
| 0.6 | 3.1 | GO:2001295 | malonyl-CoA biosynthetic process(GO:2001295) |
| 0.6 | 4.2 | GO:0043446 | cellular alkane metabolic process(GO:0043446) |
| 0.6 | 2.2 | GO:0048462 | carpel formation(GO:0048462) |
| 0.5 | 8.3 | GO:0006538 | glutamate catabolic process(GO:0006538) |
| 0.5 | 3.6 | GO:1904276 | regulation of wax biosynthetic process(GO:1904276) positive regulation of wax biosynthetic process(GO:1904278) |
| 0.5 | 5.9 | GO:0016559 | peroxisome fission(GO:0016559) |
| 0.5 | 5.1 | GO:0010206 | photosystem II repair(GO:0010206) |
| 0.5 | 1.4 | GO:0042891 | tetracycline transport(GO:0015904) antibiotic transport(GO:0042891) |
| 0.5 | 3.6 | GO:0034471 | rRNA 5'-end processing(GO:0000967) ncRNA 5'-end processing(GO:0034471) |
| 0.4 | 1.3 | GO:2000039 | regulation of trichome morphogenesis(GO:2000039) |
| 0.4 | 2.2 | GO:0097036 | regulation of plasma membrane sterol distribution(GO:0097036) |
| 0.4 | 3.9 | GO:0042659 | regulation of cell fate specification(GO:0042659) |
| 0.4 | 8.3 | GO:0009773 | photosynthetic electron transport in photosystem I(GO:0009773) |
| 0.4 | 2.0 | GO:0030322 | stabilization of membrane potential(GO:0030322) |
| 0.4 | 3.9 | GO:0043155 | photoinhibition(GO:0010205) negative regulation of photosynthesis, light reaction(GO:0043155) |
| 0.4 | 3.7 | GO:0009635 | response to herbicide(GO:0009635) |
| 0.4 | 1.1 | GO:0071281 | cellular response to iron ion(GO:0071281) |
| 0.4 | 2.5 | GO:0080143 | amine transport(GO:0015837) regulation of organic acid transport(GO:0032890) regulation of amine transport(GO:0051952) regulation of amino acid transport(GO:0051955) regulation of amino acid export(GO:0080143) |
| 0.3 | 2.4 | GO:1902584 | positive regulation of response to water deprivation(GO:1902584) |
| 0.3 | 1.3 | GO:0019388 | galactose catabolic process(GO:0019388) galactose catabolic process via UDP-galactose(GO:0033499) |
| 0.3 | 1.3 | GO:0002164 | nematode larval development(GO:0002119) larval development(GO:0002164) regulation of nematode larval development(GO:0061062) |
| 0.3 | 4.1 | GO:0052324 | plant-type cell wall cellulose biosynthetic process(GO:0052324) |
| 0.3 | 7.8 | GO:0010025 | wax biosynthetic process(GO:0010025) |
| 0.3 | 7.9 | GO:0009645 | response to low light intensity stimulus(GO:0009645) |
| 0.3 | 4.2 | GO:0010274 | hydrotropism(GO:0010274) |
| 0.3 | 1.5 | GO:0007266 | Rho protein signal transduction(GO:0007266) |
| 0.3 | 1.7 | GO:0070212 | protein ADP-ribosylation(GO:0006471) protein poly-ADP-ribosylation(GO:0070212) |
| 0.3 | 2.8 | GO:0010199 | organ boundary specification between lateral organs and the meristem(GO:0010199) |
| 0.3 | 7.1 | GO:0006783 | heme biosynthetic process(GO:0006783) |
| 0.3 | 1.1 | GO:0080168 | abscisic acid transport(GO:0080168) |
| 0.3 | 12.4 | GO:0045489 | pectin biosynthetic process(GO:0045489) |
| 0.3 | 8.0 | GO:0006284 | base-excision repair(GO:0006284) |
| 0.2 | 2.7 | GO:0010047 | fruit dehiscence(GO:0010047) |
| 0.2 | 2.6 | GO:0032922 | circadian regulation of gene expression(GO:0032922) |
| 0.2 | 20.2 | GO:0045490 | pectin catabolic process(GO:0045490) |
| 0.2 | 2.4 | GO:0045962 | positive regulation of development, heterochronic(GO:0045962) |
| 0.2 | 0.9 | GO:0090309 | regulation of methylation-dependent chromatin silencing(GO:0090308) positive regulation of methylation-dependent chromatin silencing(GO:0090309) |
| 0.2 | 17.5 | GO:0009834 | plant-type secondary cell wall biogenesis(GO:0009834) |
| 0.2 | 1.1 | GO:0042218 | 1-aminocyclopropane-1-carboxylate biosynthetic process(GO:0042218) |
| 0.2 | 7.1 | GO:0009833 | plant-type primary cell wall biogenesis(GO:0009833) |
| 0.2 | 1.3 | GO:0000710 | meiotic mismatch repair(GO:0000710) |
| 0.2 | 4.0 | GO:0050779 | RNA destabilization(GO:0050779) mRNA destabilization(GO:0061157) |
| 0.2 | 1.5 | GO:0046621 | negative regulation of organ growth(GO:0046621) |
| 0.2 | 4.3 | GO:0045493 | xylan catabolic process(GO:0045493) |
| 0.2 | 1.9 | GO:1902025 | nitrate import(GO:1902025) |
| 0.2 | 6.7 | GO:0050826 | response to freezing(GO:0050826) |
| 0.2 | 1.4 | GO:0016120 | carotene biosynthetic process(GO:0016120) |
| 0.2 | 1.4 | GO:0071588 | hydrogen peroxide mediated signaling pathway(GO:0071588) |
| 0.2 | 1.8 | GO:0090506 | axillary shoot meristem initiation(GO:0090506) |
| 0.2 | 1.6 | GO:0006048 | UDP-N-acetylglucosamine biosynthetic process(GO:0006048) |
| 0.2 | 5.5 | GO:0006515 | misfolded or incompletely synthesized protein catabolic process(GO:0006515) |
| 0.2 | 1.4 | GO:0032456 | endocytic recycling(GO:0032456) |
| 0.2 | 2.5 | GO:0051762 | sesquiterpene biosynthetic process(GO:0051762) |
| 0.2 | 10.4 | GO:0010101 | post-embryonic root morphogenesis(GO:0010101) lateral root morphogenesis(GO:0010102) |
| 0.2 | 1.5 | GO:0043410 | positive regulation of MAPK cascade(GO:0043410) |
| 0.2 | 0.5 | GO:0080051 | cutin transport(GO:0080051) |
| 0.2 | 3.2 | GO:0001678 | cellular glucose homeostasis(GO:0001678) |
| 0.2 | 0.8 | GO:0002679 | respiratory burst involved in defense response(GO:0002679) respiratory burst(GO:0045730) |
| 0.2 | 4.5 | GO:0032509 | endosome transport via multivesicular body sorting pathway(GO:0032509) |
| 0.2 | 14.2 | GO:0009741 | response to brassinosteroid(GO:0009741) |
| 0.1 | 0.6 | GO:0051289 | protein homotetramerization(GO:0051289) |
| 0.1 | 1.0 | GO:0010018 | far-red light signaling pathway(GO:0010018) |
| 0.1 | 4.0 | GO:0010214 | seed coat development(GO:0010214) |
| 0.1 | 0.9 | GO:0048446 | petal morphogenesis(GO:0048446) |
| 0.1 | 1.4 | GO:0006607 | NLS-bearing protein import into nucleus(GO:0006607) |
| 0.1 | 3.5 | GO:1901068 | guanosine-containing compound metabolic process(GO:1901068) |
| 0.1 | 2.4 | GO:0006074 | (1->3)-beta-D-glucan metabolic process(GO:0006074) (1->3)-beta-D-glucan biosynthetic process(GO:0006075) |
| 0.1 | 0.1 | GO:0010500 | transmitting tissue development(GO:0010500) |
| 0.1 | 2.5 | GO:2000034 | regulation of seed maturation(GO:2000034) |
| 0.1 | 0.9 | GO:0010438 | cellular response to sulfur starvation(GO:0010438) |
| 0.1 | 14.4 | GO:0080167 | response to karrikin(GO:0080167) |
| 0.1 | 2.5 | GO:0006144 | purine nucleobase metabolic process(GO:0006144) |
| 0.1 | 2.9 | GO:0042546 | cell wall biogenesis(GO:0042546) |
| 0.1 | 2.1 | GO:0006814 | sodium ion transport(GO:0006814) |
| 0.1 | 0.7 | GO:0009786 | regulation of asymmetric cell division(GO:0009786) |
| 0.1 | 0.3 | GO:0006432 | phenylalanyl-tRNA aminoacylation(GO:0006432) |
| 0.1 | 5.7 | GO:0048825 | cotyledon development(GO:0048825) |
| 0.1 | 2.1 | GO:0006378 | mRNA polyadenylation(GO:0006378) |
| 0.1 | 0.9 | GO:0006120 | mitochondrial electron transport, NADH to ubiquinone(GO:0006120) |
| 0.1 | 2.9 | GO:0010182 | carbohydrate mediated signaling(GO:0009756) sugar mediated signaling pathway(GO:0010182) |
| 0.1 | 5.0 | GO:0006101 | tricarboxylic acid cycle(GO:0006099) citrate metabolic process(GO:0006101) |
| 0.1 | 4.2 | GO:0019759 | S-glycoside catabolic process(GO:0016145) glycosinolate catabolic process(GO:0019759) glucosinolate catabolic process(GO:0019762) |
| 0.1 | 9.3 | GO:0000160 | phosphorelay signal transduction system(GO:0000160) |
| 0.1 | 1.5 | GO:0009638 | phototropism(GO:0009638) |
| 0.1 | 2.5 | GO:0099518 | vesicle transport along actin filament(GO:0030050) vesicle cytoskeletal trafficking(GO:0099518) |
| 0.1 | 3.0 | GO:0000741 | karyogamy(GO:0000741) polar nucleus fusion(GO:0010197) |
| 0.1 | 0.7 | GO:2000071 | regulation of defense response by callose deposition(GO:2000071) |
| 0.1 | 1.2 | GO:0052018 | virus induced gene silencing(GO:0009616) modulation by symbiont of RNA levels in host(GO:0052018) modulation of RNA levels in other organism involved in symbiotic interaction(GO:0052249) |
| 0.1 | 5.4 | GO:0010119 | regulation of stomatal movement(GO:0010119) |
| 0.1 | 1.5 | GO:0019852 | L-ascorbic acid metabolic process(GO:0019852) L-ascorbic acid biosynthetic process(GO:0019853) |
| 0.1 | 1.6 | GO:0048768 | root hair cell tip growth(GO:0048768) |
| 0.1 | 2.3 | GO:0010218 | response to far red light(GO:0010218) |
| 0.1 | 1.7 | GO:0046856 | phosphatidylinositol dephosphorylation(GO:0046856) |
| 0.1 | 4.5 | GO:0009627 | systemic acquired resistance(GO:0009627) |
| 0.1 | 6.2 | GO:0006633 | fatty acid biosynthetic process(GO:0006633) |
| 0.1 | 0.7 | GO:0008216 | spermidine metabolic process(GO:0008216) |
| 0.1 | 3.7 | GO:0006612 | protein targeting to membrane(GO:0006612) |
| 0.1 | 3.6 | GO:0008283 | cell proliferation(GO:0008283) |
| 0.1 | 1.2 | GO:0051782 | negative regulation of cell division(GO:0051782) |
| 0.1 | 0.6 | GO:0010165 | female meiotic division(GO:0007143) response to X-ray(GO:0010165) |
| 0.0 | 1.7 | GO:0009911 | positive regulation of flower development(GO:0009911) |
| 0.0 | 1.1 | GO:0009828 | plant-type cell wall loosening(GO:0009828) |
| 0.0 | 1.3 | GO:0009736 | cytokinin-activated signaling pathway(GO:0009736) |
| 0.0 | 1.2 | GO:0000028 | ribosomal small subunit assembly(GO:0000028) |
| 0.0 | 1.0 | GO:0010091 | trichome branching(GO:0010091) |
| 0.0 | 2.7 | GO:0007018 | microtubule-based movement(GO:0007018) |
| 0.0 | 2.3 | GO:0000911 | cytokinesis by cell plate formation(GO:0000911) |
| 0.0 | 0.7 | GO:0009934 | regulation of meristem structural organization(GO:0009934) |
| 0.0 | 0.4 | GO:0010106 | cellular response to iron ion starvation(GO:0010106) |
| 0.0 | 0.5 | GO:0006002 | fructose 6-phosphate metabolic process(GO:0006002) |
| 0.0 | 0.3 | GO:0009942 | embryonic axis specification(GO:0000578) longitudinal axis specification(GO:0009942) |
| 0.0 | 0.6 | GO:0006935 | chemotaxis(GO:0006935) pollen tube guidance(GO:0010183) taxis(GO:0042330) positive chemotaxis(GO:0050918) |
| 0.0 | 1.1 | GO:0009817 | defense response to fungus, incompatible interaction(GO:0009817) |
| 0.0 | 0.7 | GO:0046854 | lipid phosphorylation(GO:0046834) phosphatidylinositol phosphorylation(GO:0046854) |
| 0.0 | 0.3 | GO:0031936 | negative regulation of chromatin silencing(GO:0031936) |
| 0.0 | 3.6 | GO:0009860 | pollen tube growth(GO:0009860) |
| 0.0 | 0.9 | GO:0006730 | one-carbon metabolic process(GO:0006730) |
| 0.0 | 0.5 | GO:0032968 | positive regulation of transcription elongation from RNA polymerase II promoter(GO:0032968) |
| 0.0 | 0.2 | GO:0009299 | mRNA transcription(GO:0009299) |
| 0.0 | 1.4 | GO:0016579 | protein deubiquitination(GO:0016579) |
| 0.0 | 1.0 | GO:0009723 | response to ethylene(GO:0009723) |
| 0.0 | 1.9 | GO:0009909 | regulation of flower development(GO:0009909) |
| 0.0 | 0.6 | GO:0006487 | protein N-linked glycosylation(GO:0006487) |
| 0.0 | 1.2 | GO:0045454 | cell redox homeostasis(GO:0045454) |
| 0.0 | 0.2 | GO:0010449 | root meristem growth(GO:0010449) |
| 0.0 | 0.2 | GO:0009226 | nucleotide-sugar metabolic process(GO:0009225) nucleotide-sugar biosynthetic process(GO:0009226) |
| 0.0 | 0.2 | GO:0000387 | spliceosomal snRNP assembly(GO:0000387) |
| 0.0 | 0.5 | GO:0006887 | exocytosis(GO:0006887) |
| 0.0 | 1.8 | GO:0009658 | chloroplast organization(GO:0009658) |
| 0.0 | 7.3 | GO:0005975 | carbohydrate metabolic process(GO:0005975) |
Gene overrepresentation in cellular component category:
| Log-likelihood per target | Total log-likelihood | Term | Description |
|---|---|---|---|
| 2.8 | 8.3 | GO:0030093 | chloroplast photosystem I(GO:0030093) |
| 2.1 | 6.4 | GO:0043668 | lateral plasma membrane(GO:0016328) pollen wall(GO:0043667) exine(GO:0043668) sexine(GO:0043673) columella(GO:0043674) |
| 1.1 | 8.9 | GO:0009533 | chloroplast stromal thylakoid(GO:0009533) |
| 0.8 | 4.1 | GO:0009897 | external side of plasma membrane(GO:0009897) |
| 0.6 | 10.7 | GO:0009531 | secondary cell wall(GO:0009531) |
| 0.5 | 3.4 | GO:0005854 | nascent polypeptide-associated complex(GO:0005854) |
| 0.4 | 5.8 | GO:0009522 | photosystem I(GO:0009522) |
| 0.4 | 1.2 | GO:0045495 | P granule(GO:0043186) pole plasm(GO:0045495) germ plasm(GO:0060293) |
| 0.4 | 9.1 | GO:0009574 | preprophase band(GO:0009574) |
| 0.3 | 4.5 | GO:0000815 | ESCRT III complex(GO:0000815) |
| 0.3 | 2.2 | GO:0032541 | cortical endoplasmic reticulum(GO:0032541) |
| 0.3 | 1.4 | GO:0000938 | GARP complex(GO:0000938) |
| 0.3 | 1.5 | GO:0044545 | NSL complex(GO:0044545) |
| 0.2 | 35.5 | GO:0099503 | secretory vesicle(GO:0099503) |
| 0.2 | 1.6 | GO:0035619 | root hair tip(GO:0035619) |
| 0.2 | 2.6 | GO:0005880 | nuclear microtubule(GO:0005880) |
| 0.2 | 1.0 | GO:0009360 | DNA polymerase III complex(GO:0009360) |
| 0.2 | 26.9 | GO:0009505 | plant-type cell wall(GO:0009505) |
| 0.2 | 3.5 | GO:0005736 | DNA-directed RNA polymerase I complex(GO:0005736) |
| 0.1 | 2.5 | GO:0016459 | myosin complex(GO:0016459) |
| 0.1 | 3.2 | GO:0031306 | intrinsic component of mitochondrial outer membrane(GO:0031306) integral component of mitochondrial outer membrane(GO:0031307) |
| 0.1 | 2.4 | GO:0000148 | 1,3-beta-D-glucan synthase complex(GO:0000148) |
| 0.1 | 0.8 | GO:0043073 | germ cell nucleus(GO:0043073) |
| 0.1 | 2.7 | GO:0005871 | kinesin complex(GO:0005871) |
| 0.1 | 5.1 | GO:0005811 | lipid particle(GO:0005811) |
| 0.1 | 5.3 | GO:0009707 | chloroplast outer membrane(GO:0009707) |
| 0.1 | 2.6 | GO:0071004 | U2-type prespliceosome(GO:0071004) prespliceosome(GO:0071010) |
| 0.1 | 20.4 | GO:0031225 | anchored component of membrane(GO:0031225) |
| 0.1 | 3.2 | GO:0031978 | chloroplast thylakoid lumen(GO:0009543) plastid thylakoid lumen(GO:0031978) |
| 0.1 | 0.9 | GO:0005720 | nuclear heterochromatin(GO:0005720) |
| 0.1 | 20.0 | GO:0030312 | cell wall(GO:0005618) external encapsulating structure(GO:0030312) |
| 0.1 | 2.4 | GO:1902554 | serine/threonine protein kinase complex(GO:1902554) |
| 0.1 | 1.2 | GO:0033178 | proton-transporting two-sector ATPase complex, catalytic domain(GO:0033178) |
| 0.1 | 18.1 | GO:0009534 | chloroplast thylakoid(GO:0009534) |
| 0.0 | 1.8 | GO:0000137 | Golgi cis cisterna(GO:0000137) |
| 0.0 | 2.6 | GO:0016607 | nuclear speck(GO:0016607) |
| 0.0 | 0.4 | GO:0005786 | signal recognition particle, endoplasmic reticulum targeting(GO:0005786) |
| 0.0 | 2.0 | GO:0009705 | plant-type vacuole membrane(GO:0009705) |
| 0.0 | 0.3 | GO:0000786 | nucleosome(GO:0000786) |
| 0.0 | 1.8 | GO:0080008 | Cul4-RING E3 ubiquitin ligase complex(GO:0080008) |
| 0.0 | 5.4 | GO:0009941 | chloroplast envelope(GO:0009941) |
| 0.0 | 0.5 | GO:0000145 | exocyst(GO:0000145) |
| 0.0 | 0.4 | GO:0005741 | mitochondrial outer membrane(GO:0005741) |
| 0.0 | 52.7 | GO:0009507 | chloroplast(GO:0009507) |
| 0.0 | 24.7 | GO:0005576 | extracellular region(GO:0005576) |
Gene overrepresentation in molecular function category:
| Log-likelihood per target | Total log-likelihood | Term | Description |
|---|---|---|---|
| 2.0 | 8.2 | GO:0004349 | glutamate 5-kinase activity(GO:0004349) glutamate-5-semialdehyde dehydrogenase activity(GO:0004350) |
| 2.0 | 8.0 | GO:0009784 | transmembrane receptor histidine kinase activity(GO:0009784) transmembrane histidine kinase cytokinin receptor activity(GO:0009885) |
| 1.3 | 10.8 | GO:0010328 | auxin influx transmembrane transporter activity(GO:0010328) |
| 1.3 | 6.4 | GO:0046715 | borate transmembrane transporter activity(GO:0046715) borate efflux transmembrane transporter activity(GO:0080139) |
| 1.2 | 6.1 | GO:0031957 | very long-chain fatty acid-CoA ligase activity(GO:0031957) |
| 1.2 | 4.7 | GO:0030410 | nicotianamine synthase activity(GO:0030410) |
| 1.1 | 3.2 | GO:0044540 | L-cystine L-cysteine-lyase (deaminating)(GO:0044540) |
| 1.0 | 5.0 | GO:0008964 | phosphoenolpyruvate carboxylase activity(GO:0008964) |
| 0.9 | 10.2 | GO:0008199 | ferric iron binding(GO:0008199) |
| 0.8 | 8.3 | GO:0004351 | glutamate decarboxylase activity(GO:0004351) |
| 0.8 | 6.6 | GO:0042299 | lupeol synthase activity(GO:0042299) |
| 0.8 | 2.5 | GO:0016726 | oxidoreductase activity, acting on CH or CH2 groups, NAD or NADP as acceptor(GO:0016726) |
| 0.8 | 20.2 | GO:0016837 | carbon-oxygen lyase activity, acting on polysaccharides(GO:0016837) pectate lyase activity(GO:0030570) |
| 0.8 | 3.1 | GO:0004075 | biotin carboxylase activity(GO:0004075) |
| 0.7 | 8.0 | GO:0043733 | alkylbase DNA N-glycosylase activity(GO:0003905) DNA-3-methyladenine glycosylase activity(GO:0008725) DNA-3-methylbase glycosylase activity(GO:0043733) |
| 0.7 | 2.1 | GO:0001216 | bacterial-type RNA polymerase transcription factor activity, sequence-specific DNA binding(GO:0001130) bacterial-type RNA polymerase transcriptional activator activity, sequence-specific DNA binding(GO:0001216) |
| 0.7 | 3.5 | GO:0046577 | long-chain-alcohol oxidase activity(GO:0046577) |
| 0.7 | 4.0 | GO:0018708 | thiol S-methyltransferase activity(GO:0018708) |
| 0.7 | 16.6 | GO:0004565 | beta-galactosidase activity(GO:0004565) |
| 0.7 | 2.7 | GO:0070818 | oxygen-dependent protoporphyrinogen oxidase activity(GO:0004729) protoporphyrinogen oxidase activity(GO:0070818) |
| 0.6 | 3.0 | GO:0034432 | bis(5'-adenosyl)-pentaphosphatase activity(GO:0034432) |
| 0.6 | 4.1 | GO:0016681 | ubiquinol-cytochrome-c reductase activity(GO:0008121) oxidoreductase activity, acting on diphenols and related substances as donors, cytochrome as acceptor(GO:0016681) |
| 0.6 | 1.7 | GO:1990404 | protein ADP-ribosylase activity(GO:1990404) |
| 0.5 | 4.8 | GO:0016423 | tRNA (guanine) methyltransferase activity(GO:0016423) |
| 0.5 | 1.5 | GO:0005094 | Rho GDP-dissociation inhibitor activity(GO:0005094) |
| 0.5 | 1.5 | GO:0052635 | C-20 gibberellin 2-beta-dioxygenase activity(GO:0052635) |
| 0.5 | 6.8 | GO:0008889 | glycerophosphodiester phosphodiesterase activity(GO:0008889) |
| 0.4 | 1.3 | GO:0004034 | aldose 1-epimerase activity(GO:0004034) |
| 0.4 | 2.5 | GO:0003913 | DNA photolyase activity(GO:0003913) |
| 0.4 | 2.0 | GO:0022840 | leak channel activity(GO:0022840) potassium ion leak channel activity(GO:0022841) narrow pore channel activity(GO:0022842) |
| 0.4 | 3.2 | GO:0019158 | glucose binding(GO:0005536) mannokinase activity(GO:0019158) |
| 0.4 | 1.5 | GO:0002151 | G-quadruplex RNA binding(GO:0002151) |
| 0.4 | 7.5 | GO:0035250 | UDP-galactosyltransferase activity(GO:0035250) |
| 0.4 | 3.3 | GO:0004526 | ribonuclease P activity(GO:0004526) |
| 0.4 | 1.8 | GO:0010313 | phytochrome binding(GO:0010313) |
| 0.4 | 4.3 | GO:0031176 | endo-1,4-beta-xylanase activity(GO:0031176) |
| 0.3 | 2.1 | GO:0004652 | polynucleotide adenylyltransferase activity(GO:0004652) |
| 0.3 | 1.4 | GO:0008493 | tetracycline transporter activity(GO:0008493) toxin transporter activity(GO:0019534) antibiotic transporter activity(GO:0042895) |
| 0.3 | 1.4 | GO:0047215 | indole-3-acetate beta-glucosyltransferase activity(GO:0047215) |
| 0.3 | 1.3 | GO:0050291 | sphingosine N-acyltransferase activity(GO:0050291) |
| 0.3 | 2.6 | GO:0033946 | xyloglucan-specific endo-beta-1,4-glucanase activity(GO:0033946) |
| 0.3 | 15.3 | GO:0016759 | cellulose synthase activity(GO:0016759) |
| 0.3 | 1.6 | GO:0003977 | UDP-N-acetylglucosamine diphosphorylase activity(GO:0003977) |
| 0.3 | 1.3 | GO:0047259 | glucomannan 4-beta-mannosyltransferase activity(GO:0047259) |
| 0.3 | 2.1 | GO:0102391 | decanoate--CoA ligase activity(GO:0102391) |
| 0.3 | 20.0 | GO:0004650 | polygalacturonase activity(GO:0004650) |
| 0.3 | 3.5 | GO:0000774 | adenyl-nucleotide exchange factor activity(GO:0000774) |
| 0.3 | 14.1 | GO:0016413 | O-acetyltransferase activity(GO:0016413) |
| 0.3 | 5.5 | GO:0005089 | Rho guanyl-nucleotide exchange factor activity(GO:0005089) |
| 0.3 | 3.6 | GO:0052747 | sinapyl alcohol dehydrogenase activity(GO:0052747) |
| 0.2 | 1.5 | GO:0050105 | L-gulonolactone oxidase activity(GO:0050105) |
| 0.2 | 2.7 | GO:0008574 | ATP-dependent microtubule motor activity, plus-end-directed(GO:0008574) |
| 0.2 | 4.4 | GO:0015386 | potassium:proton antiporter activity(GO:0015386) |
| 0.2 | 6.8 | GO:0047262 | polygalacturonate 4-alpha-galacturonosyltransferase activity(GO:0047262) |
| 0.2 | 10.3 | GO:0003993 | acid phosphatase activity(GO:0003993) |
| 0.2 | 5.8 | GO:0016168 | chlorophyll binding(GO:0016168) |
| 0.2 | 2.0 | GO:0004312 | fatty acid synthase activity(GO:0004312) |
| 0.2 | 1.8 | GO:0010428 | methyl-CpNpG binding(GO:0010428) methyl-CpNpN binding(GO:0010429) |
| 0.2 | 1.3 | GO:0003830 | beta-1,4-mannosylglycoprotein 4-beta-N-acetylglucosaminyltransferase activity(GO:0003830) |
| 0.2 | 2.1 | GO:0047617 | acyl-CoA hydrolase activity(GO:0047617) |
| 0.2 | 4.2 | GO:0102336 | 3-oxo-arachidoyl-CoA synthase activity(GO:0102336) 3-oxo-cerotoyl-CoA synthase activity(GO:0102337) 3-oxo-lignoceronyl-CoA synthase activity(GO:0102338) |
| 0.2 | 0.7 | GO:0004048 | anthranilate phosphoribosyltransferase activity(GO:0004048) |
| 0.2 | 4.5 | GO:0008810 | cellulase activity(GO:0008810) |
| 0.2 | 0.8 | GO:0050664 | NAD(P)H oxidase activity(GO:0016174) oxidoreductase activity, acting on NAD(P)H, oxygen as acceptor(GO:0050664) |
| 0.1 | 0.9 | GO:0010294 | abscisic acid glucosyltransferase activity(GO:0010294) |
| 0.1 | 0.6 | GO:0008253 | 5'-nucleotidase activity(GO:0008253) |
| 0.1 | 1.3 | GO:0043495 | protein anchor(GO:0043495) |
| 0.1 | 1.8 | GO:0032440 | 2-alkenal reductase [NAD(P)] activity(GO:0032440) |
| 0.1 | 0.7 | GO:0003785 | actin monomer binding(GO:0003785) |
| 0.1 | 0.5 | GO:0016707 | gibberellin 3-beta-dioxygenase activity(GO:0016707) |
| 0.1 | 2.4 | GO:0003843 | 1,3-beta-D-glucan synthase activity(GO:0003843) |
| 0.1 | 7.0 | GO:0031625 | ubiquitin protein ligase binding(GO:0031625) |
| 0.1 | 4.8 | GO:0004707 | MAP kinase activity(GO:0004707) |
| 0.1 | 16.6 | GO:0008017 | microtubule binding(GO:0008017) |
| 0.1 | 2.0 | GO:0004176 | ATP-dependent peptidase activity(GO:0004176) |
| 0.1 | 1.5 | GO:0004709 | MAP kinase kinase kinase activity(GO:0004709) |
| 0.1 | 1.7 | GO:0080019 | fatty-acyl-CoA reductase (alcohol-forming) activity(GO:0080019) |
| 0.1 | 0.3 | GO:0004826 | phenylalanine-tRNA ligase activity(GO:0004826) |
| 0.1 | 1.1 | GO:0016847 | 1-aminocyclopropane-1-carboxylate synthase activity(GO:0016847) |
| 0.1 | 4.1 | GO:0000156 | phosphorelay response regulator activity(GO:0000156) |
| 0.1 | 1.7 | GO:0034485 | phosphatidylinositol-3,4,5-trisphosphate 5-phosphatase activity(GO:0034485) |
| 0.1 | 10.9 | GO:0004252 | serine-type endopeptidase activity(GO:0004252) |
| 0.1 | 1.3 | GO:0019210 | kinase inhibitor activity(GO:0019210) |
| 0.1 | 0.3 | GO:0047209 | coniferyl-alcohol glucosyltransferase activity(GO:0047209) |
| 0.1 | 2.5 | GO:0030898 | microfilament motor activity(GO:0000146) actin-dependent ATPase activity(GO:0030898) |
| 0.1 | 1.4 | GO:0019905 | syntaxin binding(GO:0019905) |
| 0.1 | 10.9 | GO:0009055 | electron carrier activity(GO:0009055) |
| 0.1 | 2.5 | GO:0009975 | cyclase activity(GO:0009975) |
| 0.1 | 1.3 | GO:0030983 | mismatched DNA binding(GO:0030983) |
| 0.1 | 1.0 | GO:0003689 | DNA clamp loader activity(GO:0003689) protein-DNA loading ATPase activity(GO:0033170) |
| 0.1 | 0.4 | GO:0030942 | endoplasmic reticulum signal peptide binding(GO:0030942) |
| 0.1 | 0.5 | GO:0003872 | 6-phosphofructokinase activity(GO:0003872) |
| 0.1 | 3.5 | GO:0003899 | DNA-directed RNA polymerase activity(GO:0003899) |
| 0.1 | 0.8 | GO:0103075 | indole-3-pyruvate monooxygenase activity(GO:0103075) |
| 0.1 | 1.9 | GO:0004222 | metalloendopeptidase activity(GO:0004222) |
| 0.1 | 0.9 | GO:0004144 | diacylglycerol O-acyltransferase activity(GO:0004144) |
| 0.1 | 3.7 | GO:0004364 | glutathione transferase activity(GO:0004364) |
| 0.1 | 4.0 | GO:0003727 | single-stranded RNA binding(GO:0003727) |
| 0.1 | 1.2 | GO:0046961 | proton-transporting ATPase activity, rotational mechanism(GO:0046961) |
| 0.1 | 2.1 | GO:0015081 | sodium ion transmembrane transporter activity(GO:0015081) |
| 0.1 | 1.1 | GO:0015562 | efflux transmembrane transporter activity(GO:0015562) |
| 0.1 | 0.5 | GO:0052381 | tRNA dimethylallyltransferase activity(GO:0052381) |
| 0.0 | 0.3 | GO:0001653 | peptide receptor activity(GO:0001653) |
| 0.0 | 0.4 | GO:0004506 | squalene monooxygenase activity(GO:0004506) |
| 0.0 | 1.3 | GO:0051219 | protein phosphorylated amino acid binding(GO:0045309) phosphoprotein binding(GO:0051219) |
| 0.0 | 0.6 | GO:0004499 | N,N-dimethylaniline monooxygenase activity(GO:0004499) |
| 0.0 | 1.5 | GO:0050135 | NAD(P)+ nucleosidase activity(GO:0050135) |
| 0.0 | 0.3 | GO:0031492 | nucleosomal DNA binding(GO:0031492) |
| 0.0 | 0.9 | GO:0005388 | calcium-transporting ATPase activity(GO:0005388) |
| 0.0 | 0.7 | GO:0005372 | water transmembrane transporter activity(GO:0005372) water channel activity(GO:0015250) |
| 0.0 | 2.2 | GO:0019901 | protein kinase binding(GO:0019901) |
| 0.0 | 4.6 | GO:0043531 | ADP binding(GO:0043531) |
| 0.0 | 4.9 | GO:0042803 | protein homodimerization activity(GO:0042803) |
| 0.0 | 1.4 | GO:0016859 | cis-trans isomerase activity(GO:0016859) |
| 0.0 | 0.6 | GO:0004497 | monooxygenase activity(GO:0004497) |
| 0.0 | 0.4 | GO:0008308 | voltage-gated anion channel activity(GO:0008308) |
| 0.0 | 3.0 | GO:0042802 | identical protein binding(GO:0042802) |
| 0.0 | 1.4 | GO:0101005 | ubiquitinyl hydrolase activity(GO:0101005) |
| 0.0 | 3.7 | GO:0016747 | transferase activity, transferring acyl groups other than amino-acyl groups(GO:0016747) |
| 0.0 | 1.2 | GO:0003724 | RNA helicase activity(GO:0003724) |
| 0.0 | 2.5 | GO:0008134 | transcription factor binding(GO:0008134) |
| 0.0 | 3.8 | GO:0005506 | iron ion binding(GO:0005506) |
Gene overrepresentation in curated gene sets: canonical pathways category:
| Log-likelihood per target | Total log-likelihood | Term | Description |
|---|---|---|---|
| 1.4 | 5.4 | PID MYC REPRESS PATHWAY | Validated targets of C-MYC transcriptional repression |
| 0.7 | 2.8 | PID HIF1A PATHWAY | Hypoxic and oxygen homeostasis regulation of HIF-1-alpha |
| 0.6 | 3.5 | PID AP1 PATHWAY | AP-1 transcription factor network |
| 0.6 | 1.7 | SA CASPASE CASCADE | Apoptosis is mediated by caspases, cysteine proteases arranged in a proteolytic cascade. |
| 0.1 | 0.3 | NABA SECRETED FACTORS | Genes encoding secreted soluble factors |
Gene overrepresentation in curated gene sets: REACTOME pathways category:
| Log-likelihood per target | Total log-likelihood | Term | Description |
|---|---|---|---|
| 2.8 | 8.3 | REACTOME GABA SYNTHESIS RELEASE REUPTAKE AND DEGRADATION | Genes involved in GABA synthesis, release, reuptake and degradation |
| 2.4 | 7.2 | REACTOME SIGNALING BY TGF BETA RECEPTOR COMPLEX | Genes involved in Signaling by TGF-beta Receptor Complex |
| 0.9 | 2.8 | REACTOME OXYGEN DEPENDENT PROLINE HYDROXYLATION OF HYPOXIA INDUCIBLE FACTOR ALPHA | Genes involved in Oxygen-dependent Proline Hydroxylation of Hypoxia-inducible Factor Alpha |
| 0.1 | 1.3 | REACTOME MEIOTIC RECOMBINATION | Genes involved in Meiotic Recombination |
| 0.1 | 0.3 | REACTOME INTEGRATION OF ENERGY METABOLISM | Genes involved in Integration of energy metabolism |