Project
GSE43616: Time-course of wild-type Arabidopsis leaf
Navigation
Downloads
Results for AT1G49010
Z-value: 1.44
Transcription factors associated with AT1G49010
| Gene Symbol | Gene ID | Gene Info |
|---|---|---|
|
AT1G49010
|
AT1G49010 | Duplicated homeodomain-like superfamily protein |
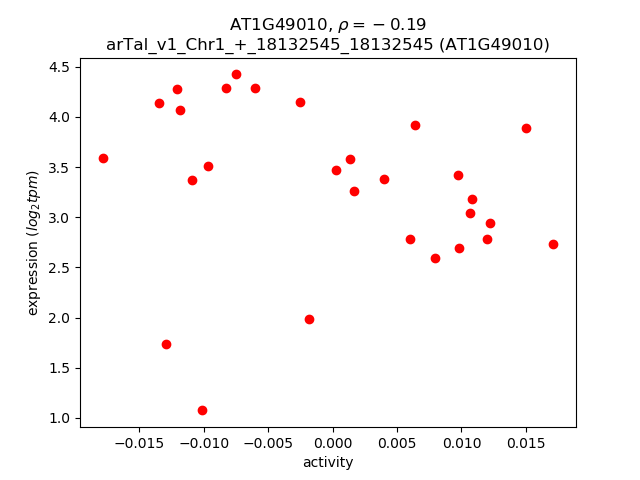
Activity-expression correlation:
| Gene | Promoter | Pearson corr. coef. | P-value | Plot |
|---|---|---|---|---|
| AT1G49010 | arTal_v1_Chr1_+_18132545_18132545 | -0.19 | 3.2e-01 | Click! |
Activity profile of AT1G49010 motif
Sorted Z-values of AT1G49010 motif
| Promoter | Log-likelihood | Transcript | Gene | Gene Info |
|---|---|---|---|---|
| arTal_v1_Chr2_+_7845923_7845999 | 2.95 |
AT2G18050.2
AT2G18050.1 |
HIS1-3
|
histone H1-3 |
| arTal_v1_Chr2_-_6242541_6242541 | 2.77 |
AT2G14610.1
|
PR1
|
pathogenesis-related protein 1 |
| arTal_v1_Chr1_-_5133860_5133860 | 2.64 |
AT1G14880.1
|
PCR1
|
PLANT CADMIUM RESISTANCE 1 |
| arTal_v1_Chr5_-_17909507_17909507 | 2.55 |
AT5G44430.1
|
PDF1.2c
|
plant defensin 1.2C |
| arTal_v1_Chr4_-_9201643_9201643 | 2.53 |
AT4G16260.2
AT4G16260.1 |
AT4G16260
|
Glycosyl hydrolase superfamily protein |
| arTal_v1_Chr1_-_19352791_19352791 | 2.49 |
AT1G52040.1
|
MBP1
|
myrosinase-binding protein 1 |
| arTal_v1_Chr2_-_18077517_18077517 | 2.48 |
AT2G43570.1
|
CHI
|
chitinase |
| arTal_v1_Chr2_+_6213972_6213972 | 2.28 |
AT2G14560.2
AT2G14560.1 |
LURP1
|
LURP-one-like protein (DUF567) |
| arTal_v1_Chr2_+_11089123_11089123 | 2.27 |
AT2G26020.1
|
PDF1.2b
|
plant defensin 1.2b |
| arTal_v1_Chr2_+_6213617_6213676 | 2.22 |
AT2G14560.3
AT2G14560.4 |
LURP1
|
LURP-one-like protein (DUF567) |
| arTal_v1_Chr2_+_1966806_1966816 | 2.21 |
AT2G05380.1
AT2G05380.2 |
GRP3S
|
glycine-rich protein 3 short isoform |
| arTal_v1_Chr4_+_6491017_6491017 | 2.13 |
AT4G10500.1
|
AT4G10500
|
2-oxoglutarate (2OG) and Fe(II)-dependent oxygenase superfamily protein |
| arTal_v1_Chr2_+_1966610_1966610 | 2.02 |
AT2G05380.3
|
GRP3S
|
glycine-rich protein 3 short isoform |
| arTal_v1_Chr1_+_23887809_23887809 | 2.01 |
AT1G64360.1
|
AT1G64360
|
hypothetical protein |
| arTal_v1_Chr5_-_5033540_5033540 | 1.95 |
AT5G15500.2
AT5G15500.1 |
AT5G15500
|
Ankyrin repeat family protein |
| arTal_v1_Chr1_-_3756998_3756998 | 1.92 |
AT1G11210.1
|
AT1G11210
|
cotton fiber protein, putative (DUF761) |
| arTal_v1_Chr2_+_16298110_16298110 | 1.89 |
AT2G39030.1
|
NATA1
|
Acyl-CoA N-acyltransferases (NAT) superfamily protein |
| arTal_v1_Chr1_+_7949476_7949476 | 1.86 |
AT1G22500.1
|
ATL15
|
RING/U-box superfamily protein |
| arTal_v1_Chr3_-_6258426_6258426 | 1.84 |
AT3G18250.1
|
AT3G18250
|
Putative membrane lipoprotein |
| arTal_v1_Chr1_+_25426234_25426234 | 1.84 |
AT1G67810.1
|
SUFE2
|
sulfur E2 |
| arTal_v1_Chr5_+_2938193_2938193 | 1.83 |
AT5G09440.1
|
EXL4
|
EXORDIUM like 4 |
| arTal_v1_Chr1_+_9378404_9378404 | 1.83 |
AT1G27020.1
|
AT1G27020
|
plant/protein |
| arTal_v1_Chr3_-_9595283_9595283 | 1.80 |
AT3G26210.1
|
CYP71B23
|
cytochrome P450, family 71, subfamily B, polypeptide 23 |
| arTal_v1_Chr5_-_15859911_15859911 | 1.80 |
AT5G39610.1
|
NAC6
|
NAC domain containing protein 6 |
| arTal_v1_Chr3_+_5243432_5243432 | 1.79 |
AT3G15510.1
|
NAC2
|
NAC domain containing protein 2 |
| arTal_v1_Chr4_-_7406994_7406994 | 1.78 |
AT4G12480.1
|
EARLI1
|
Bifunctional inhibitor/lipid-transfer protein/seed storage 2S albumin superfamily protein |
| arTal_v1_Chr5_+_7718118_7718118 | 1.76 |
AT5G23020.1
|
IMS2
|
2-isopropylmalate synthase 2 |
| arTal_v1_Chr3_-_4762457_4762457 | 1.73 |
AT3G14280.1
|
AT3G14280
|
LL-diaminopimelate aminotransferase |
| arTal_v1_Chr5_+_4213955_4213955 | 1.72 |
AT5G13210.1
|
AT5G13210
|
Uncharacterized conserved protein UCP015417, vWA |
| arTal_v1_Chr3_+_9887917_9887917 | 1.69 |
AT3G26830.1
|
PAD3
|
Cytochrome P450 superfamily protein |
| arTal_v1_Chr1_+_3288087_3288087 | 1.69 |
AT1G10070.3
AT1G10070.2 AT1G10070.1 |
BCAT-2
|
branched-chain amino acid transaminase 2 |
| arTal_v1_Chr5_-_17005510_17005510 | 1.69 |
AT5G42530.1
|
AT5G42530
|
hypothetical protein |
| arTal_v1_Chr5_+_7138762_7138762 | 1.68 |
AT5G21020.2
|
AT5G21020
|
transmembrane protein |
| arTal_v1_Chr1_+_11310997_11310997 | 1.66 |
AT1G31580.1
|
ECS1
|
ECS1 |
| arTal_v1_Chr1_+_20876440_20876440 | 1.64 |
AT1G55850.1
|
CSLE1
|
cellulose synthase like E1 |
| arTal_v1_Chr1_+_8168443_8168443 | 1.63 |
AT1G23050.1
|
AT1G23050
|
hydroxyproline-rich glycoprotein family protein |
| arTal_v1_Chr1_+_26651840_26651840 | 1.62 |
AT1G70690.1
|
HWI1
|
Receptor-like protein kinase-related family protein |
| arTal_v1_Chr5_-_2652535_2652535 | 1.62 |
AT5G08240.1
|
AT5G08240
|
transmembrane protein |
| arTal_v1_Chr3_-_2849686_2849686 | 1.62 |
AT3G09270.1
|
GSTU8
|
glutathione S-transferase TAU 8 |
| arTal_v1_Chr1_-_467873_467880 | 1.62 |
AT1G02340.2
AT1G02340.1 |
HFR1
|
basic helix-loop-helix (bHLH) DNA-binding superfamily protein |
| arTal_v1_Chr2_-_11233295_11233388 | 1.60 |
AT2G26400.1
AT2G26400.4 AT2G26400.2 AT2G26400.3 |
ARD3
|
acireductone dioxygenase 3 |
| arTal_v1_Chr3_-_7676519_7676519 | 1.60 |
AT3G21780.1
|
UGT71B6
|
UDP-glucosyl transferase 71B6 |
| arTal_v1_Chr2_+_14783254_14783254 | 1.59 |
AT2G35070.1
AT2G35070.2 |
AT2G35070
|
transmembrane protein |
| arTal_v1_Chr4_-_13672413_13672413 | 1.59 |
AT4G27300.1
|
AT4G27300
|
S-locus lectin protein kinase family protein |
| arTal_v1_Chr3_-_16923299_16923299 | 1.59 |
AT3G46080.1
|
AT3G46080
|
C2H2-type zinc finger family protein |
| arTal_v1_Chr1_+_6927736_6927736 | 1.58 |
AT1G19960.1
|
AT1G19960
|
transcription factor |
| arTal_v1_Chr3_-_327412_327412 | 1.58 |
AT3G01970.1
|
WRKY45
|
WRKY DNA-binding protein 45 |
| arTal_v1_Chr1_-_30142697_30142697 | 1.57 |
AT1G80130.1
|
AT1G80130
|
Tetratricopeptide repeat (TPR)-like superfamily protein |
| arTal_v1_Chr5_-_22186633_22186633 | 1.56 |
AT5G54610.1
|
ANK
|
ankyrin |
| arTal_v1_Chr2_+_18066960_18066960 | 1.56 |
AT2G43510.1
|
TI1
|
trypsin inhibitor protein 1 |
| arTal_v1_Chr3_-_9597927_9597927 | 1.56 |
AT3G26220.1
|
CYP71B3
|
cytochrome P450, family 71, subfamily B, polypeptide 3 |
| arTal_v1_Chr2_-_852321_852321 | 1.56 |
AT2G02930.1
|
GSTF3
|
glutathione S-transferase F3 |
| arTal_v1_Chr4_+_8294446_8294452 | 1.54 |
AT4G14400.2
AT4G14400.3 |
ACD6
|
ankyrin repeat family protein |
| arTal_v1_Chr1_+_2984829_2984829 | 1.54 |
AT1G09240.1
|
NAS3
|
nicotianamine synthase 3 |
| arTal_v1_Chr4_-_1112033_1112033 | 1.54 |
AT4G02520.1
|
GSTF2
|
glutathione S-transferase PHI 2 |
| arTal_v1_Chr1_+_13220471_13220471 | 1.53 |
AT1G35710.1
|
AT1G35710
|
kinase family with leucine-rich repeat domain-containing protein |
| arTal_v1_Chr3_+_4374214_4374214 | 1.52 |
AT3G13433.1
|
AT3G13433
|
transmembrane protein |
| arTal_v1_Chr3_+_18634546_18634546 | 1.52 |
AT3G50260.1
|
CEJ1
|
cooperatively regulated by ethylene and jasmonate 1 |
| arTal_v1_Chr2_-_18646606_18646606 | 1.52 |
AT2G45220.1
|
AT2G45220
|
Plant invertase/pectin methylesterase inhibitor superfamily |
| arTal_v1_Chr3_+_15983199_15983199 | 1.52 |
AT3G44300.1
|
NIT2
|
nitrilase 2 |
| arTal_v1_Chr4_-_14393381_14393381 | 1.52 |
AT4G29190.1
|
OZF2
|
Zinc finger C-x8-C-x5-C-x3-H type family protein |
| arTal_v1_Chr4_-_17289728_17289728 | 1.51 |
AT4G36670.1
|
PMT6
|
Major facilitator superfamily protein |
| arTal_v1_Chr1_-_24433165_24433165 | 1.49 |
AT1G65690.1
|
AT1G65690
|
Late embryogenesis abundant (LEA) hydroxyproline-rich glycoprotein family |
| arTal_v1_Chr3_-_10790553_10790553 | 1.49 |
AT3G28740.1
|
CYP81D11
|
Cytochrome P450 superfamily protein |
| arTal_v1_Chr1_+_25473544_25473544 | 1.49 |
AT1G67920.1
|
AT1G67920
|
hypothetical protein |
| arTal_v1_Chr3_-_20769324_20769410 | 1.49 |
AT3G55970.2
AT3G55970.1 |
JRG21
|
jasmonate-regulated gene 21 |
| arTal_v1_Chr1_-_27171410_27171410 | 1.48 |
AT1G72200.1
|
AT1G72200
|
RING/U-box superfamily protein |
| arTal_v1_Chr3_+_10694444_10694444 | 1.47 |
AT3G28540.2
|
AT3G28540
|
P-loop containing nucleoside triphosphate hydrolases superfamily protein |
| arTal_v1_Chr4_+_12314025_12314025 | 1.47 |
AT4G23610.1
|
AT4G23610
|
Late embryogenesis abundant (LEA) hydroxyproline-rich glycoprotein family |
| arTal_v1_Chr2_+_11087280_11087280 | 1.47 |
AT2G26010.1
|
PDF1.3
|
plant defensin 1.3 |
| arTal_v1_Chr3_+_6089381_6089381 | 1.47 |
AT3G17790.1
|
PAP17
|
purple acid phosphatase 17 |
| arTal_v1_Chr4_+_8908763_8908879 | 1.47 |
AT4G15610.1
AT4G15610.2 |
AT4G15610
|
Uncharacterized protein family (UPF0497) |
| arTal_v1_Chr1_+_28740540_28740540 | 1.46 |
AT1G76590.1
|
AT1G76590
|
PLATZ transcription factor family protein |
| arTal_v1_Chr3_+_9208861_9208941 | 1.45 |
AT3G25290.1
AT3G25290.2 |
AT3G25290
|
Auxin-responsive family protein |
| arTal_v1_Chr2_+_9254378_9254378 | 1.45 |
AT2G21640.1
|
AT2G21640
|
marker for oxidative stress response protein |
| arTal_v1_Chr5_-_24501770_24501770 | 1.45 |
AT5G60900.1
|
RLK1
|
receptor-like protein kinase 1 |
| arTal_v1_Chr2_+_17640546_17640546 | 1.43 |
AT2G42360.1
|
AT2G42360
|
RING/U-box superfamily protein |
| arTal_v1_Chr1_-_2175038_2175038 | 1.42 |
AT1G07090.1
|
LSH6
|
LIGHT-DEPENDENT SHORT HYPOCOTYLS-like protein (DUF640) |
| arTal_v1_Chr5_+_16711042_16711042 | 1.42 |
AT5G41761.1
|
AT5G41761
|
hypothetical protein |
| arTal_v1_Chr1_-_9848015_9848015 | 1.42 |
AT1G28190.1
|
AT1G28190
|
hypothetical protein |
| arTal_v1_Chr1_+_21017311_21017311 | 1.41 |
AT1G56150.1
|
AT1G56150
|
SAUR-like auxin-responsive protein family |
| arTal_v1_Chr1_+_7823066_7823066 | 1.41 |
AT1G22160.1
|
AT1G22160
|
senescence-associated family protein (DUF581) |
| arTal_v1_Chr3_+_10694175_10694175 | 1.41 |
AT3G28540.1
|
AT3G28540
|
P-loop containing nucleoside triphosphate hydrolases superfamily protein |
| arTal_v1_Chr2_-_14310608_14310608 | 1.40 |
AT2G33830.2
|
AT2G33830
|
Dormancy/auxin associated family protein |
| arTal_v1_Chr1_-_9935264_9935440 | 1.40 |
AT1G28330.3
AT1G28330.2 AT1G28330.4 AT1G28330.1 AT1G28330.6 AT1G28330.5 |
DYL1
|
dormancy-associated protein-like 1 |
| arTal_v1_Chr5_+_6127773_6127773 | 1.40 |
AT5G18470.1
|
AT5G18470
|
Curculin-like (mannose-binding) lectin family protein |
| arTal_v1_Chr4_+_8294165_8294165 | 1.40 |
AT4G14400.1
|
ACD6
|
ankyrin repeat family protein |
| arTal_v1_Chr1_-_29519323_29519323 | 1.39 |
AT1G78460.1
|
AT1G78460
|
SOUL heme-binding family protein |
| arTal_v1_Chr2_-_14310339_14310339 | 1.39 |
AT2G33830.1
|
AT2G33830
|
Dormancy/auxin associated family protein |
| arTal_v1_Chr5_-_8101330_8101330 | 1.38 |
AT5G23980.1
|
FRO4
|
ferric reduction oxidase 4 |
| arTal_v1_Chr1_+_6450585_6450585 | 1.37 |
AT1G18710.1
|
MYB47
|
myb domain protein 47 |
| arTal_v1_Chr2_-_13101371_13101371 | 1.37 |
AT2G30750.1
|
CYP71A12
|
cytochrome P450 family 71 polypeptide |
| arTal_v1_Chr2_+_17909007_17909007 | 1.37 |
AT2G43060.1
|
IBH1
|
ILI1 binding bHLH 1 |
| arTal_v1_Chr3_-_16926883_16926883 | 1.37 |
AT3G46090.1
|
ZAT7
|
C2H2 and C2HC zinc fingers superfamily protein |
| arTal_v1_Chr3_+_995217_995217 | 1.36 |
AT3G03870.1
|
AT3G03870
|
transmembrane protein |
| arTal_v1_Chr2_-_1355883_1355883 | 1.36 |
AT2G04070.1
|
AT2G04070
|
MATE efflux family protein |
| arTal_v1_Chr3_+_995062_995062 | 1.35 |
AT3G03870.2
|
AT3G03870
|
transmembrane protein |
| arTal_v1_Chr1_-_5440110_5440131 | 1.35 |
AT1G15790.5
AT1G15790.3 AT1G15790.4 AT1G15790.1 AT1G15790.2 |
AT1G15790
|
mediator of RNA polymerase II transcription subunit 15a-like protein |
| arTal_v1_Chr4_+_12125664_12125664 | 1.35 |
AT4G23150.1
|
CRK7
|
cysteine-rich RLK (RECEPTOR-like protein kinase) 7 |
| arTal_v1_Chr5_-_7410102_7410102 | 1.34 |
AT5G22380.1
|
NAC090
|
NAC domain containing protein 90 |
| arTal_v1_Chr4_-_10591546_10591633 | 1.34 |
AT4G19420.3
AT4G19420.2 AT4G19420.1 |
AT4G19420
|
Pectinacetylesterase family protein |
| arTal_v1_Chr1_+_19520603_19520728 | 1.33 |
AT1G52410.2
AT1G52410.1 |
TSA1
|
TSK-associating protein 1 |
| arTal_v1_Chr3_-_2699257_2699257 | 1.33 |
AT3G08860.2
|
PYD4
|
PYRIMIDINE 4 |
| arTal_v1_Chr2_+_8550253_8550253 | 1.33 |
AT2G19810.1
|
OZF1
|
CCCH-type zinc finger family protein |
| arTal_v1_Chr4_+_7148124_7148386 | 1.33 |
AT4G11890.3
AT4G11890.1 AT4G11890.4 |
ARCK1
|
Protein kinase superfamily protein |
| arTal_v1_Chr2_-_1339468_1339468 | 1.32 |
AT2G04050.1
|
AT2G04050
|
MATE efflux family protein |
| arTal_v1_Chr3_-_19768786_19768786 | 1.32 |
AT3G53310.1
|
AT3G53310
|
AP2/B3-like transcriptional factor family protein |
| arTal_v1_Chr3_-_7063372_7063372 | 1.32 |
AT3G20250.2
AT3G20250.1 |
PUM5
|
pumilio 5 |
| arTal_v1_Chr3_+_2753307_2753307 | 1.31 |
AT3G09020.1
|
AT3G09020
|
alpha 1,4-glycosyltransferase family protein |
| arTal_v1_Chr1_-_16789436_16789436 | 1.30 |
AT1G44130.1
|
AT1G44130
|
Eukaryotic aspartyl protease family protein |
| arTal_v1_Chr5_+_3839316_3839391 | 1.30 |
AT5G11920.3
AT5G11920.1 AT5G11920.2 |
cwINV6
|
6-&1-fructan exohydrolase |
| arTal_v1_Chr1_-_2931841_2931850 | 1.30 |
AT1G09080.1
AT1G09080.2 |
BIP3
|
Heat shock protein 70 (Hsp 70) family protein |
| arTal_v1_Chr3_-_7818985_7818985 | 1.29 |
AT3G22160.1
|
AT3G22160
|
VQ motif-containing protein |
| arTal_v1_Chr2_-_6710856_6710856 | 1.29 |
AT2G15390.1
|
FUT4
|
fucosyltransferase 4 |
| arTal_v1_Chr5_-_5862462_5862475 | 1.29 |
AT5G17760.2
AT5G17760.1 |
AT5G17760
|
P-loop containing nucleoside triphosphate hydrolases superfamily protein |
| arTal_v1_Chr5_-_24083528_24083562 | 1.28 |
AT5G59780.2
AT5G59780.1 AT5G59780.3 |
MYB59
|
myb domain protein 59 |
| arTal_v1_Chr2_-_19166949_19166967 | 1.28 |
AT2G46680.2
AT2G46680.1 |
HB-7
|
homeobox 7 |
| arTal_v1_Chr3_+_7345261_7345367 | 1.28 |
AT3G20960.2
AT3G20960.1 |
CYP705A33
|
cytochrome P450, family 705, subfamily A, polypeptide 33 |
| arTal_v1_Chr3_-_2699420_2699420 | 1.28 |
AT3G08860.1
|
PYD4
|
PYRIMIDINE 4 |
| arTal_v1_Chr3_+_23135630_23135630 | 1.28 |
AT3G62550.1
|
AT3G62550
|
Adenine nucleotide alpha hydrolases-like superfamily protein |
| arTal_v1_Chr4_+_10481619_10481619 | 1.27 |
AT4G19170.1
|
NCED4
|
nine-cis-epoxycarotenoid dioxygenase 4 |
| arTal_v1_Chr2_-_6711156_6711156 | 1.27 |
AT2G15390.2
|
FUT4
|
fucosyltransferase 4 |
| arTal_v1_Chr4_-_13022996_13022996 | 1.27 |
AT4G25490.1
|
CBF1
|
C-repeat/DRE binding factor 1 |
| arTal_v1_Chr4_-_16942060_16942060 | 1.26 |
AT4G35750.1
|
AT4G35750
|
SEC14 cytosolic factor family protein / phosphoglyceride transfer family protein |
| arTal_v1_Chr1_-_17706460_17706460 | 1.26 |
AT1G48000.1
|
MYB112
|
myb domain protein 112 |
| arTal_v1_Chr5_+_21240717_21240717 | 1.24 |
AT5G52310.1
|
LTI78
|
low-temperature-responsive protein 78 (LTI78) / desiccation-responsive protein 29A (RD29A) |
| arTal_v1_Chr1_-_10806317_10806428 | 1.24 |
AT1G30500.1
AT1G30500.2 |
NF-YA7
|
nuclear factor Y, subunit A7 |
| arTal_v1_Chr1_-_11668690_11668690 | 1.23 |
AT1G32350.1
AT1G32350.2 |
AOX1D
|
alternative oxidase 1D |
| arTal_v1_Chr5_-_17831336_17831336 | 1.23 |
AT5G44260.1
|
AT5G44260
|
Zinc finger C-x8-C-x5-C-x3-H type family protein |
| arTal_v1_Chr2_-_7256831_7256831 | 1.22 |
AT2G16720.1
|
MYB7
|
myb domain protein 7 |
| arTal_v1_Chr5_-_8659352_8659352 | 1.22 |
AT5G25110.1
|
CIPK25
|
CBL-interacting protein kinase 25 |
| arTal_v1_Chr5_-_6042938_6043014 | 1.21 |
AT5G18270.2
AT5G18270.1 |
ANAC087
|
NAC domain containing protein 87 |
| arTal_v1_Chr3_-_10047453_10047453 | 1.21 |
AT3G27210.1
|
AT3G27210
|
hypothetical protein |
| arTal_v1_Chr1_-_12003005_12003005 | 1.21 |
AT1G33102.1
|
AT1G33102
|
hypothetical protein |
| arTal_v1_Chr5_+_23003909_23003909 | 1.20 |
AT5G56870.1
|
BGAL4
|
beta-galactosidase 4 |
| arTal_v1_Chr1_-_20949281_20949281 | 1.20 |
AT1G56010.2
|
NAC1
|
NAC domain containing protein 1 |
| arTal_v1_Chr3_+_4184569_4184569 | 1.20 |
AT3G13062.3
AT3G13062.2 |
AT3G13062
|
Polyketide cyclase/dehydrase and lipid transport superfamily protein |
| arTal_v1_Chr3_-_3197457_3197457 | 1.19 |
AT3G10320.1
|
AT3G10320
|
Glycosyltransferase family 61 protein |
| arTal_v1_Chr1_-_977761_977911 | 1.19 |
AT1G03850.1
AT1G03850.2 AT1G03850.3 |
GRXS13
|
Glutaredoxin family protein |
| arTal_v1_Chr4_+_10974456_10974510 | 1.19 |
AT4G20320.2
AT4G20320.4 AT4G20320.3 AT4G20320.1 AT4G20320.5 AT4G20320.6 |
AT4G20320
|
CTP synthase family protein |
| arTal_v1_Chr1_+_12346138_12346232 | 1.19 |
AT1G33960.2
AT1G33960.1 |
AIG1
|
P-loop containing nucleoside triphosphate hydrolases superfamily protein |
| arTal_v1_Chr3_+_4184340_4184340 | 1.18 |
AT3G13062.1
|
AT3G13062
|
Polyketide cyclase/dehydrase and lipid transport superfamily protein |
| arTal_v1_Chr1_-_6101983_6101983 | 1.18 |
AT1G17744.1
|
AT1G17744
|
hypothetical protein |
| arTal_v1_Chr5_+_15949910_15949910 | 1.18 |
AT5G39850.1
|
AT5G39850
|
Ribosomal protein S4 |
| arTal_v1_Chr2_-_15092353_15092415 | 1.18 |
AT2G35940.3
AT2G35940.1 |
BLH1
|
BEL1-like homeodomain 1 |
| arTal_v1_Chr1_+_29298243_29298243 | 1.18 |
AT1G77920.1
|
TGA7
|
bZIP transcription factor family protein |
| arTal_v1_Chr3_+_4914789_4914789 | 1.18 |
AT3G14620.1
|
CYP72A8
|
cytochrome P450, family 72, subfamily A, polypeptide 8 |
| arTal_v1_Chr4_-_10590700_10590700 | 1.17 |
AT4G19420.4
|
AT4G19420
|
Pectinacetylesterase family protein |
| arTal_v1_Chr4_-_11636720_11636720 | 1.17 |
AT4G21920.1
|
AT4G21920
|
hypothetical protein |
| arTal_v1_Chr5_-_25813620_25813648 | 1.17 |
AT5G64570.3
AT5G64570.2 AT5G64570.1 |
XYL4
|
beta-D-xylosidase 4 |
| arTal_v1_Chr3_-_11030906_11030906 | 1.17 |
AT3G29034.1
|
AT3G29034
|
transmembrane protein |
| arTal_v1_Chr3_-_7063163_7063163 | 1.17 |
AT3G20250.3
|
PUM5
|
pumilio 5 |
| arTal_v1_Chr2_+_19136019_19136019 | 1.16 |
AT2G46600.1
|
AT2G46600
|
Calcium-binding EF-hand family protein |
| arTal_v1_Chr4_-_13729002_13729002 | 1.16 |
AT4G27450.1
|
AT4G27450
|
aluminum induced protein with YGL and LRDR motifs |
| arTal_v1_Chr2_-_15092178_15092178 | 1.16 |
AT2G35940.2
|
BLH1
|
BEL1-like homeodomain 1 |
| arTal_v1_Chr4_+_12310619_12310619 | 1.15 |
AT4G23600.3
|
CORI3
|
Tyrosine transaminase family protein |
| arTal_v1_Chr1_+_10236337_10236337 | 1.15 |
AT1G29280.1
|
WRKY65
|
WRKY DNA-binding protein 65 |
| arTal_v1_Chr1_+_7366775_7366775 | 1.15 |
AT1G21050.1
|
AT1G21050
|
MIZU-KUSSEI-like protein (Protein of unknown function, DUF617) |
| arTal_v1_Chr3_-_1055196_1055196 | 1.15 |
AT3G04060.1
|
NAC046
|
NAC domain containing protein 46 |
| arTal_v1_Chr4_+_12310379_12310379 | 1.14 |
AT4G23600.1
|
CORI3
|
Tyrosine transaminase family protein |
| arTal_v1_Chr3_-_2890520_2890574 | 1.14 |
AT3G09390.2
AT3G09390.1 |
MT2A
|
metallothionein 2A |
| arTal_v1_Chr2_+_15528877_15528877 | 1.14 |
AT2G36970.1
|
AT2G36970
|
UDP-Glycosyltransferase superfamily protein |
| arTal_v1_Chr4_+_7156150_7156150 | 1.13 |
AT4G11910.1
|
AT4G11910
|
STAY-GREEN-like protein |
| arTal_v1_Chr2_+_2026162_2026162 | 1.13 |
AT2G05520.4
AT2G05520.5 AT2G05520.6 AT2G05520.3 |
GRP-3
|
glycine-rich protein 3 |
| arTal_v1_Chr1_-_19690589_19690589 | 1.13 |
AT1G52880.1
|
NAM
|
NAC (No Apical Meristem) domain transcriptional regulator superfamily protein |
| arTal_v1_Chr5_+_2503125_2503125 | 1.13 |
AT5G07830.1
|
GUS2
|
glucuronidase 2 |
| arTal_v1_Chr1_+_26122080_26122080 | 1.13 |
AT1G69490.1
|
NAP
|
NAC-like, activated by AP3/PI |
| arTal_v1_Chr2_-_12149072_12149072 | 1.12 |
AT2G28400.1
|
AT2G28400
|
senescence regulator (Protein of unknown function, DUF584) |
| arTal_v1_Chr3_-_9632009_9632145 | 1.12 |
AT3G26280.1
AT3G26280.2 |
CYP71B4
|
cytochrome P450, family 71, subfamily B, polypeptide 4 |
| arTal_v1_Chr1_-_5338326_5338326 | 1.11 |
AT1G15520.1
AT1G15520.2 |
ABCG40
|
pleiotropic drug resistance 12 |
| arTal_v1_Chr2_-_17263017_17263017 | 1.11 |
AT2G41410.1
|
AT2G41410
|
Calcium-binding EF-hand family protein |
| arTal_v1_Chr5_-_7828724_7828724 | 1.11 |
AT5G23240.1
|
AT5G23240
|
DNAJ heat shock N-terminal domain-containing protein |
| arTal_v1_Chr2_-_16690182_16690182 | 1.11 |
AT2G39980.1
|
AT2G39980
|
HXXXD-type acyl-transferase family protein |
| arTal_v1_Chr1_+_7366590_7366590 | 1.11 |
AT1G21050.2
|
AT1G21050
|
MIZU-KUSSEI-like protein (Protein of unknown function, DUF617) |
| arTal_v1_Chr4_+_12310885_12310885 | 1.11 |
AT4G23600.2
|
CORI3
|
Tyrosine transaminase family protein |
| arTal_v1_Chr4_-_13606468_13606468 | 1.11 |
AT4G27130.1
|
AT4G27130
|
Translation initiation factor SUI1 family protein |
| arTal_v1_Chr3_-_8450799_8450799 | 1.11 |
AT3G23550.1
|
AT3G23550
|
MATE efflux family protein |
| arTal_v1_Chr4_-_1203380_1203380 | 1.11 |
AT4G02715.1
AT4G02715.2 |
AT4G02715
|
flocculation FLO11-like protein |
| arTal_v1_Chr4_-_8870801_8870979 | 1.10 |
AT4G15530.7
AT4G15530.6 AT4G15530.5 AT4G15530.3 AT4G15530.4 AT4G15530.1 |
PPDK
|
pyruvate orthophosphate dikinase |
| arTal_v1_Chr2_+_2025991_2025991 | 1.10 |
AT2G05520.2
AT2G05520.1 |
GRP-3
|
glycine-rich protein 3 |
| arTal_v1_Chr5_+_24774980_24775028 | 1.10 |
AT5G61640.2
AT5G61640.1 |
PMSR1
|
peptidemethionine sulfoxide reductase 1 |
| arTal_v1_Chr2_-_6493512_6493512 | 1.10 |
AT2G15020.1
|
AT2G15020
|
hypothetical protein |
| arTal_v1_Chr5_+_15883179_15883179 | 1.10 |
AT5G39670.1
|
AT5G39670
|
Calcium-binding EF-hand family protein |
| arTal_v1_Chr5_+_26664842_26664842 | 1.10 |
AT5G66790.1
|
AT5G66790
|
Protein kinase superfamily protein |
| arTal_v1_Chr1_-_498539_498539 | 1.09 |
AT1G02450.1
|
NIMIN1
|
NIM1-interacting 1 |
| arTal_v1_Chr2_+_19180705_19180705 | 1.09 |
AT2G46690.1
|
AT2G46690
|
SAUR-like auxin-responsive protein family |
| arTal_v1_Chr1_+_26038905_26038905 | 1.09 |
AT1G69260.1
|
AFP1
|
ABI five binding protein |
| arTal_v1_Chr3_+_22052121_22052121 | 1.09 |
AT3G59700.1
|
HLECRK
|
lectin-receptor kinase |
| arTal_v1_Chr4_+_2076832_2076832 | 1.08 |
AT4G04293.1
|
AT4G04293
|
|
| arTal_v1_Chr2_-_15273115_15273115 | 1.08 |
AT2G36400.1
|
GRF3
|
growth-regulating factor 3 |
| arTal_v1_Chr1_-_27119918_27119918 | 1.08 |
AT1G72070.1
|
AT1G72070
|
Chaperone DnaJ-domain superfamily protein |
| arTal_v1_Chr3_+_18465318_18465318 | 1.07 |
AT3G49780.1
|
PSK4
|
phytosulfokine 4 precursor |
| arTal_v1_Chr1_-_29187932_29187932 | 1.07 |
AT1G77660.1
|
AT1G77660
|
Histone H3 K4-specific methyltransferase SET7/9 family protein |
| arTal_v1_Chr3_+_5234457_5234457 | 1.06 |
AT3G15500.1
|
NAC3
|
NAC domain containing protein 3 |
| arTal_v1_Chr5_-_19735489_19735490 | 1.06 |
AT5G48657.6
AT5G48657.5 AT5G48657.1 |
AT5G48657
|
defense protein-like protein |
| arTal_v1_Chr2_+_19375985_19375985 | 1.06 |
AT2G47190.1
|
MYB2
|
myb domain protein 2 |
| arTal_v1_Chr1_-_28927391_28927391 | 1.06 |
AT1G76980.2
AT1G76980.1 |
AT1G76980
|
patatin-like phospholipase domain protein |
| arTal_v1_Chr3_+_22602816_22602910 | 1.06 |
AT3G61060.1
AT3G61060.2 |
PP2-A13
|
phloem protein 2-A13 |
| arTal_v1_Chr2_+_18641563_18641563 | 1.05 |
AT2G45210.1
|
SAUR36
|
SAUR-like auxin-responsive protein family |
| arTal_v1_Chr3_-_20475332_20475332 | 1.05 |
AT3G55240.1
|
AT3G55240
|
Plant protein 1589 of unknown function |
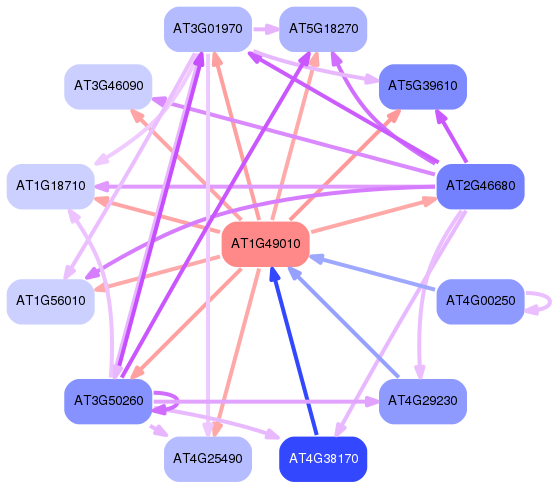
Network of associatons between targets according to the STRING database.

First level regulatory network of AT1G49010
Gene Ontology Analysis
Gene overrepresentation in biological process category:
| Log-likelihood per target | Total log-likelihood | Term | Description |
|---|---|---|---|
| 1.4 | 4.3 | GO:0010266 | response to vitamin B1(GO:0010266) |
| 0.9 | 2.8 | GO:0016046 | detection of fungus(GO:0016046) |
| 0.8 | 2.5 | GO:0002215 | defense response to nematode(GO:0002215) |
| 0.8 | 4.1 | GO:0010201 | response to continuous far red light stimulus by the high-irradiance response system(GO:0010201) |
| 0.8 | 3.1 | GO:0010272 | response to silver ion(GO:0010272) |
| 0.6 | 1.8 | GO:0035606 | protein nitrosylation(GO:0017014) peptidyl-cysteine S-nitrosylation(GO:0018119) peptidyl-cysteine S-trans-nitrosylation(GO:0035606) |
| 0.6 | 2.4 | GO:0097438 | release of seed from dormancy(GO:0048838) exit from dormancy(GO:0097438) |
| 0.6 | 2.9 | GO:0051091 | positive regulation of sequence-specific DNA binding transcription factor activity(GO:0051091) |
| 0.6 | 1.7 | GO:1902347 | response to strigolactone(GO:1902347) |
| 0.5 | 2.1 | GO:0072351 | nicotianamine metabolic process(GO:0030417) nicotianamine biosynthetic process(GO:0030418) tricarboxylic acid biosynthetic process(GO:0072351) |
| 0.5 | 4.8 | GO:0010188 | response to microbial phytotoxin(GO:0010188) |
| 0.5 | 1.6 | GO:0009211 | pyrimidine deoxyribonucleoside triphosphate metabolic process(GO:0009211) pyrimidine deoxyribonucleotide metabolic process(GO:0009219) pyrimidine deoxyribonucleotide biosynthetic process(GO:0009221) 2'-deoxyribonucleotide biosynthetic process(GO:0009265) deoxyribose phosphate biosynthetic process(GO:0046385) |
| 0.5 | 3.2 | GO:0051176 | positive regulation of sulfur metabolic process(GO:0051176) |
| 0.5 | 2.0 | GO:0015720 | allantoin transport(GO:0015720) |
| 0.5 | 1.9 | GO:0045332 | phospholipid translocation(GO:0045332) |
| 0.5 | 2.3 | GO:0051090 | regulation of sequence-specific DNA binding transcription factor activity(GO:0051090) |
| 0.5 | 1.9 | GO:0030643 | cellular phosphate ion homeostasis(GO:0030643) cellular trivalent inorganic anion homeostasis(GO:0072502) |
| 0.4 | 2.2 | GO:0019323 | pentose catabolic process(GO:0019323) |
| 0.4 | 1.3 | GO:0033530 | raffinose metabolic process(GO:0033530) |
| 0.4 | 1.2 | GO:0010618 | aerenchyma formation(GO:0010618) |
| 0.4 | 1.6 | GO:0002119 | nematode larval development(GO:0002119) larval development(GO:0002164) regulation of nematode larval development(GO:0061062) |
| 0.4 | 4.1 | GO:0052317 | camalexin biosynthetic process(GO:0010120) camalexin metabolic process(GO:0052317) |
| 0.4 | 1.9 | GO:0019336 | phenol-containing compound catabolic process(GO:0019336) |
| 0.4 | 0.4 | GO:1990573 | potassium ion import across plasma membrane(GO:1990573) |
| 0.4 | 1.1 | GO:1902065 | response to L-glutamate(GO:1902065) |
| 0.4 | 0.7 | GO:0010597 | green leaf volatile biosynthetic process(GO:0010597) |
| 0.4 | 1.1 | GO:0009945 | radial axis specification(GO:0009945) |
| 0.4 | 1.4 | GO:0035865 | cellular response to potassium ion(GO:0035865) |
| 0.4 | 1.4 | GO:0015692 | lead ion transport(GO:0015692) |
| 0.4 | 1.1 | GO:0033528 | S-methylmethionine metabolic process(GO:0033477) S-methylmethionine cycle(GO:0033528) |
| 0.4 | 1.8 | GO:0010271 | regulation of chlorophyll catabolic process(GO:0010271) regulation of tetrapyrrole catabolic process(GO:1901404) |
| 0.3 | 1.4 | GO:0009557 | antipodal cell differentiation(GO:0009557) |
| 0.3 | 2.1 | GO:0019509 | L-methionine biosynthetic process from methylthioadenosine(GO:0019509) amino acid salvage(GO:0043102) L-methionine salvage(GO:0071267) |
| 0.3 | 0.3 | GO:0045764 | positive regulation of cellular amine metabolic process(GO:0033240) positive regulation of cellular amino acid metabolic process(GO:0045764) |
| 0.3 | 1.7 | GO:0060919 | auxin influx(GO:0060919) |
| 0.3 | 2.7 | GO:0000304 | response to singlet oxygen(GO:0000304) |
| 0.3 | 3.0 | GO:0051410 | detoxification of nitrogen compound(GO:0051410) |
| 0.3 | 1.0 | GO:0000050 | urea cycle(GO:0000050) |
| 0.3 | 3.6 | GO:0009608 | response to symbiont(GO:0009608) |
| 0.3 | 0.3 | GO:2000693 | positive regulation of seed maturation(GO:2000693) |
| 0.3 | 2.6 | GO:0008535 | respiratory chain complex IV assembly(GO:0008535) mitochondrial respiratory chain complex IV assembly(GO:0033617) mitochondrial respiratory chain complex IV biogenesis(GO:0097034) |
| 0.3 | 0.9 | GO:0090069 | regulation of ribosome biogenesis(GO:0090069) |
| 0.3 | 0.6 | GO:1900378 | positive regulation of secondary metabolite biosynthetic process(GO:1900378) |
| 0.3 | 2.1 | GO:0006591 | ornithine metabolic process(GO:0006591) |
| 0.3 | 0.9 | GO:0061014 | positive regulation of mRNA catabolic process(GO:0061014) |
| 0.3 | 1.2 | GO:0035494 | SNARE complex disassembly(GO:0035494) |
| 0.3 | 1.2 | GO:0010507 | negative regulation of autophagy(GO:0010507) |
| 0.3 | 2.1 | GO:0006597 | spermine biosynthetic process(GO:0006597) |
| 0.3 | 0.6 | GO:0009970 | cellular response to sulfate starvation(GO:0009970) |
| 0.3 | 1.8 | GO:2000071 | regulation of defense response by callose deposition(GO:2000071) |
| 0.3 | 1.2 | GO:0006554 | lysine catabolic process(GO:0006554) L-lysine catabolic process to acetyl-CoA(GO:0019474) L-lysine catabolic process(GO:0019477) L-lysine catabolic process to acetyl-CoA via saccharopine(GO:0033512) L-lysine metabolic process(GO:0046440) |
| 0.3 | 1.4 | GO:0060866 | leaf abscission(GO:0060866) |
| 0.3 | 2.3 | GO:0009819 | drought recovery(GO:0009819) |
| 0.3 | 2.3 | GO:0015914 | phospholipid transport(GO:0015914) |
| 0.3 | 0.8 | GO:0010055 | atrichoblast differentiation(GO:0010055) |
| 0.3 | 2.8 | GO:0031936 | negative regulation of chromatin silencing(GO:0031936) |
| 0.3 | 1.4 | GO:1900367 | positive regulation of defense response to insect(GO:1900367) |
| 0.3 | 0.8 | GO:0015802 | basic amino acid transport(GO:0015802) |
| 0.3 | 1.1 | GO:0010071 | root meristem specification(GO:0010071) |
| 0.3 | 1.4 | GO:0080024 | indolebutyric acid metabolic process(GO:0080024) |
| 0.3 | 4.1 | GO:0009098 | leucine biosynthetic process(GO:0009098) |
| 0.3 | 1.3 | GO:1903792 | negative regulation of anion channel activity(GO:0010360) regulation of anion channel activity by blue light(GO:0010361) negative regulation of anion channel activity by blue light(GO:0010362) negative regulation of transporter activity(GO:0032410) negative regulation of ion transmembrane transporter activity(GO:0032413) negative regulation of transmembrane transport(GO:0034763) negative regulation of ion transmembrane transport(GO:0034766) negative regulation of ion transport(GO:0043271) negative regulation of anion transport(GO:1903792) negative regulation of anion transmembrane transport(GO:1903960) |
| 0.3 | 1.1 | GO:0006361 | transcription initiation from RNA polymerase I promoter(GO:0006361) |
| 0.3 | 2.1 | GO:0031222 | arabinan catabolic process(GO:0031222) |
| 0.3 | 0.8 | GO:0080145 | cysteine homeostasis(GO:0080145) |
| 0.3 | 1.3 | GO:1902418 | (+)-abscisic acid D-glucopyranosyl ester transmembrane transport(GO:1902418) |
| 0.3 | 2.6 | GO:1902290 | positive regulation of defense response to oomycetes(GO:1902290) |
| 0.3 | 2.8 | GO:0006878 | cellular copper ion homeostasis(GO:0006878) |
| 0.3 | 3.3 | GO:0048317 | seed morphogenesis(GO:0048317) |
| 0.2 | 0.7 | GO:0009107 | lipoate biosynthetic process(GO:0009107) |
| 0.2 | 1.5 | GO:0072334 | UDP-galactose transport(GO:0015785) UDP-galactose transmembrane transport(GO:0072334) |
| 0.2 | 3.0 | GO:0010044 | response to aluminum ion(GO:0010044) |
| 0.2 | 1.2 | GO:0002230 | positive regulation of defense response to virus by host(GO:0002230) |
| 0.2 | 1.2 | GO:1900384 | regulation of flavonol biosynthetic process(GO:1900384) |
| 0.2 | 0.2 | GO:0006750 | glutathione biosynthetic process(GO:0006750) nonribosomal peptide biosynthetic process(GO:0019184) |
| 0.2 | 0.7 | GO:1904031 | positive regulation of cyclin-dependent protein serine/threonine kinase activity(GO:0045737) positive regulation of cyclin-dependent protein kinase activity(GO:1904031) |
| 0.2 | 0.7 | GO:0006210 | thymine catabolic process(GO:0006210) thymine metabolic process(GO:0019859) |
| 0.2 | 2.3 | GO:0030026 | cellular manganese ion homeostasis(GO:0030026) |
| 0.2 | 0.7 | GO:0000494 | box C/D snoRNA 3'-end processing(GO:0000494) peptidyl-glutamine methylation(GO:0018364) box C/D snoRNA metabolic process(GO:0033967) box C/D snoRNA processing(GO:0034963) histone glutamine methylation(GO:1990258) |
| 0.2 | 0.5 | GO:0036473 | cell death in response to oxidative stress(GO:0036473) programmed cell death in response to reactive oxygen species(GO:0097468) |
| 0.2 | 0.2 | GO:0034058 | endosomal vesicle fusion(GO:0034058) |
| 0.2 | 0.9 | GO:0048656 | anther wall tapetum formation(GO:0048656) anther wall tapetum cell differentiation(GO:0048657) |
| 0.2 | 0.9 | GO:2000082 | regulation of L-ascorbic acid biosynthetic process(GO:2000082) |
| 0.2 | 0.9 | GO:0045046 | protein import into peroxisome membrane(GO:0045046) |
| 0.2 | 4.1 | GO:0010600 | regulation of auxin biosynthetic process(GO:0010600) |
| 0.2 | 2.7 | GO:1900457 | regulation of brassinosteroid mediated signaling pathway(GO:1900457) |
| 0.2 | 1.1 | GO:0035627 | ceramide transport(GO:0035627) |
| 0.2 | 0.4 | GO:0018874 | benzoate metabolic process(GO:0018874) |
| 0.2 | 0.9 | GO:0034720 | histone H3-K4 demethylation(GO:0034720) |
| 0.2 | 0.7 | GO:0034486 | vacuolar transmembrane transport(GO:0034486) |
| 0.2 | 3.3 | GO:0010112 | regulation of systemic acquired resistance(GO:0010112) |
| 0.2 | 0.6 | GO:0000349 | generation of catalytic spliceosome for first transesterification step(GO:0000349) |
| 0.2 | 0.9 | GO:0016098 | monoterpenoid metabolic process(GO:0016098) monoterpenoid biosynthetic process(GO:0016099) |
| 0.2 | 1.7 | GO:0009061 | anaerobic respiration(GO:0009061) |
| 0.2 | 0.6 | GO:0010184 | cytokinin transport(GO:0010184) |
| 0.2 | 2.5 | GO:0009410 | response to xenobiotic stimulus(GO:0009410) |
| 0.2 | 0.6 | GO:0046521 | sphingoid catabolic process(GO:0046521) |
| 0.2 | 0.6 | GO:0035019 | somatic stem cell population maintenance(GO:0035019) |
| 0.2 | 0.6 | GO:0090239 | regulation of histone H4 acetylation(GO:0090239) |
| 0.2 | 0.8 | GO:0033499 | galactose catabolic process(GO:0019388) galactose catabolic process via UDP-galactose(GO:0033499) |
| 0.2 | 0.6 | GO:0001173 | DNA-templated transcriptional start site selection(GO:0001173) |
| 0.2 | 1.4 | GO:0043328 | protein targeting to vacuole involved in ubiquitin-dependent protein catabolic process via the multivesicular body sorting pathway(GO:0043328) |
| 0.2 | 0.8 | GO:0000455 | enzyme-directed rRNA pseudouridine synthesis(GO:0000455) |
| 0.2 | 0.2 | GO:1903513 | retrograde protein transport, ER to cytosol(GO:0030970) endoplasmic reticulum to cytosol transport(GO:1903513) |
| 0.2 | 0.4 | GO:0006559 | L-phenylalanine catabolic process(GO:0006559) erythrose 4-phosphate/phosphoenolpyruvate family amino acid catabolic process(GO:1902222) |
| 0.2 | 1.0 | GO:0033273 | response to vitamin(GO:0033273) |
| 0.2 | 4.5 | GO:0030968 | endoplasmic reticulum unfolded protein response(GO:0030968) |
| 0.2 | 2.5 | GO:0010100 | negative regulation of photomorphogenesis(GO:0010100) |
| 0.2 | 0.6 | GO:0060776 | simple leaf morphogenesis(GO:0060776) |
| 0.2 | 1.2 | GO:2000306 | positive regulation of photomorphogenesis(GO:2000306) |
| 0.2 | 3.1 | GO:0009785 | blue light signaling pathway(GO:0009785) intracellular receptor signaling pathway(GO:0030522) |
| 0.2 | 0.6 | GO:0015812 | gamma-aminobutyric acid transport(GO:0015812) |
| 0.2 | 3.8 | GO:0071218 | cellular response to misfolded protein(GO:0071218) |
| 0.2 | 0.9 | GO:1903428 | positive regulation of reactive oxygen species biosynthetic process(GO:1903428) |
| 0.2 | 0.6 | GO:0035247 | peptidyl-arginine methylation, to asymmetrical-dimethyl arginine(GO:0019919) peptidyl-arginine N-methylation(GO:0035246) peptidyl-arginine omega-N-methylation(GO:0035247) |
| 0.2 | 0.6 | GO:0071732 | cellular response to nitric oxide(GO:0071732) |
| 0.2 | 1.9 | GO:0031204 | posttranslational protein targeting to membrane, translocation(GO:0031204) |
| 0.2 | 1.3 | GO:0090059 | protoxylem development(GO:0090059) |
| 0.2 | 1.5 | GO:0034471 | rRNA 5'-end processing(GO:0000967) ncRNA 5'-end processing(GO:0034471) |
| 0.2 | 0.5 | GO:0090213 | regulation of radial pattern formation(GO:0090213) |
| 0.2 | 2.4 | GO:0015996 | chlorophyll catabolic process(GO:0015996) |
| 0.2 | 0.7 | GO:0019567 | pentose biosynthetic process(GO:0019322) arabinose biosynthetic process(GO:0019567) |
| 0.2 | 0.5 | GO:1902289 | negative regulation of defense response to oomycetes(GO:1902289) |
| 0.2 | 0.9 | GO:0007041 | lysosomal transport(GO:0007041) endosome to lysosome transport(GO:0008333) |
| 0.2 | 0.4 | GO:0000290 | deadenylation-dependent decapping of nuclear-transcribed mRNA(GO:0000290) |
| 0.2 | 1.4 | GO:1903959 | regulation of anion transmembrane transport(GO:1903959) |
| 0.2 | 1.2 | GO:0000184 | nuclear-transcribed mRNA catabolic process, nonsense-mediated decay(GO:0000184) |
| 0.2 | 2.1 | GO:0002221 | pattern recognition receptor signaling pathway(GO:0002221) |
| 0.2 | 0.9 | GO:0010321 | regulation of vegetative phase change(GO:0010321) |
| 0.2 | 0.9 | GO:0048281 | inflorescence morphogenesis(GO:0048281) |
| 0.2 | 3.0 | GO:0000266 | mitochondrial fission(GO:0000266) |
| 0.2 | 0.7 | GO:0043162 | ubiquitin-dependent protein catabolic process via the multivesicular body sorting pathway(GO:0043162) |
| 0.2 | 2.9 | GO:0052544 | defense response by callose deposition in cell wall(GO:0052544) |
| 0.2 | 0.7 | GO:1902916 | regulation of protein polyubiquitination(GO:1902914) positive regulation of protein polyubiquitination(GO:1902916) |
| 0.2 | 0.5 | GO:0031054 | pre-miRNA processing(GO:0031054) |
| 0.2 | 1.2 | GO:0030007 | cellular potassium ion homeostasis(GO:0030007) |
| 0.2 | 0.8 | GO:0010438 | cellular response to sulfur starvation(GO:0010438) |
| 0.2 | 0.5 | GO:0017145 | stem cell division(GO:0017145) |
| 0.2 | 0.2 | GO:0055071 | manganese ion homeostasis(GO:0055071) |
| 0.2 | 1.0 | GO:0048530 | fruit morphogenesis(GO:0048530) |
| 0.2 | 0.5 | GO:0017196 | N-terminal protein amino acid acetylation(GO:0006474) N-terminal peptidyl-methionine acetylation(GO:0017196) |
| 0.2 | 1.0 | GO:0034059 | response to anoxia(GO:0034059) |
| 0.2 | 0.8 | GO:0048464 | sepal development(GO:0048442) flower calyx development(GO:0048464) |
| 0.2 | 7.6 | GO:0002239 | response to oomycetes(GO:0002239) |
| 0.2 | 0.5 | GO:0071596 | ubiquitin-dependent protein catabolic process via the N-end rule pathway(GO:0071596) |
| 0.2 | 0.5 | GO:0098534 | centrosome cycle(GO:0007098) centriole replication(GO:0007099) centrosome organization(GO:0051297) centrosome duplication(GO:0051298) centriole assembly(GO:0098534) |
| 0.2 | 0.8 | GO:0071786 | endoplasmic reticulum tubular network organization(GO:0071786) |
| 0.2 | 0.3 | GO:0048480 | stigma development(GO:0048480) |
| 0.2 | 6.7 | GO:0043562 | cellular response to nitrogen levels(GO:0043562) |
| 0.2 | 0.5 | GO:0033506 | homomethionine metabolic process(GO:0033321) glucosinolate biosynthetic process from homomethionine(GO:0033506) |
| 0.2 | 2.3 | GO:0010274 | hydrotropism(GO:0010274) |
| 0.2 | 0.3 | GO:0016237 | lysosomal microautophagy(GO:0016237) piecemeal microautophagy of nucleus(GO:0034727) single-organism membrane invagination(GO:1902534) |
| 0.2 | 0.3 | GO:0006501 | C-terminal protein lipidation(GO:0006501) |
| 0.2 | 0.5 | GO:2000072 | regulation of defense response to fungus, incompatible interaction(GO:2000072) |
| 0.2 | 0.6 | GO:0050691 | regulation of defense response to virus by host(GO:0050691) |
| 0.2 | 2.5 | GO:0050779 | RNA destabilization(GO:0050779) mRNA destabilization(GO:0061157) |
| 0.2 | 0.5 | GO:0045730 | respiratory burst involved in defense response(GO:0002679) respiratory burst(GO:0045730) |
| 0.2 | 0.8 | GO:0010395 | rhamnogalacturonan I metabolic process(GO:0010395) |
| 0.2 | 0.9 | GO:0034087 | establishment of mitotic sister chromatid cohesion(GO:0034087) establishment of protein localization to chromosome(GO:0070199) rDNA condensation(GO:0070550) establishment of protein localization to chromatin(GO:0071169) transcriptional activation by promoter-enhancer looping(GO:0071733) gene looping(GO:0090202) dsDNA loop formation(GO:0090579) |
| 0.2 | 2.0 | GO:0002238 | response to molecule of fungal origin(GO:0002238) |
| 0.2 | 2.1 | GO:0010039 | response to iron ion(GO:0010039) |
| 0.2 | 1.1 | GO:0080183 | response to photooxidative stress(GO:0080183) |
| 0.2 | 0.6 | GO:0051289 | protein homotetramerization(GO:0051289) |
| 0.2 | 0.9 | GO:1903651 | positive regulation of cytoplasmic transport(GO:1903651) |
| 0.1 | 0.4 | GO:0010213 | non-photoreactive DNA repair(GO:0010213) |
| 0.1 | 1.3 | GO:1900057 | positive regulation of leaf senescence(GO:1900057) |
| 0.1 | 0.6 | GO:0046786 | viral replication complex formation and maintenance(GO:0046786) |
| 0.1 | 0.1 | GO:0031115 | negative regulation of microtubule polymerization(GO:0031115) |
| 0.1 | 1.2 | GO:0009854 | oxidative photosynthetic carbon pathway(GO:0009854) |
| 0.1 | 1.3 | GO:0016575 | histone deacetylation(GO:0016575) |
| 0.1 | 0.3 | GO:0009759 | indole glucosinolate biosynthetic process(GO:0009759) |
| 0.1 | 1.1 | GO:0051365 | cellular response to potassium ion starvation(GO:0051365) |
| 0.1 | 1.1 | GO:0042851 | alanine metabolic process(GO:0006522) alanine catabolic process(GO:0006524) pyruvate family amino acid metabolic process(GO:0009078) pyruvate family amino acid catabolic process(GO:0009080) L-alanine metabolic process(GO:0042851) L-alanine catabolic process(GO:0042853) |
| 0.1 | 0.1 | GO:0080121 | AMP transport(GO:0080121) |
| 0.1 | 1.1 | GO:0033169 | histone H3-K9 demethylation(GO:0033169) |
| 0.1 | 1.1 | GO:0045903 | positive regulation of translational fidelity(GO:0045903) |
| 0.1 | 0.6 | GO:0019048 | modulation by virus of host morphology or physiology(GO:0019048) |
| 0.1 | 0.7 | GO:0006370 | 7-methylguanosine mRNA capping(GO:0006370) |
| 0.1 | 0.4 | GO:0048439 | flower morphogenesis(GO:0048439) |
| 0.1 | 0.3 | GO:0043181 | vacuolar sequestering(GO:0043181) |
| 0.1 | 3.5 | GO:0009937 | regulation of gibberellic acid mediated signaling pathway(GO:0009937) |
| 0.1 | 1.2 | GO:0010230 | alternative respiration(GO:0010230) |
| 0.1 | 1.2 | GO:0006266 | DNA ligation(GO:0006266) |
| 0.1 | 1.5 | GO:0006646 | phosphatidylethanolamine biosynthetic process(GO:0006646) phosphatidylethanolamine metabolic process(GO:0046337) |
| 0.1 | 0.1 | GO:2000068 | regulation of defense response to insect(GO:2000068) |
| 0.1 | 1.3 | GO:0070813 | hydrogen sulfide metabolic process(GO:0070813) |
| 0.1 | 1.5 | GO:0032511 | late endosome to vacuole transport via multivesicular body sorting pathway(GO:0032511) |
| 0.1 | 0.4 | GO:0001560 | regulation of cell growth by extracellular stimulus(GO:0001560) |
| 0.1 | 0.7 | GO:0017006 | protein-tetrapyrrole linkage(GO:0017006) |
| 0.1 | 0.3 | GO:0070542 | response to fatty acid(GO:0070542) cellular response to fatty acid(GO:0071398) |
| 0.1 | 0.7 | GO:0008608 | attachment of spindle microtubules to kinetochore(GO:0008608) |
| 0.1 | 0.6 | GO:0051775 | response to redox state(GO:0051775) |
| 0.1 | 1.9 | GO:0009638 | phototropism(GO:0009638) |
| 0.1 | 0.4 | GO:0008334 | histone mRNA metabolic process(GO:0008334) |
| 0.1 | 1.9 | GO:0048497 | maintenance of organ identity(GO:0048496) maintenance of floral organ identity(GO:0048497) |
| 0.1 | 0.4 | GO:0030242 | pexophagy(GO:0030242) |
| 0.1 | 3.5 | GO:0009816 | defense response to bacterium, incompatible interaction(GO:0009816) |
| 0.1 | 1.5 | GO:0010050 | vegetative phase change(GO:0010050) |
| 0.1 | 0.9 | GO:0046473 | phosphatidic acid metabolic process(GO:0046473) |
| 0.1 | 0.4 | GO:0010135 | ureide metabolic process(GO:0010135) ureide catabolic process(GO:0010136) |
| 0.1 | 1.6 | GO:0010105 | negative regulation of ethylene-activated signaling pathway(GO:0010105) negative regulation of phosphorelay signal transduction system(GO:0070298) |
| 0.1 | 3.5 | GO:0060548 | negative regulation of cell death(GO:0060548) |
| 0.1 | 0.4 | GO:0010289 | homogalacturonan biosynthetic process(GO:0010289) |
| 0.1 | 6.4 | GO:0009626 | plant-type hypersensitive response(GO:0009626) |
| 0.1 | 0.9 | GO:0009187 | cyclic nucleotide metabolic process(GO:0009187) |
| 0.1 | 0.4 | GO:0090615 | mitochondrial mRNA processing(GO:0090615) |
| 0.1 | 2.1 | GO:0000165 | MAPK cascade(GO:0000165) |
| 0.1 | 0.4 | GO:0042724 | thiamine biosynthetic process(GO:0009228) thiamine-containing compound biosynthetic process(GO:0042724) |
| 0.1 | 0.1 | GO:0019482 | beta-alanine metabolic process(GO:0019482) |
| 0.1 | 1.0 | GO:0009862 | systemic acquired resistance, salicylic acid mediated signaling pathway(GO:0009862) |
| 0.1 | 0.4 | GO:0000491 | small nucleolar ribonucleoprotein complex assembly(GO:0000491) |
| 0.1 | 0.4 | GO:0070537 | histone H2A K63-linked deubiquitination(GO:0070537) |
| 0.1 | 2.8 | GO:0009682 | induced systemic resistance(GO:0009682) |
| 0.1 | 0.8 | GO:0005513 | detection of calcium ion(GO:0005513) |
| 0.1 | 0.4 | GO:0032260 | response to jasmonic acid stimulus involved in jasmonic acid and ethylene-dependent systemic resistance(GO:0032260) |
| 0.1 | 0.6 | GO:0015938 | purine ribonucleotide catabolic process(GO:0009154) ribonucleotide catabolic process(GO:0009261) coenzyme A catabolic process(GO:0015938) nucleoside bisphosphate catabolic process(GO:0033869) ribonucleoside bisphosphate catabolic process(GO:0034031) purine nucleoside bisphosphate catabolic process(GO:0034034) |
| 0.1 | 0.5 | GO:0043693 | monoterpene biosynthetic process(GO:0043693) |
| 0.1 | 0.2 | GO:0018279 | peptidyl-asparagine modification(GO:0018196) protein N-linked glycosylation via asparagine(GO:0018279) |
| 0.1 | 2.5 | GO:0090421 | embryonic meristem initiation(GO:0090421) |
| 0.1 | 0.4 | GO:0036265 | RNA (guanine-N7)-methylation(GO:0036265) rRNA (guanine-N7)-methylation(GO:0070476) |
| 0.1 | 0.1 | GO:0009106 | lipoate metabolic process(GO:0009106) |
| 0.1 | 0.5 | GO:0080119 | ER body organization(GO:0080119) |
| 0.1 | 0.2 | GO:0051291 | protein heterooligomerization(GO:0051291) |
| 0.1 | 0.3 | GO:0006386 | termination of RNA polymerase III transcription(GO:0006386) |
| 0.1 | 0.3 | GO:0045857 | regulation of molecular function, epigenetic(GO:0040030) negative regulation of molecular function, epigenetic(GO:0045857) |
| 0.1 | 2.0 | GO:0015936 | coenzyme A metabolic process(GO:0015936) |
| 0.1 | 1.2 | GO:1900056 | negative regulation of leaf senescence(GO:1900056) |
| 0.1 | 0.5 | GO:0015697 | quaternary ammonium group transport(GO:0015697) |
| 0.1 | 0.1 | GO:0016578 | histone deubiquitination(GO:0016578) |
| 0.1 | 0.2 | GO:0010506 | regulation of autophagy(GO:0010506) |
| 0.1 | 0.2 | GO:1990532 | stress response to nickel ion(GO:1990532) |
| 0.1 | 0.8 | GO:0010076 | maintenance of floral meristem identity(GO:0010076) |
| 0.1 | 0.6 | GO:1904589 | regulation of protein import(GO:1904589) |
| 0.1 | 1.0 | GO:0031053 | primary miRNA processing(GO:0031053) |
| 0.1 | 0.6 | GO:0051865 | protein autoubiquitination(GO:0051865) |
| 0.1 | 3.6 | GO:2000022 | regulation of jasmonic acid mediated signaling pathway(GO:2000022) |
| 0.1 | 0.3 | GO:0046345 | sesquiterpenoid catabolic process(GO:0016107) apocarotenoid catabolic process(GO:0043290) abscisic acid catabolic process(GO:0046345) |
| 0.1 | 0.4 | GO:0006729 | tetrahydrobiopterin biosynthetic process(GO:0006729) tetrahydrobiopterin metabolic process(GO:0046146) |
| 0.1 | 0.7 | GO:0015846 | polyamine transport(GO:0015846) |
| 0.1 | 0.3 | GO:0019433 | triglyceride catabolic process(GO:0019433) |
| 0.1 | 0.2 | GO:0019368 | fatty acid elongation, saturated fatty acid(GO:0019367) fatty acid elongation, unsaturated fatty acid(GO:0019368) fatty acid elongation, monounsaturated fatty acid(GO:0034625) fatty acid elongation, polyunsaturated fatty acid(GO:0034626) |
| 0.1 | 0.4 | GO:0042149 | cellular response to glucose starvation(GO:0042149) |
| 0.1 | 0.4 | GO:0055073 | cadmium ion homeostasis(GO:0055073) |
| 0.1 | 0.6 | GO:0071108 | protein K48-linked deubiquitination(GO:0071108) |
| 0.1 | 0.4 | GO:0006884 | cell volume homeostasis(GO:0006884) |
| 0.1 | 0.5 | GO:0048577 | negative regulation of short-day photoperiodism, flowering(GO:0048577) |
| 0.1 | 2.2 | GO:0071446 | cellular response to salicylic acid stimulus(GO:0071446) |
| 0.1 | 0.4 | GO:0042256 | mature ribosome assembly(GO:0042256) |
| 0.1 | 0.3 | GO:0035280 | miRNA loading onto RISC involved in gene silencing by miRNA(GO:0035280) small RNA loading onto RISC(GO:0070922) |
| 0.1 | 0.2 | GO:0015783 | GDP-fucose transport(GO:0015783) |
| 0.1 | 0.3 | GO:0010288 | response to lead ion(GO:0010288) |
| 0.1 | 4.6 | GO:0009631 | cold acclimation(GO:0009631) |
| 0.1 | 0.4 | GO:0016598 | protein arginylation(GO:0016598) |
| 0.1 | 0.2 | GO:0009304 | tRNA transcription(GO:0009304) |
| 0.1 | 1.2 | GO:0060261 | regulation of transcription initiation from RNA polymerase II promoter(GO:0060260) positive regulation of transcription initiation from RNA polymerase II promoter(GO:0060261) positive regulation of DNA-templated transcription, initiation(GO:2000144) |
| 0.1 | 0.3 | GO:0048587 | regulation of short-day photoperiodism, flowering(GO:0048587) |
| 0.1 | 0.9 | GO:0072506 | phosphate ion homeostasis(GO:0055062) trivalent inorganic anion homeostasis(GO:0072506) |
| 0.1 | 0.8 | GO:0045910 | negative regulation of DNA recombination(GO:0045910) |
| 0.1 | 0.3 | GO:1990116 | ribosome-associated ubiquitin-dependent protein catabolic process(GO:1990116) |
| 0.1 | 5.9 | GO:0006972 | hyperosmotic response(GO:0006972) |
| 0.1 | 0.4 | GO:0006312 | mitotic recombination(GO:0006312) |
| 0.1 | 0.7 | GO:0048363 | mucilage pectin metabolic process(GO:0048363) |
| 0.1 | 0.2 | GO:0000966 | RNA 5'-end processing(GO:0000966) |
| 0.1 | 0.5 | GO:0048209 | regulation of vesicle targeting, to, from or within Golgi(GO:0048209) |
| 0.1 | 0.7 | GO:0033540 | fatty acid beta-oxidation using acyl-CoA oxidase(GO:0033540) |
| 0.1 | 1.3 | GO:0015706 | nitrate transport(GO:0015706) |
| 0.1 | 0.7 | GO:0035196 | production of miRNAs involved in gene silencing by miRNA(GO:0035196) |
| 0.1 | 0.1 | GO:0006808 | regulation of nitrogen utilization(GO:0006808) |
| 0.1 | 0.2 | GO:0043928 | exonucleolytic nuclear-transcribed mRNA catabolic process involved in deadenylation-dependent decay(GO:0043928) |
| 0.1 | 6.7 | GO:0009751 | response to salicylic acid(GO:0009751) |
| 0.1 | 1.0 | GO:0006490 | oligosaccharide-lipid intermediate biosynthetic process(GO:0006490) |
| 0.1 | 1.5 | GO:0009969 | xyloglucan biosynthetic process(GO:0009969) |
| 0.1 | 0.1 | GO:0071457 | cellular response to ozone(GO:0071457) |
| 0.1 | 0.7 | GO:0097428 | protein maturation by iron-sulfur cluster transfer(GO:0097428) |
| 0.1 | 0.3 | GO:0072702 | response to methyl methanesulfonate(GO:0072702) |
| 0.1 | 8.7 | GO:0010200 | response to chitin(GO:0010200) |
| 0.1 | 0.6 | GO:0031539 | positive regulation of anthocyanin metabolic process(GO:0031539) |
| 0.1 | 0.3 | GO:0009915 | phloem sucrose loading(GO:0009915) |
| 0.1 | 0.3 | GO:0048872 | tissue homeostasis(GO:0001894) homeostasis of number of meristem cells(GO:0007639) homeostasis of number of cells(GO:0048872) homeostasis of number of cells within a tissue(GO:0048873) |
| 0.1 | 0.6 | GO:0031119 | tRNA pseudouridine synthesis(GO:0031119) |
| 0.1 | 0.3 | GO:0010677 | negative regulation of cellular carbohydrate metabolic process(GO:0010677) |
| 0.1 | 1.1 | GO:0098869 | cellular oxidant detoxification(GO:0098869) |
| 0.1 | 0.3 | GO:0034067 | protein localization to Golgi apparatus(GO:0034067) |
| 0.1 | 0.3 | GO:0072388 | FAD biosynthetic process(GO:0006747) flavin adenine dinucleotide biosynthetic process(GO:0072388) |
| 0.1 | 1.9 | GO:0006817 | phosphate ion transport(GO:0006817) |
| 0.1 | 0.2 | GO:0031538 | negative regulation of anthocyanin metabolic process(GO:0031538) |
| 0.1 | 0.2 | GO:0010269 | response to selenium ion(GO:0010269) |
| 0.1 | 0.3 | GO:0090065 | regulation of production of siRNA involved in RNA interference(GO:0090065) |
| 0.1 | 0.5 | GO:0031930 | mitochondria-nucleus signaling pathway(GO:0031930) |
| 0.1 | 0.6 | GO:0033523 | histone H2B ubiquitination(GO:0033523) |
| 0.1 | 0.4 | GO:0080009 | mRNA methylation(GO:0080009) |
| 0.1 | 5.5 | GO:0016579 | protein deubiquitination(GO:0016579) |
| 0.1 | 0.2 | GO:0071836 | nectar secretion(GO:0071836) |
| 0.1 | 0.4 | GO:0006891 | intra-Golgi vesicle-mediated transport(GO:0006891) |
| 0.1 | 0.2 | GO:0006336 | DNA replication-independent nucleosome assembly(GO:0006336) DNA replication-independent nucleosome organization(GO:0034724) |
| 0.1 | 0.1 | GO:0032196 | transposition(GO:0032196) |
| 0.1 | 1.3 | GO:0019374 | galactolipid metabolic process(GO:0019374) |
| 0.1 | 0.2 | GO:0055047 | generative cell mitosis(GO:0055047) |
| 0.1 | 1.0 | GO:0097354 | protein prenylation(GO:0018342) prenylation(GO:0097354) |
| 0.1 | 0.3 | GO:0010731 | protein glutathionylation(GO:0010731) |
| 0.1 | 0.2 | GO:0060860 | regulation of floral organ abscission(GO:0060860) negative regulation of floral organ abscission(GO:0060862) |
| 0.1 | 0.2 | GO:0010148 | transpiration(GO:0010148) |
| 0.1 | 0.1 | GO:0033566 | gamma-tubulin complex localization(GO:0033566) |
| 0.1 | 2.8 | GO:0034976 | response to endoplasmic reticulum stress(GO:0034976) |
| 0.1 | 1.1 | GO:0009649 | entrainment of circadian clock(GO:0009649) |
| 0.1 | 0.4 | GO:0019566 | arabinose metabolic process(GO:0019566) |
| 0.1 | 0.5 | GO:0007292 | female gamete generation(GO:0007292) |
| 0.1 | 0.3 | GO:0035305 | negative regulation of dephosphorylation(GO:0035305) negative regulation of protein dephosphorylation(GO:0035308) |
| 0.1 | 0.1 | GO:0006620 | posttranslational protein targeting to membrane(GO:0006620) |
| 0.1 | 1.9 | GO:0030150 | protein import into mitochondrial matrix(GO:0030150) |
| 0.1 | 0.1 | GO:1901976 | regulation of cell cycle checkpoint(GO:1901976) |
| 0.1 | 0.2 | GO:0006369 | termination of RNA polymerase II transcription(GO:0006369) |
| 0.1 | 0.7 | GO:0045962 | positive regulation of development, heterochronic(GO:0045962) |
| 0.1 | 0.3 | GO:0051457 | maintenance of protein location in nucleus(GO:0051457) |
| 0.1 | 0.4 | GO:0034035 | guanosine tetraphosphate metabolic process(GO:0015969) purine ribonucleoside bisphosphate metabolic process(GO:0034035) |
| 0.1 | 1.0 | GO:0010332 | response to gamma radiation(GO:0010332) |
| 0.1 | 0.2 | GO:0051055 | negative regulation of lipid biosynthetic process(GO:0051055) |
| 0.1 | 1.7 | GO:0046834 | lipid phosphorylation(GO:0046834) phosphatidylinositol phosphorylation(GO:0046854) |
| 0.1 | 0.2 | GO:0030031 | cell projection organization(GO:0030030) cell projection assembly(GO:0030031) |
| 0.1 | 0.6 | GO:0033683 | nucleotide-excision repair, DNA incision(GO:0033683) |
| 0.1 | 0.6 | GO:0051131 | chaperone-mediated protein complex assembly(GO:0051131) |
| 0.1 | 0.1 | GO:0090322 | regulation of superoxide metabolic process(GO:0090322) |
| 0.1 | 0.1 | GO:0006123 | mitochondrial electron transport, cytochrome c to oxygen(GO:0006123) |
| 0.1 | 0.2 | GO:0006177 | GMP biosynthetic process(GO:0006177) GMP metabolic process(GO:0046037) |
| 0.1 | 1.4 | GO:0006890 | retrograde vesicle-mediated transport, Golgi to ER(GO:0006890) |
| 0.1 | 0.3 | GO:0045739 | positive regulation of DNA repair(GO:0045739) |
| 0.1 | 2.5 | GO:0051607 | defense response to virus(GO:0051607) |
| 0.1 | 0.6 | GO:0006102 | isocitrate metabolic process(GO:0006102) |
| 0.1 | 0.3 | GO:0010540 | basipetal auxin transport(GO:0010540) |
| 0.1 | 0.1 | GO:0010310 | regulation of hydrogen peroxide metabolic process(GO:0010310) |
| 0.1 | 0.7 | GO:0090158 | endoplasmic reticulum membrane organization(GO:0090158) |
| 0.1 | 0.3 | GO:0006570 | tyrosine metabolic process(GO:0006570) |
| 0.1 | 0.3 | GO:0046622 | positive regulation of organ growth(GO:0046622) |
| 0.1 | 0.3 | GO:0006882 | cellular zinc ion homeostasis(GO:0006882) |
| 0.1 | 0.2 | GO:0045948 | positive regulation of translational initiation(GO:0045948) |
| 0.1 | 1.4 | GO:0000245 | spliceosomal complex assembly(GO:0000245) |
| 0.1 | 0.5 | GO:0006515 | misfolded or incompletely synthesized protein catabolic process(GO:0006515) |
| 0.1 | 4.1 | GO:0031146 | SCF-dependent proteasomal ubiquitin-dependent protein catabolic process(GO:0031146) |
| 0.1 | 0.3 | GO:0032951 | regulation of beta-glucan metabolic process(GO:0032950) regulation of beta-glucan biosynthetic process(GO:0032951) regulation of cellulose biosynthetic process(GO:2001006) |
| 0.1 | 0.3 | GO:0007064 | mitotic sister chromatid cohesion(GO:0007064) |
| 0.1 | 0.4 | GO:0010161 | red light signaling pathway(GO:0010161) |
| 0.1 | 0.6 | GO:0042732 | D-xylose metabolic process(GO:0042732) |
| 0.1 | 2.6 | GO:0071805 | cellular potassium ion transport(GO:0071804) potassium ion transmembrane transport(GO:0071805) |
| 0.1 | 0.6 | GO:0010106 | cellular response to iron ion starvation(GO:0010106) |
| 0.1 | 0.1 | GO:0070829 | heterochromatin maintenance(GO:0070829) |
| 0.1 | 2.1 | GO:0072665 | protein targeting to vacuole(GO:0006623) protein localization to vacuole(GO:0072665) establishment of protein localization to vacuole(GO:0072666) |
| 0.1 | 0.2 | GO:0006826 | iron ion transport(GO:0006826) |
| 0.1 | 0.4 | GO:0019632 | shikimate metabolic process(GO:0019632) |
| 0.1 | 0.4 | GO:0006611 | protein export from nucleus(GO:0006611) |
| 0.1 | 0.3 | GO:0042779 | tRNA 3'-trailer cleavage(GO:0042779) tRNA 3'-end processing(GO:0042780) |
| 0.1 | 1.4 | GO:0071472 | cellular response to salt stress(GO:0071472) |
| 0.1 | 0.2 | GO:0042754 | negative regulation of circadian rhythm(GO:0042754) |
| 0.1 | 5.1 | GO:0000209 | protein polyubiquitination(GO:0000209) |
| 0.1 | 0.4 | GO:0006565 | L-serine catabolic process(GO:0006565) glycine biosynthetic process from serine(GO:0019264) response to tetrahydrofolate(GO:1904481) cellular response to tetrahydrofolate(GO:1904482) |
| 0.1 | 0.2 | GO:0009684 | indoleacetic acid biosynthetic process(GO:0009684) |
| 0.1 | 0.3 | GO:0048655 | anther morphogenesis(GO:0048654) anther wall tapetum morphogenesis(GO:0048655) |
| 0.1 | 1.0 | GO:0006075 | (1->3)-beta-D-glucan metabolic process(GO:0006074) (1->3)-beta-D-glucan biosynthetic process(GO:0006075) |
| 0.1 | 0.2 | GO:1900055 | regulation of leaf senescence(GO:1900055) |
| 0.1 | 0.6 | GO:0016558 | protein import into peroxisome matrix(GO:0016558) |
| 0.1 | 0.5 | GO:0071489 | cellular response to red or far red light(GO:0071489) |
| 0.1 | 0.4 | GO:0016444 | somatic cell DNA recombination(GO:0016444) |
| 0.1 | 0.9 | GO:0045324 | late endosome to vacuole transport(GO:0045324) |
| 0.1 | 1.2 | GO:0061572 | actin filament bundle assembly(GO:0051017) actin filament bundle organization(GO:0061572) |
| 0.1 | 0.2 | GO:1904961 | quiescent center organization(GO:1904961) |
| 0.1 | 0.1 | GO:0009303 | rRNA transcription(GO:0009303) |
| 0.1 | 0.4 | GO:0035999 | tetrahydrofolate interconversion(GO:0035999) |
| 0.1 | 0.9 | GO:0009299 | mRNA transcription(GO:0009299) |
| 0.1 | 0.2 | GO:0090481 | pyrimidine nucleotide-sugar transmembrane transport(GO:0090481) |
| 0.1 | 0.3 | GO:0010077 | maintenance of inflorescence meristem identity(GO:0010077) |
| 0.1 | 0.2 | GO:0006661 | phosphatidylinositol biosynthetic process(GO:0006661) |
| 0.1 | 0.2 | GO:0016320 | endoplasmic reticulum membrane fusion(GO:0016320) |
| 0.1 | 0.2 | GO:0006896 | Golgi to vacuole transport(GO:0006896) |
| 0.1 | 0.6 | GO:0015749 | monosaccharide transport(GO:0015749) |
| 0.1 | 0.2 | GO:0001112 | DNA-templated transcriptional open complex formation(GO:0001112) transcriptional open complex formation at RNA polymerase II promoter(GO:0001113) protein-DNA complex remodeling(GO:0001120) macromolecular complex remodeling(GO:0034367) |
| 0.1 | 0.3 | GO:0000082 | G1/S transition of mitotic cell cycle(GO:0000082) |
| 0.1 | 0.3 | GO:0015780 | nucleotide-sugar transport(GO:0015780) |
| 0.1 | 1.5 | GO:0007166 | cell surface receptor signaling pathway(GO:0007166) |
| 0.1 | 0.3 | GO:0019419 | sulfate reduction(GO:0019419) |
| 0.1 | 1.5 | GO:0035304 | regulation of protein dephosphorylation(GO:0035304) |
| 0.1 | 0.8 | GO:0032365 | intracellular lipid transport(GO:0032365) |
| 0.1 | 2.3 | GO:0006888 | ER to Golgi vesicle-mediated transport(GO:0006888) |
| 0.1 | 2.2 | GO:0006897 | endocytosis(GO:0006897) |
| 0.1 | 0.2 | GO:1905157 | positive regulation of photosynthesis(GO:1905157) |
| 0.1 | 0.1 | GO:0048451 | petal formation(GO:0048451) |
| 0.1 | 0.3 | GO:0016255 | attachment of GPI anchor to protein(GO:0016255) |
| 0.1 | 0.2 | GO:0006517 | protein deglycosylation(GO:0006517) |
| 0.1 | 0.3 | GO:0048578 | positive regulation of long-day photoperiodism, flowering(GO:0048578) |
| 0.1 | 0.3 | GO:0034508 | centromere complex assembly(GO:0034508) |
| 0.1 | 0.6 | GO:0035967 | cellular response to topologically incorrect protein(GO:0035967) |
| 0.0 | 0.1 | GO:0097501 | stress response to metal ion(GO:0097501) |
| 0.0 | 1.4 | GO:0009789 | positive regulation of abscisic acid-activated signaling pathway(GO:0009789) |
| 0.0 | 2.0 | GO:0071369 | cellular response to ethylene stimulus(GO:0071369) |
| 0.0 | 1.4 | GO:0010499 | proteasomal ubiquitin-independent protein catabolic process(GO:0010499) |
| 0.0 | 1.3 | GO:0009833 | plant-type primary cell wall biogenesis(GO:0009833) |
| 0.0 | 0.1 | GO:0000478 | endonucleolytic cleavage involved in rRNA processing(GO:0000478) |
| 0.0 | 0.5 | GO:0045931 | positive regulation of mitotic cell cycle(GO:0045931) |
| 0.0 | 0.3 | GO:0045851 | pH reduction(GO:0045851) |
| 0.0 | 0.5 | GO:0072657 | protein localization to membrane(GO:0072657) |
| 0.0 | 1.3 | GO:0009062 | fatty acid catabolic process(GO:0009062) |
| 0.0 | 0.5 | GO:1900150 | regulation of defense response to fungus(GO:1900150) |
| 0.0 | 0.4 | GO:0061025 | membrane fusion(GO:0061025) |
| 0.0 | 1.3 | GO:0000462 | maturation of SSU-rRNA from tricistronic rRNA transcript (SSU-rRNA, 5.8S rRNA, LSU-rRNA)(GO:0000462) |
| 0.0 | 0.7 | GO:0006465 | signal peptide processing(GO:0006465) |
| 0.0 | 1.6 | GO:0000122 | negative regulation of transcription from RNA polymerase II promoter(GO:0000122) |
| 0.0 | 0.7 | GO:0010821 | regulation of mitochondrion organization(GO:0010821) |
| 0.0 | 0.1 | GO:0000965 | mitochondrial RNA 3'-end processing(GO:0000965) |
| 0.0 | 0.4 | GO:0010031 | circumnutation(GO:0010031) multicellular organismal movement(GO:0050879) |
| 0.0 | 0.3 | GO:2001289 | lipid X metabolic process(GO:2001289) |
| 0.0 | 0.0 | GO:0022406 | membrane docking(GO:0022406) vesicle docking(GO:0048278) |
| 0.0 | 1.3 | GO:0010043 | response to zinc ion(GO:0010043) |
| 0.0 | 2.1 | GO:0000380 | alternative mRNA splicing, via spliceosome(GO:0000380) |
| 0.0 | 2.5 | GO:0043161 | proteasomal protein catabolic process(GO:0010498) proteasome-mediated ubiquitin-dependent protein catabolic process(GO:0043161) |
| 0.0 | 0.3 | GO:0016559 | peroxisome fission(GO:0016559) |
| 0.0 | 1.2 | GO:0010218 | response to far red light(GO:0010218) |
| 0.0 | 0.3 | GO:0045116 | protein neddylation(GO:0045116) |
| 0.0 | 1.3 | GO:0040034 | regulation of development, heterochronic(GO:0040034) |
| 0.0 | 0.3 | GO:0080027 | response to herbivore(GO:0080027) |
| 0.0 | 0.4 | GO:0018202 | peptidyl-diphthamide metabolic process(GO:0017182) peptidyl-diphthamide biosynthetic process from peptidyl-histidine(GO:0017183) peptidyl-histidine modification(GO:0018202) |
| 0.0 | 0.6 | GO:0051260 | protein homooligomerization(GO:0051260) |
| 0.0 | 0.3 | GO:0042182 | lactate metabolic process(GO:0006089) methylglyoxal metabolic process(GO:0009438) methylglyoxal catabolic process to D-lactate via S-lactoyl-glutathione(GO:0019243) ketone catabolic process(GO:0042182) methylglyoxal catabolic process(GO:0051596) methylglyoxal catabolic process to lactate(GO:0061727) |
| 0.0 | 0.2 | GO:0070125 | mitochondrial translational elongation(GO:0070125) |
| 0.0 | 0.4 | GO:0080113 | regulation of seed growth(GO:0080113) |
| 0.0 | 0.5 | GO:0043248 | proteasome assembly(GO:0043248) |
| 0.0 | 0.9 | GO:0032968 | positive regulation of transcription elongation from RNA polymerase II promoter(GO:0032968) |
| 0.0 | 0.3 | GO:0010167 | response to nitrate(GO:0010167) |
| 0.0 | 0.2 | GO:1901004 | ubiquinone-6 metabolic process(GO:1901004) ubiquinone-6 biosynthetic process(GO:1901006) |
| 0.0 | 0.2 | GO:0006107 | oxaloacetate metabolic process(GO:0006107) |
| 0.0 | 0.4 | GO:0045144 | meiotic sister chromatid segregation(GO:0045144) meiotic sister chromatid cohesion(GO:0051177) |
| 0.0 | 0.2 | GO:0010226 | response to lithium ion(GO:0010226) |
| 0.0 | 0.1 | GO:0016926 | protein desumoylation(GO:0016926) |
| 0.0 | 1.4 | GO:0006749 | glutathione metabolic process(GO:0006749) |
| 0.0 | 0.8 | GO:0009625 | response to insect(GO:0009625) |
| 0.0 | 2.2 | GO:0009567 | fertilization(GO:0009566) double fertilization forming a zygote and endosperm(GO:0009567) |
| 0.0 | 0.1 | GO:0009747 | hexokinase-dependent signaling(GO:0009747) |
| 0.0 | 13.9 | GO:0016567 | protein ubiquitination(GO:0016567) |
| 0.0 | 0.8 | GO:0000460 | maturation of 5.8S rRNA(GO:0000460) |
| 0.0 | 0.1 | GO:1902458 | positive regulation of stomatal opening(GO:1902458) |
| 0.0 | 0.4 | GO:2000896 | amylopectin biosynthetic process(GO:0010021) amylopectin metabolic process(GO:2000896) |
| 0.0 | 0.5 | GO:0090332 | stomatal closure(GO:0090332) |
| 0.0 | 0.7 | GO:2000028 | regulation of photoperiodism, flowering(GO:2000028) |
| 0.0 | 1.2 | GO:0006606 | protein import into nucleus(GO:0006606) protein targeting to nucleus(GO:0044744) |
| 0.0 | 0.8 | GO:0006383 | transcription from RNA polymerase III promoter(GO:0006383) |
| 0.0 | 0.2 | GO:0031118 | rRNA pseudouridine synthesis(GO:0031118) |
| 0.0 | 0.7 | GO:0007034 | vacuolar transport(GO:0007034) |
| 0.0 | 0.3 | GO:0043966 | histone H3 acetylation(GO:0043966) |
| 0.0 | 0.4 | GO:0006406 | mRNA export from nucleus(GO:0006406) mRNA transport(GO:0051028) mRNA-containing ribonucleoprotein complex export from nucleus(GO:0071427) |
| 0.0 | 4.0 | GO:0006457 | protein folding(GO:0006457) |
| 0.0 | 0.1 | GO:0010387 | COP9 signalosome assembly(GO:0010387) |
| 0.0 | 0.3 | GO:0050821 | protein stabilization(GO:0050821) |
| 0.0 | 0.3 | GO:0045039 | protein import into mitochondrial inner membrane(GO:0045039) |
| 0.0 | 0.2 | GO:0060151 | Golgi localization(GO:0051645) peroxisome localization(GO:0060151) |
| 0.0 | 0.3 | GO:0010222 | stem vascular tissue pattern formation(GO:0010222) |
| 0.0 | 0.6 | GO:0046352 | disaccharide catabolic process(GO:0046352) |
| 0.0 | 0.2 | GO:0043484 | regulation of RNA splicing(GO:0043484) |
| 0.0 | 0.7 | GO:0006672 | ceramide metabolic process(GO:0006672) |
| 0.0 | 0.7 | GO:0030641 | cellular monovalent inorganic cation homeostasis(GO:0030004) regulation of cellular pH(GO:0030641) regulation of intracellular pH(GO:0051453) |
| 0.0 | 2.1 | GO:0048544 | cell recognition(GO:0008037) recognition of pollen(GO:0048544) |
| 0.0 | 0.4 | GO:0070940 | dephosphorylation of RNA polymerase II C-terminal domain(GO:0070940) |
| 0.0 | 0.6 | GO:0016104 | triterpenoid biosynthetic process(GO:0016104) |
| 0.0 | 0.2 | GO:0007584 | response to nutrient(GO:0007584) |
| 0.0 | 0.2 | GO:0048354 | mucilage biosynthetic process involved in seed coat development(GO:0048354) |
| 0.0 | 0.5 | GO:0018401 | protein hydroxylation(GO:0018126) peptidyl-proline hydroxylation to 4-hydroxy-L-proline(GO:0018401) 4-hydroxyproline metabolic process(GO:0019471) peptidyl-proline hydroxylation(GO:0019511) |
| 0.0 | 0.3 | GO:0009405 | pathogenesis(GO:0009405) |
| 0.0 | 0.4 | GO:0034063 | stress granule assembly(GO:0034063) |
| 0.0 | 0.3 | GO:0006086 | acetyl-CoA biosynthetic process from pyruvate(GO:0006086) |
| 0.0 | 2.0 | GO:0006875 | cellular metal ion homeostasis(GO:0006875) |
| 0.0 | 0.1 | GO:0006409 | tRNA export from nucleus(GO:0006409) tRNA transport(GO:0051031) tRNA-containing ribonucleoprotein complex export from nucleus(GO:0071431) |
| 0.0 | 0.2 | GO:0002683 | negative regulation of immune system process(GO:0002683) |
| 0.0 | 0.2 | GO:0042357 | thiamine diphosphate biosynthetic process(GO:0009229) thiamine diphosphate metabolic process(GO:0042357) |
| 0.0 | 0.5 | GO:0006002 | fructose 6-phosphate metabolic process(GO:0006002) |
| 0.0 | 0.1 | GO:0016110 | tetraterpenoid catabolic process(GO:0016110) carotenoid catabolic process(GO:0016118) xanthophyll catabolic process(GO:0016124) |
| 0.0 | 0.0 | GO:0016584 | nucleosome positioning(GO:0016584) |
| 0.0 | 0.3 | GO:0006121 | mitochondrial electron transport, succinate to ubiquinone(GO:0006121) |
| 0.0 | 0.2 | GO:0010048 | vernalization response(GO:0010048) |
| 0.0 | 0.1 | GO:0010220 | positive regulation of vernalization response(GO:0010220) |
| 0.0 | 0.4 | GO:0030490 | maturation of SSU-rRNA(GO:0030490) |
| 0.0 | 0.1 | GO:0008615 | pyridoxine biosynthetic process(GO:0008615) |
| 0.0 | 2.6 | GO:0010228 | vegetative to reproductive phase transition of meristem(GO:0010228) |
| 0.0 | 0.3 | GO:0006734 | NADH metabolic process(GO:0006734) |
| 0.0 | 0.4 | GO:0033356 | UDP-L-arabinose metabolic process(GO:0033356) |
| 0.0 | 0.1 | GO:0006535 | cysteine biosynthetic process from serine(GO:0006535) |
| 0.0 | 0.4 | GO:0070588 | calcium ion transmembrane transport(GO:0070588) |
| 0.0 | 0.3 | GO:0098754 | detoxification(GO:0098754) |
| 0.0 | 0.0 | GO:0010452 | histone H3-K36 methylation(GO:0010452) |
| 0.0 | 4.1 | GO:0046777 | protein autophosphorylation(GO:0046777) |
| 0.0 | 2.4 | GO:0000398 | mRNA splicing, via spliceosome(GO:0000398) |
| 0.0 | 0.3 | GO:0000394 | RNA splicing, via endonucleolytic cleavage and ligation(GO:0000394) |
| 0.0 | 0.4 | GO:0006538 | glutamate catabolic process(GO:0006538) |
| 0.0 | 0.1 | GO:0046493 | lipid A biosynthetic process(GO:0009245) lipid A metabolic process(GO:0046493) lipooligosaccharide metabolic process(GO:1901269) lipooligosaccharide biosynthetic process(GO:1901271) |
| 0.0 | 0.2 | GO:0042776 | mitochondrial ATP synthesis coupled proton transport(GO:0042776) |
| 0.0 | 0.1 | GO:0016925 | protein sumoylation(GO:0016925) |
| 0.0 | 0.3 | GO:0006857 | oligopeptide transport(GO:0006857) peptide transport(GO:0015833) |
| 0.0 | 0.1 | GO:0010258 | NADH dehydrogenase complex (plastoquinone) assembly(GO:0010258) |
| 0.0 | 1.2 | GO:0009624 | response to nematode(GO:0009624) |
| 0.0 | 0.2 | GO:0050829 | defense response to Gram-negative bacterium(GO:0050829) |
| 0.0 | 5.5 | GO:0015031 | protein transport(GO:0015031) |
| 0.0 | 0.2 | GO:0048766 | root hair initiation(GO:0048766) |
| 0.0 | 0.7 | GO:0034599 | cellular response to oxidative stress(GO:0034599) |
| 0.0 | 0.1 | GO:0030974 | thiamine pyrophosphate transport(GO:0030974) vitamin transmembrane transport(GO:0035461) azole transport(GO:0045117) |
| 0.0 | 0.1 | GO:0019695 | choline metabolic process(GO:0019695) |
| 0.0 | 0.9 | GO:0006511 | ubiquitin-dependent protein catabolic process(GO:0006511) |
| 0.0 | 0.1 | GO:0080058 | protein deglutathionylation(GO:0080058) |
| 0.0 | 0.1 | GO:0080186 | developmental vegetative growth(GO:0080186) |
| 0.0 | 1.4 | GO:0042594 | response to starvation(GO:0042594) |
| 0.0 | 0.1 | GO:1901371 | regulation of leaf morphogenesis(GO:1901371) |
| 0.0 | 0.1 | GO:0009435 | NAD biosynthetic process(GO:0009435) |
| 0.0 | 0.4 | GO:0009695 | jasmonic acid biosynthetic process(GO:0009695) |
| 0.0 | 0.0 | GO:0033478 | UDP-rhamnose biosynthetic process(GO:0010253) UDP-rhamnose metabolic process(GO:0033478) |
| 0.0 | 0.1 | GO:0006285 | base-excision repair, AP site formation(GO:0006285) DNA dealkylation involved in DNA repair(GO:0006307) |
| 0.0 | 0.3 | GO:0010229 | inflorescence development(GO:0010229) |
| 0.0 | 0.0 | GO:1900109 | histone H3-K9 dimethylation(GO:0036123) regulation of histone H3-K9 dimethylation(GO:1900109) |
| 0.0 | 0.4 | GO:0034314 | Arp2/3 complex-mediated actin nucleation(GO:0034314) |
| 0.0 | 0.3 | GO:0031124 | mRNA 3'-end processing(GO:0031124) |
| 0.0 | 0.1 | GO:0031572 | mitotic G2 DNA damage checkpoint(GO:0007095) G2 DNA damage checkpoint(GO:0031572) |
| 0.0 | 0.2 | GO:0031167 | rRNA methylation(GO:0031167) |
| 0.0 | 0.1 | GO:0070070 | proton-transporting V-type ATPase complex assembly(GO:0070070) |
| 0.0 | 0.2 | GO:0009082 | branched-chain amino acid biosynthetic process(GO:0009082) |
| 0.0 | 0.2 | GO:0006122 | mitochondrial electron transport, ubiquinol to cytochrome c(GO:0006122) |
| 0.0 | 0.8 | GO:0006413 | translational initiation(GO:0006413) |
| 0.0 | 0.1 | GO:0071486 | response to UV-A(GO:0070141) cellular response to high light intensity(GO:0071486) cellular response to UV-A(GO:0071492) |
| 0.0 | 0.3 | GO:0006298 | mismatch repair(GO:0006298) |
| 0.0 | 0.2 | GO:0007105 | preprophase band assembly(GO:0000913) cytokinesis, site selection(GO:0007105) mitotic cytokinesis, site selection(GO:1902408) |
| 0.0 | 0.1 | GO:0009800 | cinnamic acid biosynthetic process(GO:0009800) |
| 0.0 | 0.2 | GO:0006354 | DNA-templated transcription, elongation(GO:0006354) |
| 0.0 | 0.1 | GO:0009972 | cytidine catabolic process(GO:0006216) cytidine deamination(GO:0009972) cytidine metabolic process(GO:0046087) |
| 0.0 | 1.6 | GO:0006470 | protein dephosphorylation(GO:0006470) |
| 0.0 | 0.2 | GO:0010212 | response to ionizing radiation(GO:0010212) |
| 0.0 | 0.0 | GO:0071963 | establishment or maintenance of cell polarity regulating cell shape(GO:0071963) regulation of establishment or maintenance of cell polarity regulating cell shape(GO:2000769) |
| 0.0 | 0.1 | GO:0006777 | Mo-molybdopterin cofactor biosynthetic process(GO:0006777) Mo-molybdopterin cofactor metabolic process(GO:0019720) molybdopterin cofactor biosynthetic process(GO:0032324) molybdopterin cofactor metabolic process(GO:0043545) prosthetic group metabolic process(GO:0051189) |
| 0.0 | 1.5 | GO:0043413 | protein glycosylation(GO:0006486) macromolecule glycosylation(GO:0043413) |
| 0.0 | 0.5 | GO:0002181 | cytoplasmic translation(GO:0002181) |
| 0.0 | 0.3 | GO:0007186 | G-protein coupled receptor signaling pathway(GO:0007186) |
| 0.0 | 0.0 | GO:0008295 | spermidine biosynthetic process(GO:0008295) |
| 0.0 | 0.2 | GO:0006415 | translational termination(GO:0006415) |
| 0.0 | 0.1 | GO:1903830 | magnesium ion transmembrane transport(GO:1903830) |
| 0.0 | 0.5 | GO:0034605 | cellular response to heat(GO:0034605) |
| 0.0 | 0.3 | GO:0009247 | glycolipid biosynthetic process(GO:0009247) |
| 0.0 | 0.4 | GO:0000302 | response to reactive oxygen species(GO:0000302) |
| 0.0 | 0.1 | GO:0042128 | nitrate metabolic process(GO:0042126) nitrate assimilation(GO:0042128) |
| 0.0 | 0.1 | GO:0051555 | flavone biosynthetic process(GO:0051553) flavonol biosynthetic process(GO:0051555) |
| 0.0 | 0.4 | GO:0010150 | leaf senescence(GO:0010150) |
| 0.0 | 0.3 | GO:0090305 | nucleic acid phosphodiester bond hydrolysis(GO:0090305) |
| 0.0 | 0.0 | GO:0043547 | positive regulation of GTPase activity(GO:0043547) |
| 0.0 | 0.1 | GO:2000105 | positive regulation of DNA endoreduplication(GO:0032877) positive regulation of DNA-dependent DNA replication(GO:2000105) |
| 0.0 | 0.1 | GO:0031123 | RNA 3'-end processing(GO:0031123) |
| 0.0 | 0.1 | GO:0017004 | cytochrome complex assembly(GO:0017004) |
Gene overrepresentation in cellular component category:
| Log-likelihood per target | Total log-likelihood | Term | Description |
|---|---|---|---|
| 0.5 | 1.8 | GO:0034663 | endoplasmic reticulum chaperone complex(GO:0034663) |
| 0.4 | 1.2 | GO:0005775 | vacuolar lumen(GO:0005775) |
| 0.4 | 0.4 | GO:0034702 | ion channel complex(GO:0034702) cation channel complex(GO:0034703) |
| 0.4 | 2.2 | GO:0031205 | endoplasmic reticulum Sec complex(GO:0031205) |
| 0.3 | 2.0 | GO:0000153 | cytoplasmic ubiquitin ligase complex(GO:0000153) |
| 0.3 | 4.9 | GO:0016602 | CCAAT-binding factor complex(GO:0016602) |
| 0.2 | 0.7 | GO:0031417 | N-terminal protein acetyltransferase complex(GO:0031414) NatC complex(GO:0031417) |
| 0.2 | 0.5 | GO:0008278 | cohesin complex(GO:0008278) |
| 0.2 | 0.9 | GO:0034715 | pICln-Sm protein complex(GO:0034715) |
| 0.2 | 3.6 | GO:0000786 | nucleosome(GO:0000786) |
| 0.2 | 0.8 | GO:0000220 | vacuolar proton-transporting V-type ATPase, V0 domain(GO:0000220) |
| 0.2 | 2.0 | GO:0010168 | ER body(GO:0010168) |
| 0.2 | 0.6 | GO:0030874 | nucleolar chromatin(GO:0030874) |
| 0.2 | 0.7 | GO:0097550 | transcriptional preinitiation complex(GO:0097550) |
| 0.2 | 1.6 | GO:0000813 | ESCRT I complex(GO:0000813) |
| 0.2 | 0.7 | GO:0031932 | TORC2 complex(GO:0031932) |
| 0.2 | 1.3 | GO:0031371 | ubiquitin conjugating enzyme complex(GO:0031371) UBC13-MMS2 complex(GO:0031372) |
| 0.2 | 0.5 | GO:0034274 | Atg12-Atg5-Atg16 complex(GO:0034274) |
| 0.2 | 0.7 | GO:0005853 | eukaryotic translation elongation factor 1 complex(GO:0005853) |
| 0.2 | 0.5 | GO:0070847 | core mediator complex(GO:0070847) |
| 0.2 | 0.7 | GO:0032807 | DNA ligase IV complex(GO:0032807) |
| 0.2 | 0.5 | GO:0005814 | centrosome(GO:0005813) centriole(GO:0005814) |
| 0.2 | 0.5 | GO:0005674 | transcription factor TFIIF complex(GO:0005674) |
| 0.2 | 0.6 | GO:0005967 | mitochondrial pyruvate dehydrogenase complex(GO:0005967) |
| 0.2 | 2.4 | GO:0005779 | integral component of peroxisomal membrane(GO:0005779) intrinsic component of peroxisomal membrane(GO:0031231) |
| 0.2 | 1.5 | GO:0016272 | prefoldin complex(GO:0016272) |
| 0.2 | 0.5 | GO:0009514 | glyoxysome(GO:0009514) |
| 0.2 | 0.9 | GO:0070552 | BRISC complex(GO:0070552) |
| 0.1 | 6.3 | GO:0009504 | cell plate(GO:0009504) |
| 0.1 | 0.4 | GO:0044452 | nucleolar part(GO:0044452) |
| 0.1 | 0.6 | GO:0000811 | GINS complex(GO:0000811) |
| 0.1 | 0.3 | GO:0031931 | TORC1 complex(GO:0031931) TOR complex(GO:0038201) |
| 0.1 | 1.4 | GO:0005844 | polysome(GO:0005844) |
| 0.1 | 0.5 | GO:0030681 | nucleolar ribonuclease P complex(GO:0005655) multimeric ribonuclease P complex(GO:0030681) |
| 0.1 | 0.8 | GO:0034098 | VCP-NPL4-UFD1 AAA ATPase complex(GO:0034098) |
| 0.1 | 4.5 | GO:0031228 | integral component of Golgi membrane(GO:0030173) intrinsic component of Golgi membrane(GO:0031228) |
| 0.1 | 0.7 | GO:0005776 | autophagosome(GO:0005776) |
| 0.1 | 0.6 | GO:0030897 | HOPS complex(GO:0030897) |
| 0.1 | 0.5 | GO:1902911 | serine/threonine protein kinase complex(GO:1902554) protein kinase complex(GO:1902911) |
| 0.1 | 1.0 | GO:0005697 | telomerase holoenzyme complex(GO:0005697) |
| 0.1 | 1.9 | GO:0005769 | early endosome(GO:0005769) |
| 0.1 | 1.4 | GO:0000974 | Prp19 complex(GO:0000974) |
| 0.1 | 1.0 | GO:0005956 | protein kinase CK2 complex(GO:0005956) |
| 0.1 | 0.7 | GO:0055038 | recycling endosome membrane(GO:0055038) |
| 0.1 | 0.3 | GO:0097196 | Shu complex(GO:0097196) |
| 0.1 | 1.1 | GO:0031428 | box C/D snoRNP complex(GO:0031428) |
| 0.1 | 2.7 | GO:0035097 | histone methyltransferase complex(GO:0035097) |
| 0.1 | 0.5 | GO:0001401 | mitochondrial sorting and assembly machinery complex(GO:0001401) |
| 0.1 | 0.2 | GO:0030133 | transport vesicle(GO:0030133) |
| 0.1 | 0.8 | GO:0033588 | Elongator holoenzyme complex(GO:0033588) |
| 0.1 | 0.3 | GO:0000814 | ESCRT II complex(GO:0000814) |
| 0.1 | 0.8 | GO:0005834 | heterotrimeric G-protein complex(GO:0005834) |
| 0.1 | 1.6 | GO:0030125 | clathrin vesicle coat(GO:0030125) clathrin-coated vesicle membrane(GO:0030665) |
| 0.1 | 1.2 | GO:0030904 | retromer complex(GO:0030904) |
| 0.1 | 7.2 | GO:0019005 | SCF ubiquitin ligase complex(GO:0019005) |
| 0.1 | 0.7 | GO:0005787 | signal peptidase complex(GO:0005787) |
| 0.1 | 0.7 | GO:0042406 | extrinsic component of endoplasmic reticulum membrane(GO:0042406) |
| 0.1 | 0.3 | GO:1990112 | RQC complex(GO:1990112) |
| 0.1 | 0.4 | GO:0034272 | phosphatidylinositol 3-kinase complex(GO:0005942) phosphatidylinositol 3-kinase complex, class III, type I(GO:0034271) phosphatidylinositol 3-kinase complex, class III, type II(GO:0034272) phosphatidylinositol 3-kinase complex, class III(GO:0035032) |
| 0.1 | 0.9 | GO:0090544 | SWI/SNF complex(GO:0016514) BAF-type complex(GO:0090544) |
| 0.1 | 0.9 | GO:0030136 | clathrin-coated vesicle(GO:0030136) |
| 0.1 | 1.2 | GO:0030687 | preribosome, large subunit precursor(GO:0030687) |
| 0.1 | 0.7 | GO:0008250 | oligosaccharyltransferase complex(GO:0008250) |
| 0.1 | 0.3 | GO:0045495 | P granule(GO:0043186) pole plasm(GO:0045495) germ plasm(GO:0060293) |
| 0.1 | 1.1 | GO:0005665 | DNA-directed RNA polymerase II, core complex(GO:0005665) |
| 0.1 | 0.5 | GO:0071014 | post-mRNA release spliceosomal complex(GO:0071014) |
| 0.1 | 0.6 | GO:0090395 | plant cell papilla(GO:0090395) |
| 0.1 | 0.8 | GO:0030118 | clathrin coat(GO:0030118) |
| 0.1 | 1.2 | GO:0033179 | proton-transporting V-type ATPase, V0 domain(GO:0033179) |
| 0.1 | 0.8 | GO:0005675 | holo TFIIH complex(GO:0005675) carboxy-terminal domain protein kinase complex(GO:0032806) |
| 0.1 | 5.1 | GO:0009707 | chloroplast outer membrane(GO:0009707) |
| 0.1 | 0.3 | GO:0005846 | nuclear cap binding complex(GO:0005846) |
| 0.1 | 0.9 | GO:0043230 | extracellular organelle(GO:0043230) extracellular exosome(GO:0070062) extracellular vesicle(GO:1903561) |
| 0.1 | 0.9 | GO:0030014 | CCR4-NOT complex(GO:0030014) |
| 0.1 | 0.3 | GO:0035101 | FACT complex(GO:0035101) |
| 0.1 | 0.3 | GO:0000791 | euchromatin(GO:0000791) |
| 0.1 | 0.7 | GO:0030127 | COPII vesicle coat(GO:0030127) |
| 0.1 | 0.3 | GO:0000110 | nucleotide-excision repair factor 1 complex(GO:0000110) |
| 0.1 | 0.8 | GO:0005741 | mitochondrial outer membrane(GO:0005741) |
| 0.1 | 0.7 | GO:0030688 | preribosome, small subunit precursor(GO:0030688) |
| 0.1 | 0.7 | GO:0070390 | transcription export complex 2(GO:0070390) |
| 0.1 | 1.3 | GO:0070461 | SAGA-type complex(GO:0070461) |
| 0.1 | 1.6 | GO:0031304 | intrinsic component of mitochondrial inner membrane(GO:0031304) |
| 0.1 | 0.7 | GO:0005788 | endoplasmic reticulum lumen(GO:0005788) |
| 0.1 | 4.1 | GO:0030176 | integral component of endoplasmic reticulum membrane(GO:0030176) |
| 0.1 | 2.8 | GO:0000137 | Golgi cis cisterna(GO:0000137) |
| 0.1 | 0.5 | GO:0005968 | Rab-protein geranylgeranyltransferase complex(GO:0005968) |
| 0.1 | 0.7 | GO:0031902 | late endosome membrane(GO:0031902) |
| 0.1 | 1.5 | GO:0009986 | cell surface(GO:0009986) |
| 0.1 | 1.6 | GO:0005736 | DNA-directed RNA polymerase I complex(GO:0005736) |
| 0.1 | 0.2 | GO:0005712 | chiasma(GO:0005712) |
| 0.1 | 0.8 | GO:0008180 | COP9 signalosome(GO:0008180) |
| 0.1 | 0.1 | GO:0070069 | cytochrome complex(GO:0070069) |
| 0.1 | 0.3 | GO:0016281 | eukaryotic translation initiation factor 4F complex(GO:0016281) |
| 0.1 | 0.8 | GO:0019774 | proteasome core complex, beta-subunit complex(GO:0019774) |
| 0.1 | 0.5 | GO:0005664 | origin recognition complex(GO:0000808) nuclear origin of replication recognition complex(GO:0005664) |
| 0.1 | 0.8 | GO:0005744 | mitochondrial inner membrane presequence translocase complex(GO:0005744) |
| 0.1 | 0.5 | GO:0009840 | chloroplastic endopeptidase Clp complex(GO:0009840) |
| 0.1 | 0.7 | GO:0005832 | chaperonin-containing T-complex(GO:0005832) |
| 0.1 | 0.3 | GO:0042645 | mitochondrial nucleoid(GO:0042645) |
| 0.1 | 0.5 | GO:0019897 | extrinsic component of plasma membrane(GO:0019897) |
| 0.1 | 1.3 | GO:0031307 | intrinsic component of mitochondrial outer membrane(GO:0031306) integral component of mitochondrial outer membrane(GO:0031307) |
| 0.1 | 0.2 | GO:0042709 | succinate-CoA ligase complex(GO:0042709) |
| 0.1 | 0.3 | GO:0043036 | chloroplast starch grain(GO:0009569) starch grain(GO:0043036) |
| 0.1 | 1.1 | GO:0005666 | DNA-directed RNA polymerase III complex(GO:0005666) |
| 0.1 | 0.3 | GO:0016471 | vacuolar proton-transporting V-type ATPase complex(GO:0016471) |
| 0.1 | 0.4 | GO:0031588 | nucleotide-activated protein kinase complex(GO:0031588) |
| 0.1 | 2.0 | GO:0031201 | SNARE complex(GO:0031201) |
| 0.1 | 0.4 | GO:0005732 | small nucleolar ribonucleoprotein complex(GO:0005732) |
| 0.1 | 5.5 | GO:0016604 | nuclear body(GO:0016604) |
| 0.1 | 0.4 | GO:0000164 | protein phosphatase type 1 complex(GO:0000164) |
| 0.1 | 0.5 | GO:0000109 | nucleotide-excision repair complex(GO:0000109) |
| 0.1 | 0.9 | GO:0000784 | nuclear chromosome, telomeric region(GO:0000784) |
| 0.1 | 0.5 | GO:0031597 | cytosolic proteasome complex(GO:0031597) |
| 0.1 | 3.0 | GO:0000139 | Golgi membrane(GO:0000139) |
| 0.1 | 0.1 | GO:0005795 | Golgi stack(GO:0005795) |
| 0.1 | 0.7 | GO:0045257 | mitochondrial respiratory chain complex II, succinate dehydrogenase complex (ubiquinone)(GO:0005749) succinate dehydrogenase complex (ubiquinone)(GO:0045257) fumarate reductase complex(GO:0045283) |
| 0.1 | 0.2 | GO:0000418 | DNA-directed RNA polymerase IV complex(GO:0000418) |
| 0.1 | 0.7 | GO:0005742 | mitochondrial outer membrane translocase complex(GO:0005742) |
| 0.1 | 1.0 | GO:0031970 | organelle envelope lumen(GO:0031970) |
| 0.1 | 0.3 | GO:0033178 | proton-transporting two-sector ATPase complex, catalytic domain(GO:0033178) |
| 0.1 | 1.8 | GO:0032040 | small-subunit processome(GO:0032040) |
| 0.0 | 0.2 | GO:0034657 | GID complex(GO:0034657) |
| 0.0 | 0.6 | GO:0005763 | mitochondrial small ribosomal subunit(GO:0005763) |
| 0.0 | 0.2 | GO:0071541 | eukaryotic translation initiation factor 3 complex, eIF3m(GO:0071541) |
| 0.0 | 0.8 | GO:0010494 | cytoplasmic stress granule(GO:0010494) |
| 0.0 | 0.8 | GO:0005689 | U12-type spliceosomal complex(GO:0005689) |
| 0.0 | 0.6 | GO:0008541 | proteasome regulatory particle, lid subcomplex(GO:0008541) |
| 0.0 | 2.1 | GO:0005802 | trans-Golgi network(GO:0005802) |
| 0.0 | 1.7 | GO:0000502 | proteasome complex(GO:0000502) |
| 0.0 | 0.2 | GO:0034518 | mRNA cap binding complex(GO:0005845) RNA cap binding complex(GO:0034518) |
| 0.0 | 0.2 | GO:0030141 | secretory granule(GO:0030141) |
| 0.0 | 0.4 | GO:0033202 | Ino80 complex(GO:0031011) DNA helicase complex(GO:0033202) |
| 0.0 | 3.5 | GO:0000138 | Golgi trans cisterna(GO:0000138) |
| 0.0 | 0.3 | GO:0005884 | actin filament(GO:0005884) |
| 0.0 | 1.0 | GO:0000159 | protein phosphatase type 2A complex(GO:0000159) |
| 0.0 | 0.4 | GO:0005750 | mitochondrial respiratory chain complex III(GO:0005750) respiratory chain complex III(GO:0045275) |
| 0.0 | 1.5 | GO:0005770 | late endosome(GO:0005770) |
| 0.0 | 0.2 | GO:0030915 | Smc5-Smc6 complex(GO:0030915) |
| 0.0 | 0.2 | GO:0016363 | nuclear matrix(GO:0016363) |
| 0.0 | 46.8 | GO:0005773 | vacuole(GO:0005773) |
| 0.0 | 0.4 | GO:0008023 | transcription elongation factor complex(GO:0008023) |
| 0.0 | 0.4 | GO:0016591 | DNA-directed RNA polymerase II, holoenzyme(GO:0016591) |
| 0.0 | 0.1 | GO:0032301 | MutSalpha complex(GO:0032301) |
| 0.0 | 0.4 | GO:0031519 | PcG protein complex(GO:0031519) |
| 0.0 | 0.1 | GO:0071007 | U2-type catalytic step 2 spliceosome(GO:0071007) |
| 0.0 | 0.8 | GO:0005762 | mitochondrial large ribosomal subunit(GO:0005762) |
| 0.0 | 0.7 | GO:0030427 | site of polarized growth(GO:0030427) |
| 0.0 | 0.2 | GO:0031907 | peroxisomal matrix(GO:0005782) microbody lumen(GO:0031907) |
| 0.0 | 0.4 | GO:0031985 | Golgi cisterna(GO:0031985) |
| 0.0 | 0.3 | GO:0045252 | oxoglutarate dehydrogenase complex(GO:0045252) |
| 0.0 | 0.4 | GO:0005849 | mRNA cleavage factor complex(GO:0005849) |
| 0.0 | 3.2 | GO:0043656 | host(GO:0018995) host cell part(GO:0033643) host intracellular part(GO:0033646) host intracellular organelle(GO:0033647) host intracellular membrane-bounded organelle(GO:0033648) host cell nucleus(GO:0042025) intracellular region of host(GO:0043656) host cell(GO:0043657) other organism(GO:0044215) other organism cell(GO:0044216) other organism part(GO:0044217) |
| 0.0 | 2.9 | GO:0000790 | nuclear chromatin(GO:0000790) |
| 0.0 | 7.9 | GO:0042579 | peroxisome(GO:0005777) microbody(GO:0042579) |
| 0.0 | 2.5 | GO:0005667 | transcription factor complex(GO:0005667) |
| 0.0 | 0.2 | GO:1902562 | NuA4 histone acetyltransferase complex(GO:0035267) H4/H2A histone acetyltransferase complex(GO:0043189) H4 histone acetyltransferase complex(GO:1902562) |
| 0.0 | 4.6 | GO:0000151 | ubiquitin ligase complex(GO:0000151) |
| 0.0 | 0.2 | GO:0044613 | nuclear pore central transport channel(GO:0044613) |
| 0.0 | 0.4 | GO:0046540 | U4/U6 x U5 tri-snRNP complex(GO:0046540) |
| 0.0 | 0.6 | GO:0035770 | ribonucleoprotein granule(GO:0035770) cytoplasmic ribonucleoprotein granule(GO:0036464) |
| 0.0 | 0.9 | GO:0016592 | mediator complex(GO:0016592) |
| 0.0 | 0.0 | GO:0031965 | nuclear membrane(GO:0031965) |
| 0.0 | 5.2 | GO:0005730 | nucleolus(GO:0005730) |
| 0.0 | 0.1 | GO:0031356 | intrinsic component of plastid inner membrane(GO:0031352) integral component of plastid inner membrane(GO:0031353) intrinsic component of chloroplast inner membrane(GO:0031356) integral component of chloroplast inner membrane(GO:0031357) |
| 0.0 | 0.2 | GO:0000145 | exocyst(GO:0000145) |
| 0.0 | 0.1 | GO:0005960 | glycine cleavage complex(GO:0005960) |
| 0.0 | 0.1 | GO:0031248 | protein acetyltransferase complex(GO:0031248) acetyltransferase complex(GO:1902493) |
| 0.0 | 0.2 | GO:0031209 | SCAR complex(GO:0031209) |
| 0.0 | 0.1 | GO:0032155 | equatorial microtubule organizing center(GO:0000923) cell division site part(GO:0032155) |
| 0.0 | 0.0 | GO:0045254 | pyruvate dehydrogenase complex(GO:0045254) |
| 0.0 | 10.8 | GO:0005783 | endoplasmic reticulum(GO:0005783) |
| 0.0 | 0.1 | GO:0000178 | exosome (RNase complex)(GO:0000178) |
| 0.0 | 34.4 | GO:0005829 | cytosol(GO:0005829) |
| 0.0 | 0.2 | GO:0000776 | kinetochore(GO:0000776) |
| 0.0 | 0.1 | GO:1902555 | endoribonuclease complex(GO:1902555) |
| 0.0 | 0.3 | GO:0005759 | mitochondrial matrix(GO:0005759) |
Gene overrepresentation in molecular function category:
| Log-likelihood per target | Total log-likelihood | Term | Description |
|---|---|---|---|
| 0.9 | 2.8 | GO:0052625 | 4-aminobenzoate amino acid synthetase activity(GO:0052625) benzoate amino acid synthetase activity(GO:0052626) vanillate amino acid synthetase activity(GO:0052627) 4-hydroxybenzoate amino acid synthetase activity(GO:0052628) |
| 0.7 | 2.2 | GO:0033984 | indole-3-glycerol-phosphate lyase activity(GO:0033984) |
| 0.7 | 2.8 | GO:0051980 | iron chelate transmembrane transporter activity(GO:0015603) iron-nicotianamine transmembrane transporter activity(GO:0051980) |
| 0.6 | 2.5 | GO:0003852 | 2-isopropylmalate synthase activity(GO:0003852) |
| 0.6 | 3.7 | GO:0004838 | L-tyrosine:2-oxoglutarate aminotransferase activity(GO:0004838) L-tyrosine aminotransferase activity(GO:0070547) |
| 0.6 | 1.8 | GO:0035605 | peptidyl-cysteine S-nitrosylase activity(GO:0035605) |
| 0.6 | 0.6 | GO:0051019 | mitogen-activated protein kinase binding(GO:0051019) |
| 0.5 | 2.1 | GO:0030410 | nicotianamine synthase activity(GO:0030410) |
| 0.5 | 2.0 | GO:0005432 | calcium:sodium antiporter activity(GO:0005432) |
| 0.5 | 1.5 | GO:0050736 | O-malonyltransferase activity(GO:0050736) |
| 0.5 | 1.8 | GO:0008301 | DNA binding, bending(GO:0008301) |
| 0.5 | 3.2 | GO:0016781 | phosphotransferase activity, paired acceptors(GO:0016781) |
| 0.4 | 1.8 | GO:0031516 | far-red light photoreceptor activity(GO:0031516) |
| 0.4 | 1.3 | GO:0051669 | levanase activity(GO:0031219) fructan beta-fructosidase activity(GO:0051669) |
| 0.4 | 3.0 | GO:0080061 | nitrilase activity(GO:0000257) hydrolase activity, acting on carbon-nitrogen (but not peptide) bonds, in nitriles(GO:0016815) nitrile hydratase activity(GO:0018822) indole-3-acetonitrile nitrilase activity(GO:0080061) |
| 0.4 | 2.1 | GO:0016768 | spermine synthase activity(GO:0016768) |
| 0.4 | 1.6 | GO:0010309 | acireductone dioxygenase [iron(II)-requiring] activity(GO:0010309) |
| 0.4 | 2.8 | GO:0031492 | nucleosomal DNA binding(GO:0031492) |
| 0.4 | 0.8 | GO:0047635 | L-alanine:2-oxoglutarate aminotransferase activity(GO:0004021) alanine-oxo-acid transaminase activity(GO:0047635) |
| 0.4 | 1.1 | GO:0030275 | LRR domain binding(GO:0030275) |
| 0.4 | 1.1 | GO:0047150 | S-adenosylmethionine-homocysteine S-methyltransferase activity(GO:0008898) betaine-homocysteine S-methyltransferase activity(GO:0047150) |
| 0.4 | 2.1 | GO:0030544 | Hsp70 protein binding(GO:0030544) |
| 0.4 | 0.4 | GO:0005034 | osmosensor activity(GO:0005034) |
| 0.4 | 1.4 | GO:0010296 | prenylcysteine methylesterase activity(GO:0010296) |
| 0.3 | 1.0 | GO:0046480 | galactolipid galactosyltransferase activity(GO:0046480) |
| 0.3 | 1.0 | GO:0003995 | acyl-CoA dehydrogenase activity(GO:0003995) |
| 0.3 | 2.0 | GO:0015505 | allantoin uptake transmembrane transporter activity(GO:0005274) uracil:cation symporter activity(GO:0015505) uptake transmembrane transporter activity(GO:0015563) |
| 0.3 | 1.3 | GO:0052593 | tryptamine:oxygen oxidoreductase (deaminating) activity(GO:0052593) aminoacetone:oxygen oxidoreductase(deaminating) activity(GO:0052594) aliphatic-amine oxidase activity(GO:0052595) phenethylamine:oxygen oxidoreductase (deaminating) activity(GO:0052596) |
| 0.3 | 3.0 | GO:0009882 | blue light photoreceptor activity(GO:0009882) |
| 0.3 | 1.0 | GO:0047364 | desulfoglucosinolate sulfotransferase activity(GO:0047364) |
| 0.3 | 3.2 | GO:0008113 | peptide-methionine (S)-S-oxide reductase activity(GO:0008113) |
| 0.3 | 1.9 | GO:0019144 | ADP-sugar diphosphatase activity(GO:0019144) ADP-ribose pyrophosphohydrolase activity(GO:0080041) |
| 0.3 | 0.9 | GO:0052692 | alpha-galactosidase activity(GO:0004557) raffinose alpha-galactosidase activity(GO:0052692) |
| 0.3 | 0.9 | GO:0004353 | glutamate dehydrogenase [NAD(P)+] activity(GO:0004353) |
| 0.3 | 1.2 | GO:0004534 | 5'-3' exoribonuclease activity(GO:0004534) |
| 0.3 | 1.8 | GO:0005483 | soluble NSF attachment protein activity(GO:0005483) |
| 0.3 | 1.2 | GO:0000268 | peroxisome targeting sequence binding(GO:0000268) |
| 0.3 | 1.2 | GO:0016751 | dihydrolipoyllysine-residue succinyltransferase activity(GO:0004149) succinyltransferase activity(GO:0016748) S-succinyltransferase activity(GO:0016751) |
| 0.3 | 0.9 | GO:0009671 | nitrate:proton symporter activity(GO:0009671) |
| 0.3 | 1.1 | GO:0004307 | ethanolaminephosphotransferase activity(GO:0004307) |
| 0.3 | 1.4 | GO:0005354 | galactose transmembrane transporter activity(GO:0005354) |
| 0.3 | 3.1 | GO:0008453 | alanine-glyoxylate transaminase activity(GO:0008453) |
| 0.3 | 1.6 | GO:0009041 | uridylate kinase activity(GO:0009041) |
| 0.3 | 0.8 | GO:0044540 | L-cystine L-cysteine-lyase (deaminating)(GO:0044540) |
| 0.3 | 1.3 | GO:1902417 | (+)-abscisic acid D-glucopyranosyl ester transmembrane transporter activity(GO:1902417) |
| 0.3 | 1.8 | GO:0003872 | 6-phosphofructokinase activity(GO:0003872) |
| 0.3 | 2.8 | GO:0031127 | galactoside 2-alpha-L-fucosyltransferase activity(GO:0008107) alpha-(1,2)-fucosyltransferase activity(GO:0031127) |
| 0.3 | 1.3 | GO:0030371 | translation repressor activity(GO:0030371) |
| 0.2 | 0.7 | GO:0019776 | Atg8 ligase activity(GO:0019776) |
| 0.2 | 0.7 | GO:0016979 | lipoate-protein ligase activity(GO:0016979) lipoate synthase activity(GO:0016992) |
| 0.2 | 0.7 | GO:0004750 | ribulose-phosphate 3-epimerase activity(GO:0004750) |
| 0.2 | 1.0 | GO:0019784 | NEDD8-specific protease activity(GO:0019784) |
| 0.2 | 2.0 | GO:0004566 | beta-glucuronidase activity(GO:0004566) |
| 0.2 | 0.7 | GO:0004140 | dephospho-CoA kinase activity(GO:0004140) |
| 0.2 | 2.7 | GO:0016723 | ferric-chelate reductase activity(GO:0000293) oxidoreductase activity, oxidizing metal ions, NAD or NADP as acceptor(GO:0016723) |
| 0.2 | 1.0 | GO:0004113 | cyclic-nucleotide phosphodiesterase activity(GO:0004112) 2',3'-cyclic-nucleotide 3'-phosphodiesterase activity(GO:0004113) |
| 0.2 | 1.0 | GO:0016034 | maleylacetoacetate isomerase activity(GO:0016034) |
| 0.2 | 0.7 | GO:0061575 | cyclin-dependent protein serine/threonine kinase activator activity(GO:0061575) |
| 0.2 | 4.6 | GO:0015248 | sterol transporter activity(GO:0015248) |
| 0.2 | 2.3 | GO:0005086 | ARF guanyl-nucleotide exchange factor activity(GO:0005086) |
| 0.2 | 0.7 | GO:0036009 | protein-glutamine N-methyltransferase activity(GO:0036009) histone-glutamine methyltransferase activity(GO:1990259) |
| 0.2 | 2.3 | GO:0004602 | glutathione peroxidase activity(GO:0004602) |
| 0.2 | 0.7 | GO:0000386 | second spliceosomal transesterification activity(GO:0000386) |
| 0.2 | 0.9 | GO:0046423 | allene-oxide cyclase activity(GO:0046423) |
| 0.2 | 1.1 | GO:1902387 | ceramide transporter activity(GO:0035620) sphingolipid transporter activity(GO:0046624) ceramide 1-phosphate binding(GO:1902387) ceramide 1-phosphate transporter activity(GO:1902388) |
| 0.2 | 0.7 | GO:0043425 | bHLH transcription factor binding(GO:0043425) |
| 0.2 | 1.3 | GO:0001102 | RNA polymerase II activating transcription factor binding(GO:0001102) |
| 0.2 | 0.7 | GO:0050403 | trans-zeatin O-beta-D-glucosyltransferase activity(GO:0050403) cis-zeatin O-beta-D-glucosyltransferase activity(GO:0050502) |
| 0.2 | 0.9 | GO:0043916 | DNA-7-methylguanine glycosylase activity(GO:0043916) |
| 0.2 | 3.7 | GO:0008559 | xenobiotic-transporting ATPase activity(GO:0008559) |
| 0.2 | 0.6 | GO:0004450 | isocitrate dehydrogenase (NADP+) activity(GO:0004450) |
| 0.2 | 1.5 | GO:0005459 | UDP-galactose transmembrane transporter activity(GO:0005459) |
| 0.2 | 2.3 | GO:0032453 | histone demethylase activity (H3-K4 specific)(GO:0032453) histone demethylase activity (H3-trimethyl-K4 specific)(GO:0034647) |
| 0.2 | 2.9 | GO:0004709 | MAP kinase kinase kinase activity(GO:0004709) |
| 0.2 | 1.6 | GO:0001653 | peptide receptor activity(GO:0001653) |
| 0.2 | 0.8 | GO:0070034 | telomerase RNA binding(GO:0070034) |
| 0.2 | 0.6 | GO:0019904 | protein domain specific binding(GO:0019904) |
| 0.2 | 0.6 | GO:0003986 | acetyl-CoA hydrolase activity(GO:0003986) |
| 0.2 | 0.6 | GO:0016262 | protein N-acetylglucosaminyltransferase activity(GO:0016262) |
| 0.2 | 1.0 | GO:0003680 | AT DNA binding(GO:0003680) |
| 0.2 | 0.8 | GO:0019156 | isoamylase activity(GO:0019156) |
| 0.2 | 1.0 | GO:0004594 | pantothenate kinase activity(GO:0004594) |
| 0.2 | 1.3 | GO:0033549 | MAP kinase phosphatase activity(GO:0033549) |
| 0.2 | 0.6 | GO:0004424 | imidazoleglycerol-phosphate dehydratase activity(GO:0004424) |
| 0.2 | 0.6 | GO:0070003 | threonine-type endopeptidase activity(GO:0004298) threonine-type peptidase activity(GO:0070003) |
| 0.2 | 1.3 | GO:0051139 | metal ion:proton antiporter activity(GO:0051139) |
| 0.2 | 0.6 | GO:0015185 | gamma-aminobutyric acid transmembrane transporter activity(GO:0015185) |
| 0.2 | 0.6 | GO:0016277 | [myelin basic protein]-arginine N-methyltransferase activity(GO:0016277) |
| 0.2 | 1.7 | GO:0005546 | phosphatidylinositol-4,5-bisphosphate binding(GO:0005546) |
| 0.2 | 1.1 | GO:0098599 | palmitoyl hydrolase activity(GO:0098599) |
| 0.2 | 1.1 | GO:0004567 | beta-mannosidase activity(GO:0004567) |
| 0.2 | 0.7 | GO:0015181 | arginine transmembrane transporter activity(GO:0015181) L-lysine transmembrane transporter activity(GO:0015189) |
| 0.2 | 0.7 | GO:0005315 | inorganic phosphate transmembrane transporter activity(GO:0005315) |
| 0.2 | 0.2 | GO:0051903 | S-(hydroxymethyl)glutathione dehydrogenase activity(GO:0051903) |
| 0.2 | 2.3 | GO:0009044 | xylan 1,4-beta-xylosidase activity(GO:0009044) |
| 0.2 | 0.7 | GO:1990381 | ubiquitin-specific protease binding(GO:1990381) |
| 0.2 | 0.5 | GO:0045140 | inositol phosphoceramide synthase activity(GO:0045140) |
| 0.2 | 0.7 | GO:0080103 | 4-methylthiopropyl glucosinolate S-oxygenase activity(GO:0080103) |
| 0.2 | 1.2 | GO:0060229 | phospholipase activator activity(GO:0016004) lipase activator activity(GO:0060229) |
| 0.2 | 0.8 | GO:0051740 | ethylene receptor activity(GO:0038199) ethylene binding(GO:0051740) alkene binding(GO:0072328) |
| 0.2 | 0.5 | GO:0008174 | mRNA methyltransferase activity(GO:0008174) |
| 0.2 | 0.2 | GO:1901474 | azole transmembrane transporter activity(GO:1901474) |
| 0.2 | 0.6 | GO:0005457 | GDP-fucose transmembrane transporter activity(GO:0005457) |
| 0.2 | 0.5 | GO:0008909 | isochorismate synthase activity(GO:0008909) |
| 0.2 | 0.9 | GO:0033743 | peptide-methionine (R)-S-oxide reductase activity(GO:0033743) |
| 0.2 | 0.5 | GO:0008963 | phospho-N-acetylmuramoyl-pentapeptide-transferase activity(GO:0008963) |
| 0.2 | 0.6 | GO:0070405 | ammonium ion binding(GO:0070405) |
| 0.2 | 0.5 | GO:0019136 | deoxynucleoside kinase activity(GO:0019136) |
| 0.2 | 1.2 | GO:0009916 | alternative oxidase activity(GO:0009916) |
| 0.2 | 0.5 | GO:0016661 | oxidoreductase activity, acting on other nitrogenous compounds as donors(GO:0016661) |
| 0.2 | 0.5 | GO:0046524 | sucrose-phosphate synthase activity(GO:0046524) |
| 0.2 | 1.5 | GO:0010385 | double-stranded methylated DNA binding(GO:0010385) |
| 0.1 | 0.4 | GO:0052640 | salicylic acid glucosyltransferase (glucoside-forming) activity(GO:0052640) |
| 0.1 | 1.0 | GO:0052853 | very-long-chain-(S)-2-hydroxy-acid oxidase activity(GO:0052852) long-chain-(S)-2-hydroxy-long-chain-acid oxidase activity(GO:0052853) medium-chain-(S)-2-hydroxy-acid oxidase activity(GO:0052854) |
| 0.1 | 0.9 | GO:0016886 | ligase activity, forming phosphoric ester bonds(GO:0016886) |
| 0.1 | 0.4 | GO:0010354 | homogentisate prenyltransferase activity(GO:0010354) |
| 0.1 | 0.4 | GO:0000179 | rRNA (adenine-N6,N6-)-dimethyltransferase activity(GO:0000179) |
| 0.1 | 1.0 | GO:0017112 | Rab guanyl-nucleotide exchange factor activity(GO:0017112) |
| 0.1 | 1.0 | GO:0001671 | ATPase activator activity(GO:0001671) |
| 0.1 | 2.7 | GO:0043295 | glutathione binding(GO:0043295) oligopeptide binding(GO:1900750) |
| 0.1 | 1.3 | GO:0015112 | nitrate transmembrane transporter activity(GO:0015112) |
| 0.1 | 0.8 | GO:0004416 | hydroxyacylglutathione hydrolase activity(GO:0004416) |
| 0.1 | 0.8 | GO:0003933 | GTP cyclohydrolase activity(GO:0003933) |
| 0.1 | 0.4 | GO:0035671 | enone reductase activity(GO:0035671) |
| 0.1 | 0.9 | GO:0008157 | protein phosphatase 1 binding(GO:0008157) |
| 0.1 | 1.2 | GO:0002020 | protease binding(GO:0002020) |
| 0.1 | 0.7 | GO:0015203 | polyamine transmembrane transporter activity(GO:0015203) |
| 0.1 | 0.9 | GO:0016703 | oxidoreductase activity, acting on single donors with incorporation of molecular oxygen, incorporation of one atom of oxygen (internal monooxygenases or internal mixed function oxidases)(GO:0016703) |
| 0.1 | 0.4 | GO:0015089 | high-affinity copper ion transmembrane transporter activity(GO:0015089) |
| 0.1 | 1.3 | GO:0010294 | abscisic acid glucosyltransferase activity(GO:0010294) |
| 0.1 | 0.4 | GO:0004106 | chorismate mutase activity(GO:0004106) |
| 0.1 | 0.5 | GO:0016165 | linoleate 13S-lipoxygenase activity(GO:0016165) |
| 0.1 | 2.6 | GO:0042973 | glucan endo-1,3-beta-D-glucosidase activity(GO:0042973) |
| 0.1 | 0.6 | GO:0015186 | L-glutamine transmembrane transporter activity(GO:0015186) |
| 0.1 | 6.1 | GO:0042910 | xenobiotic transporter activity(GO:0042910) |
| 0.1 | 2.6 | GO:0030276 | clathrin binding(GO:0030276) |
| 0.1 | 0.9 | GO:0050551 | myrcene synthase activity(GO:0050551) |
| 0.1 | 0.1 | GO:0004779 | sulfate adenylyltransferase activity(GO:0004779) |
| 0.1 | 1.4 | GO:0004708 | MAP kinase kinase activity(GO:0004708) |
| 0.1 | 0.4 | GO:1990380 | Lys48-specific deubiquitinase activity(GO:1990380) |
| 0.1 | 0.8 | GO:0010178 | IAA-amino acid conjugate hydrolase activity(GO:0010178) |
| 0.1 | 0.4 | GO:0004609 | phosphatidylserine decarboxylase activity(GO:0004609) |
| 0.1 | 0.5 | GO:0016882 | cyclo-ligase activity(GO:0016882) |
| 0.1 | 0.4 | GO:0016435 | rRNA (guanine) methyltransferase activity(GO:0016435) |
| 0.1 | 0.4 | GO:0016504 | peptidase activator activity(GO:0016504) |
| 0.1 | 1.4 | GO:0016813 | hydrolase activity, acting on carbon-nitrogen (but not peptide) bonds, in linear amidines(GO:0016813) |
| 0.1 | 0.3 | GO:0016906 | sterol 3-beta-glucosyltransferase activity(GO:0016906) |
| 0.1 | 0.7 | GO:0016426 | tRNA (adenine) methyltransferase activity(GO:0016426) |
| 0.1 | 0.5 | GO:0036440 | citrate (Si)-synthase activity(GO:0004108) citrate synthase activity(GO:0036440) |
| 0.1 | 0.8 | GO:0051087 | chaperone binding(GO:0051087) |
| 0.1 | 0.5 | GO:0043682 | copper-transporting ATPase activity(GO:0043682) |
| 0.1 | 1.2 | GO:0051747 | cytosine C-5 DNA demethylase activity(GO:0051747) |
| 0.1 | 2.7 | GO:0005388 | calcium-transporting ATPase activity(GO:0005388) |
| 0.1 | 3.7 | GO:0050135 | NAD(P)+ nucleosidase activity(GO:0050135) |
| 0.1 | 0.3 | GO:0001056 | RNA polymerase I activity(GO:0001054) RNA polymerase III activity(GO:0001056) |
| 0.1 | 1.2 | GO:0070300 | phosphatidic acid binding(GO:0070300) |
| 0.1 | 0.5 | GO:0047780 | citrate dehydratase activity(GO:0047780) |
| 0.1 | 0.3 | GO:0046920 | alpha-(1->3)-fucosyltransferase activity(GO:0046920) |
| 0.1 | 0.3 | GO:0003844 | 1,4-alpha-glucan branching enzyme activity(GO:0003844) |
| 0.1 | 0.4 | GO:0004057 | arginyltransferase activity(GO:0004057) |
| 0.1 | 1.5 | GO:0016018 | cyclosporin A binding(GO:0016018) |
| 0.1 | 0.6 | GO:0080046 | quercetin 4'-O-glucosyltransferase activity(GO:0080046) |
| 0.1 | 0.5 | GO:0032454 | histone demethylase activity (H3-K9 specific)(GO:0032454) |
| 0.1 | 0.3 | GO:0019166 | trans-2-enoyl-CoA reductase (NADPH) activity(GO:0019166) |
| 0.1 | 0.6 | GO:0016312 | inositol bisphosphate phosphatase activity(GO:0016312) |
| 0.1 | 0.3 | GO:0042392 | sphingosine-1-phosphate phosphatase activity(GO:0042392) lipid phosphatase activity(GO:0042577) |
| 0.1 | 0.5 | GO:0016174 | NAD(P)H oxidase activity(GO:0016174) oxidoreductase activity, acting on NAD(P)H, oxygen as acceptor(GO:0050664) |
| 0.1 | 0.3 | GO:0004034 | aldose 1-epimerase activity(GO:0004034) |
| 0.1 | 0.4 | GO:0000340 | RNA 7-methylguanosine cap binding(GO:0000340) |
| 0.1 | 0.6 | GO:0052691 | UDP-arabinopyranose mutase activity(GO:0052691) |
| 0.1 | 2.1 | GO:0043424 | protein histidine kinase binding(GO:0043424) |
| 0.1 | 1.2 | GO:0008235 | metalloexopeptidase activity(GO:0008235) |
| 0.1 | 0.7 | GO:0008239 | dipeptidyl-peptidase activity(GO:0008239) |
| 0.1 | 0.5 | GO:0004049 | anthranilate synthase activity(GO:0004049) |
| 0.1 | 0.4 | GO:0015018 | galactosylgalactosylxylosylprotein 3-beta-glucuronosyltransferase activity(GO:0015018) |
| 0.1 | 1.4 | GO:0017056 | structural constituent of nuclear pore(GO:0017056) |
| 0.1 | 0.7 | GO:0003997 | acyl-CoA oxidase activity(GO:0003997) |
| 0.1 | 5.2 | GO:0061631 | ubiquitin conjugating enzyme activity(GO:0061631) |
| 0.1 | 0.4 | GO:0004647 | phosphoserine phosphatase activity(GO:0004647) |
| 0.1 | 6.0 | GO:0004843 | thiol-dependent ubiquitin-specific protease activity(GO:0004843) thiol-dependent ubiquitinyl hydrolase activity(GO:0036459) |
| 0.1 | 1.7 | GO:0051787 | misfolded protein binding(GO:0051787) |
| 0.1 | 2.5 | GO:0016671 | oxidoreductase activity, acting on a sulfur group of donors, disulfide as acceptor(GO:0016671) |
| 0.1 | 0.3 | GO:0019781 | NEDD8 activating enzyme activity(GO:0019781) |
| 0.1 | 1.4 | GO:0005242 | inward rectifier potassium channel activity(GO:0005242) |
| 0.1 | 0.4 | GO:0005254 | voltage-gated chloride channel activity(GO:0005247) chloride channel activity(GO:0005254) |
| 0.1 | 0.8 | GO:0004020 | adenylylsulfate kinase activity(GO:0004020) |
| 0.1 | 0.3 | GO:0001130 | bacterial-type RNA polymerase transcription factor activity, sequence-specific DNA binding(GO:0001130) bacterial-type RNA polymerase transcriptional activator activity, sequence-specific DNA binding(GO:0001216) SUMO transferase activity(GO:0019789) |
| 0.1 | 0.4 | GO:0008728 | GTP diphosphokinase activity(GO:0008728) |
| 0.1 | 0.8 | GO:0043023 | ribosomal large subunit binding(GO:0043023) |
| 0.1 | 0.6 | GO:0032977 | membrane insertase activity(GO:0032977) |
| 0.1 | 0.4 | GO:0004679 | AMP-activated protein kinase activity(GO:0004679) |
| 0.1 | 1.4 | GO:0005384 | manganese ion transmembrane transporter activity(GO:0005384) |
| 0.1 | 0.7 | GO:0016247 | channel regulator activity(GO:0016247) |
| 0.1 | 3.3 | GO:0004702 | receptor signaling protein serine/threonine kinase activity(GO:0004702) |
| 0.1 | 0.3 | GO:0015026 | coreceptor activity(GO:0015026) |
| 0.1 | 0.3 | GO:0010331 | gibberellin binding(GO:0010331) |
| 0.1 | 1.2 | GO:0004630 | phospholipase D activity(GO:0004630) N-acylphosphatidylethanolamine-specific phospholipase D activity(GO:0070290) |
| 0.1 | 1.4 | GO:0031418 | L-ascorbic acid binding(GO:0031418) |
| 0.1 | 0.9 | GO:0030674 | protein binding, bridging(GO:0030674) |
| 0.1 | 1.3 | GO:0008195 | phosphatidate phosphatase activity(GO:0008195) |
| 0.1 | 0.2 | GO:0030619 | U1 snRNA binding(GO:0030619) |
| 0.1 | 1.7 | GO:0022839 | calcium activated cation channel activity(GO:0005227) ion gated channel activity(GO:0022839) |
| 0.1 | 3.5 | GO:0031625 | ubiquitin protein ligase binding(GO:0031625) |
| 0.1 | 0.5 | GO:0004652 | polynucleotide adenylyltransferase activity(GO:0004652) |
| 0.1 | 0.6 | GO:0001046 | core promoter sequence-specific DNA binding(GO:0001046) core promoter binding(GO:0001047) |
| 0.1 | 0.3 | GO:0016920 | pyroglutamyl-peptidase activity(GO:0016920) |
| 0.1 | 0.5 | GO:0019825 | oxygen binding(GO:0019825) |
| 0.1 | 10.7 | GO:0003712 | transcription factor activity, transcription factor binding(GO:0000989) transcription cofactor activity(GO:0003712) |
| 0.1 | 0.5 | GO:0052656 | L-leucine transaminase activity(GO:0052654) L-valine transaminase activity(GO:0052655) L-isoleucine transaminase activity(GO:0052656) |
| 0.1 | 0.7 | GO:0000285 | 1-phosphatidylinositol-3-phosphate 5-kinase activity(GO:0000285) |
| 0.1 | 26.7 | GO:0004842 | ubiquitin-protein transferase activity(GO:0004842) |
| 0.1 | 0.4 | GO:0003857 | 3-hydroxyacyl-CoA dehydrogenase activity(GO:0003857) |
| 0.1 | 0.3 | GO:0005353 | fructose transmembrane transporter activity(GO:0005353) |
| 0.1 | 0.2 | GO:0030941 | chloroplast targeting sequence binding(GO:0030941) |
| 0.1 | 0.4 | GO:0010295 | (+)-abscisic acid 8'-hydroxylase activity(GO:0010295) |
| 0.1 | 0.4 | GO:0003959 | NADPH dehydrogenase activity(GO:0003959) |
| 0.1 | 0.7 | GO:0015145 | monosaccharide transmembrane transporter activity(GO:0015145) |
| 0.1 | 0.2 | GO:0015172 | acidic amino acid transmembrane transporter activity(GO:0015172) |
| 0.1 | 0.8 | GO:0008199 | ferric iron binding(GO:0008199) |
| 0.1 | 0.2 | GO:0070678 | preprotein binding(GO:0070678) |
| 0.1 | 0.3 | GO:0000213 | tRNA-intron endonuclease activity(GO:0000213) |
| 0.1 | 1.1 | GO:0000993 | RNA polymerase II core binding(GO:0000993) |
| 0.1 | 1.3 | GO:0008536 | Ran GTPase binding(GO:0008536) |
| 0.1 | 1.0 | GO:0016207 | 4-coumarate-CoA ligase activity(GO:0016207) |
| 0.1 | 0.6 | GO:0019903 | protein phosphatase binding(GO:0019903) |
| 0.1 | 0.1 | GO:0043175 | RNA polymerase core enzyme binding(GO:0043175) |
| 0.1 | 0.7 | GO:0035198 | miRNA binding(GO:0035198) |
| 0.1 | 0.5 | GO:0016849 | phosphorus-oxygen lyase activity(GO:0016849) |
| 0.1 | 8.5 | GO:0000978 | RNA polymerase II core promoter proximal region sequence-specific DNA binding(GO:0000978) |
| 0.1 | 0.3 | GO:0034511 | U3 snoRNA binding(GO:0034511) |
| 0.1 | 0.2 | GO:0008442 | 3-hydroxyisobutyrate dehydrogenase activity(GO:0008442) |
| 0.1 | 1.0 | GO:0005548 | phospholipid transporter activity(GO:0005548) |
| 0.1 | 1.2 | GO:0009982 | pseudouridine synthase activity(GO:0009982) |
| 0.1 | 0.2 | GO:0004774 | succinate-CoA ligase activity(GO:0004774) succinate-CoA ligase (ADP-forming) activity(GO:0004775) succinate-CoA ligase (GDP-forming) activity(GO:0004776) |
| 0.1 | 0.3 | GO:0032451 | demethylase activity(GO:0032451) |
| 0.1 | 0.5 | GO:0034979 | NAD-dependent histone deacetylase activity(GO:0017136) histone deacetylase activity (H3-K14 specific)(GO:0031078) NAD-dependent histone deacetylase activity (H3-K14 specific)(GO:0032041) NAD-dependent protein deacetylase activity(GO:0034979) |
| 0.1 | 0.2 | GO:0008665 | tRNA 2'-phosphotransferase activity(GO:0000215) 2'-phosphotransferase activity(GO:0008665) |
| 0.1 | 0.1 | GO:0005092 | GDP-dissociation inhibitor activity(GO:0005092) |
| 0.1 | 0.4 | GO:0004376 | glycolipid mannosyltransferase activity(GO:0004376) |
| 0.1 | 0.4 | GO:0005375 | copper ion transmembrane transporter activity(GO:0005375) |
| 0.1 | 0.2 | GO:0034513 | box H/ACA snoRNA binding(GO:0034513) |
| 0.1 | 0.3 | GO:0042781 | 3'-tRNA processing endoribonuclease activity(GO:0042781) |
| 0.1 | 0.3 | GO:0003919 | FMN adenylyltransferase activity(GO:0003919) |
| 0.1 | 1.2 | GO:0003843 | 1,3-beta-D-glucan synthase activity(GO:0003843) |
| 0.1 | 0.2 | GO:0008198 | ferrous iron binding(GO:0008198) |
| 0.1 | 0.2 | GO:0036402 | proteasome-activating ATPase activity(GO:0036402) |
| 0.1 | 1.0 | GO:0051117 | ATPase binding(GO:0051117) |
| 0.1 | 2.3 | GO:0004364 | glutathione transferase activity(GO:0004364) |
| 0.1 | 0.4 | GO:0004096 | catalase activity(GO:0004096) |
| 0.1 | 0.5 | GO:0004526 | ribonuclease P activity(GO:0004526) tRNA-specific ribonuclease activity(GO:0004549) |
| 0.1 | 0.6 | GO:0044183 | protein binding involved in protein folding(GO:0044183) |
| 0.1 | 0.3 | GO:0004765 | shikimate kinase activity(GO:0004765) |
| 0.1 | 0.2 | GO:0031071 | cysteine desulfurase activity(GO:0031071) |
| 0.1 | 0.6 | GO:0008327 | methyl-CpG binding(GO:0008327) |
| 0.1 | 0.8 | GO:0035529 | NADH pyrophosphatase activity(GO:0035529) |
| 0.1 | 0.2 | GO:0015136 | sialic acid transmembrane transporter activity(GO:0015136) |
| 0.1 | 0.1 | GO:0046976 | histone methyltransferase activity (H3-K27 specific)(GO:0046976) |
| 0.1 | 0.2 | GO:0016618 | hydroxypyruvate reductase activity(GO:0016618) |
| 0.1 | 0.2 | GO:0010313 | phytochrome binding(GO:0010313) |
| 0.1 | 0.2 | GO:0004385 | guanylate kinase activity(GO:0004385) |
| 0.1 | 0.4 | GO:0004372 | glycine hydroxymethyltransferase activity(GO:0004372) serine binding(GO:0070905) |
| 0.1 | 0.3 | GO:0017070 | U6 snRNA binding(GO:0017070) |
| 0.1 | 0.3 | GO:0048487 | beta-tubulin binding(GO:0048487) |
| 0.1 | 2.0 | GO:0017137 | Rab GTPase binding(GO:0017137) |
| 0.1 | 0.1 | GO:0001085 | RNA polymerase II transcription factor binding(GO:0001085) |
| 0.1 | 0.2 | GO:0008798 | beta-aspartyl-peptidase activity(GO:0008798) |
| 0.1 | 0.2 | GO:0004014 | adenosylmethionine decarboxylase activity(GO:0004014) |
| 0.1 | 0.2 | GO:0002151 | G-quadruplex RNA binding(GO:0002151) |
| 0.1 | 1.0 | GO:0031072 | heat shock protein binding(GO:0031072) |
| 0.1 | 1.0 | GO:0097602 | cullin family protein binding(GO:0097602) |
| 0.1 | 0.3 | GO:0004129 | cytochrome-c oxidase activity(GO:0004129) heme-copper terminal oxidase activity(GO:0015002) oxidoreductase activity, acting on a heme group of donors(GO:0016675) oxidoreductase activity, acting on a heme group of donors, oxygen as acceptor(GO:0016676) |
| 0.0 | 2.4 | GO:0003899 | DNA-directed RNA polymerase activity(GO:0003899) |
| 0.0 | 0.5 | GO:0070403 | NAD+ binding(GO:0070403) |
| 0.0 | 0.2 | GO:0017110 | nucleoside-diphosphatase activity(GO:0017110) |
| 0.0 | 0.2 | GO:0030742 | GTP-dependent protein binding(GO:0030742) |
| 0.0 | 0.6 | GO:0004714 | transmembrane receptor protein tyrosine kinase activity(GO:0004714) |
| 0.0 | 0.3 | GO:0030527 | structural constituent of chromatin(GO:0030527) |
| 0.0 | 0.3 | GO:0016149 | translation release factor activity, codon specific(GO:0016149) |
| 0.0 | 0.2 | GO:0004000 | adenosine deaminase activity(GO:0004000) tRNA-specific adenosine deaminase activity(GO:0008251) |
| 0.0 | 0.6 | GO:0052742 | phosphatidylinositol kinase activity(GO:0052742) |
| 0.0 | 0.1 | GO:0080122 | AMP transmembrane transporter activity(GO:0080122) |
| 0.0 | 0.3 | GO:0004663 | Rab geranylgeranyltransferase activity(GO:0004663) |
| 0.0 | 1.8 | GO:0003993 | acid phosphatase activity(GO:0003993) |
| 0.0 | 0.6 | GO:0050373 | UDP-arabinose 4-epimerase activity(GO:0050373) |
| 0.0 | 20.1 | GO:0004674 | protein serine/threonine kinase activity(GO:0004674) |
| 0.0 | 2.5 | GO:0005484 | SNAP receptor activity(GO:0005484) |
| 0.0 | 0.4 | GO:2001070 | starch binding(GO:2001070) |
| 0.0 | 0.3 | GO:0043495 | protein anchor(GO:0043495) |
| 0.0 | 0.2 | GO:0005093 | Rab GDP-dissociation inhibitor activity(GO:0005093) |
| 0.0 | 0.2 | GO:0004350 | glutamate 5-kinase activity(GO:0004349) glutamate-5-semialdehyde dehydrogenase activity(GO:0004350) |
| 0.0 | 0.3 | GO:0008177 | succinate dehydrogenase (ubiquinone) activity(GO:0008177) |
| 0.0 | 2.1 | GO:0032182 | ubiquitin-like protein binding(GO:0032182) |
| 0.0 | 0.3 | GO:0004791 | thioredoxin-disulfide reductase activity(GO:0004791) |
| 0.0 | 0.1 | GO:0000009 | alpha-1,6-mannosyltransferase activity(GO:0000009) |
| 0.0 | 1.9 | GO:0019208 | phosphatase regulator activity(GO:0019208) protein phosphatase regulator activity(GO:0019888) |
| 0.0 | 0.4 | GO:0003950 | NAD+ ADP-ribosyltransferase activity(GO:0003950) |
| 0.0 | 0.3 | GO:0016863 | intramolecular oxidoreductase activity, transposing C=C bonds(GO:0016863) |
| 0.0 | 4.5 | GO:0004722 | protein serine/threonine phosphatase activity(GO:0004722) |
| 0.0 | 0.7 | GO:0004525 | ribonuclease III activity(GO:0004525) double-stranded RNA-specific ribonuclease activity(GO:0032296) |
| 0.0 | 0.2 | GO:0008022 | protein C-terminus binding(GO:0008022) |
| 0.0 | 0.1 | GO:0008061 | chitin binding(GO:0008061) |
| 0.0 | 1.9 | GO:0008080 | N-acetyltransferase activity(GO:0008080) |
| 0.0 | 1.3 | GO:0016760 | cellulose synthase (UDP-forming) activity(GO:0016760) |
| 0.0 | 1.0 | GO:0004568 | chitinase activity(GO:0004568) |
| 0.0 | 0.2 | GO:0047158 | sinapoylglucose-sinapoylglucose O-sinapoyltransferase activity(GO:0047158) |
| 0.0 | 0.9 | GO:0016289 | CoA hydrolase activity(GO:0016289) |
| 0.0 | 0.2 | GO:0018708 | thiol S-methyltransferase activity(GO:0018708) |
| 0.0 | 0.3 | GO:0004739 | pyruvate dehydrogenase (acetyl-transferring) activity(GO:0004739) |
| 0.0 | 0.4 | GO:0016273 | arginine N-methyltransferase activity(GO:0016273) protein-arginine N-methyltransferase activity(GO:0016274) |
| 0.0 | 0.6 | GO:0016702 | oxidoreductase activity, acting on single donors with incorporation of molecular oxygen, incorporation of two atoms of oxygen(GO:0016702) |
| 0.0 | 0.1 | GO:0004133 | glycogen debranching enzyme activity(GO:0004133) |
| 0.0 | 0.1 | GO:0032404 | single base insertion or deletion binding(GO:0032138) single thymine insertion binding(GO:0032143) mismatch repair complex binding(GO:0032404) MutLalpha complex binding(GO:0032405) |
| 0.0 | 0.9 | GO:0005345 | purine nucleobase transmembrane transporter activity(GO:0005345) |
| 0.0 | 3.5 | GO:0000981 | RNA polymerase II transcription factor activity, sequence-specific DNA binding(GO:0000981) |
| 0.0 | 0.7 | GO:0004022 | alcohol dehydrogenase (NAD) activity(GO:0004022) |
| 0.0 | 0.0 | GO:0004738 | pyruvate dehydrogenase activity(GO:0004738) |
| 0.0 | 0.2 | GO:0004535 | poly(A)-specific ribonuclease activity(GO:0004535) |
| 0.0 | 18.9 | GO:0000975 | regulatory region DNA binding(GO:0000975) transcription regulatory region sequence-specific DNA binding(GO:0000976) regulatory region nucleic acid binding(GO:0001067) transcription regulatory region DNA binding(GO:0044212) |
| 0.0 | 0.1 | GO:0000309 | nicotinamide-nucleotide adenylyltransferase activity(GO:0000309) |
| 0.0 | 0.1 | GO:0022840 | leak channel activity(GO:0022840) potassium ion leak channel activity(GO:0022841) narrow pore channel activity(GO:0022842) |
| 0.0 | 0.5 | GO:0070122 | isopeptidase activity(GO:0070122) |
| 0.0 | 0.3 | GO:0003955 | NAD(P)H dehydrogenase (quinone) activity(GO:0003955) |
| 0.0 | 0.2 | GO:0008121 | ubiquinol-cytochrome-c reductase activity(GO:0008121) oxidoreductase activity, acting on diphenols and related substances as donors, cytochrome as acceptor(GO:0016681) |
| 0.0 | 0.2 | GO:0015098 | molybdate ion transmembrane transporter activity(GO:0015098) |
| 0.0 | 0.3 | GO:0017169 | CDP-alcohol phosphatidyltransferase activity(GO:0017169) |
| 0.0 | 0.1 | GO:0004445 | inositol-polyphosphate 5-phosphatase activity(GO:0004445) inositol-1,3,4,5-tetrakisphosphate 5-phosphatase activity(GO:0052659) inositol tetrakisphosphate phosphatase activity(GO:0052743) |
| 0.0 | 0.1 | GO:0004438 | phosphatidylinositol-3-phosphatase activity(GO:0004438) phosphatidylinositol-3,5-bisphosphate 3-phosphatase activity(GO:0052629) |
| 0.0 | 1.1 | GO:0015662 | ATPase activity, coupled to transmembrane movement of ions, phosphorylative mechanism(GO:0015662) |
| 0.0 | 0.3 | GO:0008494 | translation activator activity(GO:0008494) mitochondrial ribosome binding(GO:0097177) |
| 0.0 | 0.4 | GO:0008097 | 5S rRNA binding(GO:0008097) |
| 0.0 | 0.1 | GO:0047134 | protein-disulfide reductase activity(GO:0047134) |
| 0.0 | 0.3 | GO:0033201 | starch synthase activity(GO:0009011) alpha-1,4-glucan synthase activity(GO:0033201) |
| 0.0 | 0.3 | GO:0004084 | branched-chain-amino-acid transaminase activity(GO:0004084) |
| 0.0 | 0.1 | GO:0097363 | protein O-GlcNAc transferase activity(GO:0097363) |
| 0.0 | 0.1 | GO:0016819 | hydrolase activity, acting on acid anhydrides, in sulfonyl-containing anhydrides(GO:0016819) adenylylsulfatase activity(GO:0047627) |
| 0.0 | 0.1 | GO:0035197 | siRNA binding(GO:0035197) |
| 0.0 | 0.2 | GO:0000339 | RNA cap binding(GO:0000339) |
| 0.0 | 0.1 | GO:0016653 | oxidoreductase activity, acting on NAD(P)H, heme protein as acceptor(GO:0016653) |
| 0.0 | 0.2 | GO:0050378 | UDP-glucuronate 4-epimerase activity(GO:0050378) |
| 0.0 | 0.8 | GO:0016597 | amino acid binding(GO:0016597) |
| 0.0 | 0.1 | GO:0036381 | pyridoxal 5'-phosphate synthase (glutamine hydrolysing) activity(GO:0036381) |
| 0.0 | 0.4 | GO:0031491 | nucleosome binding(GO:0031491) |
| 0.0 | 0.8 | GO:0003684 | damaged DNA binding(GO:0003684) |
| 0.0 | 0.2 | GO:0010011 | auxin binding(GO:0010011) |
| 0.0 | 0.2 | GO:0016151 | nickel cation binding(GO:0016151) |
| 0.0 | 0.1 | GO:0031490 | chromatin DNA binding(GO:0031490) |
| 0.0 | 0.4 | GO:0000149 | SNARE binding(GO:0000149) |
| 0.0 | 0.2 | GO:0043015 | gamma-tubulin binding(GO:0043015) |
| 0.0 | 0.2 | GO:0016713 | oxidoreductase activity, acting on paired donors, with incorporation or reduction of molecular oxygen, reduced iron-sulfur protein as one donor, and incorporation of one atom of oxygen(GO:0016713) |
| 0.0 | 0.4 | GO:0090599 | alpha-glucosidase activity(GO:0090599) |
| 0.0 | 0.4 | GO:0046961 | proton-transporting ATPase activity, rotational mechanism(GO:0046961) |
| 0.0 | 0.2 | GO:0016812 | hydrolase activity, acting on carbon-nitrogen (but not peptide) bonds, in cyclic amides(GO:0016812) |
| 0.0 | 0.2 | GO:0004506 | squalene monooxygenase activity(GO:0004506) |
| 0.0 | 0.1 | GO:0030942 | endoplasmic reticulum signal peptide binding(GO:0030942) |
| 0.0 | 23.4 | GO:0003700 | nucleic acid binding transcription factor activity(GO:0001071) transcription factor activity, sequence-specific DNA binding(GO:0003700) |
| 0.0 | 0.1 | GO:0047782 | coniferin beta-glucosidase activity(GO:0047782) |
| 0.0 | 0.2 | GO:0019158 | glucose binding(GO:0005536) mannokinase activity(GO:0019158) |
| 0.0 | 2.9 | GO:0016709 | oxidoreductase activity, acting on paired donors, with incorporation or reduction of molecular oxygen, NAD(P)H as one donor, and incorporation of one atom of oxygen(GO:0016709) |
| 0.0 | 0.1 | GO:0015367 | oxoglutarate:malate antiporter activity(GO:0015367) |
| 0.0 | 3.3 | GO:0043531 | ADP binding(GO:0043531) |
| 0.0 | 0.2 | GO:0070180 | large ribosomal subunit rRNA binding(GO:0070180) |
| 0.0 | 0.3 | GO:0008515 | sucrose transmembrane transporter activity(GO:0008515) |
| 0.0 | 0.9 | GO:0015079 | potassium ion transmembrane transporter activity(GO:0015079) |
| 0.0 | 0.1 | GO:0005544 | calcium-dependent phospholipid binding(GO:0005544) |
| 0.0 | 0.4 | GO:0003756 | protein disulfide isomerase activity(GO:0003756) intramolecular oxidoreductase activity, transposing S-S bonds(GO:0016864) |
| 0.0 | 0.2 | GO:0015217 | ADP transmembrane transporter activity(GO:0015217) |
| 0.0 | 0.1 | GO:0004123 | cystathionine gamma-lyase activity(GO:0004123) |
| 0.0 | 0.1 | GO:0030623 | U5 snRNA binding(GO:0030623) |
| 0.0 | 0.7 | GO:0019887 | protein kinase regulator activity(GO:0019887) |
| 0.0 | 0.2 | GO:0035252 | UDP-xylosyltransferase activity(GO:0035252) |
| 0.0 | 0.1 | GO:0043024 | ribosomal small subunit binding(GO:0043024) |
| 0.0 | 0.1 | GO:0008252 | nucleotidase activity(GO:0008252) |
| 0.0 | 0.6 | GO:0043621 | protein self-association(GO:0043621) |
| 0.0 | 0.6 | GO:0016811 | hydrolase activity, acting on carbon-nitrogen (but not peptide) bonds, in linear amides(GO:0016811) |
| 0.0 | 0.4 | GO:0005319 | lipid transporter activity(GO:0005319) |
| 0.0 | 1.2 | GO:0051082 | unfolded protein binding(GO:0051082) |
| 0.0 | 0.1 | GO:0004834 | tryptophan synthase activity(GO:0004834) |
| 0.0 | 0.1 | GO:0004126 | cytidine deaminase activity(GO:0004126) |
| 0.0 | 0.1 | GO:0017048 | Rho GTPase binding(GO:0017048) |
| 0.0 | 0.0 | GO:0034596 | phosphatidylinositol phosphate 4-phosphatase activity(GO:0034596) phosphatidylinositol-4-phosphate phosphatase activity(GO:0043812) phosphatidylinositol monophosphate phosphatase activity(GO:0052744) |
| 0.0 | 0.3 | GO:0042300 | beta-amyrin synthase activity(GO:0042300) |
| 0.0 | 0.3 | GO:0010181 | FMN binding(GO:0010181) |
| 0.0 | 0.0 | GO:0004766 | spermidine synthase activity(GO:0004766) |
| 0.0 | 0.3 | GO:0051539 | 4 iron, 4 sulfur cluster binding(GO:0051539) |
| 0.0 | 0.0 | GO:0004788 | thiamine diphosphokinase activity(GO:0004788) thiamine binding(GO:0030975) |
| 0.0 | 3.0 | GO:0020037 | heme binding(GO:0020037) |
| 0.0 | 2.1 | GO:0042802 | identical protein binding(GO:0042802) |
| 0.0 | 0.0 | GO:0004514 | nicotinate-nucleotide diphosphorylase (carboxylating) activity(GO:0004514) |
| 0.0 | 0.1 | GO:0017069 | snRNA binding(GO:0017069) |
| 0.0 | 0.1 | GO:0030515 | snoRNA binding(GO:0030515) |
| 0.0 | 0.1 | GO:0004345 | glucose-6-phosphate dehydrogenase activity(GO:0004345) |
| 0.0 | 0.1 | GO:1904680 | oligopeptide transmembrane transporter activity(GO:0035673) peptide transmembrane transporter activity(GO:1904680) |
Gene overrepresentation in curated gene sets: canonical pathways category:
| Log-likelihood per target | Total log-likelihood | Term | Description |
|---|---|---|---|
| 0.3 | 1.4 | PID CIRCADIAN PATHWAY | Circadian rhythm pathway |
| 0.2 | 0.6 | PID NFAT TFPATHWAY | Calcineurin-regulated NFAT-dependent transcription in lymphocytes |
| 0.2 | 1.1 | PID AP1 PATHWAY | AP-1 transcription factor network |
| 0.1 | 0.4 | PID ARF 3PATHWAY | Arf1 pathway |
| 0.1 | 0.8 | PID MTOR 4PATHWAY | mTOR signaling pathway |
| 0.1 | 0.4 | PID VEGF VEGFR PATHWAY | VEGF and VEGFR signaling network |
| 0.1 | 0.3 | PID AVB3 OPN PATHWAY | Osteopontin-mediated events |
| 0.1 | 0.5 | ST DIFFERENTIATION PATHWAY IN PC12 CELLS | Differentiation Pathway in PC12 Cells; this is a specific case of PAC1 Receptor Pathway. |
| 0.1 | 0.4 | PID IL4 2PATHWAY | IL4-mediated signaling events |
| 0.1 | 1.0 | PID ERBB1 DOWNSTREAM PATHWAY | ErbB1 downstream signaling |
| 0.1 | 0.4 | PID NOTCH PATHWAY | Notch signaling pathway |
| 0.1 | 0.2 | ST G ALPHA I PATHWAY | G alpha i Pathway |
| 0.1 | 0.2 | SIG CHEMOTAXIS | Genes related to chemotaxis |
| 0.1 | 0.4 | PID HDAC CLASSI PATHWAY | Signaling events mediated by HDAC Class I |
| 0.1 | 0.1 | PID HIF2PATHWAY | HIF-2-alpha transcription factor network |
| 0.0 | 0.2 | PID HIF1A PATHWAY | Hypoxic and oxygen homeostasis regulation of HIF-1-alpha |
| 0.0 | 0.2 | PID S1P S1P1 PATHWAY | S1P1 pathway |
| 0.0 | 0.2 | PID BARD1 PATHWAY | BARD1 signaling events |
| 0.0 | 0.1 | SA G2 AND M PHASES | Cdc25 activates the cdc2/cyclin B complex to induce the G2/M transition. |
Gene overrepresentation in curated gene sets: REACTOME pathways category:
| Log-likelihood per target | Total log-likelihood | Term | Description |
|---|---|---|---|
| 0.4 | 1.7 | REACTOME BMAL1 CLOCK NPAS2 ACTIVATES CIRCADIAN EXPRESSION | Genes involved in BMAL1:CLOCK/NPAS2 Activates Circadian Expression |
| 0.3 | 2.6 | REACTOME METABOLISM OF AMINO ACIDS AND DERIVATIVES | Genes involved in Metabolism of amino acids and derivatives |
| 0.3 | 1.3 | REACTOME RECYCLING OF BILE ACIDS AND SALTS | Genes involved in Recycling of bile acids and salts |
| 0.3 | 3.6 | REACTOME FATTY ACID TRIACYLGLYCEROL AND KETONE BODY METABOLISM | Genes involved in Fatty acid, triacylglycerol, and ketone body metabolism |
| 0.2 | 0.7 | REACTOME NRAGE SIGNALS DEATH THROUGH JNK | Genes involved in NRAGE signals death through JNK |
| 0.2 | 1.1 | REACTOME GOLGI ASSOCIATED VESICLE BIOGENESIS | Genes involved in Golgi Associated Vesicle Biogenesis |
| 0.2 | 0.8 | REACTOME RECRUITMENT OF MITOTIC CENTROSOME PROTEINS AND COMPLEXES | Genes involved in Recruitment of mitotic centrosome proteins and complexes |
| 0.2 | 0.4 | REACTOME CIRCADIAN CLOCK | Genes involved in Circadian Clock |
| 0.2 | 0.7 | REACTOME METABOLISM OF NUCLEOTIDES | Genes involved in Metabolism of nucleotides |
| 0.2 | 1.0 | REACTOME METABOLISM OF VITAMINS AND COFACTORS | Genes involved in Metabolism of vitamins and cofactors |
| 0.2 | 0.3 | REACTOME DOWNSTREAM SIGNALING OF ACTIVATED FGFR | Genes involved in Downstream signaling of activated FGFR |
| 0.1 | 1.2 | REACTOME INTERFERON SIGNALING | Genes involved in Interferon Signaling |
| 0.1 | 0.4 | REACTOME MEMBRANE TRAFFICKING | Genes involved in Membrane Trafficking |
| 0.1 | 0.4 | REACTOME SLC MEDIATED TRANSMEMBRANE TRANSPORT | Genes involved in SLC-mediated transmembrane transport |
| 0.1 | 0.4 | REACTOME SEMAPHORIN INTERACTIONS | Genes involved in Semaphorin interactions |
| 0.1 | 0.3 | REACTOME PRE NOTCH EXPRESSION AND PROCESSING | Genes involved in Pre-NOTCH Expression and Processing |
| 0.1 | 0.3 | REACTOME REGULATION OF INSULIN SECRETION | Genes involved in Regulation of Insulin Secretion |
| 0.1 | 0.6 | REACTOME E2F ENABLED INHIBITION OF PRE REPLICATION COMPLEX FORMATION | Genes involved in E2F-enabled inhibition of pre-replication complex formation |
| 0.1 | 0.3 | REACTOME MRNA DECAY BY 5 TO 3 EXORIBONUCLEASE | Genes involved in mRNA Decay by 5' to 3' Exoribonuclease |
| 0.1 | 0.2 | REACTOME NEUROTRANSMITTER RECEPTOR BINDING AND DOWNSTREAM TRANSMISSION IN THE POSTSYNAPTIC CELL | Genes involved in Neurotransmitter Receptor Binding And Downstream Transmission In The Postsynaptic Cell |
| 0.1 | 0.5 | REACTOME ASSOCIATION OF TRIC CCT WITH TARGET PROTEINS DURING BIOSYNTHESIS | Genes involved in Association of TriC/CCT with target proteins during biosynthesis |
| 0.1 | 0.1 | REACTOME PI3K CASCADE | Genes involved in PI3K Cascade |
| 0.0 | 0.2 | REACTOME SIGNALING BY RHO GTPASES | Genes involved in Signaling by Rho GTPases |
| 0.0 | 0.4 | REACTOME CLASS I MHC MEDIATED ANTIGEN PROCESSING PRESENTATION | Genes involved in Class I MHC mediated antigen processing & presentation |
| 0.0 | 1.2 | REACTOME ABC FAMILY PROTEINS MEDIATED TRANSPORT | Genes involved in ABC-family proteins mediated transport |
| 0.0 | 0.2 | REACTOME PYRUVATE METABOLISM AND CITRIC ACID TCA CYCLE | Genes involved in Pyruvate metabolism and Citric Acid (TCA) cycle |
| 0.0 | 0.0 | REACTOME VEGF LIGAND RECEPTOR INTERACTIONS | Genes involved in VEGF ligand-receptor interactions |