Project
GSE43616: Time-course of wild-type Arabidopsis leaf
Navigation
Downloads
Results for AT1G28370
Z-value: 1.26
Transcription factors associated with AT1G28370
| Gene Symbol | Gene ID | Gene Info |
|---|---|---|
|
AT1G28370
|
AT1G28370 | ERF domain protein 11 |
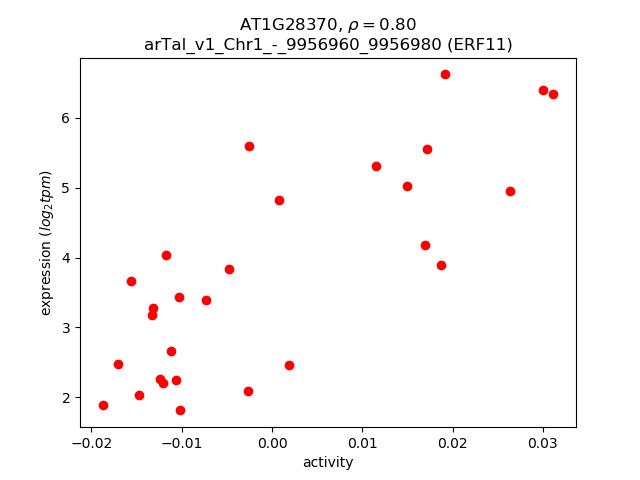
Activity-expression correlation:
| Gene | Promoter | Pearson corr. coef. | P-value | Plot |
|---|---|---|---|---|
| ERF11 | arTal_v1_Chr1_-_9956960_9956980 | 0.80 | 3.6e-07 | Click! |
Activity profile of AT1G28370 motif
Sorted Z-values of AT1G28370 motif
| Promoter | Log-likelihood | Transcript | Gene | Gene Info |
|---|---|---|---|---|
| arTal_v1_Chr5_+_18613239_18613239 | 8.60 |
AT5G45890.1
|
SAG12
|
senescence-associated gene 12 |
| arTal_v1_Chr1_+_30150897_30151006 | 6.11 |
AT1G80160.3
AT1G80160.1 AT1G80160.2 |
GLYI7
|
Lactoylglutathione lyase / glyoxalase I family protein |
| arTal_v1_Chr3_+_22935510_22935510 | 5.62 |
AT3G61930.1
|
AT3G61930
|
hypothetical protein |
| arTal_v1_Chr3_-_20769324_20769410 | 5.57 |
AT3G55970.2
AT3G55970.1 |
JRG21
|
jasmonate-regulated gene 21 |
| arTal_v1_Chr5_+_3358787_3358787 | 5.44 |
AT5G10625.1
|
AT5G10625
|
flowering-promoting factor-like protein |
| arTal_v1_Chr2_+_18641563_18641563 | 5.38 |
AT2G45210.1
|
SAUR36
|
SAUR-like auxin-responsive protein family |
| arTal_v1_Chr4_+_15828228_15828228 | 5.22 |
AT4G32810.1
AT4G32810.2 |
CCD8
|
carotenoid cleavage dioxygenase 8 |
| arTal_v1_Chr3_+_9208861_9208941 | 4.96 |
AT3G25290.1
AT3G25290.2 |
AT3G25290
|
Auxin-responsive family protein |
| arTal_v1_Chr4_-_7026224_7026224 | 4.51 |
AT4G11650.1
|
OSM34
|
osmotin 34 |
| arTal_v1_Chr5_-_8659352_8659352 | 4.48 |
AT5G25110.1
|
CIPK25
|
CBL-interacting protein kinase 25 |
| arTal_v1_Chr3_-_16923299_16923299 | 4.47 |
AT3G46080.1
|
AT3G46080
|
C2H2-type zinc finger family protein |
| arTal_v1_Chr2_+_10906460_10906460 | 4.38 |
AT2G25625.2
|
AT2G25625
|
histone deacetylase-like protein |
| arTal_v1_Chr1_-_10356482_10356482 | 4.36 |
AT1G29640.1
|
AT1G29640
|
senescence regulator (Protein of unknown function, DUF584) |
| arTal_v1_Chr2_+_13581534_13581534 | 4.35 |
AT2G31945.1
|
AT2G31945
|
transmembrane protein |
| arTal_v1_Chr1_-_460696_460831 | 4.30 |
AT1G02310.1
AT1G02310.2 |
MAN1
|
Glycosyl hydrolase superfamily protein |
| arTal_v1_Chr2_+_10906215_10906215 | 4.30 |
AT2G25625.1
|
AT2G25625
|
histone deacetylase-like protein |
| arTal_v1_Chr1_+_5290747_5290747 | 4.28 |
AT1G15380.2
|
GLYI4
|
Lactoylglutathione lyase / glyoxalase I family protein |
| arTal_v1_Chr5_+_3239617_3239617 | 4.22 |
AT5G10300.2
|
MES5
|
methyl esterase 5 |
| arTal_v1_Chr5_-_26857086_26857086 | 4.22 |
AT5G67310.1
|
CYP81G1
|
cytochrome P450, family 81, subfamily G, polypeptide 1 |
| arTal_v1_Chr3_-_23410360_23410360 | 4.22 |
AT3G63380.1
|
AT3G63380
|
ATPase E1-E2 type family protein / haloacid dehalogenase-like hydrolase family protein |
| arTal_v1_Chr3_+_9892791_9892791 | 4.19 |
AT3G26840.1
|
PES2
|
Esterase/lipase/thioesterase family protein |
| arTal_v1_Chr1_+_5290582_5290582 | 4.18 |
AT1G15380.1
|
GLYI4
|
Lactoylglutathione lyase / glyoxalase I family protein |
| arTal_v1_Chr3_-_2699257_2699257 | 4.18 |
AT3G08860.2
|
PYD4
|
PYRIMIDINE 4 |
| arTal_v1_Chr3_-_4657723_4657723 | 4.17 |
AT3G14060.1
|
AT3G14060
|
hypothetical protein |
| arTal_v1_Chr5_+_3239455_3239455 | 4.16 |
AT5G10300.1
|
MES5
|
methyl esterase 5 |
| arTal_v1_Chr3_-_2699420_2699420 | 4.09 |
AT3G08860.1
|
PYD4
|
PYRIMIDINE 4 |
| arTal_v1_Chr2_-_18077517_18077517 | 4.07 |
AT2G43570.1
|
CHI
|
chitinase |
| arTal_v1_Chr5_-_23896702_23896702 | 3.96 |
AT5G59220.2
|
HAI1
|
PP2C protein (Clade A protein phosphatases type 2C) |
| arTal_v1_Chr5_-_23896939_23896939 | 3.90 |
AT5G59220.1
|
HAI1
|
PP2C protein (Clade A protein phosphatases type 2C) |
| arTal_v1_Chr2_+_17251819_17251819 | 3.78 |
AT2G41380.1
|
AT2G41380
|
S-adenosyl-L-methionine-dependent methyltransferases superfamily protein |
| arTal_v1_Chr4_+_17597110_17597110 | 3.78 |
AT4G37430.1
|
CYP91A2
|
cytochrome P450, family 91, subfamily A, polypeptide 2 |
| arTal_v1_Chr3_+_22552560_22552560 | 3.73 |
AT3G60966.1
|
AT3G60966
|
RING/U-box superfamily protein |
| arTal_v1_Chr1_-_27755297_27755297 | 3.71 |
AT1G73810.1
|
AT1G73810
|
Core-2/I-branching beta-1,6-N-acetylglucosaminyltransferase family protein |
| arTal_v1_Chr2_+_18558885_18558938 | 3.68 |
AT2G44990.2
AT2G44990.3 AT2G44990.1 |
CCD7
|
carotenoid cleavage dioxygenase 7 |
| arTal_v1_Chr1_+_24763941_24763941 | 3.65 |
AT1G66390.1
|
MYB90
|
myb domain protein 90 |
| arTal_v1_Chr3_-_7999552_7999552 | 3.64 |
AT3G22560.1
|
AT3G22560
|
Acyl-CoA N-acyltransferases (NAT) superfamily protein |
| arTal_v1_Chr4_-_16344818_16344818 | 3.64 |
AT4G34131.1
|
UGT73B3
|
UDP-glucosyl transferase 73B3 |
| arTal_v1_Chr5_-_19060121_19060121 | 3.61 |
AT5G46950.1
|
AT5G46950
|
Plant invertase/pectin methylesterase inhibitor superfamily protein |
| arTal_v1_Chr4_+_10398857_10398857 | 3.55 |
AT4G18980.1
|
AtS40-3
|
AtS40-3 |
| arTal_v1_Chr2_+_18577500_18577500 | 3.53 |
AT2G45040.1
|
AT2G45040
|
Matrixin family protein |
| arTal_v1_Chr4_+_18409846_18409846 | 3.53 |
AT4G39670.1
|
AT4G39670
|
Glycolipid transfer protein (GLTP) family protein |
| arTal_v1_Chr1_+_3066674_3066753 | 3.50 |
AT1G09500.1
AT1G09500.2 AT1G09500.3 |
AT1G09500
|
NAD(P)-binding Rossmann-fold superfamily protein |
| arTal_v1_Chr2_-_16014991_16014991 | 3.50 |
AT2G38240.1
|
AT2G38240
|
2-oxoglutarate (2OG) and Fe(II)-dependent oxygenase superfamily protein |
| arTal_v1_Chr4_-_1046993_1047105 | 3.49 |
AT4G02380.2
AT4G02380.1 AT4G02380.3 |
SAG21
|
senescence-associated gene 21 |
| arTal_v1_Chr3_-_19643276_19643282 | 3.47 |
AT3G52970.1
AT3G52970.2 |
CYP76G1
|
cytochrome P450, family 76, subfamily G, polypeptide 1 |
| arTal_v1_Chr5_+_18390942_18390942 | 3.46 |
AT5G45380.1
|
DUR3
|
urea-proton symporter DEGRADATION OF UREA 3 (DUR3) |
| arTal_v1_Chr5_+_4271730_4271730 | 3.45 |
AT5G13330.1
|
Rap2.6L
|
related to AP2 6l |
| arTal_v1_Chr1_-_23460884_23460884 | 3.43 |
AT1G63245.1
|
CLE14
|
CLAVATA3/ESR-RELATED 14 |
| arTal_v1_Chr3_+_19089026_19089026 | 3.40 |
AT3G51440.1
|
AT3G51440
|
Calcium-dependent phosphotriesterase superfamily protein |
| arTal_v1_Chr3_-_1055196_1055196 | 3.40 |
AT3G04060.1
|
NAC046
|
NAC domain containing protein 46 |
| arTal_v1_Chr3_-_11194897_11194993 | 3.35 |
AT3G29250.2
AT3G29250.1 |
SDR4
|
NAD(P)-binding Rossmann-fold superfamily protein |
| arTal_v1_Chr2_+_12871984_12872134 | 3.35 |
AT2G30140.1
AT2G30140.2 |
UGT87A2
|
UDP-Glycosyltransferase superfamily protein |
| arTal_v1_Chr3_+_18634546_18634546 | 3.35 |
AT3G50260.1
|
CEJ1
|
cooperatively regulated by ethylene and jasmonate 1 |
| arTal_v1_Chr5_-_17994584_17994722 | 3.32 |
AT5G44610.3
AT5G44610.2 AT5G44610.1 |
MAP18
|
microtubule-associated protein 18 |
| arTal_v1_Chr5_-_23281271_23281271 | 3.31 |
AT5G57480.1
|
AT5G57480
|
P-loop containing nucleoside triphosphate hydrolases superfamily protein |
| arTal_v1_Chr1_+_1469541_1469541 | 3.29 |
AT1G05100.1
|
MAPKKK18
|
mitogen-activated protein kinase kinase kinase 18 |
| arTal_v1_Chr3_-_18241341_18241341 | 3.26 |
AT3G49210.2
|
AT3G49210
|
O-acyltransferase (WSD1-like) family protein |
| arTal_v1_Chr1_-_5338326_5338326 | 3.25 |
AT1G15520.1
AT1G15520.2 |
ABCG40
|
pleiotropic drug resistance 12 |
| arTal_v1_Chr1_-_7534927_7534927 | 3.24 |
AT1G21520.1
|
AT1G21520
|
hypothetical protein |
| arTal_v1_Chr3_-_18241524_18241524 | 3.22 |
AT3G49210.1
|
AT3G49210
|
O-acyltransferase (WSD1-like) family protein |
| arTal_v1_Chr1_+_6100964_6101015 | 3.19 |
AT1G17745.1
AT1G17745.2 |
PGDH
|
D-3-phosphoglycerate dehydrogenase |
| arTal_v1_Chr1_+_3288087_3288087 | 3.18 |
AT1G10070.3
AT1G10070.2 AT1G10070.1 |
BCAT-2
|
branched-chain amino acid transaminase 2 |
| arTal_v1_Chr4_+_10818128_10818128 | 3.17 |
AT4G19970.1
|
AT4G19970
|
nucleotide-diphospho-sugar transferase family protein |
| arTal_v1_Chr2_-_19291632_19291632 | 3.15 |
AT2G46950.2
AT2G46950.1 |
CYP709B2
|
cytochrome P450, family 709, subfamily B, polypeptide 2 |
| arTal_v1_Chr3_-_826585_826585 | 3.14 |
AT3G03470.1
|
CYP89A9
|
cytochrome P450, family 87, subfamily A, polypeptide 9 |
| arTal_v1_Chr2_-_9858778_9858778 | 3.10 |
AT2G23150.1
|
NRAMP3
|
natural resistance-associated macrophage protein 3 |
| arTal_v1_Chr3_-_8119490_8119490 | 3.10 |
AT3G22910.1
|
AT3G22910
|
ATPase E1-E2 type family protein / haloacid dehalogenase-like hydrolase family protein |
| arTal_v1_Chr1_-_23019494_23019494 | 3.09 |
AT1G62300.1
|
WRKY6
|
WRKY family transcription factor |
| arTal_v1_Chr1_+_6515373_6515373 | 3.08 |
AT1G18870.1
AT1G18870.3 |
ICS2
|
isochorismate synthase 2 |
| arTal_v1_Chr1_+_26651840_26651840 | 3.06 |
AT1G70690.1
|
HWI1
|
Receptor-like protein kinase-related family protein |
| arTal_v1_Chr1_+_4416315_4416315 | 3.06 |
AT1G12940.1
|
NRT2.5
|
nitrate transporter2.5 |
| arTal_v1_Chr1_-_17706460_17706460 | 3.05 |
AT1G48000.1
|
MYB112
|
myb domain protein 112 |
| arTal_v1_Chr2_-_11295918_11295918 | 3.03 |
AT2G26560.1
|
PLA2A
|
phospholipase A 2A |
| arTal_v1_Chr4_-_10765781_10765795 | 3.02 |
AT4G19810.1
AT4G19810.2 |
ChiC
|
Glycosyl hydrolase family protein with chitinase insertion domain-containing protein |
| arTal_v1_Chr2_-_275002_275002 | 3.00 |
AT2G01610.1
|
AT2G01610
|
Plant invertase/pectin methylesterase inhibitor superfamily protein |
| arTal_v1_Chr3_-_18375784_18375784 | 3.00 |
AT3G49580.3
AT3G49580.2 |
LSU1
|
response to low sulfur 1 |
| arTal_v1_Chr2_-_18463533_18463533 | 2.99 |
AT2G44790.1
|
UCC2
|
uclacyanin 2 |
| arTal_v1_Chr1_+_28177670_28177670 | 2.98 |
AT1G75040.1
|
PR5
|
pathogenesis-related protein 5 |
| arTal_v1_Chr1_-_1011145_1011145 | 2.98 |
AT1G03940.1
|
AT1G03940
|
HXXXD-type acyl-transferase family protein |
| arTal_v1_Chr3_+_9887917_9887917 | 2.97 |
AT3G26830.1
|
PAD3
|
Cytochrome P450 superfamily protein |
| arTal_v1_Chr1_-_6101983_6101983 | 2.91 |
AT1G17744.1
|
AT1G17744
|
hypothetical protein |
| arTal_v1_Chr5_+_9038860_9038860 | 2.91 |
AT5G25910.1
|
RLP52
|
receptor like protein 52 |
| arTal_v1_Chr1_+_28291698_28291698 | 2.87 |
AT1G75390.1
AT1G75390.2 |
bZIP44
|
basic leucine-zipper 44 |
| arTal_v1_Chr2_-_8850111_8850111 | 2.87 |
AT2G20560.1
|
AT2G20560
|
DNAJ heat shock family protein |
| arTal_v1_Chr1_+_6508797_6508797 | 2.86 |
AT1G18860.1
|
WRKY61
|
WRKY DNA-binding protein 61 |
| arTal_v1_Chr5_+_26772644_26772644 | 2.84 |
AT5G67080.1
|
MAPKKK19
|
mitogen-activated protein kinase kinase kinase 19 |
| arTal_v1_Chr2_+_1175581_1175581 | 2.84 |
AT2G03850.1
|
AT2G03850
|
Late embryogenesis abundant protein (LEA) family protein |
| arTal_v1_Chr1_-_5645443_5645443 | 2.84 |
AT1G16510.1
|
AT1G16510
|
SAUR-like auxin-responsive protein family |
| arTal_v1_Chr1_-_18124289_18124289 | 2.83 |
AT1G49000.1
|
AT1G49000
|
transmembrane protein |
| arTal_v1_Chr2_+_16997078_16997177 | 2.83 |
AT2G40740.3
AT2G40740.2 AT2G40740.1 |
WRKY55
|
WRKY DNA-binding protein 55 |
| arTal_v1_Chr3_-_18375940_18375940 | 2.83 |
AT3G49580.1
|
LSU1
|
response to low sulfur 1 |
| arTal_v1_Chr1_+_8164959_8164959 | 2.82 |
AT1G23040.3
AT1G23040.2 |
AT1G23040
|
hydroxyproline-rich glycoprotein family protein |
| arTal_v1_Chr5_-_26096114_26096114 | 2.82 |
AT5G65300.1
|
AT5G65300
|
hypothetical protein |
| arTal_v1_Chr3_-_20361560_20361560 | 2.80 |
AT3G54950.1
|
pPLAIIIbeta
|
patatin-like protein 6 |
| arTal_v1_Chr3_+_1635194_1635194 | 2.79 |
AT3G05630.1
|
PLDP2
|
phospholipase D P2 |
| arTal_v1_Chr5_-_2652535_2652535 | 2.79 |
AT5G08240.1
|
AT5G08240
|
transmembrane protein |
| arTal_v1_Chr2_+_14685170_14685170 | 2.79 |
AT2G34810.1
|
AT2G34810
|
FAD-binding Berberine family protein |
| arTal_v1_Chr5_+_2938193_2938193 | 2.78 |
AT5G09440.1
|
EXL4
|
EXORDIUM like 4 |
| arTal_v1_Chr3_-_21293158_21293171 | 2.78 |
AT3G57520.2
AT3G57520.3 AT3G57520.1 |
SIP2
|
seed imbibition 2 |
| arTal_v1_Chr4_-_16102196_16102220 | 2.77 |
AT4G33467.1
AT4G33467.2 |
AT4G33467
|
hypothetical protein |
| arTal_v1_Chr5_-_3405571_3405571 | 2.76 |
AT5G10770.1
|
AT5G10770
|
Eukaryotic aspartyl protease family protein |
| arTal_v1_Chr5_-_26531176_26531176 | 2.74 |
AT5G66440.1
|
AT5G66440
|
tRNA-methyltransferase non-catalytic subunit trm6MTase subunit |
| arTal_v1_Chr5_-_16943820_16943820 | 2.74 |
AT5G42380.1
|
CML37
|
calmodulin like 37 |
| arTal_v1_Chr3_-_11400332_11400332 | 2.74 |
AT3G29590.1
|
AT5MAT
|
HXXXD-type acyl-transferase family protein |
| arTal_v1_Chr1_-_3323735_3323735 | 2.74 |
AT1G10140.1
|
AT1G10140
|
Uncharacterized conserved protein UCP031279 |
| arTal_v1_Chr4_+_7239200_7239200 | 2.72 |
AT4G12080.1
|
AHL1
|
AT-hook motif nuclear-localized protein 1 |
| arTal_v1_Chr3_-_2651101_2651231 | 2.70 |
AT3G08720.4
AT3G08720.3 AT3G08720.2 AT3G08720.1 |
S6K2
|
serine/threonine protein kinase 2 |
| arTal_v1_Chr2_-_13929763_13929763 | 2.69 |
AT2G32830.1
|
PHT1%3B5
|
phosphate transporter 1;5 |
| arTal_v1_Chr3_+_4036945_4037070 | 2.67 |
AT3G12700.1
AT3G12700.3 AT3G12700.2 |
NANA
|
Eukaryotic aspartyl protease family protein |
| arTal_v1_Chr2_+_17639001_17639001 | 2.67 |
AT2G42350.1
|
AT2G42350
|
RING/U-box superfamily protein |
| arTal_v1_Chr1_+_8164782_8164782 | 2.65 |
AT1G23040.1
|
AT1G23040
|
hydroxyproline-rich glycoprotein family protein |
| arTal_v1_Chr3_-_10790553_10790553 | 2.63 |
AT3G28740.1
|
CYP81D11
|
Cytochrome P450 superfamily protein |
| arTal_v1_Chr4_-_15507176_15507312 | 2.63 |
AT4G32070.2
AT4G32070.1 |
Phox4
|
Octicosapeptide/Phox/Bem1p (PB1) domain-containing protein / tetratricopeptide repeat (TPR)-containing protein |
| arTal_v1_Chr5_+_8082650_8082744 | 2.63 |
AT5G23950.2
AT5G23950.1 |
AT5G23950
|
Calcium-dependent lipid-binding (CaLB domain) family protein |
| arTal_v1_Chr4_+_17440177_17440177 | 2.63 |
AT4G36990.1
|
HSF4
|
heat shock factor 4 |
| arTal_v1_Chr3_-_9471039_9471039 | 2.62 |
AT3G25882.1
|
NIMIN-2
|
NIM1-interacting 2 |
| arTal_v1_Chr3_+_25355_25507 | 2.61 |
AT3G01080.2
AT3G01080.3 AT3G01080.1 |
WRKY58
|
WRKY DNA-binding protein 58 |
| arTal_v1_Chr1_+_4794664_4794756 | 2.61 |
AT1G13990.1
AT1G13990.2 AT1G13990.3 |
AT1G13990
|
plant/protein |
| arTal_v1_Chr5_-_5862462_5862475 | 2.59 |
AT5G17760.2
AT5G17760.1 |
AT5G17760
|
P-loop containing nucleoside triphosphate hydrolases superfamily protein |
| arTal_v1_Chr3_-_17976774_17976774 | 2.58 |
AT3G48520.1
|
CYP94B3
|
cytochrome P450, family 94, subfamily B, polypeptide 3 |
| arTal_v1_Chr1_+_6515644_6515644 | 2.58 |
AT1G18870.2
|
ICS2
|
isochorismate synthase 2 |
| arTal_v1_Chr1_-_20967162_20967180 | 2.57 |
AT1G56060.2
AT1G56060.1 |
AT1G56060
|
cysteine-rich/transmembrane domain protein B |
| arTal_v1_Chr5_-_16998925_16998925 | 2.55 |
AT5G42510.1
|
AT5G42510
|
Disease resistance-responsive (dirigent-like protein) family protein |
| arTal_v1_Chr5_+_2204206_2204248 | 2.55 |
AT5G07100.5
AT5G07100.3 AT5G07100.4 AT5G07100.2 AT5G07100.1 |
WRKY26
|
WRKY DNA-binding protein 26 |
| arTal_v1_Chr1_+_10897925_10897925 | 2.54 |
AT1G30720.1
|
AT1G30720
|
FAD-binding Berberine family protein |
| arTal_v1_Chr1_-_17266724_17266824 | 2.54 |
AT1G46768.3
AT1G46768.2 AT1G46768.1 |
RAP2.1
|
related to AP2 1 |
| arTal_v1_Chr5_+_15501126_15501184 | 2.54 |
AT5G38710.1
AT5G38710.2 |
AT5G38710
|
Methylenetetrahydrofolate reductase family protein |
| arTal_v1_Chr1_-_18477643_18477643 | 2.53 |
AT1G49900.1
|
AT1G49900
|
C2H2 type zinc finger transcription factor family |
| arTal_v1_Chr5_+_25721733_25721733 | 2.52 |
AT5G64310.1
|
AGP1
|
arabinogalactan protein 1 |
| arTal_v1_Chr5_+_12558154_12558154 | 2.52 |
AT5G33290.1
|
XGD1
|
xylogalacturonan deficient 1 |
| arTal_v1_Chr3_-_18116569_18116569 | 2.51 |
AT3G48850.1
|
PHT3%3B2
|
phosphate transporter 3;2 |
| arTal_v1_Chr3_+_815550_815550 | 2.50 |
AT3G03440.1
|
AT3G03440
|
ARM repeat superfamily protein |
| arTal_v1_Chr1_-_23818481_23818481 | 2.49 |
AT1G64170.1
|
CHX16
|
cation/H+ exchanger 16 |
| arTal_v1_Chr4_+_12977192_12977341 | 2.48 |
AT4G25390.1
AT4G25390.2 |
AT4G25390
|
Protein kinase superfamily protein |
| arTal_v1_Chr5_+_1153740_1153740 | 2.48 |
AT5G04200.1
|
MC9
|
metacaspase 9 |
| arTal_v1_Chr4_+_18530318_18530318 | 2.48 |
AT4G39955.1
|
AT4G39955
|
alpha/beta-Hydrolases superfamily protein |
| arTal_v1_Chr4_+_10875233_10875252 | 2.44 |
AT4G20110.2
AT4G20110.1 |
VSR7
|
VACUOLAR SORTING RECEPTOR 7 |
| arTal_v1_Chr5_-_25168060_25168060 | 2.43 |
AT5G62680.1
|
GTR2
|
Major facilitator superfamily protein |
| arTal_v1_Chr5_+_25210301_25210301 | 2.42 |
AT5G62770.1
|
AT5G62770
|
membrane-associated kinase regulator, putative (DUF1645) |
| arTal_v1_Chr2_+_11620076_11620076 | 2.42 |
AT2G27180.1
|
AT2G27180
|
hypothetical protein |
| arTal_v1_Chr5_-_9247540_9247540 | 2.42 |
AT5G26340.1
|
MSS1
|
Major facilitator superfamily protein |
| arTal_v1_Chr3_+_18919327_18919327 | 2.42 |
AT3G50910.1
|
AT3G50910
|
netrin receptor DCC |
| arTal_v1_Chr1_+_12346138_12346232 | 2.41 |
AT1G33960.2
AT1G33960.1 |
AIG1
|
P-loop containing nucleoside triphosphate hydrolases superfamily protein |
| arTal_v1_Chr4_-_9421857_9421857 | 2.41 |
AT4G16750.1
|
AT4G16750
|
Integrase-type DNA-binding superfamily protein |
| arTal_v1_Chr3_-_1776840_1776840 | 2.40 |
AT3G05937.1
|
AT3G05937
|
hypothetical protein |
| arTal_v1_Chr3_+_6093990_6093990 | 2.39 |
AT3G17810.1
|
PYD1
|
pyrimidine 1 |
| arTal_v1_Chr1_-_3756998_3756998 | 2.39 |
AT1G11210.1
|
AT1G11210
|
cotton fiber protein, putative (DUF761) |
| arTal_v1_Chr1_-_10014256_10014256 | 2.37 |
AT1G28480.1
|
GRX480
|
Thioredoxin superfamily protein |
| arTal_v1_Chr1_-_24362054_24362054 | 2.36 |
AT1G65520.1
|
ECI1
|
delta(3), delta(2)-enoyl CoA isomerase 1 |
| arTal_v1_Chr2_+_12767585_12767585 | 2.34 |
AT2G29950.1
|
ELF4-L1
|
ELF4-like 1 |
| arTal_v1_Chr3_-_11195171_11195171 | 2.34 |
AT3G29250.3
|
SDR4
|
NAD(P)-binding Rossmann-fold superfamily protein |
| arTal_v1_Chr1_-_167842_167842 | 2.34 |
AT1G01453.2
|
AT1G01453
|
late embryogenesis abundant hydroxyproline-rich glycoprotein family protein |
| arTal_v1_Chr3_-_19165322_19165322 | 2.34 |
AT3G51660.1
|
AT3G51660
|
Tautomerase/MIF superfamily protein |
| arTal_v1_Chr5_+_21030943_21030943 | 2.32 |
AT5G51770.1
|
AT5G51770
|
Protein kinase superfamily protein |
| arTal_v1_Chr1_+_10537648_10537648 | 2.31 |
AT1G30040.2
|
GA2OX2
|
gibberellin 2-oxidase |
| arTal_v1_Chr5_+_23067828_23067828 | 2.30 |
AT5G57010.1
|
AT5G57010
|
calmodulin-binding family protein |
| arTal_v1_Chr1_+_30135024_30135024 | 2.30 |
AT1G80110.1
|
PP2-B11
|
phloem protein 2-B11 |
| arTal_v1_Chr5_+_20891163_20891163 | 2.29 |
AT5G51440.1
|
AT5G51440
|
HSP20-like chaperones superfamily protein |
| arTal_v1_Chr1_-_977761_977911 | 2.29 |
AT1G03850.1
AT1G03850.2 AT1G03850.3 |
GRXS13
|
Glutaredoxin family protein |
| arTal_v1_Chr2_-_16780368_16780368 | 2.29 |
AT2G40170.1
|
GEA6
|
Stress induced protein |
| arTal_v1_Chr2_-_10127589_10127589 | 2.28 |
AT2G23790.1
|
AT2G23790
|
calcium uniporter (DUF607) |
| arTal_v1_Chr4_+_9385119_9385180 | 2.28 |
AT4G16670.2
AT4G16670.3 AT4G16670.1 |
AT4G16670
|
auxin canalization protein (DUF828) |
| arTal_v1_Chr2_+_8998450_8998450 | 2.28 |
AT2G20920.1
|
AT2G20920
|
chaperone (DUF3353) |
| arTal_v1_Chr4_-_14820595_14820595 | 2.27 |
AT4G30270.1
|
XTH24
|
xyloglucan endotransglucosylase/hydrolase 24 |
| arTal_v1_Chr2_-_16860779_16860779 | 2.26 |
AT2G40370.1
|
LAC5
|
laccase 5 |
| arTal_v1_Chr3_+_19875375_19875375 | 2.26 |
AT3G53600.1
|
AT3G53600
|
C2H2-type zinc finger family protein |
| arTal_v1_Chr3_-_21303230_21303230 | 2.26 |
AT3G57540.1
|
AT3G57540
|
Remorin family protein |
| arTal_v1_Chr5_-_10213598_10213598 | 2.26 |
AT5G28237.1
AT5G28237.2 |
AT5G28237
|
Pyridoxal-5'-phosphate-dependent enzyme family protein |
| arTal_v1_Chr2_+_15514923_15514923 | 2.25 |
AT2G36950.1
|
AT2G36950
|
Heavy metal transport/detoxification superfamily protein |
| arTal_v1_Chr3_+_16466144_16466144 | 2.25 |
AT3G45010.1
|
scpl48
|
serine carboxypeptidase-like 48 |
| arTal_v1_Chr2_-_13613573_13613728 | 2.24 |
AT2G31990.1
AT2G31990.3 AT2G31990.2 |
AT2G31990
|
Exostosin family protein |
| arTal_v1_Chr1_+_26038905_26038905 | 2.23 |
AT1G69260.1
|
AFP1
|
ABI five binding protein |
| arTal_v1_Chr4_+_17631500_17631620 | 2.23 |
AT4G37520.1
AT4G37520.2 |
AT4G37520
|
Peroxidase superfamily protein |
| arTal_v1_Chr3_+_16383595_16383595 | 2.23 |
AT3G44880.1
|
ACD1
|
Pheophorbide a oxygenase family protein with Rieske 2Fe-2S domain-containing protein |
| arTal_v1_Chr5_+_25703649_25703649 | 2.22 |
AT5G64260.1
|
EXL2
|
EXORDIUM like 2 |
| arTal_v1_Chr1_+_5090809_5090809 | 2.22 |
AT1G14780.1
|
AT1G14780
|
MAC/Perforin domain-containing protein |
| arTal_v1_Chr1_+_10537457_10537457 | 2.21 |
AT1G30040.1
|
GA2OX2
|
gibberellin 2-oxidase |
| arTal_v1_Chr1_+_4915491_4915491 | 2.21 |
AT1G14370.1
|
APK2A
|
protein kinase 2A |
| arTal_v1_Chr4_+_14055661_14055662 | 2.20 |
AT4G28420.2
AT4G28420.1 |
AT4G28420
|
Tyrosine transaminase family protein |
| arTal_v1_Chr1_-_2282828_2282828 | 2.20 |
AT1G07430.1
|
HAI2
|
highly ABA-induced PP2C protein 2 |
| arTal_v1_Chr4_-_17041131_17041131 | 2.20 |
AT4G36010.2
|
AT4G36010
|
Pathogenesis-related thaumatin superfamily protein |
| arTal_v1_Chr5_+_7138762_7138762 | 2.20 |
AT5G21020.2
|
AT5G21020
|
transmembrane protein |
| arTal_v1_Chr1_+_6568002_6568002 | 2.19 |
AT1G19020.1
|
AT1G19020
|
CDP-diacylglycerol-glycerol-3-phosphate 3-phosphatidyltransferase |
| arTal_v1_Chr4_-_17041326_17041326 | 2.18 |
AT4G36010.1
|
AT4G36010
|
Pathogenesis-related thaumatin superfamily protein |
| arTal_v1_Chr5_-_22236551_22236551 | 2.18 |
AT5G54730.2
|
G18F
|
yeast autophagy 18 F-like protein |
| arTal_v1_Chr1_+_27462983_27462983 | 2.17 |
AT1G73000.1
|
PYL3
|
PYR1-like 3 |
| arTal_v1_Chr1_+_22893101_22893101 | 2.17 |
AT1G61930.1
|
AT1G61930
|
senescence regulator (Protein of unknown function, DUF584) |
| arTal_v1_Chr5_+_25322975_25322975 | 2.17 |
AT5G63130.2
AT5G63130.1 |
AT5G63130
|
Octicosapeptide/Phox/Bem1p family protein |
| arTal_v1_Chr2_-_17263017_17263017 | 2.17 |
AT2G41410.1
|
AT2G41410
|
Calcium-binding EF-hand family protein |
| arTal_v1_Chr5_-_22237370_22237370 | 2.16 |
AT5G54730.1
|
G18F
|
yeast autophagy 18 F-like protein |
| arTal_v1_Chr4_-_386479_386479 | 2.16 |
AT4G00900.2
|
ECA2
|
ER-type Ca2+-ATPase 2 |
| arTal_v1_Chr2_-_8447355_8447355 | 2.16 |
AT2G19500.1
|
CKX2
|
cytokinin oxidase 2 |
| arTal_v1_Chr3_+_20736508_20736512 | 2.15 |
AT3G55880.1
AT3G55880.3 AT3G55880.2 AT3G55880.4 |
SUE4
|
Alpha/beta hydrolase related protein |
| arTal_v1_Chr1_+_5638779_5638779 | 2.14 |
AT1G16500.1
|
AT1G16500
|
filamentous hemagglutinin transporter |
| arTal_v1_Chr5_-_2529421_2529421 | 2.14 |
AT5G07920.1
AT5G07920.3 AT5G07920.2 |
DGK1
|
diacylglycerol kinase1 |
| arTal_v1_Chr1_-_168088_168088 | 2.14 |
AT1G01453.1
|
AT1G01453
|
late embryogenesis abundant hydroxyproline-rich glycoprotein family protein |
| arTal_v1_Chr2_-_15151575_15151634 | 2.14 |
AT2G36080.3
AT2G36080.2 AT2G36080.4 AT2G36080.1 |
ABS2
|
AP2/B3-like transcriptional factor family protein |
| arTal_v1_Chr5_+_24774980_24775028 | 2.14 |
AT5G61640.2
AT5G61640.1 |
PMSR1
|
peptidemethionine sulfoxide reductase 1 |
| arTal_v1_Chr4_-_16942060_16942060 | 2.14 |
AT4G35750.1
|
AT4G35750
|
SEC14 cytosolic factor family protein / phosphoglyceride transfer family protein |
| arTal_v1_Chr1_+_3945584_3945584 | 2.13 |
AT1G11700.1
|
AT1G11700
|
senescence regulator (Protein of unknown function, DUF584) |
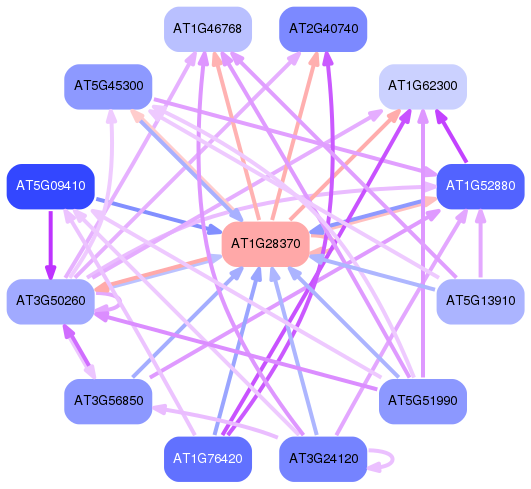
Network of associatons between targets according to the STRING database.

First level regulatory network of AT1G28370
Gene Ontology Analysis
Gene overrepresentation in biological process category:
| Log-likelihood per target | Total log-likelihood | Term | Description |
|---|---|---|---|
| 3.0 | 8.9 | GO:0016118 | tetraterpenoid catabolic process(GO:0016110) carotenoid catabolic process(GO:0016118) xanthophyll catabolic process(GO:0016124) |
| 2.1 | 8.4 | GO:0016139 | glycoside catabolic process(GO:0016139) |
| 1.9 | 7.4 | GO:0015692 | lead ion transport(GO:0015692) |
| 1.4 | 10.1 | GO:0080187 | floral organ senescence(GO:0080187) |
| 1.3 | 5.2 | GO:1902457 | negative regulation of stomatal opening(GO:1902457) |
| 1.2 | 3.5 | GO:0032963 | collagen metabolic process(GO:0032963) multicellular organism metabolic process(GO:0044236) multicellular organismal macromolecule metabolic process(GO:0044259) |
| 1.2 | 1.2 | GO:0051205 | protein insertion into membrane(GO:0051205) |
| 1.1 | 3.3 | GO:0031115 | negative regulation of microtubule polymerization(GO:0031115) |
| 1.0 | 4.1 | GO:0010272 | response to silver ion(GO:0010272) |
| 1.0 | 2.9 | GO:0006369 | termination of RNA polymerase II transcription(GO:0006369) |
| 0.9 | 2.8 | GO:0033530 | raffinose metabolic process(GO:0033530) |
| 0.8 | 0.8 | GO:0052314 | toxin biosynthetic process(GO:0009403) indole phytoalexin biosynthetic process(GO:0009700) indole phytoalexin metabolic process(GO:0046217) phytoalexin metabolic process(GO:0052314) phytoalexin biosynthetic process(GO:0052315) |
| 0.8 | 2.4 | GO:0006210 | thymine catabolic process(GO:0006210) uracil catabolic process(GO:0006212) beta-alanine biosynthetic process(GO:0019483) thymine metabolic process(GO:0019859) |
| 0.8 | 3.1 | GO:0080029 | cellular response to boron-containing substance levels(GO:0080029) |
| 0.8 | 3.1 | GO:0034720 | histone H3-K4 demethylation(GO:0034720) |
| 0.7 | 3.7 | GO:0006564 | L-serine biosynthetic process(GO:0006564) |
| 0.7 | 10.4 | GO:1900057 | positive regulation of leaf senescence(GO:1900057) |
| 0.7 | 2.1 | GO:0046385 | deoxyribonucleoside triphosphate biosynthetic process(GO:0009202) pyrimidine deoxyribonucleoside triphosphate metabolic process(GO:0009211) pyrimidine deoxyribonucleotide metabolic process(GO:0009219) pyrimidine deoxyribonucleotide biosynthetic process(GO:0009221) 2'-deoxyribonucleotide biosynthetic process(GO:0009265) deoxyribose phosphate biosynthetic process(GO:0046385) |
| 0.7 | 3.5 | GO:0019048 | modulation by virus of host morphology or physiology(GO:0019048) |
| 0.7 | 2.1 | GO:0080040 | positive regulation of cellular response to phosphate starvation(GO:0080040) |
| 0.7 | 2.1 | GO:0010124 | phenylacetate catabolic process(GO:0010124) |
| 0.7 | 1.4 | GO:0051091 | positive regulation of sequence-specific DNA binding transcription factor activity(GO:0051091) |
| 0.6 | 1.9 | GO:0010288 | response to lead ion(GO:0010288) |
| 0.6 | 1.9 | GO:0015802 | basic amino acid transport(GO:0015802) |
| 0.6 | 5.0 | GO:2000068 | regulation of defense response to insect(GO:2000068) |
| 0.6 | 4.2 | GO:0030007 | cellular potassium ion homeostasis(GO:0030007) |
| 0.6 | 1.8 | GO:0010184 | cytokinin transport(GO:0010184) |
| 0.6 | 4.1 | GO:0033540 | fatty acid beta-oxidation using acyl-CoA oxidase(GO:0033540) |
| 0.6 | 2.3 | GO:0070509 | calcium ion import(GO:0070509) |
| 0.6 | 1.7 | GO:0016107 | sesquiterpenoid catabolic process(GO:0016107) apocarotenoid catabolic process(GO:0043290) abscisic acid catabolic process(GO:0046345) |
| 0.6 | 1.1 | GO:0031539 | positive regulation of anthocyanin metabolic process(GO:0031539) |
| 0.5 | 2.2 | GO:0048838 | release of seed from dormancy(GO:0048838) exit from dormancy(GO:0097438) negative regulation of seed maturation(GO:2000692) |
| 0.5 | 1.6 | GO:0071422 | thiosulfate transport(GO:0015709) succinate transmembrane transport(GO:0071422) |
| 0.5 | 3.7 | GO:0010438 | cellular response to sulfur starvation(GO:0010438) |
| 0.5 | 2.1 | GO:0048480 | stigma development(GO:0048480) |
| 0.5 | 2.0 | GO:0033306 | phytol metabolic process(GO:0033306) |
| 0.5 | 1.5 | GO:0032196 | transposition(GO:0032196) |
| 0.5 | 3.3 | GO:0016103 | diterpenoid catabolic process(GO:0016103) gibberellin catabolic process(GO:0045487) |
| 0.5 | 1.9 | GO:0051289 | protein homotetramerization(GO:0051289) |
| 0.5 | 0.9 | GO:0009093 | cysteine catabolic process(GO:0009093) |
| 0.5 | 2.7 | GO:0043090 | amino acid import(GO:0043090) |
| 0.5 | 1.8 | GO:0000256 | allantoin catabolic process(GO:0000256) |
| 0.4 | 3.1 | GO:0060866 | leaf abscission(GO:0060866) |
| 0.4 | 1.3 | GO:0034551 | respiratory chain complex III assembly(GO:0017062) mitochondrial respiratory chain complex III assembly(GO:0034551) mitochondrial respiratory chain complex III biogenesis(GO:0097033) |
| 0.4 | 5.2 | GO:0052317 | camalexin biosynthetic process(GO:0010120) camalexin metabolic process(GO:0052317) |
| 0.4 | 18.3 | GO:0043562 | cellular response to nitrogen levels(GO:0043562) |
| 0.4 | 1.3 | GO:0071569 | protein ufmylation(GO:0071569) |
| 0.4 | 1.3 | GO:0032491 | detection of molecule of fungal origin(GO:0032491) |
| 0.4 | 1.3 | GO:0034486 | vacuolar transmembrane transport(GO:0034486) |
| 0.4 | 2.1 | GO:0019323 | pentose catabolic process(GO:0019323) |
| 0.4 | 2.1 | GO:0080024 | indolebutyric acid metabolic process(GO:0080024) |
| 0.4 | 1.6 | GO:0006423 | cysteinyl-tRNA aminoacylation(GO:0006423) |
| 0.4 | 1.2 | GO:0006809 | nitric oxide biosynthetic process(GO:0006809) |
| 0.4 | 1.2 | GO:0046416 | D-amino acid metabolic process(GO:0046416) |
| 0.4 | 2.4 | GO:0009938 | negative regulation of gibberellic acid mediated signaling pathway(GO:0009938) |
| 0.4 | 1.2 | GO:2000029 | regulation of proanthocyanidin biosynthetic process(GO:2000029) |
| 0.4 | 1.2 | GO:0046704 | CDP metabolic process(GO:0046704) CDP biosynthetic process(GO:0046705) |
| 0.4 | 2.8 | GO:0009445 | putrescine metabolic process(GO:0009445) putrescine biosynthetic process(GO:0009446) putrescine biosynthetic process from arginine(GO:0033388) |
| 0.4 | 1.6 | GO:2000736 | regulation of stem cell population maintenance(GO:2000036) regulation of stem cell differentiation(GO:2000736) |
| 0.4 | 17.6 | GO:2000022 | regulation of jasmonic acid mediated signaling pathway(GO:2000022) |
| 0.4 | 0.4 | GO:0015744 | succinate transport(GO:0015744) |
| 0.4 | 1.2 | GO:0080168 | abscisic acid transport(GO:0080168) |
| 0.4 | 1.2 | GO:0015696 | ammonium transport(GO:0015696) |
| 0.4 | 1.2 | GO:0010024 | phytochromobilin biosynthetic process(GO:0010024) phytochromobilin metabolic process(GO:0051202) |
| 0.4 | 1.1 | GO:0061014 | positive regulation of mRNA catabolic process(GO:0061014) |
| 0.4 | 7.9 | GO:0002238 | response to molecule of fungal origin(GO:0002238) |
| 0.4 | 5.9 | GO:0009697 | salicylic acid biosynthetic process(GO:0009697) |
| 0.4 | 1.1 | GO:0071763 | nuclear membrane organization(GO:0071763) |
| 0.4 | 2.8 | GO:0070370 | cellular heat acclimation(GO:0070370) |
| 0.4 | 1.4 | GO:0009270 | response to humidity(GO:0009270) |
| 0.4 | 0.7 | GO:0051291 | protein heterooligomerization(GO:0051291) |
| 0.3 | 1.0 | GO:2000693 | positive regulation of seed maturation(GO:2000693) |
| 0.3 | 1.0 | GO:0035246 | peptidyl-arginine methylation, to asymmetrical-dimethyl arginine(GO:0019919) peptidyl-arginine N-methylation(GO:0035246) peptidyl-arginine omega-N-methylation(GO:0035247) |
| 0.3 | 1.3 | GO:0033512 | lysine catabolic process(GO:0006554) L-lysine catabolic process to acetyl-CoA(GO:0019474) L-lysine catabolic process(GO:0019477) L-lysine catabolic process to acetyl-CoA via saccharopine(GO:0033512) L-lysine metabolic process(GO:0046440) |
| 0.3 | 4.9 | GO:0010112 | regulation of systemic acquired resistance(GO:0010112) |
| 0.3 | 11.2 | GO:0009625 | response to insect(GO:0009625) |
| 0.3 | 1.6 | GO:0051865 | protein autoubiquitination(GO:0051865) |
| 0.3 | 0.9 | GO:1990116 | ribosome-associated ubiquitin-dependent protein catabolic process(GO:1990116) |
| 0.3 | 1.2 | GO:0030322 | stabilization of membrane potential(GO:0030322) |
| 0.3 | 0.9 | GO:0010481 | epidermal cell division(GO:0010481) regulation of epidermal cell division(GO:0010482) |
| 0.3 | 1.2 | GO:0010606 | positive regulation of cytoplasmic mRNA processing body assembly(GO:0010606) |
| 0.3 | 1.2 | GO:0033353 | S-adenosylmethionine cycle(GO:0033353) S-adenosylhomocysteine metabolic process(GO:0046498) |
| 0.3 | 2.8 | GO:0006121 | mitochondrial electron transport, succinate to ubiquinone(GO:0006121) |
| 0.3 | 2.4 | GO:0007205 | protein kinase C-activating G-protein coupled receptor signaling pathway(GO:0007205) |
| 0.3 | 0.9 | GO:0045764 | positive regulation of cellular amine metabolic process(GO:0033240) positive regulation of cellular amino acid metabolic process(GO:0045764) |
| 0.3 | 2.7 | GO:0010230 | alternative respiration(GO:0010230) |
| 0.3 | 1.2 | GO:0010507 | negative regulation of autophagy(GO:0010507) |
| 0.3 | 0.9 | GO:0046203 | spermidine catabolic process(GO:0046203) |
| 0.3 | 0.9 | GO:0010372 | positive regulation of gibberellin biosynthetic process(GO:0010372) |
| 0.3 | 3.5 | GO:0048317 | seed morphogenesis(GO:0048317) |
| 0.3 | 0.8 | GO:2000072 | regulation of defense response to fungus, incompatible interaction(GO:2000072) |
| 0.3 | 3.6 | GO:0006620 | posttranslational protein targeting to membrane(GO:0006620) |
| 0.3 | 0.6 | GO:0002164 | nematode larval development(GO:0002119) larval development(GO:0002164) regulation of nematode larval development(GO:0061062) |
| 0.3 | 14.1 | GO:0009788 | negative regulation of abscisic acid-activated signaling pathway(GO:0009788) |
| 0.3 | 11.3 | GO:0009816 | defense response to bacterium, incompatible interaction(GO:0009816) |
| 0.3 | 5.2 | GO:0031408 | oxylipin biosynthetic process(GO:0031408) |
| 0.3 | 4.3 | GO:0006857 | oligopeptide transport(GO:0006857) peptide transport(GO:0015833) |
| 0.3 | 2.7 | GO:0045736 | negative regulation of cyclin-dependent protein serine/threonine kinase activity(GO:0045736) negative regulation of cyclin-dependent protein kinase activity(GO:1904030) |
| 0.3 | 1.3 | GO:0048464 | sepal development(GO:0048442) flower calyx development(GO:0048464) |
| 0.3 | 0.3 | GO:0055122 | response to very low light intensity stimulus(GO:0055122) |
| 0.3 | 2.6 | GO:0098659 | inorganic cation import into cell(GO:0098659) inorganic ion import into cell(GO:0099587) |
| 0.3 | 4.0 | GO:0006030 | aminoglycan catabolic process(GO:0006026) chitin metabolic process(GO:0006030) chitin catabolic process(GO:0006032) amino sugar catabolic process(GO:0046348) glucosamine-containing compound catabolic process(GO:1901072) |
| 0.3 | 2.4 | GO:0052482 | defense response by cell wall thickening(GO:0052482) |
| 0.3 | 1.3 | GO:0006106 | fumarate metabolic process(GO:0006106) |
| 0.3 | 1.6 | GO:0015785 | UDP-galactose transport(GO:0015785) UDP-galactose transmembrane transport(GO:0072334) |
| 0.3 | 0.5 | GO:0031407 | oxylipin metabolic process(GO:0031407) |
| 0.3 | 2.1 | GO:0006122 | mitochondrial electron transport, ubiquinol to cytochrome c(GO:0006122) |
| 0.3 | 2.1 | GO:0050898 | nitrile metabolic process(GO:0050898) nitrile biosynthetic process(GO:0080028) |
| 0.3 | 2.3 | GO:0080183 | response to photooxidative stress(GO:0080183) |
| 0.3 | 0.3 | GO:0010337 | regulation of salicylic acid metabolic process(GO:0010337) |
| 0.3 | 1.5 | GO:0010273 | detoxification of copper ion(GO:0010273) stress response to copper ion(GO:1990169) |
| 0.3 | 0.8 | GO:0090069 | regulation of ribosome biogenesis(GO:0090069) |
| 0.2 | 2.5 | GO:0042343 | indole glucosinolate metabolic process(GO:0042343) |
| 0.2 | 1.2 | GO:0060149 | negative regulation of posttranscriptional gene silencing(GO:0060149) |
| 0.2 | 1.5 | GO:0071169 | establishment of mitotic sister chromatid cohesion(GO:0034087) establishment of protein localization to chromosome(GO:0070199) rDNA condensation(GO:0070550) establishment of protein localization to chromatin(GO:0071169) transcriptional activation by promoter-enhancer looping(GO:0071733) gene looping(GO:0090202) dsDNA loop formation(GO:0090579) |
| 0.2 | 1.2 | GO:0042218 | 1-aminocyclopropane-1-carboxylate biosynthetic process(GO:0042218) |
| 0.2 | 1.7 | GO:0007188 | G-protein coupled receptor signaling pathway, coupled to cyclic nucleotide second messenger(GO:0007187) adenylate cyclase-modulating G-protein coupled receptor signaling pathway(GO:0007188) |
| 0.2 | 0.7 | GO:0048281 | inflorescence morphogenesis(GO:0048281) |
| 0.2 | 3.1 | GO:0042753 | positive regulation of circadian rhythm(GO:0042753) |
| 0.2 | 0.9 | GO:0043461 | proton-transporting ATP synthase complex assembly(GO:0043461) proton-transporting ATP synthase complex biogenesis(GO:0070272) |
| 0.2 | 0.9 | GO:0043545 | Mo-molybdopterin cofactor biosynthetic process(GO:0006777) Mo-molybdopterin cofactor metabolic process(GO:0019720) molybdopterin cofactor biosynthetic process(GO:0032324) molybdopterin cofactor metabolic process(GO:0043545) prosthetic group metabolic process(GO:0051189) |
| 0.2 | 1.4 | GO:0008300 | isoprenoid catabolic process(GO:0008300) |
| 0.2 | 0.7 | GO:0000491 | small nucleolar ribonucleoprotein complex assembly(GO:0000491) |
| 0.2 | 0.9 | GO:0050792 | regulation of viral process(GO:0050792) |
| 0.2 | 0.7 | GO:0045857 | regulation of molecular function, epigenetic(GO:0040030) negative regulation of molecular function, epigenetic(GO:0045857) |
| 0.2 | 3.0 | GO:0046688 | response to copper ion(GO:0046688) |
| 0.2 | 1.4 | GO:1900036 | positive regulation of cellular response to heat(GO:1900036) |
| 0.2 | 1.1 | GO:0010148 | transpiration(GO:0010148) |
| 0.2 | 0.7 | GO:2000058 | protein ubiquitination involved in ubiquitin-dependent protein catabolic process(GO:0042787) regulation of protein ubiquitination involved in ubiquitin-dependent protein catabolic process(GO:2000058) |
| 0.2 | 1.8 | GO:0097428 | protein maturation by iron-sulfur cluster transfer(GO:0097428) |
| 0.2 | 0.7 | GO:0009727 | detection of ethylene stimulus(GO:0009727) |
| 0.2 | 1.1 | GO:0043068 | positive regulation of programmed cell death(GO:0043068) |
| 0.2 | 0.9 | GO:0070676 | intralumenal vesicle formation(GO:0070676) |
| 0.2 | 2.6 | GO:0010262 | somatic embryogenesis(GO:0010262) |
| 0.2 | 1.7 | GO:0009652 | thigmotropism(GO:0009652) |
| 0.2 | 0.6 | GO:0006436 | tryptophanyl-tRNA aminoacylation(GO:0006436) |
| 0.2 | 25.8 | GO:0010200 | response to chitin(GO:0010200) |
| 0.2 | 0.6 | GO:0009968 | negative regulation of signal transduction(GO:0009968) |
| 0.2 | 0.6 | GO:0000730 | DNA recombinase assembly(GO:0000730) |
| 0.2 | 1.9 | GO:0071249 | cellular response to nitrate(GO:0071249) |
| 0.2 | 1.0 | GO:0009970 | cellular response to sulfate starvation(GO:0009970) |
| 0.2 | 0.6 | GO:0035280 | miRNA loading onto RISC involved in gene silencing by miRNA(GO:0035280) small RNA loading onto RISC(GO:0070922) |
| 0.2 | 5.4 | GO:0030150 | protein import into mitochondrial matrix(GO:0030150) |
| 0.2 | 0.8 | GO:0007155 | cell adhesion(GO:0007155) biological adhesion(GO:0022610) |
| 0.2 | 4.8 | GO:0010193 | response to ozone(GO:0010193) |
| 0.2 | 0.8 | GO:0006419 | alanyl-tRNA aminoacylation(GO:0006419) |
| 0.2 | 0.8 | GO:0019499 | cyanide metabolic process(GO:0019499) |
| 0.2 | 0.8 | GO:0022615 | protein import into peroxisome matrix, docking(GO:0016560) protein to membrane docking(GO:0022615) |
| 0.2 | 0.6 | GO:0010501 | RNA secondary structure unwinding(GO:0010501) |
| 0.2 | 1.6 | GO:0016558 | protein import into peroxisome matrix(GO:0016558) |
| 0.2 | 2.0 | GO:0097577 | intracellular sequestering of iron ion(GO:0006880) sequestering of iron ion(GO:0097577) |
| 0.2 | 0.8 | GO:0046786 | viral replication complex formation and maintenance(GO:0046786) |
| 0.2 | 0.8 | GO:0006361 | transcription initiation from RNA polymerase I promoter(GO:0006361) |
| 0.2 | 0.6 | GO:0019368 | fatty acid elongation, saturated fatty acid(GO:0019367) fatty acid elongation, unsaturated fatty acid(GO:0019368) fatty acid elongation, monounsaturated fatty acid(GO:0034625) fatty acid elongation, polyunsaturated fatty acid(GO:0034626) |
| 0.2 | 1.7 | GO:0051131 | chaperone-mediated protein complex assembly(GO:0051131) |
| 0.2 | 1.1 | GO:0034227 | tRNA thio-modification(GO:0034227) |
| 0.2 | 1.5 | GO:0032511 | late endosome to vacuole transport via multivesicular body sorting pathway(GO:0032511) |
| 0.2 | 1.9 | GO:0009942 | longitudinal axis specification(GO:0009942) |
| 0.2 | 3.9 | GO:0032968 | positive regulation of transcription elongation from RNA polymerase II promoter(GO:0032968) |
| 0.2 | 2.8 | GO:0043248 | proteasome assembly(GO:0043248) |
| 0.2 | 0.6 | GO:0032365 | intracellular lipid transport(GO:0032365) |
| 0.2 | 4.5 | GO:0043069 | negative regulation of programmed cell death(GO:0043069) |
| 0.2 | 1.8 | GO:0006814 | sodium ion transport(GO:0006814) |
| 0.2 | 0.5 | GO:0060776 | simple leaf morphogenesis(GO:0060776) |
| 0.2 | 0.2 | GO:1903513 | retrograde protein transport, ER to cytosol(GO:0030970) endoplasmic reticulum to cytosol transport(GO:1903513) |
| 0.2 | 4.0 | GO:1900424 | regulation of defense response to bacterium(GO:1900424) |
| 0.2 | 1.9 | GO:0015914 | phospholipid transport(GO:0015914) |
| 0.2 | 1.4 | GO:0017006 | protein-tetrapyrrole linkage(GO:0017006) |
| 0.2 | 0.2 | GO:0080171 | lytic vacuole organization(GO:0080171) |
| 0.2 | 1.5 | GO:1903830 | magnesium ion transmembrane transport(GO:1903830) |
| 0.2 | 1.2 | GO:1901984 | negative regulation of histone modification(GO:0031057) negative regulation of histone acetylation(GO:0035067) negative regulation of protein acetylation(GO:1901984) negative regulation of peptidyl-lysine acetylation(GO:2000757) |
| 0.2 | 0.5 | GO:0019079 | viral genome replication(GO:0019079) |
| 0.2 | 0.5 | GO:0046037 | GMP biosynthetic process(GO:0006177) GMP metabolic process(GO:0046037) |
| 0.2 | 2.7 | GO:0031540 | regulation of anthocyanin biosynthetic process(GO:0031540) |
| 0.2 | 1.7 | GO:0009608 | response to symbiont(GO:0009608) |
| 0.2 | 0.7 | GO:0099636 | cytoplasmic streaming(GO:0099636) |
| 0.2 | 1.2 | GO:1901527 | abscisic acid-activated signaling pathway involved in stomatal movement(GO:1901527) |
| 0.2 | 0.8 | GO:0006116 | NADH oxidation(GO:0006116) |
| 0.2 | 2.6 | GO:0050826 | response to freezing(GO:0050826) |
| 0.2 | 1.5 | GO:0031118 | rRNA pseudouridine synthesis(GO:0031118) |
| 0.2 | 1.6 | GO:0050821 | protein stabilization(GO:0050821) |
| 0.2 | 0.8 | GO:0045911 | positive regulation of DNA recombination(GO:0045911) |
| 0.2 | 0.6 | GO:0016598 | protein arginylation(GO:0016598) |
| 0.2 | 1.6 | GO:0033517 | myo-inositol hexakisphosphate biosynthetic process(GO:0010264) myo-inositol hexakisphosphate metabolic process(GO:0033517) |
| 0.2 | 0.6 | GO:0001120 | DNA-templated transcriptional open complex formation(GO:0001112) transcriptional open complex formation at RNA polymerase II promoter(GO:0001113) protein-DNA complex remodeling(GO:0001120) macromolecular complex remodeling(GO:0034367) |
| 0.2 | 0.5 | GO:0051204 | protein insertion into membrane from inner side(GO:0032978) protein insertion into mitochondrial membrane from inner side(GO:0032979) protein insertion into mitochondrial membrane(GO:0051204) |
| 0.2 | 2.3 | GO:0018231 | peptidyl-L-cysteine S-palmitoylation(GO:0018230) peptidyl-S-diacylglycerol-L-cysteine biosynthetic process from peptidyl-cysteine(GO:0018231) |
| 0.2 | 0.3 | GO:0009747 | hexokinase-dependent signaling(GO:0009747) |
| 0.2 | 1.5 | GO:0015749 | monosaccharide transport(GO:0015749) |
| 0.2 | 4.6 | GO:0070588 | calcium ion transmembrane transport(GO:0070588) |
| 0.2 | 0.5 | GO:0010213 | non-photoreactive DNA repair(GO:0010213) |
| 0.2 | 0.8 | GO:0055075 | potassium ion homeostasis(GO:0055075) |
| 0.2 | 1.1 | GO:0010601 | positive regulation of auxin biosynthetic process(GO:0010601) positive regulation of auxin metabolic process(GO:0090355) |
| 0.2 | 1.1 | GO:2001022 | positive regulation of response to DNA damage stimulus(GO:2001022) |
| 0.2 | 0.8 | GO:0043406 | activation of MAPK activity(GO:0000187) positive regulation of MAP kinase activity(GO:0043406) |
| 0.2 | 0.5 | GO:0007019 | microtubule depolymerization(GO:0007019) metaxylem development(GO:0090058) |
| 0.2 | 1.7 | GO:0043162 | ubiquitin-dependent protein catabolic process via the multivesicular body sorting pathway(GO:0043162) |
| 0.1 | 0.4 | GO:0006723 | cuticle hydrocarbon biosynthetic process(GO:0006723) |
| 0.1 | 1.9 | GO:0006368 | transcription elongation from RNA polymerase II promoter(GO:0006368) |
| 0.1 | 0.4 | GO:0031086 | nuclear-transcribed mRNA catabolic process, deadenylation-independent decay(GO:0031086) deadenylation-independent decapping of nuclear-transcribed mRNA(GO:0031087) |
| 0.1 | 1.2 | GO:0006446 | regulation of translational initiation(GO:0006446) |
| 0.1 | 3.9 | GO:0002239 | response to oomycetes(GO:0002239) |
| 0.1 | 0.6 | GO:0006435 | threonyl-tRNA aminoacylation(GO:0006435) |
| 0.1 | 2.2 | GO:0019374 | galactolipid metabolic process(GO:0019374) |
| 0.1 | 0.7 | GO:0010395 | rhamnogalacturonan I metabolic process(GO:0010395) |
| 0.1 | 1.1 | GO:0046822 | regulation of nucleocytoplasmic transport(GO:0046822) |
| 0.1 | 26.2 | GO:0071456 | cellular response to hypoxia(GO:0071456) |
| 0.1 | 2.4 | GO:0009718 | anthocyanin-containing compound biosynthetic process(GO:0009718) |
| 0.1 | 0.6 | GO:0042149 | cellular response to glucose starvation(GO:0042149) |
| 0.1 | 0.4 | GO:0051973 | positive regulation of telomerase activity(GO:0051973) |
| 0.1 | 1.4 | GO:0071051 | polyadenylation-dependent snoRNA 3'-end processing(GO:0071051) |
| 0.1 | 0.6 | GO:0031468 | nuclear envelope reassembly(GO:0031468) |
| 0.1 | 1.5 | GO:0044000 | movement in host(GO:0044000) transport of virus in multicellular host(GO:0046739) movement in other organism involved in symbiotic interaction(GO:0051814) movement in host environment(GO:0052126) movement in environment of other organism involved in symbiotic interaction(GO:0052192) |
| 0.1 | 3.8 | GO:0009833 | plant-type primary cell wall biogenesis(GO:0009833) |
| 0.1 | 0.8 | GO:0003400 | regulation of COPII vesicle coating(GO:0003400) regulation of ER to Golgi vesicle-mediated transport by GTP hydrolysis(GO:0090113) |
| 0.1 | 0.3 | GO:0034389 | lipid particle organization(GO:0034389) |
| 0.1 | 0.4 | GO:1902448 | regulation of shade avoidance(GO:1902446) positive regulation of shade avoidance(GO:1902448) |
| 0.1 | 0.8 | GO:0010387 | COP9 signalosome assembly(GO:0010387) |
| 0.1 | 2.1 | GO:0010030 | positive regulation of seed germination(GO:0010030) |
| 0.1 | 0.5 | GO:0031125 | rRNA 3'-end processing(GO:0031125) |
| 0.1 | 1.4 | GO:0016554 | cytidine to uridine editing(GO:0016554) |
| 0.1 | 0.6 | GO:0010321 | regulation of vegetative phase change(GO:0010321) |
| 0.1 | 0.3 | GO:0051099 | positive regulation of binding(GO:0051099) |
| 0.1 | 2.3 | GO:0043067 | regulation of programmed cell death(GO:0043067) |
| 0.1 | 1.4 | GO:0006020 | inositol metabolic process(GO:0006020) |
| 0.1 | 0.6 | GO:0048578 | positive regulation of long-day photoperiodism, flowering(GO:0048578) |
| 0.1 | 1.0 | GO:0006607 | NLS-bearing protein import into nucleus(GO:0006607) |
| 0.1 | 0.9 | GO:0006285 | base-excision repair, AP site formation(GO:0006285) |
| 0.1 | 0.1 | GO:0006569 | tryptophan catabolic process(GO:0006569) indolalkylamine catabolic process(GO:0046218) |
| 0.1 | 0.9 | GO:0009937 | regulation of gibberellic acid mediated signaling pathway(GO:0009937) |
| 0.1 | 0.4 | GO:0071481 | cellular response to gamma radiation(GO:0071480) cellular response to X-ray(GO:0071481) |
| 0.1 | 3.2 | GO:0009083 | branched-chain amino acid catabolic process(GO:0009083) |
| 0.1 | 1.1 | GO:0033319 | UDP-D-xylose metabolic process(GO:0033319) UDP-D-xylose biosynthetic process(GO:0033320) |
| 0.1 | 7.1 | GO:0055046 | microgametogenesis(GO:0055046) |
| 0.1 | 0.7 | GO:0006624 | vacuolar protein processing(GO:0006624) |
| 0.1 | 0.4 | GO:0006015 | 5-phosphoribose 1-diphosphate biosynthetic process(GO:0006015) 5-phosphoribose 1-diphosphate metabolic process(GO:0046391) |
| 0.1 | 1.3 | GO:0000460 | maturation of 5.8S rRNA(GO:0000460) |
| 0.1 | 1.4 | GO:0098869 | cellular oxidant detoxification(GO:0098869) |
| 0.1 | 0.6 | GO:0019745 | pentacyclic triterpenoid metabolic process(GO:0019742) pentacyclic triterpenoid biosynthetic process(GO:0019745) |
| 0.1 | 0.5 | GO:0060145 | viral gene silencing in virus induced gene silencing(GO:0060145) |
| 0.1 | 0.3 | GO:0010071 | root meristem specification(GO:0010071) |
| 0.1 | 3.0 | GO:0071805 | cellular potassium ion transport(GO:0071804) potassium ion transmembrane transport(GO:0071805) |
| 0.1 | 1.2 | GO:0071712 | ER-associated misfolded protein catabolic process(GO:0071712) |
| 0.1 | 0.1 | GO:0006225 | UDP biosynthetic process(GO:0006225) nucleoside diphosphate biosynthetic process(GO:0009133) pyrimidine nucleoside diphosphate metabolic process(GO:0009138) pyrimidine nucleoside diphosphate biosynthetic process(GO:0009139) ribonucleoside diphosphate biosynthetic process(GO:0009188) pyrimidine ribonucleoside diphosphate metabolic process(GO:0009193) pyrimidine ribonucleoside diphosphate biosynthetic process(GO:0009194) UDP metabolic process(GO:0046048) |
| 0.1 | 4.0 | GO:0009626 | plant-type hypersensitive response(GO:0009626) |
| 0.1 | 1.5 | GO:0010821 | regulation of mitochondrion organization(GO:0010821) |
| 0.1 | 0.8 | GO:0031119 | tRNA pseudouridine synthesis(GO:0031119) |
| 0.1 | 0.5 | GO:0006123 | mitochondrial electron transport, cytochrome c to oxygen(GO:0006123) |
| 0.1 | 1.2 | GO:0072506 | phosphate ion homeostasis(GO:0055062) trivalent inorganic anion homeostasis(GO:0072506) |
| 0.1 | 0.3 | GO:0071277 | cellular response to calcium ion(GO:0071277) |
| 0.1 | 0.7 | GO:0016584 | nucleosome positioning(GO:0016584) |
| 0.1 | 0.8 | GO:0031222 | arabinan catabolic process(GO:0031222) |
| 0.1 | 0.4 | GO:0001173 | DNA-templated transcriptional start site selection(GO:0001173) |
| 0.1 | 1.9 | GO:0030968 | endoplasmic reticulum unfolded protein response(GO:0030968) |
| 0.1 | 1.1 | GO:0046513 | ceramide biosynthetic process(GO:0046513) |
| 0.1 | 3.2 | GO:0000462 | maturation of SSU-rRNA from tricistronic rRNA transcript (SSU-rRNA, 5.8S rRNA, LSU-rRNA)(GO:0000462) |
| 0.1 | 0.3 | GO:0010255 | glucose mediated signaling pathway(GO:0010255) |
| 0.1 | 2.3 | GO:0090630 | activation of GTPase activity(GO:0090630) |
| 0.1 | 0.4 | GO:0090646 | mitochondrial tRNA processing(GO:0090646) |
| 0.1 | 1.1 | GO:0006515 | misfolded or incompletely synthesized protein catabolic process(GO:0006515) |
| 0.1 | 1.1 | GO:0009861 | jasmonic acid and ethylene-dependent systemic resistance(GO:0009861) |
| 0.1 | 0.3 | GO:0010269 | response to selenium ion(GO:0010269) |
| 0.1 | 0.2 | GO:1901562 | response to paraquat(GO:1901562) |
| 0.1 | 0.5 | GO:0031647 | regulation of protein stability(GO:0031647) |
| 0.1 | 1.2 | GO:0048572 | short-day photoperiodism(GO:0048572) short-day photoperiodism, flowering(GO:0048575) |
| 0.1 | 1.2 | GO:0009554 | megasporogenesis(GO:0009554) |
| 0.1 | 2.4 | GO:0006896 | Golgi to vacuole transport(GO:0006896) |
| 0.1 | 1.5 | GO:0046219 | tryptophan biosynthetic process(GO:0000162) indolalkylamine biosynthetic process(GO:0046219) |
| 0.1 | 0.5 | GO:0048439 | flower morphogenesis(GO:0048439) |
| 0.1 | 0.2 | GO:0006427 | histidyl-tRNA aminoacylation(GO:0006427) |
| 0.1 | 0.7 | GO:0045899 | regulation of RNA polymerase II transcriptional preinitiation complex assembly(GO:0045898) positive regulation of RNA polymerase II transcriptional preinitiation complex assembly(GO:0045899) |
| 0.1 | 0.3 | GO:0006004 | fucose metabolic process(GO:0006004) fucose biosynthetic process(GO:0042353) |
| 0.1 | 1.3 | GO:0010093 | specification of floral organ identity(GO:0010093) |
| 0.1 | 0.3 | GO:0072337 | modified amino acid transport(GO:0072337) |
| 0.1 | 1.5 | GO:0046341 | CDP-diacylglycerol biosynthetic process(GO:0016024) CDP-diacylglycerol metabolic process(GO:0046341) |
| 0.1 | 0.3 | GO:0030656 | regulation of vitamin metabolic process(GO:0030656) regulation of L-ascorbic acid biosynthetic process(GO:2000082) |
| 0.1 | 0.3 | GO:0006430 | lysyl-tRNA aminoacylation(GO:0006430) |
| 0.1 | 3.3 | GO:0006099 | tricarboxylic acid cycle(GO:0006099) citrate metabolic process(GO:0006101) |
| 0.1 | 1.2 | GO:0016104 | triterpenoid biosynthetic process(GO:0016104) |
| 0.1 | 0.6 | GO:0032781 | positive regulation of ATPase activity(GO:0032781) |
| 0.1 | 1.6 | GO:0051017 | actin filament bundle assembly(GO:0051017) actin filament bundle organization(GO:0061572) |
| 0.1 | 0.3 | GO:0055047 | generative cell mitosis(GO:0055047) |
| 0.1 | 6.7 | GO:0010150 | leaf senescence(GO:0010150) organ senescence(GO:0010260) |
| 0.1 | 1.1 | GO:0023014 | signal transduction by protein phosphorylation(GO:0023014) |
| 0.1 | 1.7 | GO:0015850 | organic hydroxy compound transport(GO:0015850) |
| 0.1 | 0.2 | GO:0000056 | ribosomal small subunit export from nucleus(GO:0000056) |
| 0.1 | 0.8 | GO:0009870 | defense response signaling pathway, resistance gene-dependent(GO:0009870) |
| 0.1 | 0.8 | GO:0043547 | positive regulation of GTPase activity(GO:0043547) |
| 0.1 | 0.4 | GO:0010117 | photoprotection(GO:0010117) |
| 0.1 | 0.4 | GO:0018027 | peptidyl-lysine dimethylation(GO:0018027) |
| 0.1 | 1.2 | GO:0015743 | malate transport(GO:0015743) |
| 0.1 | 2.5 | GO:0010091 | trichome branching(GO:0010091) |
| 0.1 | 13.9 | GO:0010228 | vegetative to reproductive phase transition of meristem(GO:0010228) |
| 0.1 | 0.5 | GO:0010344 | seed oilbody biogenesis(GO:0010344) |
| 0.1 | 5.7 | GO:0031146 | SCF-dependent proteasomal ubiquitin-dependent protein catabolic process(GO:0031146) |
| 0.1 | 0.9 | GO:1900150 | regulation of defense response to fungus(GO:1900150) |
| 0.1 | 2.3 | GO:0072655 | protein localization to mitochondrion(GO:0070585) establishment of protein localization to mitochondrion(GO:0072655) |
| 0.1 | 3.3 | GO:0034605 | cellular response to heat(GO:0034605) |
| 0.1 | 3.2 | GO:0006333 | chromatin assembly or disassembly(GO:0006333) |
| 0.1 | 0.8 | GO:0070973 | protein localization to endoplasmic reticulum exit site(GO:0070973) |
| 0.1 | 1.3 | GO:0019674 | NAD metabolic process(GO:0019674) |
| 0.1 | 0.4 | GO:0009268 | response to pH(GO:0009268) |
| 0.1 | 0.3 | GO:0032527 | protein exit from endoplasmic reticulum(GO:0032527) |
| 0.1 | 3.3 | GO:0034599 | cellular response to oxidative stress(GO:0034599) |
| 0.1 | 1.2 | GO:0007186 | G-protein coupled receptor signaling pathway(GO:0007186) |
| 0.1 | 1.4 | GO:0034976 | response to endoplasmic reticulum stress(GO:0034976) |
| 0.1 | 0.5 | GO:0010225 | response to UV-C(GO:0010225) |
| 0.1 | 0.6 | GO:1902645 | abscisic acid biosynthetic process(GO:0009688) apocarotenoid biosynthetic process(GO:0043289) tertiary alcohol biosynthetic process(GO:1902645) |
| 0.1 | 0.5 | GO:0051095 | regulation of helicase activity(GO:0051095) positive regulation of helicase activity(GO:0051096) |
| 0.1 | 6.9 | GO:0009751 | response to salicylic acid(GO:0009751) |
| 0.1 | 0.9 | GO:0097501 | stress response to metal ion(GO:0097501) |
| 0.1 | 0.6 | GO:0006878 | cellular copper ion homeostasis(GO:0006878) |
| 0.1 | 1.8 | GO:0006890 | retrograde vesicle-mediated transport, Golgi to ER(GO:0006890) |
| 0.1 | 3.1 | GO:0009631 | cold acclimation(GO:0009631) |
| 0.1 | 0.2 | GO:0080121 | AMP transport(GO:0080121) |
| 0.1 | 0.7 | GO:0006488 | dolichol-linked oligosaccharide biosynthetic process(GO:0006488) |
| 0.1 | 1.6 | GO:0007568 | aging(GO:0007568) |
| 0.1 | 0.3 | GO:0006517 | protein deglycosylation(GO:0006517) |
| 0.1 | 0.3 | GO:0009261 | coenzyme catabolic process(GO:0009109) purine ribonucleotide catabolic process(GO:0009154) ribonucleotide catabolic process(GO:0009261) coenzyme A catabolic process(GO:0015938) nucleoside bisphosphate catabolic process(GO:0033869) ribonucleoside bisphosphate catabolic process(GO:0034031) purine nucleoside bisphosphate catabolic process(GO:0034034) |
| 0.1 | 0.3 | GO:0080001 | mucilage extrusion from seed coat(GO:0080001) |
| 0.1 | 0.5 | GO:0051567 | histone H3-K9 methylation(GO:0051567) |
| 0.1 | 0.7 | GO:0033962 | cytoplasmic mRNA processing body assembly(GO:0033962) |
| 0.1 | 0.9 | GO:0071900 | regulation of protein serine/threonine kinase activity(GO:0071900) |
| 0.1 | 0.9 | GO:0043044 | ATP-dependent chromatin remodeling(GO:0043044) |
| 0.1 | 5.2 | GO:0042594 | response to starvation(GO:0042594) |
| 0.1 | 1.0 | GO:0018393 | internal protein amino acid acetylation(GO:0006475) histone acetylation(GO:0016573) internal peptidyl-lysine acetylation(GO:0018393) peptidyl-lysine acetylation(GO:0018394) |
| 0.1 | 0.7 | GO:0016925 | protein sumoylation(GO:0016925) |
| 0.1 | 0.5 | GO:0051046 | regulation of exocytosis(GO:0017157) regulation of secretion(GO:0051046) regulation of secretion by cell(GO:1903530) |
| 0.1 | 3.2 | GO:0071369 | cellular response to ethylene stimulus(GO:0071369) |
| 0.1 | 0.6 | GO:0010440 | stomatal lineage progression(GO:0010440) |
| 0.1 | 0.9 | GO:0001709 | cell fate determination(GO:0001709) |
| 0.1 | 2.0 | GO:0010162 | seed dormancy process(GO:0010162) dormancy process(GO:0022611) |
| 0.1 | 1.1 | GO:0009395 | phospholipid catabolic process(GO:0009395) |
| 0.1 | 0.3 | GO:0000184 | nuclear-transcribed mRNA catabolic process, nonsense-mediated decay(GO:0000184) |
| 0.1 | 0.2 | GO:0046621 | negative regulation of organ growth(GO:0046621) |
| 0.1 | 1.9 | GO:0006012 | galactose metabolic process(GO:0006012) |
| 0.1 | 1.6 | GO:0045333 | cellular respiration(GO:0045333) |
| 0.1 | 0.9 | GO:0006188 | IMP biosynthetic process(GO:0006188) |
| 0.1 | 0.2 | GO:0010289 | homogalacturonan biosynthetic process(GO:0010289) |
| 0.1 | 0.2 | GO:0034219 | carbohydrate transmembrane transport(GO:0034219) |
| 0.1 | 0.2 | GO:0042989 | sequestering of actin monomers(GO:0042989) |
| 0.1 | 1.3 | GO:0010431 | seed maturation(GO:0010431) |
| 0.1 | 4.5 | GO:0016579 | protein deubiquitination(GO:0016579) |
| 0.1 | 0.1 | GO:0009720 | detection of hormone stimulus(GO:0009720) detection of endogenous stimulus(GO:0009726) |
| 0.1 | 1.5 | GO:0000470 | maturation of LSU-rRNA(GO:0000470) |
| 0.1 | 0.2 | GO:0006425 | glutamyl-tRNA aminoacylation(GO:0006424) glutaminyl-tRNA aminoacylation(GO:0006425) |
| 0.1 | 1.0 | GO:0051028 | mRNA export from nucleus(GO:0006406) mRNA transport(GO:0051028) mRNA-containing ribonucleoprotein complex export from nucleus(GO:0071427) |
| 0.1 | 0.7 | GO:0060321 | acceptance of pollen(GO:0060321) |
| 0.1 | 2.0 | GO:0006888 | ER to Golgi vesicle-mediated transport(GO:0006888) |
| 0.1 | 0.3 | GO:0042447 | cytokinin catabolic process(GO:0009823) hormone catabolic process(GO:0042447) |
| 0.1 | 0.3 | GO:0006591 | ornithine metabolic process(GO:0006591) |
| 0.1 | 0.4 | GO:0090356 | negative regulation of auxin metabolic process(GO:0090356) |
| 0.1 | 3.1 | GO:0006413 | translational initiation(GO:0006413) |
| 0.1 | 0.7 | GO:0031365 | N-terminal protein amino acid modification(GO:0031365) |
| 0.1 | 0.8 | GO:0031048 | chromatin silencing by small RNA(GO:0031048) |
| 0.1 | 0.8 | GO:0045324 | late endosome to vacuole transport(GO:0045324) |
| 0.1 | 0.8 | GO:0006338 | chromatin remodeling(GO:0006338) |
| 0.1 | 17.2 | GO:0030163 | protein catabolic process(GO:0030163) |
| 0.1 | 0.4 | GO:2000067 | regulation of root morphogenesis(GO:2000067) |
| 0.1 | 0.3 | GO:0006421 | asparaginyl-tRNA aminoacylation(GO:0006421) |
| 0.1 | 1.6 | GO:1900140 | regulation of seedling development(GO:1900140) |
| 0.1 | 0.3 | GO:1901535 | regulation of DNA demethylation(GO:1901535) |
| 0.1 | 0.3 | GO:0000706 | meiotic DNA double-strand break processing(GO:0000706) DNA double-strand break processing(GO:0000729) |
| 0.0 | 0.5 | GO:1990937 | xylan acetylation(GO:1990937) |
| 0.0 | 1.0 | GO:0031124 | mRNA 3'-end processing(GO:0031124) |
| 0.0 | 1.0 | GO:0034314 | Arp2/3 complex-mediated actin nucleation(GO:0034314) |
| 0.0 | 2.4 | GO:0009566 | fertilization(GO:0009566) double fertilization forming a zygote and endosperm(GO:0009567) |
| 0.0 | 1.9 | GO:0006887 | exocytosis(GO:0006887) |
| 0.0 | 0.9 | GO:0000245 | spliceosomal complex assembly(GO:0000245) |
| 0.0 | 0.1 | GO:0080144 | amino acid homeostasis(GO:0080144) |
| 0.0 | 0.4 | GO:0090158 | endoplasmic reticulum membrane organization(GO:0090158) |
| 0.0 | 0.5 | GO:0006646 | phosphatidylethanolamine biosynthetic process(GO:0006646) phosphatidylethanolamine metabolic process(GO:0046337) |
| 0.0 | 0.8 | GO:0008284 | positive regulation of cell proliferation(GO:0008284) |
| 0.0 | 0.6 | GO:0033866 | coenzyme A biosynthetic process(GO:0015937) nucleoside bisphosphate biosynthetic process(GO:0033866) ribonucleoside bisphosphate biosynthetic process(GO:0034030) purine nucleoside bisphosphate biosynthetic process(GO:0034033) |
| 0.0 | 1.0 | GO:0006383 | transcription from RNA polymerase III promoter(GO:0006383) |
| 0.0 | 1.9 | GO:0006897 | endocytosis(GO:0006897) |
| 0.0 | 1.4 | GO:0051169 | nucleocytoplasmic transport(GO:0006913) nuclear transport(GO:0051169) |
| 0.0 | 0.2 | GO:0051103 | DNA ligation involved in DNA repair(GO:0051103) |
| 0.0 | 0.0 | GO:0032351 | negative regulation of hormone metabolic process(GO:0032351) |
| 0.0 | 0.3 | GO:1990778 | protein localization to plasma membrane(GO:0072659) protein localization to cell periphery(GO:1990778) |
| 0.0 | 0.3 | GO:0010088 | phloem development(GO:0010088) |
| 0.0 | 0.1 | GO:0010275 | NAD(P)H dehydrogenase complex assembly(GO:0010275) |
| 0.0 | 1.1 | GO:0045168 | cell-cell signaling involved in cell fate commitment(GO:0045168) |
| 0.0 | 0.2 | GO:0001522 | pseudouridine synthesis(GO:0001522) |
| 0.0 | 4.8 | GO:0016192 | vesicle-mediated transport(GO:0016192) |
| 0.0 | 0.1 | GO:0015940 | pantothenate metabolic process(GO:0015939) pantothenate biosynthetic process(GO:0015940) |
| 0.0 | 5.1 | GO:0000398 | mRNA splicing, via spliceosome(GO:0000398) |
| 0.0 | 1.2 | GO:0016042 | lipid catabolic process(GO:0016042) |
| 0.0 | 0.5 | GO:0006545 | glycine biosynthetic process(GO:0006545) |
| 0.0 | 0.9 | GO:0006760 | folic acid-containing compound metabolic process(GO:0006760) |
| 0.0 | 1.0 | GO:0009853 | photorespiration(GO:0009853) |
| 0.0 | 0.1 | GO:0034308 | primary alcohol metabolic process(GO:0034308) |
| 0.0 | 0.2 | GO:0010600 | regulation of auxin biosynthetic process(GO:0010600) |
| 0.0 | 0.3 | GO:2000896 | amylopectin biosynthetic process(GO:0010021) amylopectin metabolic process(GO:2000896) |
| 0.0 | 6.7 | GO:0006357 | regulation of transcription from RNA polymerase II promoter(GO:0006357) |
| 0.0 | 0.6 | GO:0071577 | zinc II ion transmembrane transport(GO:0071577) |
| 0.0 | 0.7 | GO:0007166 | cell surface receptor signaling pathway(GO:0007166) |
| 0.0 | 0.5 | GO:0035304 | regulation of protein dephosphorylation(GO:0035304) |
| 0.0 | 0.1 | GO:0015812 | gamma-aminobutyric acid transport(GO:0015812) |
| 0.0 | 0.5 | GO:0019762 | S-glycoside catabolic process(GO:0016145) glycosinolate catabolic process(GO:0019759) glucosinolate catabolic process(GO:0019762) |
| 0.0 | 2.3 | GO:0006470 | protein dephosphorylation(GO:0006470) |
| 0.0 | 1.4 | GO:0009738 | abscisic acid-activated signaling pathway(GO:0009738) |
| 0.0 | 0.2 | GO:0052386 | cell wall thickening(GO:0052386) |
| 0.0 | 0.1 | GO:0032844 | regulation of telomere maintenance(GO:0032204) regulation of homeostatic process(GO:0032844) |
| 0.0 | 0.1 | GO:0043570 | maintenance of DNA repeat elements(GO:0043570) |
| 0.0 | 0.1 | GO:0046487 | glyoxylate cycle(GO:0006097) glyoxylate metabolic process(GO:0046487) |
| 0.0 | 0.1 | GO:0045824 | negative regulation of innate immune response(GO:0045824) negative regulation of immune response(GO:0050777) |
| 0.0 | 0.2 | GO:0006415 | translational termination(GO:0006415) |
| 0.0 | 0.0 | GO:0006490 | oligosaccharide-lipid intermediate biosynthetic process(GO:0006490) |
| 0.0 | 0.2 | GO:0000375 | RNA splicing, via transesterification reactions(GO:0000375) RNA splicing, via transesterification reactions with bulged adenosine as nucleophile(GO:0000377) |
| 0.0 | 0.3 | GO:0070413 | trehalose metabolism in response to stress(GO:0070413) |
| 0.0 | 0.1 | GO:0007052 | mitotic spindle organization(GO:0007052) |
| 0.0 | 0.3 | GO:0000028 | ribosomal small subunit assembly(GO:0000028) |
| 0.0 | 0.4 | GO:0000911 | cytokinesis by cell plate formation(GO:0000911) |
| 0.0 | 1.2 | GO:0006457 | protein folding(GO:0006457) |
| 0.0 | 0.1 | GO:0019346 | transsulfuration(GO:0019346) homocysteine metabolic process(GO:0050667) |
| 0.0 | 0.1 | GO:0046470 | phosphatidylcholine metabolic process(GO:0046470) |
| 0.0 | 0.4 | GO:0002181 | cytoplasmic translation(GO:0002181) |
Gene overrepresentation in cellular component category:
| Log-likelihood per target | Total log-likelihood | Term | Description |
|---|---|---|---|
| 0.8 | 2.3 | GO:0034702 | ion channel complex(GO:0034702) cation channel complex(GO:0034703) |
| 0.7 | 4.2 | GO:0031205 | endoplasmic reticulum Sec complex(GO:0031205) |
| 0.7 | 2.0 | GO:0009514 | glyoxysome(GO:0009514) |
| 0.6 | 8.6 | GO:0005801 | cis-Golgi network(GO:0005801) |
| 0.5 | 1.5 | GO:0042709 | succinate-CoA ligase complex(GO:0042709) |
| 0.5 | 4.2 | GO:0000813 | ESCRT I complex(GO:0000813) |
| 0.4 | 1.7 | GO:0005967 | mitochondrial pyruvate dehydrogenase complex(GO:0005967) |
| 0.4 | 2.0 | GO:0048188 | Set1C/COMPASS complex(GO:0048188) |
| 0.4 | 1.5 | GO:0043625 | delta DNA polymerase complex(GO:0043625) |
| 0.3 | 4.6 | GO:0045281 | respiratory chain complex II(GO:0045273) succinate dehydrogenase complex(GO:0045281) |
| 0.3 | 0.9 | GO:1990112 | RQC complex(GO:1990112) |
| 0.3 | 4.7 | GO:0031305 | integral component of mitochondrial inner membrane(GO:0031305) |
| 0.3 | 1.4 | GO:0072588 | box H/ACA snoRNP complex(GO:0031429) box H/ACA RNP complex(GO:0072588) |
| 0.3 | 12.0 | GO:0005764 | lysosome(GO:0005764) |
| 0.3 | 5.3 | GO:0016602 | CCAAT-binding factor complex(GO:0016602) |
| 0.3 | 2.4 | GO:0017119 | Golgi transport complex(GO:0017119) |
| 0.3 | 1.6 | GO:0043076 | megasporocyte nucleus(GO:0043076) polar nucleus(GO:0043078) |
| 0.3 | 2.6 | GO:0090544 | SWI/SNF complex(GO:0016514) BAF-type complex(GO:0090544) |
| 0.2 | 4.2 | GO:0045275 | mitochondrial respiratory chain complex III(GO:0005750) respiratory chain complex III(GO:0045275) |
| 0.2 | 0.5 | GO:0000118 | histone deacetylase complex(GO:0000118) |
| 0.2 | 2.0 | GO:0005851 | eukaryotic translation initiation factor 2B complex(GO:0005851) |
| 0.2 | 2.9 | GO:0005742 | mitochondrial outer membrane translocase complex(GO:0005742) |
| 0.2 | 2.9 | GO:0005849 | mRNA cleavage factor complex(GO:0005849) |
| 0.2 | 1.1 | GO:0031907 | peroxisomal matrix(GO:0005782) microbody lumen(GO:0031907) |
| 0.2 | 2.0 | GO:0035267 | NuA4 histone acetyltransferase complex(GO:0035267) H4/H2A histone acetyltransferase complex(GO:0043189) H4 histone acetyltransferase complex(GO:1902562) |
| 0.2 | 1.5 | GO:0042406 | extrinsic component of endoplasmic reticulum membrane(GO:0042406) |
| 0.2 | 1.1 | GO:0031931 | TORC1 complex(GO:0031931) TOR complex(GO:0038201) |
| 0.2 | 1.7 | GO:0016593 | Cdc73/Paf1 complex(GO:0016593) |
| 0.2 | 1.3 | GO:0005947 | mitochondrial alpha-ketoglutarate dehydrogenase complex(GO:0005947) mitochondrial tricarboxylic acid cycle enzyme complex(GO:0030062) |
| 0.2 | 1.7 | GO:0005834 | heterotrimeric G-protein complex(GO:0005834) |
| 0.2 | 1.2 | GO:1990124 | messenger ribonucleoprotein complex(GO:1990124) |
| 0.2 | 0.8 | GO:0000220 | vacuolar proton-transporting V-type ATPase, V0 domain(GO:0000220) |
| 0.2 | 1.6 | GO:0009840 | chloroplastic endopeptidase Clp complex(GO:0009840) |
| 0.2 | 1.2 | GO:0034388 | Pwp2p-containing subcomplex of 90S preribosome(GO:0034388) |
| 0.2 | 3.2 | GO:0008540 | proteasome regulatory particle, base subcomplex(GO:0008540) |
| 0.2 | 2.4 | GO:0070062 | extracellular organelle(GO:0043230) extracellular exosome(GO:0070062) extracellular vesicle(GO:1903561) |
| 0.2 | 2.2 | GO:0005844 | polysome(GO:0005844) |
| 0.2 | 0.7 | GO:0032044 | DSIF complex(GO:0032044) |
| 0.2 | 2.2 | GO:0005744 | mitochondrial inner membrane presequence translocase complex(GO:0005744) |
| 0.2 | 1.5 | GO:0000791 | euchromatin(GO:0000791) |
| 0.2 | 4.4 | GO:0000307 | cyclin-dependent protein kinase holoenzyme complex(GO:0000307) |
| 0.2 | 1.4 | GO:0005956 | protein kinase CK2 complex(GO:0005956) |
| 0.2 | 3.8 | GO:0010494 | cytoplasmic stress granule(GO:0010494) |
| 0.2 | 2.7 | GO:0000786 | nucleosome(GO:0000786) |
| 0.2 | 2.3 | GO:0005788 | endoplasmic reticulum lumen(GO:0005788) |
| 0.2 | 0.8 | GO:0009331 | glycerol-3-phosphate dehydrogenase complex(GO:0009331) |
| 0.2 | 1.4 | GO:0000275 | mitochondrial proton-transporting ATP synthase complex, catalytic core F(1)(GO:0000275) |
| 0.2 | 1.9 | GO:0019774 | proteasome core complex, beta-subunit complex(GO:0019774) |
| 0.2 | 2.4 | GO:0005758 | mitochondrial intermembrane space(GO:0005758) |
| 0.2 | 0.6 | GO:0097550 | transcriptional preinitiation complex(GO:0097550) |
| 0.2 | 0.5 | GO:0000110 | nucleotide-excision repair factor 1 complex(GO:0000110) |
| 0.2 | 1.5 | GO:0072546 | ER membrane protein complex(GO:0072546) |
| 0.2 | 3.9 | GO:0005852 | eukaryotic translation initiation factor 3 complex(GO:0005852) |
| 0.2 | 0.8 | GO:0000408 | EKC/KEOPS complex(GO:0000408) |
| 0.1 | 1.5 | GO:0071014 | post-mRNA release spliceosomal complex(GO:0071014) |
| 0.1 | 0.8 | GO:0017053 | transcriptional repressor complex(GO:0017053) |
| 0.1 | 1.8 | GO:0030686 | 90S preribosome(GO:0030686) |
| 0.1 | 1.8 | GO:0005682 | U5 snRNP(GO:0005682) |
| 0.1 | 2.3 | GO:0005689 | U12-type spliceosomal complex(GO:0005689) |
| 0.1 | 0.6 | GO:0033063 | Rad51B-Rad51C-Rad51D-XRCC2 complex(GO:0033063) Holliday junction resolvase complex(GO:0048476) |
| 0.1 | 1.0 | GO:0070390 | transcription export complex 2(GO:0070390) |
| 0.1 | 1.1 | GO:0010445 | nuclear dicing body(GO:0010445) |
| 0.1 | 0.7 | GO:0035145 | exon-exon junction complex(GO:0035145) |
| 0.1 | 1.1 | GO:0032806 | holo TFIIH complex(GO:0005675) carboxy-terminal domain protein kinase complex(GO:0032806) |
| 0.1 | 0.4 | GO:0002189 | ribose phosphate diphosphokinase complex(GO:0002189) |
| 0.1 | 0.7 | GO:0005732 | small nucleolar ribonucleoprotein complex(GO:0005732) |
| 0.1 | 1.8 | GO:0048471 | perinuclear region of cytoplasm(GO:0048471) |
| 0.1 | 0.6 | GO:0001673 | male germ cell nucleus(GO:0001673) |
| 0.1 | 4.8 | GO:0016592 | mediator complex(GO:0016592) |
| 0.1 | 1.1 | GO:0005832 | chaperonin-containing T-complex(GO:0005832) |
| 0.1 | 0.5 | GO:0000938 | GARP complex(GO:0000938) |
| 0.1 | 0.5 | GO:0034657 | GID complex(GO:0034657) |
| 0.1 | 0.7 | GO:1990726 | Lsm1-7-Pat1 complex(GO:1990726) |
| 0.1 | 0.6 | GO:0005673 | transcription factor TFIIE complex(GO:0005673) |
| 0.1 | 0.6 | GO:0044613 | nuclear pore central transport channel(GO:0044613) |
| 0.1 | 0.6 | GO:0031082 | BLOC complex(GO:0031082) BLOC-1 complex(GO:0031083) |
| 0.1 | 1.6 | GO:0000176 | nuclear exosome (RNase complex)(GO:0000176) |
| 0.1 | 0.3 | GO:0031902 | late endosome membrane(GO:0031902) |
| 0.1 | 0.8 | GO:0031588 | nucleotide-activated protein kinase complex(GO:0031588) |
| 0.1 | 0.9 | GO:0016272 | prefoldin complex(GO:0016272) |
| 0.1 | 2.1 | GO:0005736 | DNA-directed RNA polymerase I complex(GO:0005736) |
| 0.1 | 1.2 | GO:0030687 | preribosome, large subunit precursor(GO:0030687) |
| 0.1 | 3.1 | GO:0030173 | integral component of Golgi membrane(GO:0030173) intrinsic component of Golgi membrane(GO:0031228) |
| 0.1 | 0.5 | GO:0042645 | mitochondrial nucleoid(GO:0042645) |
| 0.1 | 3.0 | GO:0000137 | Golgi cis cisterna(GO:0000137) |
| 0.1 | 1.6 | GO:0044452 | nucleolar part(GO:0044452) |
| 0.1 | 1.2 | GO:0035097 | histone methyltransferase complex(GO:0035097) |
| 0.1 | 0.3 | GO:0031021 | interphase microtubule organizing center(GO:0031021) |
| 0.1 | 0.5 | GO:0016281 | eukaryotic translation initiation factor 4F complex(GO:0016281) |
| 0.1 | 5.3 | GO:0090406 | pollen tube(GO:0090406) |
| 0.1 | 0.1 | GO:0097344 | Rix1 complex(GO:0097344) |
| 0.1 | 1.2 | GO:0045239 | tricarboxylic acid cycle enzyme complex(GO:0045239) |
| 0.1 | 2.1 | GO:0000145 | exocyst(GO:0000145) |
| 0.1 | 1.0 | GO:0033179 | proton-transporting V-type ATPase, V0 domain(GO:0033179) |
| 0.1 | 0.8 | GO:0008180 | COP9 signalosome(GO:0008180) |
| 0.1 | 1.8 | GO:0000932 | cytoplasmic mRNA processing body(GO:0000932) |
| 0.1 | 1.0 | GO:0032588 | trans-Golgi network membrane(GO:0032588) |
| 0.1 | 1.0 | GO:0005763 | mitochondrial small ribosomal subunit(GO:0005763) |
| 0.1 | 5.1 | GO:0009524 | phragmoplast(GO:0009524) |
| 0.1 | 0.8 | GO:0098799 | outer mitochondrial membrane protein complex(GO:0098799) |
| 0.1 | 0.5 | GO:0032541 | cortical endoplasmic reticulum(GO:0032541) |
| 0.1 | 3.7 | GO:0005797 | Golgi medial cisterna(GO:0005797) |
| 0.1 | 7.8 | GO:0000790 | nuclear chromatin(GO:0000790) |
| 0.1 | 3.9 | GO:0045271 | mitochondrial respiratory chain complex I(GO:0005747) NADH dehydrogenase complex(GO:0030964) respiratory chain complex I(GO:0045271) |
| 0.1 | 4.4 | GO:0019005 | SCF ubiquitin ligase complex(GO:0019005) |
| 0.1 | 2.8 | GO:0000502 | proteasome complex(GO:0000502) |
| 0.1 | 0.9 | GO:0000815 | ESCRT III complex(GO:0000815) |
| 0.1 | 1.0 | GO:0005885 | Arp2/3 protein complex(GO:0005885) |
| 0.1 | 1.0 | GO:0005779 | integral component of peroxisomal membrane(GO:0005779) intrinsic component of peroxisomal membrane(GO:0031231) |
| 0.1 | 1.1 | GO:0005686 | U2 snRNP(GO:0005686) |
| 0.1 | 1.4 | GO:0005761 | mitochondrial ribosome(GO:0005761) |
| 0.1 | 5.6 | GO:0033646 | host(GO:0018995) host cell part(GO:0033643) host intracellular part(GO:0033646) host intracellular organelle(GO:0033647) host intracellular membrane-bounded organelle(GO:0033648) host cell nucleus(GO:0042025) intracellular region of host(GO:0043656) host cell(GO:0043657) other organism(GO:0044215) other organism cell(GO:0044216) other organism part(GO:0044217) |
| 0.1 | 0.4 | GO:0033180 | proton-transporting V-type ATPase, V1 domain(GO:0033180) |
| 0.1 | 0.2 | GO:0000811 | GINS complex(GO:0000811) |
| 0.1 | 1.3 | GO:0032040 | small-subunit processome(GO:0032040) |
| 0.1 | 0.4 | GO:0000974 | Prp19 complex(GO:0000974) |
| 0.1 | 0.5 | GO:0034708 | methyltransferase complex(GO:0034708) |
| 0.1 | 0.5 | GO:0089701 | U2AF(GO:0089701) |
| 0.0 | 0.4 | GO:0034399 | nuclear periphery(GO:0034399) |
| 0.0 | 0.8 | GO:0031965 | nuclear membrane(GO:0031965) |
| 0.0 | 1.1 | GO:0032592 | integral component of mitochondrial membrane(GO:0032592) |
| 0.0 | 2.5 | GO:0005811 | lipid particle(GO:0005811) |
| 0.0 | 0.1 | GO:0098576 | integral component of lumenal side of endoplasmic reticulum membrane(GO:0071556) lumenal side of endoplasmic reticulum membrane(GO:0098553) lumenal side of membrane(GO:0098576) |
| 0.0 | 0.7 | GO:0005666 | DNA-directed RNA polymerase III complex(GO:0005666) |
| 0.0 | 0.8 | GO:0031012 | extracellular matrix(GO:0031012) |
| 0.0 | 0.4 | GO:0030140 | trans-Golgi network transport vesicle(GO:0030140) |
| 0.0 | 1.5 | GO:0098687 | chromosomal region(GO:0098687) |
| 0.0 | 2.0 | GO:0000785 | chromatin(GO:0000785) |
| 0.0 | 3.4 | GO:0005887 | integral component of plasma membrane(GO:0005887) |
| 0.0 | 30.2 | GO:0005783 | endoplasmic reticulum(GO:0005783) |
| 0.0 | 0.9 | GO:0009504 | cell plate(GO:0009504) |
| 0.0 | 2.1 | GO:0005681 | spliceosomal complex(GO:0005681) |
| 0.0 | 0.4 | GO:0000127 | transcription factor TFIIIC complex(GO:0000127) |
| 0.0 | 0.4 | GO:0005663 | DNA replication factor C complex(GO:0005663) |
| 0.0 | 0.2 | GO:0005968 | Rab-protein geranylgeranyltransferase complex(GO:0005968) |
| 0.0 | 0.3 | GO:0005769 | early endosome(GO:0005769) |
| 0.0 | 3.6 | GO:0016021 | integral component of membrane(GO:0016021) |
| 0.0 | 0.6 | GO:0000159 | protein phosphatase type 2A complex(GO:0000159) |
| 0.0 | 0.1 | GO:0032301 | MutSalpha complex(GO:0032301) |
| 0.0 | 0.1 | GO:0030684 | preribosome(GO:0030684) |
| 0.0 | 0.6 | GO:0000139 | Golgi membrane(GO:0000139) |
Gene overrepresentation in molecular function category:
| Log-likelihood per target | Total log-likelihood | Term | Description |
|---|---|---|---|
| 2.4 | 7.1 | GO:0008909 | isochorismate synthase activity(GO:0008909) |
| 1.6 | 6.3 | GO:0046593 | mandelonitrile lyase activity(GO:0046593) |
| 1.1 | 10.3 | GO:0010436 | carotenoid dioxygenase activity(GO:0010436) |
| 1.1 | 4.3 | GO:0016985 | mannan endo-1,4-beta-mannosidase activity(GO:0016985) |
| 0.9 | 2.8 | GO:0052692 | alpha-galactosidase activity(GO:0004557) raffinose alpha-galactosidase activity(GO:0052692) |
| 0.9 | 3.7 | GO:0004617 | phosphoglycerate dehydrogenase activity(GO:0004617) |
| 0.8 | 3.3 | GO:0052578 | alpha-farnesene synthase activity(GO:0052578) |
| 0.8 | 2.3 | GO:0015292 | uniporter activity(GO:0015292) |
| 0.7 | 8.1 | GO:0008453 | alanine-glyoxylate transaminase activity(GO:0008453) |
| 0.7 | 2.1 | GO:0004750 | ribulose-phosphate 3-epimerase activity(GO:0004750) |
| 0.7 | 2.1 | GO:0070678 | preprotein binding(GO:0070678) |
| 0.7 | 2.7 | GO:0047782 | coniferin beta-glucosidase activity(GO:0047782) |
| 0.7 | 3.4 | GO:0005355 | glucose transmembrane transporter activity(GO:0005355) |
| 0.6 | 3.1 | GO:0033744 | L-methionine:thioredoxin-disulfide S-oxidoreductase activity(GO:0033744) L-methionine-(S)-S-oxide reductase activity(GO:0036456) |
| 0.6 | 1.8 | GO:0050736 | O-malonyltransferase activity(GO:0050736) |
| 0.6 | 2.9 | GO:0015116 | sulfate transmembrane transporter activity(GO:0015116) |
| 0.6 | 3.5 | GO:0009041 | uridylate kinase activity(GO:0009041) |
| 0.6 | 4.5 | GO:0045543 | gibberellin 2-beta-dioxygenase activity(GO:0045543) C-19 gibberellin 2-beta-dioxygenase activity(GO:0052634) |
| 0.5 | 6.0 | GO:0102360 | daphnetin 3-O-glucosyltransferase activity(GO:0102360) |
| 0.5 | 2.6 | GO:0010277 | chlorophyllide a oxygenase [overall] activity(GO:0010277) |
| 0.5 | 1.6 | GO:0008936 | nicotinamidase activity(GO:0008936) |
| 0.5 | 4.1 | GO:0003997 | acyl-CoA oxidase activity(GO:0003997) |
| 0.5 | 1.5 | GO:0004776 | succinate-CoA ligase activity(GO:0004774) succinate-CoA ligase (ADP-forming) activity(GO:0004775) succinate-CoA ligase (GDP-forming) activity(GO:0004776) |
| 0.5 | 2.5 | GO:0016801 | hydrolase activity, acting on ether bonds(GO:0016801) |
| 0.5 | 1.5 | GO:0010291 | carotene beta-ring hydroxylase activity(GO:0010291) |
| 0.5 | 1.5 | GO:0015089 | high-affinity copper ion transmembrane transporter activity(GO:0015089) |
| 0.5 | 7.3 | GO:0000993 | RNA polymerase II core binding(GO:0000993) |
| 0.5 | 1.9 | GO:0032791 | lead ion binding(GO:0032791) |
| 0.5 | 0.5 | GO:0030332 | cyclin binding(GO:0030332) |
| 0.5 | 1.9 | GO:0004737 | pyruvate decarboxylase activity(GO:0004737) |
| 0.5 | 2.4 | GO:0003680 | AT DNA binding(GO:0003680) |
| 0.5 | 3.3 | GO:0008177 | succinate dehydrogenase (ubiquinone) activity(GO:0008177) |
| 0.5 | 8.9 | GO:0015248 | sterol transporter activity(GO:0015248) |
| 0.5 | 0.9 | GO:0080146 | L-cysteine desulfhydrase activity(GO:0080146) |
| 0.5 | 1.4 | GO:0016262 | protein N-acetylglucosaminyltransferase activity(GO:0016262) |
| 0.4 | 1.3 | GO:0004438 | phosphatidylinositol-3-phosphatase activity(GO:0004438) phosphatidylinositol-3,5-bisphosphate 3-phosphatase activity(GO:0052629) |
| 0.4 | 1.7 | GO:0003935 | GTP cyclohydrolase II activity(GO:0003935) 3,4-dihydroxy-2-butanone-4-phosphate synthase activity(GO:0008686) |
| 0.4 | 1.7 | GO:0016165 | linoleate 13S-lipoxygenase activity(GO:0016165) |
| 0.4 | 1.3 | GO:0008442 | 3-hydroxyisobutyrate dehydrogenase activity(GO:0008442) |
| 0.4 | 3.0 | GO:0016781 | phosphotransferase activity, paired acceptors(GO:0016781) |
| 0.4 | 1.3 | GO:0000386 | second spliceosomal transesterification activity(GO:0000386) |
| 0.4 | 1.6 | GO:0004817 | cysteine-tRNA ligase activity(GO:0004817) |
| 0.4 | 1.2 | GO:0016661 | oxidoreductase activity, acting on other nitrogenous compounds as donors(GO:0016661) |
| 0.4 | 1.2 | GO:0008517 | folic acid transporter activity(GO:0008517) |
| 0.4 | 0.4 | GO:0015141 | succinate transmembrane transporter activity(GO:0015141) |
| 0.4 | 1.1 | GO:0008265 | Mo-molybdopterin cofactor sulfurase activity(GO:0008265) |
| 0.4 | 1.1 | GO:0070003 | threonine-type endopeptidase activity(GO:0004298) threonine-type peptidase activity(GO:0070003) |
| 0.4 | 1.9 | GO:0035197 | siRNA binding(GO:0035197) |
| 0.4 | 1.5 | GO:0000268 | peroxisome targeting sequence binding(GO:0000268) |
| 0.4 | 1.4 | GO:0034513 | box H/ACA snoRNA binding(GO:0034513) |
| 0.3 | 1.7 | GO:0016724 | ferroxidase activity(GO:0004322) oxidoreductase activity, oxidizing metal ions, oxygen as acceptor(GO:0016724) |
| 0.3 | 1.7 | GO:0005544 | calcium-dependent phospholipid binding(GO:0005544) |
| 0.3 | 1.7 | GO:0005366 | myo-inositol:proton symporter activity(GO:0005366) |
| 0.3 | 1.7 | GO:0010295 | (+)-abscisic acid 8'-hydroxylase activity(GO:0010295) |
| 0.3 | 2.7 | GO:0009916 | alternative oxidase activity(GO:0009916) |
| 0.3 | 3.4 | GO:0005086 | ARF guanyl-nucleotide exchange factor activity(GO:0005086) |
| 0.3 | 1.0 | GO:0016277 | [myelin basic protein]-arginine N-methyltransferase activity(GO:0016277) |
| 0.3 | 8.0 | GO:0004568 | chitinase activity(GO:0004568) |
| 0.3 | 1.7 | GO:0031683 | G-protein coupled receptor binding(GO:0001664) G-protein beta/gamma-subunit complex binding(GO:0031683) |
| 0.3 | 1.0 | GO:0046480 | galactolipid galactosyltransferase activity(GO:0046480) |
| 0.3 | 1.3 | GO:0016748 | dihydrolipoyllysine-residue succinyltransferase activity(GO:0004149) succinyltransferase activity(GO:0016748) S-succinyltransferase activity(GO:0016751) |
| 0.3 | 2.3 | GO:0004834 | tryptophan synthase activity(GO:0004834) |
| 0.3 | 1.3 | GO:0004181 | metallocarboxypeptidase activity(GO:0004181) |
| 0.3 | 2.2 | GO:0001047 | core promoter sequence-specific DNA binding(GO:0001046) core promoter binding(GO:0001047) |
| 0.3 | 0.9 | GO:0036402 | proteasome-activating ATPase activity(GO:0036402) |
| 0.3 | 2.4 | GO:0004143 | diacylglycerol kinase activity(GO:0004143) |
| 0.3 | 1.2 | GO:0036218 | dTTP diphosphatase activity(GO:0036218) |
| 0.3 | 2.1 | GO:0008157 | protein phosphatase 1 binding(GO:0008157) |
| 0.3 | 2.7 | GO:0030291 | cyclin-dependent protein serine/threonine kinase inhibitor activity(GO:0004861) protein serine/threonine kinase inhibitor activity(GO:0030291) |
| 0.3 | 0.9 | GO:0052901 | spermine:oxygen oxidoreductase (spermidine-forming) activity(GO:0052901) |
| 0.3 | 1.8 | GO:0070547 | L-tyrosine:2-oxoglutarate aminotransferase activity(GO:0004838) L-tyrosine aminotransferase activity(GO:0070547) |
| 0.3 | 0.9 | GO:0001056 | RNA polymerase I activity(GO:0001054) RNA polymerase III activity(GO:0001056) |
| 0.3 | 0.9 | GO:0032131 | alkylated DNA binding(GO:0032131) |
| 0.3 | 2.0 | GO:0004345 | glucose-6-phosphate dehydrogenase activity(GO:0004345) |
| 0.3 | 4.0 | GO:0004144 | diacylglycerol O-acyltransferase activity(GO:0004144) |
| 0.3 | 1.1 | GO:0008251 | adenosine deaminase activity(GO:0004000) tRNA-specific adenosine deaminase activity(GO:0008251) |
| 0.3 | 0.8 | GO:0004791 | thioredoxin-disulfide reductase activity(GO:0004791) |
| 0.3 | 1.7 | GO:0052656 | L-leucine transaminase activity(GO:0052654) L-valine transaminase activity(GO:0052655) L-isoleucine transaminase activity(GO:0052656) |
| 0.3 | 0.8 | GO:0043425 | bHLH transcription factor binding(GO:0043425) |
| 0.3 | 2.5 | GO:0035198 | miRNA binding(GO:0035198) |
| 0.3 | 3.9 | GO:0004709 | MAP kinase kinase kinase activity(GO:0004709) |
| 0.3 | 6.6 | GO:0005388 | calcium-transporting ATPase activity(GO:0005388) |
| 0.3 | 4.5 | GO:0031369 | translation initiation factor binding(GO:0031369) |
| 0.3 | 3.1 | GO:0004708 | MAP kinase kinase activity(GO:0004708) |
| 0.3 | 1.3 | GO:0004333 | fumarate hydratase activity(GO:0004333) |
| 0.3 | 0.8 | GO:0047912 | galacturonokinase activity(GO:0047912) |
| 0.3 | 0.8 | GO:0047209 | coniferyl-alcohol glucosyltransferase activity(GO:0047209) |
| 0.3 | 1.3 | GO:0003863 | 3-methyl-2-oxobutanoate dehydrogenase (2-methylpropanoyl-transferring) activity(GO:0003863) |
| 0.2 | 1.2 | GO:0022840 | leak channel activity(GO:0022840) potassium ion leak channel activity(GO:0022841) narrow pore channel activity(GO:0022842) |
| 0.2 | 5.2 | GO:0008353 | RNA polymerase II carboxy-terminal domain kinase activity(GO:0008353) |
| 0.2 | 0.7 | GO:0008963 | phospho-N-acetylmuramoyl-pentapeptide-transferase activity(GO:0008963) |
| 0.2 | 5.5 | GO:0097602 | cullin family protein binding(GO:0097602) |
| 0.2 | 4.0 | GO:0005384 | manganese ion transmembrane transporter activity(GO:0005384) |
| 0.2 | 2.6 | GO:0047617 | acyl-CoA hydrolase activity(GO:0047617) |
| 0.2 | 1.8 | GO:0016812 | hydrolase activity, acting on carbon-nitrogen (but not peptide) bonds, in cyclic amides(GO:0016812) |
| 0.2 | 1.1 | GO:0004535 | poly(A)-specific ribonuclease activity(GO:0004535) |
| 0.2 | 1.6 | GO:0005459 | UDP-galactose transmembrane transporter activity(GO:0005459) |
| 0.2 | 1.9 | GO:0003988 | acetyl-CoA C-acyltransferase activity(GO:0003988) |
| 0.2 | 0.6 | GO:0004830 | tryptophan-tRNA ligase activity(GO:0004830) |
| 0.2 | 0.6 | GO:0008821 | crossover junction endodeoxyribonuclease activity(GO:0008821) |
| 0.2 | 0.4 | GO:0052736 | beta-glucanase activity(GO:0052736) |
| 0.2 | 1.9 | GO:1904680 | oligopeptide transmembrane transporter activity(GO:0035673) peptide transmembrane transporter activity(GO:1904680) |
| 0.2 | 1.0 | GO:0004165 | dodecenoyl-CoA delta-isomerase activity(GO:0004165) |
| 0.2 | 0.8 | GO:0004813 | alanine-tRNA ligase activity(GO:0004813) |
| 0.2 | 1.4 | GO:0010279 | indole-3-acetic acid amido synthetase activity(GO:0010279) |
| 0.2 | 0.4 | GO:0047635 | L-alanine:2-oxoglutarate aminotransferase activity(GO:0004021) alanine-oxo-acid transaminase activity(GO:0047635) |
| 0.2 | 1.0 | GO:0016629 | 12-oxophytodienoate reductase activity(GO:0016629) |
| 0.2 | 14.6 | GO:0004197 | cysteine-type endopeptidase activity(GO:0004197) |
| 0.2 | 1.4 | GO:0004123 | cystathionine gamma-lyase activity(GO:0004123) |
| 0.2 | 1.6 | GO:0017091 | AU-rich element binding(GO:0017091) |
| 0.2 | 1.4 | GO:0018822 | nitrilase activity(GO:0000257) hydrolase activity, acting on carbon-nitrogen (but not peptide) bonds, in nitriles(GO:0016815) nitrile hydratase activity(GO:0018822) indole-3-acetonitrile nitrilase activity(GO:0080061) |
| 0.2 | 3.7 | GO:0016844 | strictosidine synthase activity(GO:0016844) |
| 0.2 | 1.0 | GO:0030371 | translation repressor activity(GO:0030371) |
| 0.2 | 1.5 | GO:0090447 | glycerol-3-phosphate 2-O-acyltransferase activity(GO:0090447) |
| 0.2 | 3.2 | GO:0004630 | phospholipase D activity(GO:0004630) N-acylphosphatidylethanolamine-specific phospholipase D activity(GO:0070290) |
| 0.2 | 0.6 | GO:0000309 | nicotinamide-nucleotide adenylyltransferase activity(GO:0000309) |
| 0.2 | 1.1 | GO:0070122 | isopeptidase activity(GO:0070122) |
| 0.2 | 1.1 | GO:0001102 | RNA polymerase II activating transcription factor binding(GO:0001102) |
| 0.2 | 3.4 | GO:1901981 | phosphatidylinositol phosphate binding(GO:1901981) |
| 0.2 | 5.8 | GO:0004724 | magnesium-dependent protein serine/threonine phosphatase activity(GO:0004724) |
| 0.2 | 2.8 | GO:0051117 | ATPase binding(GO:0051117) |
| 0.2 | 2.0 | GO:0102391 | decanoate--CoA ligase activity(GO:0102391) |
| 0.2 | 1.2 | GO:0003872 | 6-phosphofructokinase activity(GO:0003872) |
| 0.2 | 0.7 | GO:0005313 | L-glutamate transmembrane transporter activity(GO:0005313) |
| 0.2 | 5.3 | GO:0004725 | protein tyrosine phosphatase activity(GO:0004725) |
| 0.2 | 0.6 | GO:0004057 | arginyltransferase activity(GO:0004057) |
| 0.2 | 0.5 | GO:0051669 | levanase activity(GO:0031219) fructan beta-fructosidase activity(GO:0051669) |
| 0.2 | 1.9 | GO:0015112 | nitrate transmembrane transporter activity(GO:0015112) |
| 0.2 | 2.0 | GO:0009044 | xylan 1,4-beta-xylosidase activity(GO:0009044) |
| 0.2 | 0.5 | GO:0004609 | phosphatidylserine decarboxylase activity(GO:0004609) |
| 0.2 | 1.1 | GO:0001872 | (1->3)-beta-D-glucan binding(GO:0001872) |
| 0.2 | 0.6 | GO:0097157 | U2 snRNA binding(GO:0030620) pre-mRNA intronic binding(GO:0097157) |
| 0.2 | 0.9 | GO:0047627 | hydrolase activity, acting on acid anhydrides, in sulfonyl-containing anhydrides(GO:0016819) adenylylsulfatase activity(GO:0047627) |
| 0.1 | 1.3 | GO:0016273 | arginine N-methyltransferase activity(GO:0016273) protein-arginine N-methyltransferase activity(GO:0016274) |
| 0.1 | 1.2 | GO:0015140 | malate transmembrane transporter activity(GO:0015140) C4-dicarboxylate transmembrane transporter activity(GO:0015556) |
| 0.1 | 0.7 | GO:0035620 | ceramide transporter activity(GO:0035620) sphingolipid transporter activity(GO:0046624) ceramide 1-phosphate binding(GO:1902387) ceramide 1-phosphate transporter activity(GO:1902388) |
| 0.1 | 2.3 | GO:0019707 | protein-cysteine S-palmitoyltransferase activity(GO:0019706) protein-cysteine S-acyltransferase activity(GO:0019707) |
| 0.1 | 0.6 | GO:0042299 | lupeol synthase activity(GO:0042299) |
| 0.1 | 0.6 | GO:0004829 | threonine-tRNA ligase activity(GO:0004829) |
| 0.1 | 0.4 | GO:0031071 | cysteine desulfurase activity(GO:0031071) |
| 0.1 | 0.4 | GO:0004140 | dephospho-CoA kinase activity(GO:0004140) |
| 0.1 | 0.7 | GO:0015186 | L-glutamine transmembrane transporter activity(GO:0015186) |
| 0.1 | 1.0 | GO:0004739 | pyruvate dehydrogenase (acetyl-transferring) activity(GO:0004739) |
| 0.1 | 1.0 | GO:0051748 | UTP-monosaccharide-1-phosphate uridylyltransferase activity(GO:0051748) |
| 0.1 | 11.6 | GO:0004722 | protein serine/threonine phosphatase activity(GO:0004722) |
| 0.1 | 6.2 | GO:0015081 | sodium ion transmembrane transporter activity(GO:0015081) |
| 0.1 | 3.2 | GO:0008143 | poly(A) binding(GO:0008143) |
| 0.1 | 0.5 | GO:0051731 | cyclic-nucleotide phosphodiesterase activity(GO:0004112) 2',3'-cyclic-nucleotide 3'-phosphodiesterase activity(GO:0004113) polynucleotide 5'-hydroxyl-kinase activity(GO:0051731) |
| 0.1 | 1.2 | GO:0004362 | glutathione-disulfide reductase activity(GO:0004362) |
| 0.1 | 5.7 | GO:0005347 | ATP transmembrane transporter activity(GO:0005347) |
| 0.1 | 0.6 | GO:0016863 | intramolecular oxidoreductase activity, transposing C=C bonds(GO:0016863) |
| 0.1 | 0.6 | GO:0016653 | oxidoreductase activity, acting on NAD(P)H, heme protein as acceptor(GO:0016653) |
| 0.1 | 0.6 | GO:0050113 | inositol oxygenase activity(GO:0050113) |
| 0.1 | 0.6 | GO:0004473 | malate dehydrogenase (decarboxylating) (NADP+) activity(GO:0004473) |
| 0.1 | 0.5 | GO:0050815 | phosphoserine binding(GO:0050815) RNA polymerase II C-terminal domain phosphoserine binding(GO:1990269) |
| 0.1 | 15.1 | GO:0000978 | RNA polymerase II core promoter proximal region sequence-specific DNA binding(GO:0000978) |
| 0.1 | 0.6 | GO:0009883 | red or far-red light photoreceptor activity(GO:0009883) |
| 0.1 | 1.2 | GO:0035252 | UDP-xylosyltransferase activity(GO:0035252) |
| 0.1 | 0.7 | GO:0015368 | calcium:cation antiporter activity(GO:0015368) calcium:proton antiporter activity(GO:0015369) metal ion:proton antiporter activity(GO:0051139) |
| 0.1 | 0.4 | GO:0004749 | ribose phosphate diphosphokinase activity(GO:0004749) |
| 0.1 | 1.6 | GO:0008139 | nuclear localization sequence binding(GO:0008139) |
| 0.1 | 0.3 | GO:0003986 | acetyl-CoA hydrolase activity(GO:0003986) |
| 0.1 | 1.4 | GO:0016813 | hydrolase activity, acting on carbon-nitrogen (but not peptide) bonds, in linear amidines(GO:0016813) |
| 0.1 | 1.8 | GO:0031490 | chromatin DNA binding(GO:0031490) |
| 0.1 | 0.3 | GO:0048030 | disaccharide binding(GO:0048030) maltose binding(GO:1901982) |
| 0.1 | 3.8 | GO:0019187 | beta-1,4-mannosyltransferase activity(GO:0019187) mannan synthase activity(GO:0051753) |
| 0.1 | 0.5 | GO:0016675 | cytochrome-c oxidase activity(GO:0004129) heme-copper terminal oxidase activity(GO:0015002) oxidoreductase activity, acting on a heme group of donors(GO:0016675) oxidoreductase activity, acting on a heme group of donors, oxygen as acceptor(GO:0016676) |
| 0.1 | 6.3 | GO:0005096 | GTPase activator activity(GO:0005096) |
| 0.1 | 1.7 | GO:0016018 | cyclosporin A binding(GO:0016018) |
| 0.1 | 1.2 | GO:0032453 | histone demethylase activity (H3-K4 specific)(GO:0032453) histone demethylase activity (H3-trimethyl-K4 specific)(GO:0034647) |
| 0.1 | 0.4 | GO:0004534 | 5'-3' exoribonuclease activity(GO:0004534) |
| 0.1 | 0.7 | GO:0031492 | nucleosomal DNA binding(GO:0031492) |
| 0.1 | 1.6 | GO:0003978 | UDP-glucose 4-epimerase activity(GO:0003978) |
| 0.1 | 0.9 | GO:0032041 | NAD-dependent histone deacetylase activity(GO:0017136) histone deacetylase activity (H3-K14 specific)(GO:0031078) NAD-dependent histone deacetylase activity (H3-K14 specific)(GO:0032041) NAD-dependent protein deacetylase activity(GO:0034979) |
| 0.1 | 0.9 | GO:0043023 | ribosomal large subunit binding(GO:0043023) |
| 0.1 | 0.6 | GO:0030527 | structural constituent of chromatin(GO:0030527) |
| 0.1 | 1.9 | GO:0015020 | glucuronosyltransferase activity(GO:0015020) |
| 0.1 | 0.6 | GO:0016426 | tRNA (adenine) methyltransferase activity(GO:0016426) |
| 0.1 | 1.1 | GO:0048040 | UDP-glucuronate decarboxylase activity(GO:0048040) |
| 0.1 | 10.1 | GO:0019900 | kinase binding(GO:0019900) |
| 0.1 | 0.5 | GO:0004679 | AMP-activated protein kinase activity(GO:0004679) |
| 0.1 | 0.7 | GO:0017110 | nucleoside-diphosphatase activity(GO:0017110) |
| 0.1 | 14.1 | GO:0061630 | ubiquitin protein ligase activity(GO:0061630) |
| 0.1 | 1.2 | GO:0019902 | phosphatase binding(GO:0019902) |
| 0.1 | 24.2 | GO:0019787 | ubiquitin-like protein transferase activity(GO:0019787) |
| 0.1 | 0.9 | GO:0003955 | NAD(P)H dehydrogenase (quinone) activity(GO:0003955) |
| 0.1 | 0.5 | GO:0008732 | threonine aldolase activity(GO:0004793) L-allo-threonine aldolase activity(GO:0008732) |
| 0.1 | 6.5 | GO:0042910 | xenobiotic transporter activity(GO:0042910) |
| 0.1 | 0.3 | GO:0015152 | hexose phosphate transmembrane transporter activity(GO:0015119) glucose-6-phosphate transmembrane transporter activity(GO:0015152) |
| 0.1 | 0.3 | GO:0004824 | lysine-tRNA ligase activity(GO:0004824) |
| 0.1 | 1.2 | GO:0042300 | beta-amyrin synthase activity(GO:0042300) |
| 0.1 | 0.5 | GO:0030151 | molybdenum ion binding(GO:0030151) |
| 0.1 | 1.2 | GO:0004714 | transmembrane receptor protein tyrosine kinase activity(GO:0004714) |
| 0.1 | 0.4 | GO:0042800 | histone methyltransferase activity (H3-K4 specific)(GO:0042800) |
| 0.1 | 0.4 | GO:0010296 | prenylcysteine methylesterase activity(GO:0010296) |
| 0.1 | 1.2 | GO:0008097 | 5S rRNA binding(GO:0008097) |
| 0.1 | 0.3 | GO:0045430 | chalcone isomerase activity(GO:0045430) |
| 0.1 | 0.6 | GO:0001671 | ATPase activator activity(GO:0001671) |
| 0.1 | 1.4 | GO:0004311 | farnesyltranstransferase activity(GO:0004311) |
| 0.1 | 0.8 | GO:0019201 | nucleotide kinase activity(GO:0019201) |
| 0.1 | 1.2 | GO:0005242 | inward rectifier potassium channel activity(GO:0005242) |
| 0.1 | 1.2 | GO:0008889 | glycerophosphodiester phosphodiesterase activity(GO:0008889) |
| 0.1 | 0.2 | GO:0015377 | anion:cation symporter activity(GO:0015296) cation:chloride symporter activity(GO:0015377) |
| 0.1 | 0.2 | GO:0017077 | oxidative phosphorylation uncoupler activity(GO:0017077) |
| 0.1 | 1.0 | GO:0003950 | NAD+ ADP-ribosyltransferase activity(GO:0003950) |
| 0.1 | 1.1 | GO:0030674 | protein binding, bridging(GO:0030674) |
| 0.1 | 0.3 | GO:0004385 | guanylate kinase activity(GO:0004385) |
| 0.1 | 1.2 | GO:0031491 | nucleosome binding(GO:0031491) |
| 0.1 | 0.5 | GO:0017108 | 5'-flap endonuclease activity(GO:0017108) |
| 0.1 | 0.7 | GO:0016755 | transferase activity, transferring amino-acyl groups(GO:0016755) |
| 0.1 | 0.3 | GO:0004174 | electron-transferring-flavoprotein dehydrogenase activity(GO:0004174) oxidoreductase activity, acting on the CH-NH group of donors, quinone or similar compound as acceptor(GO:0016649) |
| 0.1 | 5.0 | GO:0008234 | cysteine-type peptidase activity(GO:0008234) |
| 0.1 | 0.5 | GO:0032977 | membrane insertase activity(GO:0032977) |
| 0.1 | 3.5 | GO:0004712 | protein serine/threonine/tyrosine kinase activity(GO:0004712) |
| 0.1 | 0.7 | GO:0030276 | clathrin binding(GO:0030276) |
| 0.1 | 0.6 | GO:0004392 | heme oxygenase (decyclizing) activity(GO:0004392) |
| 0.1 | 0.7 | GO:0047372 | acylglycerol lipase activity(GO:0047372) |
| 0.1 | 0.3 | GO:0015924 | mannosyl-oligosaccharide mannosidase activity(GO:0015924) |
| 0.1 | 1.7 | GO:0010427 | abscisic acid binding(GO:0010427) |
| 0.1 | 3.5 | GO:0016831 | carboxy-lyase activity(GO:0016831) |
| 0.1 | 4.3 | GO:0008080 | N-acetyltransferase activity(GO:0008080) |
| 0.1 | 3.2 | GO:0003743 | translation initiation factor activity(GO:0003743) |
| 0.1 | 1.0 | GO:0030955 | pyruvate kinase activity(GO:0004743) potassium ion binding(GO:0030955) alkali metal ion binding(GO:0031420) |
| 0.1 | 2.7 | GO:0036442 | hydrogen-exporting ATPase activity(GO:0036442) |
| 0.1 | 1.4 | GO:0016645 | oxidoreductase activity, acting on the CH-NH group of donors(GO:0016645) |
| 0.1 | 0.3 | GO:0016889 | endodeoxyribonuclease activity, producing 3'-phosphomonoesters(GO:0016889) |
| 0.1 | 1.2 | GO:0003887 | DNA-directed DNA polymerase activity(GO:0003887) |
| 0.1 | 0.5 | GO:0010385 | double-stranded methylated DNA binding(GO:0010385) |
| 0.1 | 0.6 | GO:0070300 | phosphatidic acid binding(GO:0070300) |
| 0.1 | 0.2 | GO:0046423 | allene-oxide cyclase activity(GO:0046423) |
| 0.1 | 0.5 | GO:0003886 | DNA (cytosine-5-)-methyltransferase activity(GO:0003886) |
| 0.1 | 0.4 | GO:0015391 | nucleobase:cation symporter activity(GO:0015391) |
| 0.1 | 0.2 | GO:0004819 | glutamine-tRNA ligase activity(GO:0004819) |
| 0.1 | 0.2 | GO:0004359 | glutaminase activity(GO:0004359) |
| 0.1 | 2.5 | GO:0051540 | iron-sulfur cluster binding(GO:0051536) metal cluster binding(GO:0051540) |
| 0.1 | 29.5 | GO:0000976 | regulatory region DNA binding(GO:0000975) transcription regulatory region sequence-specific DNA binding(GO:0000976) regulatory region nucleic acid binding(GO:0001067) transcription regulatory region DNA binding(GO:0044212) |
| 0.1 | 1.3 | GO:0003756 | protein disulfide isomerase activity(GO:0003756) intramolecular oxidoreductase activity, transposing S-S bonds(GO:0016864) |
| 0.1 | 1.4 | GO:0019888 | protein phosphatase regulator activity(GO:0019888) |
| 0.1 | 4.2 | GO:0015171 | amino acid transmembrane transporter activity(GO:0015171) |
| 0.1 | 2.2 | GO:0004222 | metalloendopeptidase activity(GO:0004222) |
| 0.1 | 0.4 | GO:0048038 | quinone binding(GO:0048038) |
| 0.1 | 0.4 | GO:0016149 | translation release factor activity, codon specific(GO:0016149) |
| 0.1 | 1.0 | GO:0009982 | pseudouridine synthase activity(GO:0009982) |
| 0.1 | 0.3 | GO:0004816 | asparagine-tRNA ligase activity(GO:0004816) |
| 0.1 | 1.0 | GO:0017069 | snRNA binding(GO:0017069) |
| 0.1 | 0.5 | GO:0030628 | pre-mRNA 3'-splice site binding(GO:0030628) |
| 0.0 | 0.2 | GO:0003785 | actin monomer binding(GO:0003785) |
| 0.0 | 2.6 | GO:0010857 | calmodulin-dependent protein kinase activity(GO:0004683) calcium-dependent protein serine/threonine kinase activity(GO:0009931) calcium-dependent protein kinase activity(GO:0010857) |
| 0.0 | 2.3 | GO:0005543 | phospholipid binding(GO:0005543) |
| 0.0 | 0.7 | GO:0015095 | magnesium ion transmembrane transporter activity(GO:0015095) |
| 0.0 | 0.6 | GO:0070181 | small ribosomal subunit rRNA binding(GO:0070181) |
| 0.0 | 0.2 | GO:0003909 | DNA ligase activity(GO:0003909) DNA ligase (ATP) activity(GO:0003910) |
| 0.0 | 2.7 | GO:0032182 | ubiquitin-like protein binding(GO:0032182) ubiquitin binding(GO:0043130) |
| 0.0 | 1.8 | GO:0051020 | GTPase binding(GO:0051020) |
| 0.0 | 0.5 | GO:0016289 | CoA hydrolase activity(GO:0016289) |
| 0.0 | 0.1 | GO:0004567 | beta-mannosidase activity(GO:0004567) |
| 0.0 | 0.3 | GO:0045182 | translation regulator activity(GO:0045182) |
| 0.0 | 0.4 | GO:0016723 | ferric-chelate reductase activity(GO:0000293) oxidoreductase activity, oxidizing metal ions, NAD or NADP as acceptor(GO:0016723) |
| 0.0 | 1.6 | GO:0042393 | histone binding(GO:0042393) |
| 0.0 | 0.2 | GO:0072328 | ethylene receptor activity(GO:0038199) ethylene binding(GO:0051740) alkene binding(GO:0072328) |
| 0.0 | 1.7 | GO:0022884 | protein transmembrane transporter activity(GO:0008320) macromolecule transmembrane transporter activity(GO:0022884) |
| 0.0 | 0.0 | GO:0004860 | protein kinase inhibitor activity(GO:0004860) |
| 0.0 | 0.4 | GO:0016847 | 1-aminocyclopropane-1-carboxylate synthase activity(GO:0016847) |
| 0.0 | 1.4 | GO:0003714 | transcription corepressor activity(GO:0003714) |
| 0.0 | 0.2 | GO:0034511 | U3 snoRNA binding(GO:0034511) |
| 0.0 | 2.8 | GO:0003724 | RNA helicase activity(GO:0003724) |
| 0.0 | 0.9 | GO:0015211 | purine nucleoside transmembrane transporter activity(GO:0015211) |
| 0.0 | 0.4 | GO:0004032 | alditol:NADP+ 1-oxidoreductase activity(GO:0004032) |
| 0.0 | 0.8 | GO:0019887 | protein kinase regulator activity(GO:0019887) |
| 0.0 | 0.3 | GO:0004930 | G-protein coupled receptor activity(GO:0004930) |
| 0.0 | 4.4 | GO:0016709 | oxidoreductase activity, acting on paired donors, with incorporation or reduction of molecular oxygen, NAD(P)H as one donor, and incorporation of one atom of oxygen(GO:0016709) |
| 0.0 | 0.3 | GO:0047216 | inositol 3-alpha-galactosyltransferase activity(GO:0047216) |
| 0.0 | 0.1 | GO:0004792 | thiosulfate sulfurtransferase activity(GO:0004792) |
| 0.0 | 0.7 | GO:0031386 | protein tag(GO:0031386) |
| 0.0 | 2.9 | GO:0032561 | GTP binding(GO:0005525) guanyl nucleotide binding(GO:0019001) guanyl ribonucleotide binding(GO:0032561) |
| 0.0 | 0.1 | GO:0032404 | single base insertion or deletion binding(GO:0032138) single thymine insertion binding(GO:0032143) mismatch repair complex binding(GO:0032404) MutLalpha complex binding(GO:0032405) |
| 0.0 | 0.8 | GO:0016762 | xyloglucan:xyloglucosyl transferase activity(GO:0016762) |
| 0.0 | 0.2 | GO:0070180 | large ribosomal subunit rRNA binding(GO:0070180) |
| 0.0 | 0.6 | GO:0005385 | zinc ion transmembrane transporter activity(GO:0005385) |
| 0.0 | 0.2 | GO:0043878 | glyceraldehyde-3-phosphate dehydrogenase (NAD+) (non-phosphorylating) activity(GO:0043878) |
| 0.0 | 0.1 | GO:0002020 | protease binding(GO:0002020) |
| 0.0 | 0.0 | GO:0019166 | trans-2-enoyl-CoA reductase (NADPH) activity(GO:0019166) |
| 0.0 | 0.4 | GO:0003684 | damaged DNA binding(GO:0003684) |
| 0.0 | 1.6 | GO:0051082 | unfolded protein binding(GO:0051082) |
| 0.0 | 0.6 | GO:0015079 | potassium ion transmembrane transporter activity(GO:0015079) |
| 0.0 | 0.2 | GO:0016884 | carbon-nitrogen ligase activity, with glutamine as amido-N-donor(GO:0016884) |
| 0.0 | 0.1 | GO:0004142 | diacylglycerol cholinephosphotransferase activity(GO:0004142) |
| 0.0 | 0.3 | GO:0003825 | alpha,alpha-trehalose-phosphate synthase (UDP-forming) activity(GO:0003825) |
| 0.0 | 1.7 | GO:0003779 | actin binding(GO:0003779) |
| 0.0 | 0.9 | GO:0003682 | chromatin binding(GO:0003682) |
| 0.0 | 0.1 | GO:0017169 | CDP-alcohol phosphatidyltransferase activity(GO:0017169) |
| 0.0 | 2.3 | GO:0043531 | ADP binding(GO:0043531) |
| 0.0 | 0.6 | GO:0003899 | DNA-directed RNA polymerase activity(GO:0003899) |
| 0.0 | 0.1 | GO:0016531 | copper chaperone activity(GO:0016531) |
| 0.0 | 0.1 | GO:0009881 | photoreceptor activity(GO:0009881) blue light photoreceptor activity(GO:0009882) |
| 0.0 | 0.6 | GO:0003993 | acid phosphatase activity(GO:0003993) |
| 0.0 | 0.1 | GO:0004365 | glyceraldehyde-3-phosphate dehydrogenase (NAD+) (phosphorylating) activity(GO:0004365) glyceraldehyde-3-phosphate dehydrogenase (NAD(P)+) (phosphorylating) activity(GO:0043891) |
| 0.0 | 0.4 | GO:0008134 | transcription factor binding(GO:0008134) |
Gene overrepresentation in curated gene sets: canonical pathways category:
| Log-likelihood per target | Total log-likelihood | Term | Description |
|---|---|---|---|
| 0.4 | 0.4 | PID MYC REPRESS PATHWAY | Validated targets of C-MYC transcriptional repression |
| 0.3 | 0.3 | PID RAS PATHWAY | Regulation of Ras family activation |
| 0.3 | 0.9 | SIG PIP3 SIGNALING IN CARDIAC MYOCTES | Genes related to PIP3 signaling in cardiac myocytes |
| 0.2 | 0.8 | PID TRKR PATHWAY | Neurotrophic factor-mediated Trk receptor signaling |
| 0.1 | 0.4 | PID NFAT TFPATHWAY | Calcineurin-regulated NFAT-dependent transcription in lymphocytes |
| 0.1 | 1.0 | PID CDC42 PATHWAY | CDC42 signaling events |
| 0.1 | 0.7 | PID P73PATHWAY | p73 transcription factor network |
| 0.1 | 0.4 | PID CIRCADIAN PATHWAY | Circadian rhythm pathway |
| 0.1 | 0.2 | PID HNF3B PATHWAY | FOXA2 and FOXA3 transcription factor networks |
| 0.1 | 0.1 | SA CASPASE CASCADE | Apoptosis is mediated by caspases, cysteine proteases arranged in a proteolytic cascade. |
| 0.1 | 0.2 | PID ARF 3PATHWAY | Arf1 pathway |
| 0.0 | 0.2 | SIG REGULATION OF THE ACTIN CYTOSKELETON BY RHO GTPASES | Genes related to regulation of the actin cytoskeleton |
| 0.0 | 0.2 | PID HIF1A PATHWAY | Hypoxic and oxygen homeostasis regulation of HIF-1-alpha |
Gene overrepresentation in curated gene sets: REACTOME pathways category:
| Log-likelihood per target | Total log-likelihood | Term | Description |
|---|---|---|---|
| 0.7 | 2.9 | REACTOME SYNTHESIS OF BILE ACIDS AND BILE SALTS | Genes involved in Synthesis of bile acids and bile salts |
| 0.4 | 1.1 | REACTOME PURINE METABOLISM | Genes involved in Purine metabolism |
| 0.3 | 1.0 | REACTOME AMINO ACID SYNTHESIS AND INTERCONVERSION TRANSAMINATION | Genes involved in Amino acid synthesis and interconversion (transamination) |
| 0.3 | 1.5 | REACTOME L1CAM INTERACTIONS | Genes involved in L1CAM interactions |
| 0.3 | 1.2 | REACTOME MITOCHONDRIAL PROTEIN IMPORT | Genes involved in Mitochondrial Protein Import |
| 0.3 | 1.1 | REACTOME PEROXISOMAL LIPID METABOLISM | Genes involved in Peroxisomal lipid metabolism |
| 0.3 | 0.8 | REACTOME FRS2 MEDIATED CASCADE | Genes involved in FRS2-mediated cascade |
| 0.3 | 2.1 | REACTOME POL SWITCHING | Genes involved in Polymerase switching |
| 0.3 | 3.6 | REACTOME FATTY ACID TRIACYLGLYCEROL AND KETONE BODY METABOLISM | Genes involved in Fatty acid, triacylglycerol, and ketone body metabolism |
| 0.2 | 1.3 | REACTOME NUCLEOTIDE EXCISION REPAIR | Genes involved in Nucleotide Excision Repair |
| 0.1 | 1.0 | REACTOME PLATELET ACTIVATION SIGNALING AND AGGREGATION | Genes involved in Platelet activation, signaling and aggregation |
| 0.1 | 0.1 | REACTOME HDL MEDIATED LIPID TRANSPORT | Genes involved in HDL-mediated lipid transport |
| 0.1 | 1.1 | REACTOME CHEMOKINE RECEPTORS BIND CHEMOKINES | Genes involved in Chemokine receptors bind chemokines |
| 0.1 | 0.4 | REACTOME BMAL1 CLOCK NPAS2 ACTIVATES CIRCADIAN EXPRESSION | Genes involved in BMAL1:CLOCK/NPAS2 Activates Circadian Expression |
| 0.1 | 0.2 | REACTOME AXON GUIDANCE | Genes involved in Axon guidance |
| 0.1 | 0.2 | REACTOME ABACAVIR TRANSPORT AND METABOLISM | Genes involved in Abacavir transport and metabolism |
| 0.1 | 0.4 | REACTOME PI METABOLISM | Genes involved in PI Metabolism |
| 0.1 | 0.3 | REACTOME MITOTIC PROMETAPHASE | Genes involved in Mitotic Prometaphase |
| 0.1 | 0.4 | REACTOME PROTEIN FOLDING | Genes involved in Protein folding |
| 0.0 | 0.7 | REACTOME METABOLISM OF LIPIDS AND LIPOPROTEINS | Genes involved in Metabolism of lipids and lipoproteins |
| 0.0 | 0.2 | REACTOME MRNA PROCESSING | Genes involved in mRNA Processing |
| 0.0 | 0.2 | REACTOME MEIOTIC RECOMBINATION | Genes involved in Meiotic Recombination |