Project
GSE43616: Time-course of wild-type Arabidopsis leaf
Navigation
Downloads
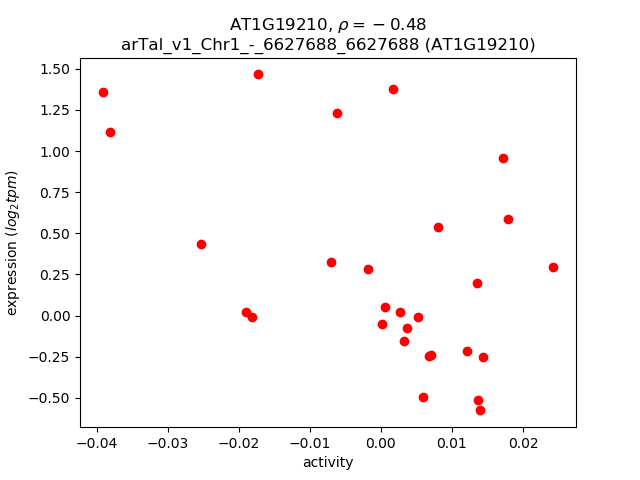
Results for AT1G19210
Z-value: 1.59
Transcription factors associated with AT1G19210
| Gene Symbol | Gene ID | Gene Info |
|---|---|---|
|
AT1G19210
|
AT1G19210 | Integrase-type DNA-binding superfamily protein |
Activity-expression correlation:
| Gene | Promoter | Pearson corr. coef. | P-value | Plot |
|---|---|---|---|---|
| AT1G19210 | arTal_v1_Chr1_-_6627688_6627688 | -0.48 | 9.0e-03 | Click! |
Activity profile of AT1G19210 motif
Sorted Z-values of AT1G19210 motif
| Promoter | Log-likelihood | Transcript | Gene | Gene Info |
|---|---|---|---|---|
| arTal_v1_Chr4_-_18098633_18098633 | 5.42 |
AT4G38770.1
|
PRP4
|
proline-rich protein 4 |
| arTal_v1_Chr3_+_5505360_5505360 | 4.37 |
AT3G16240.1
|
DELTA-TIP
|
delta tonoplast integral protein |
| arTal_v1_Chr5_+_26298728_26298728 | 4.36 |
AT5G65730.1
|
XTH6
|
xyloglucan endotransglucosylase/hydrolase 6 |
| arTal_v1_Chr2_-_1800472_1800472 | 4.35 |
AT2G05070.1
|
LHCB2.2
|
photosystem II light harvesting complex protein 2.2 |
| arTal_v1_Chr5_+_8863224_8863224 | 4.18 |
AT5G25460.1
|
DGR2
|
transmembrane protein, putative (Protein of unknown function, DUF642) |
| arTal_v1_Chr1_+_3008910_3008910 | 4.16 |
AT1G09310.1
|
AT1G09310
|
plant/protein (Protein of unknown function, DUF538) |
| arTal_v1_Chr1_+_10375754_10375754 | 3.98 |
AT1G29670.1
|
AT1G29670
|
GDSL-like Lipase/Acylhydrolase superfamily protein |
| arTal_v1_Chr3_-_16448844_16448844 | 3.97 |
AT3G44990.1
|
XTH31
|
xyloglucan endo-transglycosylase-related 8 |
| arTal_v1_Chr1_-_7531108_7531108 | 3.96 |
AT1G21500.1
|
AT1G21500
|
hypothetical protein |
| arTal_v1_Chr1_+_27338034_27338062 | 3.91 |
AT1G72600.2
AT1G72600.1 |
AT1G72600
|
hydroxyproline-rich glycoprotein family protein |
| arTal_v1_Chr2_-_18744322_18744322 | 3.90 |
AT2G45470.1
|
FLA8
|
FASCICLIN-like arabinogalactan protein 8 |
| arTal_v1_Chr1_+_10375599_10375599 | 3.89 |
AT1G29670.2
|
AT1G29670
|
GDSL-like Lipase/Acylhydrolase superfamily protein |
| arTal_v1_Chr3_+_5556710_5556710 | 3.88 |
AT3G16370.1
|
AT3G16370
|
GDSL-like Lipase/Acylhydrolase superfamily protein |
| arTal_v1_Chr3_-_23334034_23334034 | 3.83 |
AT3G63160.1
|
OEP6
|
outer envelope membrane protein |
| arTal_v1_Chr1_-_25049424_25049424 | 3.72 |
AT1G67090.2
|
RBCS1A
|
ribulose bisphosphate carboxylase small chain 1A |
| arTal_v1_Chr1_-_25049667_25049667 | 3.72 |
AT1G67090.1
|
RBCS1A
|
ribulose bisphosphate carboxylase small chain 1A |
| arTal_v1_Chr3_-_1860797_1860797 | 3.63 |
AT3G06145.1
|
AT3G06145
|
RING zinc finger protein |
| arTal_v1_Chr1_+_3157501_3157501 | 3.52 |
AT1G09750.1
|
AT1G09750
|
Eukaryotic aspartyl protease family protein |
| arTal_v1_Chr4_+_16022269_16022368 | 3.49 |
AT4G33220.1
AT4G33220.2 |
PME44
|
pectin methylesterase 44 |
| arTal_v1_Chr3_-_3357754_3357754 | 3.45 |
AT3G10720.2
|
AT3G10720
|
Plant invertase/pectin methylesterase inhibitor superfamily |
| arTal_v1_Chr2_+_2763449_2763513 | 3.44 |
AT2G06850.1
AT2G06850.2 |
XTH4
|
xyloglucan endotransglucosylase/hydrolase 4 |
| arTal_v1_Chr2_+_17592038_17592038 | 3.41 |
AT2G42220.1
|
AT2G42220
|
Rhodanese/Cell cycle control phosphatase superfamily protein |
| arTal_v1_Chr3_+_18046144_18046144 | 3.41 |
AT3G48720.1
|
DCF
|
HXXXD-type acyl-transferase family protein |
| arTal_v1_Chr3_-_23328789_23328789 | 3.38 |
AT3G63140.1
|
CSP41A
|
chloroplast stem-loop binding protein of 41 kDa |
| arTal_v1_Chr2_+_15059763_15059763 | 3.35 |
AT2G35860.1
|
FLA16
|
FASCICLIN-like arabinogalactan protein 16 precursor |
| arTal_v1_Chr1_+_10371675_10371675 | 3.34 |
AT1G29660.1
|
AT1G29660
|
GDSL-like Lipase/Acylhydrolase superfamily protein |
| arTal_v1_Chr4_+_6100714_6100714 | 3.33 |
AT4G09650.1
|
ATPD
|
F-type H+-transporting ATPase subunit delta |
| arTal_v1_Chr5_-_8916856_8916856 | 3.32 |
AT5G25610.1
|
RD22
|
BURP domain-containing protein |
| arTal_v1_Chr1_+_16127353_16127353 | 3.30 |
AT1G42970.1
|
GAPB
|
glyceraldehyde-3-phosphate dehydrogenase B subunit |
| arTal_v1_Chr1_-_7043392_7043392 | 3.30 |
AT1G20340.1
|
DRT112
|
Cupredoxin superfamily protein |
| arTal_v1_Chr1_-_8183570_8183650 | 3.30 |
AT1G23080.2
AT1G23080.3 AT1G23080.4 AT1G23080.1 |
PIN7
|
Auxin efflux carrier family protein |
| arTal_v1_Chr2_+_13647699_13647699 | 3.29 |
AT2G32100.1
|
OFP16
|
ovate family protein 16 |
| arTal_v1_Chr2_-_17648945_17649062 | 3.28 |
AT2G42380.1
AT2G42380.4 AT2G42380.3 AT2G42380.2 AT2G42380.5 |
BZIP34
|
Basic-leucine zipper (bZIP) transcription factor family protein |
| arTal_v1_Chr3_+_3479673_3479673 | 3.25 |
AT3G11110.1
|
AT3G11110
|
RING/U-box superfamily protein |
| arTal_v1_Chr4_-_7316871_7316871 | 3.24 |
AT4G12320.1
|
CYP706A6
|
cytochrome P450, family 706, subfamily A, polypeptide 6 |
| arTal_v1_Chr1_-_4530222_4530222 | 3.23 |
AT1G13250.1
|
GATL3
|
galacturonosyltransferase-like 3 |
| arTal_v1_Chr4_-_12400231_12400231 | 3.21 |
AT4G23820.1
|
AT4G23820
|
Pectin lyase-like superfamily protein |
| arTal_v1_Chr2_-_15474717_15474828 | 3.20 |
AT2G36870.2
AT2G36870.1 |
XTH32
|
xyloglucan endotransglucosylase/hydrolase 32 |
| arTal_v1_Chr3_-_21523375_21523518 | 3.20 |
AT3G58120.2
AT3G58120.1 |
BZIP61
|
Basic-leucine zipper (bZIP) transcription factor family protein |
| arTal_v1_Chr3_-_4744263_4744263 | 3.19 |
AT3G14240.1
|
AT3G14240
|
Subtilase family protein |
| arTal_v1_Chr1_+_20614573_20614610 | 3.18 |
AT1G55260.1
AT1G55260.2 |
AT1G55260
|
Bifunctional inhibitor/lipid-transfer protein/seed storage 2S albumin superfamily protein |
| arTal_v1_Chr5_-_18026077_18026077 | 3.18 |
AT5G44680.1
|
AT5G44680
|
DNA glycosylase superfamily protein |
| arTal_v1_Chr5_+_426226_426226 | 3.17 |
AT5G02160.1
|
AT5G02160
|
transmembrane protein |
| arTal_v1_Chr3_-_11013451_11013451 | 3.15 |
AT3G29030.1
|
EXPA5
|
expansin A5 |
| arTal_v1_Chr3_+_17949416_17949416 | 3.12 |
AT3G48460.1
|
AT3G48460
|
GDSL-like Lipase/Acylhydrolase superfamily protein |
| arTal_v1_Chr1_-_28419635_28419635 | 3.10 |
AT1G75680.1
|
GH9B7
|
glycosyl hydrolase 9B7 |
| arTal_v1_Chr3_+_2717557_2717676 | 3.09 |
AT3G08940.2
AT3G08940.1 |
LHCB4.2
|
light harvesting complex photosystem II |
| arTal_v1_Chr2_+_9844134_9844230 | 3.09 |
AT2G23130.1
AT2G23130.2 |
AGP17
|
arabinogalactan protein 17 |
| arTal_v1_Chr1_-_59215_59215 | 3.09 |
AT1G01120.1
|
KCS1
|
3-ketoacyl-CoA synthase 1 |
| arTal_v1_Chr1_+_907523_907651 | 3.06 |
AT1G03630.1
AT1G03630.2 |
POR C
|
protochlorophyllide oxidoreductase C |
| arTal_v1_Chr4_-_7493080_7493080 | 3.06 |
AT4G12730.1
|
FLA2
|
FASCICLIN-like arabinogalactan 2 |
| arTal_v1_Chr5_+_26767599_26767599 | 3.03 |
AT5G67070.1
|
RALFL34
|
ralf-like 34 |
| arTal_v1_Chr2_-_1824480_1824480 | 2.97 |
AT2G05100.1
AT2G05100.2 |
LHCB2.1
|
photosystem II light harvesting complex protein 2.1 |
| arTal_v1_Chr1_+_898480_898480 | 2.94 |
AT1G03600.1
|
PSB27
|
photosystem II family protein |
| arTal_v1_Chr4_-_18165740_18165740 | 2.92 |
AT4G38970.2
|
FBA2
|
fructose-bisphosphate aldolase 2 |
| arTal_v1_Chr4_-_18166008_18166008 | 2.92 |
AT4G38970.1
|
FBA2
|
fructose-bisphosphate aldolase 2 |
| arTal_v1_Chr1_-_983544_983544 | 2.91 |
AT1G03870.1
|
FLA9
|
FASCICLIN-like arabinoogalactan 9 |
| arTal_v1_Chr5_-_8338032_8338032 | 2.91 |
AT5G24420.1
|
PGL5
|
6-phosphogluconolactonase 5 |
| arTal_v1_Chr2_+_15168533_15168533 | 2.89 |
AT2G36145.1
|
AT2G36145
|
hypothetical protein |
| arTal_v1_Chr1_-_28554810_28554930 | 2.86 |
AT1G76100.1
AT1G76100.2 |
PETE1
|
plastocyanin 1 |
| arTal_v1_Chr5_-_3190321_3190321 | 2.85 |
AT5G10170.1
|
MIPS3
|
myo-inositol-1-phosphate synthase 3 |
| arTal_v1_Chr1_+_2047886_2047886 | 2.83 |
AT1G06680.2
|
PSBP-1
|
photosystem II subunit P-1 |
| arTal_v1_Chr1_+_2047634_2047634 | 2.83 |
AT1G06680.1
|
PSBP-1
|
photosystem II subunit P-1 |
| arTal_v1_Chr5_+_24494291_24494291 | 2.82 |
AT5G60890.1
|
MYB34
|
myb domain protein 34 |
| arTal_v1_Chr3_-_2130451_2130451 | 2.81 |
AT3G06750.1
|
AT3G06750
|
hydroxyproline-rich glycoprotein family protein |
| arTal_v1_Chr2_+_18286321_18286321 | 2.81 |
AT2G44230.1
|
AT2G44230
|
hypothetical protein (DUF946) |
| arTal_v1_Chr4_-_12772438_12772479 | 2.81 |
AT4G24780.1
AT4G24780.2 |
AT4G24780
|
Pectin lyase-like superfamily protein |
| arTal_v1_Chr3_+_2712236_2712236 | 2.81 |
AT3G08920.1
|
AT3G08920
|
Rhodanese/Cell cycle control phosphatase superfamily protein |
| arTal_v1_Chr2_+_266559_266630 | 2.80 |
AT2G01590.1
AT2G01590.2 |
CRR3
|
chlororespiratory reduction 3 |
| arTal_v1_Chr1_+_24229063_24229063 | 2.80 |
AT1G65230.1
|
AT1G65230
|
transmembrane protein, putative (DUF2358) |
| arTal_v1_Chr3_-_3356811_3356811 | 2.79 |
AT3G10720.1
|
AT3G10720
|
Plant invertase/pectin methylesterase inhibitor superfamily |
| arTal_v1_Chr4_-_7545326_7545326 | 2.78 |
AT4G12880.2
|
ENODL19
|
early nodulin-like protein 19 |
| arTal_v1_Chr4_+_7521257_7521322 | 2.78 |
AT4G12800.2
AT4G12800.1 |
PSAL
|
photosystem I subunit l |
| arTal_v1_Chr4_-_7591259_7591259 | 2.77 |
AT4G12980.1
|
AT4G12980
|
Auxin-responsive family protein |
| arTal_v1_Chr3_+_22902491_22902638 | 2.77 |
AT3G61870.1
AT3G61870.2 |
AT3G61870
|
plant/protein |
| arTal_v1_Chr1_+_20101299_20101299 | 2.75 |
AT1G53840.1
|
PME1
|
pectin methylesterase 1 |
| arTal_v1_Chr1_-_6319427_6319427 | 2.74 |
AT1G18360.1
|
AT1G18360
|
alpha/beta-Hydrolases superfamily protein |
| arTal_v1_Chr4_-_13398307_13398307 | 2.74 |
AT4G26540.1
|
AT4G26540
|
Leucine-rich repeat receptor-like protein kinase family protein |
| arTal_v1_Chr1_-_6487153_6487153 | 2.72 |
AT1G18810.1
|
AT1G18810
|
phytochrome kinase substrate-like protein |
| arTal_v1_Chr5_+_7103384_7103419 | 2.70 |
AT5G20935.1
AT5G20935.2 |
CRR42
|
DUF3148 family protein |
| arTal_v1_Chr1_-_4265156_4265156 | 2.66 |
AT1G12500.1
|
AT1G12500
|
Nucleotide-sugar transporter family protein |
| arTal_v1_Chr5_+_16468327_16468344 | 2.64 |
AT5G41140.1
AT5G41140.2 |
AT5G41140
|
Myosin heavy chain-related protein |
| arTal_v1_Chr4_-_7545512_7545512 | 2.64 |
AT4G12880.1
|
ENODL19
|
early nodulin-like protein 19 |
| arTal_v1_Chr4_+_12876822_12876948 | 2.63 |
AT4G25080.6
AT4G25080.5 AT4G25080.2 AT4G25080.1 AT4G25080.3 AT4G25080.4 |
CHLM
|
magnesium-protoporphyrin IX methyltransferase |
| arTal_v1_Chr5_+_4087689_4087689 | 2.63 |
AT5G12940.1
|
AT5G12940
|
Leucine-rich repeat (LRR) family protein |
| arTal_v1_Chr1_-_26765285_26765285 | 2.63 |
AT1G70985.1
|
AT1G70985
|
hydroxyproline-rich glycoprotein family protein |
| arTal_v1_Chr1_+_16871696_16871696 | 2.61 |
AT1G44575.2
|
NPQ4
|
Chlorophyll A-B binding family protein |
| arTal_v1_Chr4_-_16806830_16806830 | 2.61 |
AT4G35320.1
|
AT4G35320
|
hypothetical protein |
| arTal_v1_Chr1_+_16871511_16871511 | 2.61 |
AT1G44575.3
|
NPQ4
|
Chlorophyll A-B binding family protein |
| arTal_v1_Chr5_+_25016860_25016860 | 2.59 |
AT5G62280.1
|
AT5G62280
|
DUF1442 family protein (DUF1442) |
| arTal_v1_Chr1_+_16870221_16870221 | 2.58 |
AT1G44575.1
|
NPQ4
|
Chlorophyll A-B binding family protein |
| arTal_v1_Chr5_-_16820195_16820195 | 2.57 |
AT5G42070.1
|
AT5G42070
|
hypothetical protein |
| arTal_v1_Chr5_+_7168106_7168106 | 2.57 |
AT5G21100.1
|
AT5G21100
|
Plant L-ascorbate oxidase |
| arTal_v1_Chr5_+_21479382_21479382 | 2.53 |
AT5G52970.1
AT5G52970.2 |
AT5G52970
|
thylakoid lumen 15.0 kDa protein |
| arTal_v1_Chr1_+_13208683_13208683 | 2.53 |
AT1G35680.1
|
RPL21C
|
Ribosomal protein L21 |
| arTal_v1_Chr5_+_208866_208866 | 2.53 |
AT5G01530.1
|
LHCB4.1
|
light harvesting complex photosystem II |
| arTal_v1_Chr5_+_17937622_17937622 | 2.51 |
AT5G44530.3
AT5G44530.2 AT5G44530.1 |
AT5G44530
|
Subtilase family protein |
| arTal_v1_Chr3_+_8586359_8586359 | 2.48 |
AT3G23805.1
|
RALFL24
|
ralf-like 24 |
| arTal_v1_Chr3_-_17837998_17837998 | 2.48 |
AT3G48200.1
|
AT3G48200
|
transmembrane protein |
| arTal_v1_Chr1_+_1136078_1136078 | 2.48 |
AT1G04250.1
|
AXR3
|
AUX/IAA transcriptional regulator family protein |
| arTal_v1_Chr4_-_14204061_14204061 | 2.46 |
AT4G28750.1
|
PSAE-1
|
Photosystem I reaction centre subunit IV / PsaE protein |
| arTal_v1_Chr5_+_2680401_2680401 | 2.45 |
AT5G08330.1
|
TCP11
|
TCP family transcription factor |
| arTal_v1_Chr1_+_27991165_27991165 | 2.44 |
AT1G74470.1
|
AT1G74470
|
Pyridine nucleotide-disulfide oxidoreductase family protein |
| arTal_v1_Chr1_-_19101265_19101265 | 2.43 |
AT1G51500.1
|
ABCG12
|
ABC-2 type transporter family protein |
| arTal_v1_Chr2_+_8940833_8940833 | 2.43 |
AT2G20750.2
AT2G20750.1 |
EXPB1
|
expansin B1 |
| arTal_v1_Chr1_-_26538437_26538437 | 2.42 |
AT1G70410.2
|
BCA4
|
beta carbonic anhydrase 4 |
| arTal_v1_Chr3_-_6855513_6855590 | 2.41 |
AT3G19720.3
AT3G19720.2 AT3G19720.1 |
ARC5
|
P-loop containing nucleoside triphosphate hydrolases superfamily protein |
| arTal_v1_Chr3_-_19467455_19467455 | 2.40 |
AT3G52500.1
|
AT3G52500
|
Eukaryotic aspartyl protease family protein |
| arTal_v1_Chr1_-_20648891_20648891 | 2.40 |
AT1G55330.1
|
AGP21
|
arabinogalactan protein 21 |
| arTal_v1_Chr3_-_5271984_5271984 | 2.39 |
AT3G15570.1
|
AT3G15570
|
Phototropic-responsive NPH3 family protein |
| arTal_v1_Chr3_+_22745514_22745514 | 2.38 |
AT3G61470.1
|
LHCA2
|
photosystem I light harvesting complex protein |
| arTal_v1_Chr4_-_1230164_1230164 | 2.38 |
AT4G02770.1
|
PSAD-1
|
photosystem I subunit D-1 |
| arTal_v1_Chr1_-_26515188_26515255 | 2.37 |
AT1G70370.2
AT1G70370.1 |
PG2
|
polygalacturonase 2 |
| arTal_v1_Chr2_-_10043673_10043840 | 2.36 |
AT2G23600.1
AT2G23600.3 AT2G23600.2 |
ACL
|
acetone-cyanohydrin lyase |
| arTal_v1_Chr5_-_24990331_24990331 | 2.35 |
AT5G62220.1
|
GT18
|
glycosyltransferase 18 |
| arTal_v1_Chr1_+_28428671_28428671 | 2.34 |
AT1G75710.1
|
AT1G75710
|
C2H2-like zinc finger protein |
| arTal_v1_Chr4_+_14192569_14192569 | 2.33 |
AT4G28720.1
|
YUC8
|
Flavin-binding monooxygenase family protein |
| arTal_v1_Chr5_-_20940895_20940895 | 2.33 |
AT5G51550.1
|
EXL3
|
EXORDIUM like 3 |
| arTal_v1_Chr4_+_14517393_14517393 | 2.32 |
AT4G29610.1
|
AT4G29610
|
Cytidine/deoxycytidylate deaminase family protein |
| arTal_v1_Chr1_-_1768837_1768837 | 2.32 |
AT1G05850.2
AT1G05850.1 |
POM1
|
Chitinase family protein |
| arTal_v1_Chr5_+_15703078_15703078 | 2.32 |
AT5G39210.1
|
CRR7
|
chlororespiratory reduction 7 |
| arTal_v1_Chr3_-_3108266_3108385 | 2.32 |
AT3G10080.1
AT3G10080.2 |
AT3G10080
|
RmlC-like cupins superfamily protein |
| arTal_v1_Chr3_+_7280792_7280792 | 2.32 |
AT3G20820.1
|
AT3G20820
|
Leucine-rich repeat (LRR) family protein |
| arTal_v1_Chr3_-_4775258_4775258 | 2.31 |
AT3G14310.1
|
PME3
|
pectin methylesterase 3 |
| arTal_v1_Chr1_+_17918207_17918207 | 2.30 |
AT1G48480.1
|
RKL1
|
receptor-like kinase 1 |
| arTal_v1_Chr1_-_24062804_24062804 | 2.29 |
AT1G64780.1
|
AMT1%3B2
|
ammonium transporter 1;2 |
| arTal_v1_Chr1_-_29352946_29352946 | 2.28 |
AT1G78060.1
|
AT1G78060
|
Glycosyl hydrolase family protein |
| arTal_v1_Chr1_-_26537422_26537426 | 2.28 |
AT1G70410.3
AT1G70410.1 |
BCA4
|
beta carbonic anhydrase 4 |
| arTal_v1_Chr1_+_28458691_28458691 | 2.28 |
AT1G75800.1
|
AT1G75800
|
Pathogenesis-related thaumatin superfamily protein |
| arTal_v1_Chr3_+_1225919_1225919 | 2.27 |
AT3G04550.1
|
AT3G04550
|
rubisco accumulation factor-like protein |
| arTal_v1_Chr1_-_754262_754262 | 2.27 |
AT1G03130.1
|
PSAD-2
|
photosystem I subunit D-2 |
| arTal_v1_Chr4_+_17986384_17986384 | 2.27 |
AT4G38430.1
|
ROPGEF1
|
rho guanyl-nucleotide exchange factor 1 |
| arTal_v1_Chr1_-_18413016_18413016 | 2.26 |
AT1G49750.1
|
AT1G49750
|
Leucine-rich repeat (LRR) family protein |
| arTal_v1_Chr2_-_14523568_14523568 | 2.26 |
AT2G34420.1
|
LHB1B2
|
photosystem II light harvesting complex protein B1B2 |
| arTal_v1_Chr2_+_18691664_18691664 | 2.25 |
AT2G45340.1
|
AT2G45340
|
Leucine-rich repeat protein kinase family protein |
| arTal_v1_Chr4_-_8454144_8454159 | 2.25 |
AT4G14740.4
AT4G14740.2 AT4G14740.1 |
AT4G14740
|
auxin canalization protein (DUF828) |
| arTal_v1_Chr3_+_23345754_23345754 | 2.25 |
AT3G63200.1
|
PLP9
|
PATATIN-like protein 9 |
| arTal_v1_Chr2_-_15797059_15797059 | 2.23 |
AT2G37660.1
|
AT2G37660
|
NAD(P)-binding Rossmann-fold superfamily protein |
| arTal_v1_Chr2_+_8063023_8063023 | 2.23 |
AT2G18570.1
|
AT2G18570
|
UDP-Glycosyltransferase superfamily protein |
| arTal_v1_Chr2_+_15289975_15289975 | 2.23 |
AT2G36430.1
|
AT2G36430
|
transmembrane protein, putative (DUF247) |
| arTal_v1_Chr3_-_20257916_20257916 | 2.23 |
AT3G54720.1
|
AMP1
|
Peptidase M28 family protein |
| arTal_v1_Chr3_-_1832190_1832190 | 2.22 |
AT3G06070.1
|
AT3G06070
|
hypothetical protein |
| arTal_v1_Chr4_+_160643_160643 | 2.22 |
AT4G00360.1
|
CYP86A2
|
cytochrome P450, family 86, subfamily A, polypeptide 2 |
| arTal_v1_Chr2_-_183639_183764 | 2.20 |
AT2G01420.3
AT2G01420.1 AT2G01420.2 |
PIN4
|
Auxin efflux carrier family protein |
| arTal_v1_Chr3_+_5681380_5681380 | 2.20 |
AT3G16670.1
|
AT3G16670
|
Pollen Ole e 1 allergen and extensin family protein |
| arTal_v1_Chr1_+_6927736_6927736 | 2.20 |
AT1G19960.1
|
AT1G19960
|
transcription factor |
| arTal_v1_Chr2_+_13940187_13940187 | 2.20 |
AT2G32860.2
AT2G32860.1 |
BGLU33
|
beta glucosidase 33 |
| arTal_v1_Chr3_-_3931000_3931000 | 2.20 |
AT3G12345.1
|
AT3G12345
|
FKBP-type peptidyl-prolyl cis-trans isomerase |
| arTal_v1_Chr1_+_27670626_27670626 | 2.19 |
AT1G73600.1
|
AT1G73600
|
S-adenosyl-L-methionine-dependent methyltransferases superfamily protein |
| arTal_v1_Chr3_+_5676749_5676829 | 2.19 |
AT3G16660.2
AT3G16660.1 |
AT3G16660
|
Pollen Ole e 1 allergen and extensin family protein |
| arTal_v1_Chr5_+_1952505_1952505 | 2.19 |
AT5G06390.1
|
FLA17
|
FASCICLIN-like arabinogalactan protein 17 precursor |
| arTal_v1_Chr4_+_15819489_15819489 | 2.19 |
AT4G32800.1
|
AT4G32800
|
Integrase-type DNA-binding superfamily protein |
| arTal_v1_Chr1_+_27669152_27669152 | 2.19 |
AT1G73600.2
|
AT1G73600
|
S-adenosyl-L-methionine-dependent methyltransferases superfamily protein |
| arTal_v1_Chr2_-_14325205_14325205 | 2.17 |
AT2G33855.1
|
AT2G33855
|
transmembrane protein |
| arTal_v1_Chr3_+_11252807_11252807 | 2.17 |
AT3G29320.1
|
PHS1
|
Glycosyl transferase, family 35 |
| arTal_v1_Chr1_+_24503315_24503315 | 2.17 |
AT1G65870.1
|
AT1G65870
|
Disease resistance-responsive (dirigent-like protein) family protein |
| arTal_v1_Chr2_+_17507343_17507343 | 2.16 |
AT2G41940.1
|
ZFP8
|
zinc finger protein 8 |
| arTal_v1_Chr5_-_22560461_22560541 | 2.15 |
AT5G55730.2
AT5G55730.1 |
FLA1
|
FASCICLIN-like arabinogalactan 1 |
| arTal_v1_Chr1_+_20048434_20048434 | 2.15 |
AT1G53700.1
|
WAG1
|
WAG 1 |
| arTal_v1_Chr5_+_15421573_15421573 | 2.15 |
AT5G38520.2
|
AT5G38520
|
alpha/beta-Hydrolases superfamily protein |
| arTal_v1_Chr5_+_7778017_7778095 | 2.15 |
AT5G23120.2
AT5G23120.1 |
HCF136
|
photosystem II stability/assembly factor, chloroplast (HCF136) |
| arTal_v1_Chr2_-_16391073_16391176 | 2.15 |
AT2G39250.2
AT2G39250.1 |
SNZ
|
Integrase-type DNA-binding superfamily protein |
| arTal_v1_Chr1_-_11872926_11872926 | 2.15 |
AT1G32780.1
|
AT1G32780
|
GroES-like zinc-binding dehydrogenase family protein |
| arTal_v1_Chr5_-_18371021_18371021 | 2.14 |
AT5G45340.2
AT5G45340.1 |
CYP707A3
|
cytochrome P450, family 707, subfamily A, polypeptide 3 |
| arTal_v1_Chr5_+_15421289_15421289 | 2.14 |
AT5G38520.1
|
AT5G38520
|
alpha/beta-Hydrolases superfamily protein |
| arTal_v1_Chr1_+_7886323_7886323 | 2.14 |
AT1G22330.1
|
AT1G22330
|
RNA-binding (RRM/RBD/RNP motifs) family protein |
| arTal_v1_Chr5_+_18697235_18697250 | 2.13 |
AT5G46110.2
AT5G46110.1 AT5G46110.3 AT5G46110.4 |
APE2
|
Glucose-6-phosphate/phosphate translocator-like protein |
| arTal_v1_Chr4_+_9803624_9803624 | 2.13 |
AT4G17600.1
|
LIL3:1
|
Chlorophyll A-B binding family protein |
| arTal_v1_Chr5_+_26261136_26261136 | 2.13 |
AT5G65683.1
|
WAVH2
|
Zinc finger (C3HC4-type RING finger) family protein |
| arTal_v1_Chr3_-_20841695_20841734 | 2.13 |
AT3G56160.1
AT3G56160.3 AT3G56160.2 AT3G56160.4 |
AT3G56160
|
Sodium Bile acid symporter family |
| arTal_v1_Chr4_-_13958107_13958107 | 2.12 |
AT4G28080.1
|
AT4G28080
|
Tetratricopeptide repeat (TPR)-like superfamily protein |
| arTal_v1_Chr5_+_24667873_24667873 | 2.12 |
AT5G61350.1
|
AT5G61350
|
Protein kinase superfamily protein |
| arTal_v1_Chr5_-_7026533_7026533 | 2.12 |
AT5G20740.1
|
AT5G20740
|
Plant invertase/pectin methylesterase inhibitor superfamily protein |
| arTal_v1_Chr2_+_12874465_12874465 | 2.11 |
AT2G30150.2
|
AT2G30150
|
UDP-Glycosyltransferase superfamily protein |
| arTal_v1_Chr2_-_15790139_15790139 | 2.11 |
AT2G37640.1
|
EXP3
|
Barwin-like endoglucanases superfamily protein |
| arTal_v1_Chr1_+_23911024_23911024 | 2.11 |
AT1G64390.1
|
GH9C2
|
glycosyl hydrolase 9C2 |
| arTal_v1_Chr3_-_2334185_2334185 | 2.11 |
AT3G07320.1
|
AT3G07320
|
O-Glycosyl hydrolases family 17 protein |
| arTal_v1_Chr3_-_18834834_18834834 | 2.11 |
AT3G50685.1
|
AT3G50685
|
anti-muellerian hormone type-2 receptor |
| arTal_v1_Chr2_+_1679307_1679507 | 2.11 |
AT2G04790.10
AT2G04790.6 AT2G04790.5 AT2G04790.7 AT2G04790.9 AT2G04790.8 AT2G04790.13 AT2G04790.12 AT2G04790.11 AT2G04790.14 AT2G04790.15 AT2G04790.16 AT2G04790.4 AT2G04790.3 AT2G04790.1 AT2G04790.2 |
AT2G04790
|
PTB domain engulfment adapter |
| arTal_v1_Chr3_+_5934033_5934064 | 2.10 |
AT3G17350.1
AT3G17350.2 |
AT3G17350
|
wall-associated receptor kinase carboxy-terminal protein |
| arTal_v1_Chr2_+_15106940_15106940 | 2.10 |
AT2G35960.1
|
NHL12
|
NDR1/HIN1-like 12 |
| arTal_v1_Chr5_-_3728726_3728726 | 2.10 |
AT5G11590.1
|
TINY2
|
Integrase-type DNA-binding superfamily protein |
| arTal_v1_Chr2_+_12874706_12874706 | 2.10 |
AT2G30150.1
|
AT2G30150
|
UDP-Glycosyltransferase superfamily protein |
| arTal_v1_Chr5_+_13949228_13949228 | 2.10 |
AT5G35777.1
|
AT5G35777
|
|
| arTal_v1_Chr5_-_26845294_26845294 | 2.10 |
AT5G67280.1
|
RLK
|
receptor-like kinase |
| arTal_v1_Chr1_-_84864_84946 | 2.09 |
AT1G01190.1
AT1G01190.2 |
CYP78A8
|
cytochrome P450, family 78, subfamily A, polypeptide 8 |
| arTal_v1_Chr1_+_19879405_19879405 | 2.09 |
AT1G53300.1
|
TTL1
|
tetratricopetide-repeat thioredoxin-like 1 |
| arTal_v1_Chr3_+_18262290_18262511 | 2.09 |
AT3G49260.1
AT3G49260.3 AT3G49260.2 AT3G49260.4 |
iqd21
|
IQ-domain 21 |
| arTal_v1_Chr1_-_6805092_6805092 | 2.09 |
AT1G19670.1
|
CLH1
|
chlorophyllase 1 |
| arTal_v1_Chr1_+_3031046_3031046 | 2.09 |
AT1G09390.1
|
AT1G09390
|
GDSL-like Lipase/Acylhydrolase superfamily protein |
| arTal_v1_Chr3_+_19639549_19639549 | 2.09 |
AT3G52960.1
|
AT3G52960
|
Thioredoxin superfamily protein |
| arTal_v1_Chr1_-_29638773_29638773 | 2.08 |
AT1G78830.1
|
AT1G78830
|
Curculin-like (mannose-binding) lectin family protein |
| arTal_v1_Chr2_-_15789605_15789605 | 2.08 |
AT2G37640.2
|
EXP3
|
Barwin-like endoglucanases superfamily protein |
| arTal_v1_Chr3_-_9723904_9723904 | 2.07 |
AT3G26520.1
|
TIP2
|
tonoplast intrinsic protein 2 |
| arTal_v1_Chr2_-_12685145_12685151 | 2.06 |
AT2G29670.2
AT2G29670.1 |
AT2G29670
|
Tetratricopeptide repeat (TPR)-like superfamily protein |
| arTal_v1_Chr5_-_20110638_20110638 | 2.06 |
AT5G49555.1
|
AT5G49555
|
FAD/NAD(P)-binding oxidoreductase family protein |
| arTal_v1_Chr1_-_25395249_25395249 | 2.06 |
AT1G67740.1
|
PSBY
|
photosystem II BY |
| arTal_v1_Chr4_-_17606924_17607050 | 2.06 |
AT4G37450.1
AT4G37450.2 |
AGP18
|
arabinogalactan protein 18 |
| arTal_v1_Chr3_-_10877578_10877578 | 2.06 |
AT3G28860.1
|
ABCB19
|
ATP binding cassette subfamily B19 |
| arTal_v1_Chr2_-_13120199_13120199 | 2.05 |
AT2G30790.1
|
PSBP-2
|
photosystem II subunit P-2 |
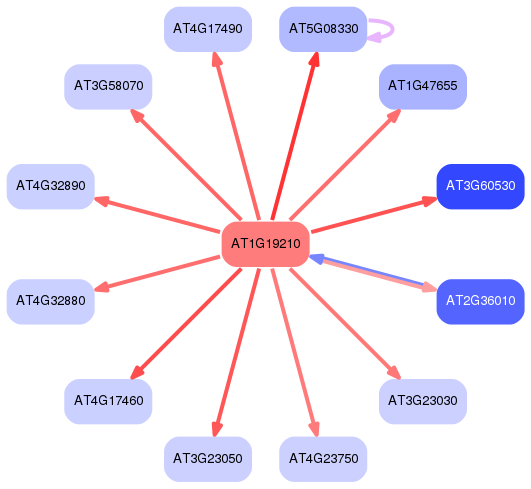
Network of associatons between targets according to the STRING database.

First level regulatory network of AT1G19210
Gene Ontology Analysis
Gene overrepresentation in biological process category:
| Log-likelihood per target | Total log-likelihood | Term | Description |
|---|---|---|---|
| 1.9 | 5.8 | GO:0015840 | urea transport(GO:0015840) |
| 1.6 | 9.6 | GO:0009769 | photosynthesis, light harvesting in photosystem II(GO:0009769) |
| 1.1 | 3.3 | GO:0080170 | hydrogen peroxide transmembrane transport(GO:0080170) |
| 1.1 | 3.2 | GO:0010028 | xanthophyll cycle(GO:0010028) |
| 1.0 | 3.0 | GO:0006428 | isoleucyl-tRNA aminoacylation(GO:0006428) |
| 0.9 | 0.9 | GO:0046717 | acid secretion(GO:0046717) |
| 0.9 | 9.6 | GO:1990066 | nonphotochemical quenching(GO:0010196) energy quenching(GO:1990066) |
| 0.9 | 2.6 | GO:0002698 | negative regulation of immune effector process(GO:0002698) negative regulation of defense response to virus(GO:0050687) |
| 0.8 | 2.3 | GO:0010275 | NAD(P)H dehydrogenase complex assembly(GO:0010275) |
| 0.8 | 3.8 | GO:0032410 | negative regulation of anion channel activity(GO:0010360) regulation of anion channel activity by blue light(GO:0010361) negative regulation of anion channel activity by blue light(GO:0010362) negative regulation of transporter activity(GO:0032410) negative regulation of ion transmembrane transporter activity(GO:0032413) negative regulation of transmembrane transport(GO:0034763) negative regulation of ion transmembrane transport(GO:0034766) negative regulation of anion transport(GO:1903792) negative regulation of anion transmembrane transport(GO:1903960) |
| 0.7 | 2.2 | GO:0080145 | cysteine homeostasis(GO:0080145) |
| 0.7 | 2.2 | GO:0042407 | cristae formation(GO:0042407) |
| 0.7 | 2.1 | GO:0015717 | triose phosphate transport(GO:0015717) triose phosphate transmembrane transport(GO:0035436) |
| 0.7 | 1.4 | GO:0042549 | photosystem II stabilization(GO:0042549) |
| 0.7 | 2.1 | GO:0010541 | acropetal auxin transport(GO:0010541) |
| 0.7 | 10.6 | GO:0010315 | auxin efflux(GO:0010315) |
| 0.7 | 2.0 | GO:0046498 | S-adenosylmethionine cycle(GO:0033353) S-adenosylhomocysteine metabolic process(GO:0046498) |
| 0.6 | 1.9 | GO:1901031 | regulation of response to reactive oxygen species(GO:1901031) |
| 0.6 | 10.1 | GO:0016998 | cell wall macromolecule catabolic process(GO:0016998) |
| 0.6 | 0.6 | GO:0033478 | UDP-rhamnose biosynthetic process(GO:0010253) UDP-rhamnose metabolic process(GO:0033478) |
| 0.6 | 3.5 | GO:0009759 | indole glucosinolate biosynthetic process(GO:0009759) |
| 0.6 | 4.7 | GO:0010065 | primary meristem tissue development(GO:0010065) |
| 0.6 | 11.1 | GO:0006949 | syncytium formation(GO:0006949) |
| 0.6 | 3.4 | GO:0009090 | homoserine biosynthetic process(GO:0009090) |
| 0.5 | 3.3 | GO:0045038 | protein import into chloroplast thylakoid membrane(GO:0045038) |
| 0.5 | 2.1 | GO:0033306 | phytol metabolic process(GO:0033306) |
| 0.5 | 7.4 | GO:1902183 | regulation of shoot apical meristem development(GO:1902183) |
| 0.5 | 2.1 | GO:0019586 | uronic acid metabolic process(GO:0006063) galacturonate metabolic process(GO:0019586) |
| 0.5 | 0.5 | GO:0046166 | glyceraldehyde-3-phosphate biosynthetic process(GO:0046166) |
| 0.5 | 8.0 | GO:0009768 | photosynthesis, light harvesting in photosystem I(GO:0009768) |
| 0.5 | 0.5 | GO:0071836 | nectar secretion(GO:0071836) |
| 0.5 | 3.3 | GO:0009772 | photosynthetic electron transport in photosystem II(GO:0009772) |
| 0.5 | 2.4 | GO:0090030 | regulation of brassinosteroid biosynthetic process(GO:0010422) regulation of steroid metabolic process(GO:0019218) regulation of steroid biosynthetic process(GO:0050810) regulation of steroid hormone biosynthetic process(GO:0090030) |
| 0.5 | 2.3 | GO:0005980 | glycogen catabolic process(GO:0005980) |
| 0.5 | 2.7 | GO:0010258 | NADH dehydrogenase complex (plastoquinone) assembly(GO:0010258) |
| 0.4 | 5.8 | GO:2000122 | negative regulation of stomatal complex development(GO:2000122) |
| 0.4 | 4.9 | GO:0010206 | photosystem II repair(GO:0010206) |
| 0.4 | 3.5 | GO:0000132 | establishment of mitotic spindle orientation(GO:0000132) establishment of mitotic spindle localization(GO:0040001) establishment of spindle localization(GO:0051293) establishment of spindle orientation(GO:0051294) spindle localization(GO:0051653) |
| 0.4 | 2.2 | GO:0019401 | alditol biosynthetic process(GO:0019401) |
| 0.4 | 2.5 | GO:0010731 | protein glutathionylation(GO:0010731) |
| 0.4 | 2.5 | GO:0006775 | fat-soluble vitamin metabolic process(GO:0006775) vitamin E biosynthetic process(GO:0010189) vitamin E metabolic process(GO:0042360) fat-soluble vitamin biosynthetic process(GO:0042362) |
| 0.4 | 1.2 | GO:0046499 | S-adenosylmethioninamine biosynthetic process(GO:0006557) S-adenosylmethioninamine metabolic process(GO:0046499) |
| 0.4 | 2.9 | GO:0006021 | inositol biosynthetic process(GO:0006021) |
| 0.4 | 1.2 | GO:1900386 | positive regulation of flavonol biosynthetic process(GO:1900386) |
| 0.4 | 2.7 | GO:0009803 | cinnamic acid metabolic process(GO:0009803) |
| 0.4 | 1.2 | GO:0080051 | cutin transport(GO:0080051) |
| 0.4 | 6.9 | GO:0030388 | fructose 1,6-bisphosphate metabolic process(GO:0030388) |
| 0.4 | 2.3 | GO:0051098 | regulation of binding(GO:0051098) |
| 0.4 | 1.1 | GO:0019695 | choline metabolic process(GO:0019695) |
| 0.4 | 1.5 | GO:0009660 | amyloplast organization(GO:0009660) |
| 0.4 | 1.5 | GO:0042344 | indole glucosinolate catabolic process(GO:0042344) |
| 0.4 | 2.2 | GO:0019408 | dolichol biosynthetic process(GO:0019408) |
| 0.4 | 1.8 | GO:0051016 | barbed-end actin filament capping(GO:0051016) |
| 0.4 | 1.1 | GO:0033194 | response to hydroperoxide(GO:0033194) |
| 0.4 | 1.4 | GO:0098740 | pollen tube adhesion(GO:0009865) cell-cell adhesion(GO:0098609) multi organism cell adhesion(GO:0098740) |
| 0.3 | 3.1 | GO:0046294 | formaldehyde catabolic process(GO:0046294) |
| 0.3 | 1.0 | GO:0009915 | phloem sucrose loading(GO:0009915) |
| 0.3 | 1.7 | GO:0006297 | nucleotide-excision repair, DNA gap filling(GO:0006297) DNA integration(GO:0015074) |
| 0.3 | 2.0 | GO:0051754 | meiotic sister chromatid cohesion, centromeric(GO:0051754) |
| 0.3 | 4.1 | GO:0018026 | peptidyl-lysine monomethylation(GO:0018026) |
| 0.3 | 2.0 | GO:0010047 | fruit dehiscence(GO:0010047) |
| 0.3 | 1.3 | GO:0006023 | aminoglycan biosynthetic process(GO:0006023) glycosaminoglycan biosynthetic process(GO:0006024) UDP-glucuronate biosynthetic process(GO:0006065) glycosaminoglycan metabolic process(GO:0030203) |
| 0.3 | 0.3 | GO:0032025 | response to cobalt ion(GO:0032025) |
| 0.3 | 3.7 | GO:0042374 | phylloquinone biosynthetic process(GO:0042372) phylloquinone metabolic process(GO:0042374) |
| 0.3 | 3.4 | GO:0018904 | ether metabolic process(GO:0018904) |
| 0.3 | 0.9 | GO:0045835 | negative regulation of meiotic nuclear division(GO:0045835) negative regulation of meiotic cell cycle(GO:0051447) |
| 0.3 | 1.2 | GO:0015853 | adenine transport(GO:0015853) guanine transport(GO:0015854) |
| 0.3 | 0.9 | GO:0046102 | inosine catabolic process(GO:0006148) inosine metabolic process(GO:0046102) |
| 0.3 | 0.9 | GO:0010198 | synergid death(GO:0010198) |
| 0.3 | 6.1 | GO:0010207 | photosystem II assembly(GO:0010207) |
| 0.3 | 1.5 | GO:0018206 | peptidyl-methionine modification(GO:0018206) |
| 0.3 | 3.6 | GO:0006526 | arginine biosynthetic process(GO:0006526) |
| 0.3 | 7.4 | GO:0006636 | unsaturated fatty acid biosynthetic process(GO:0006636) |
| 0.3 | 3.9 | GO:0005987 | sucrose catabolic process(GO:0005987) |
| 0.3 | 6.5 | GO:0046688 | response to copper ion(GO:0046688) |
| 0.3 | 1.8 | GO:0006216 | cytidine catabolic process(GO:0006216) cytidine deamination(GO:0009972) cytidine metabolic process(GO:0046087) |
| 0.3 | 1.5 | GO:0007142 | male meiosis II(GO:0007142) |
| 0.3 | 1.7 | GO:0000289 | nuclear-transcribed mRNA poly(A) tail shortening(GO:0000289) |
| 0.3 | 1.4 | GO:0009807 | lignan metabolic process(GO:0009806) lignan biosynthetic process(GO:0009807) |
| 0.3 | 1.4 | GO:0010080 | regulation of floral meristem growth(GO:0010080) |
| 0.3 | 25.4 | GO:0045490 | pectin catabolic process(GO:0045490) |
| 0.3 | 17.6 | GO:0010411 | xyloglucan metabolic process(GO:0010411) |
| 0.3 | 3.4 | GO:0032544 | plastid translation(GO:0032544) |
| 0.3 | 2.8 | GO:0010371 | regulation of gibberellin biosynthetic process(GO:0010371) |
| 0.3 | 0.8 | GO:0051639 | actin filament network formation(GO:0051639) |
| 0.3 | 1.1 | GO:0055073 | cadmium ion homeostasis(GO:0055073) |
| 0.3 | 3.0 | GO:0010232 | vascular transport(GO:0010232) phloem transport(GO:0010233) |
| 0.3 | 3.3 | GO:0015977 | carbon fixation(GO:0015977) reductive pentose-phosphate cycle(GO:0019253) |
| 0.3 | 6.8 | GO:0009828 | plant-type cell wall loosening(GO:0009828) |
| 0.3 | 0.8 | GO:0009831 | plant-type cell wall modification involved in multidimensional cell growth(GO:0009831) |
| 0.3 | 1.1 | GO:0051211 | anisotropic cell growth(GO:0051211) |
| 0.3 | 0.5 | GO:0040019 | positive regulation of embryonic development(GO:0040019) |
| 0.3 | 2.5 | GO:0045962 | positive regulation of development, heterochronic(GO:0045962) |
| 0.2 | 1.0 | GO:0090603 | sieve element differentiation(GO:0090603) |
| 0.2 | 6.9 | GO:0006284 | base-excision repair(GO:0006284) |
| 0.2 | 2.9 | GO:0048354 | mucilage biosynthetic process involved in seed coat development(GO:0048354) |
| 0.2 | 0.7 | GO:0090392 | sepal giant cell differentiation(GO:0090392) |
| 0.2 | 0.7 | GO:0010184 | cytokinin transport(GO:0010184) |
| 0.2 | 0.7 | GO:0010113 | negative regulation of systemic acquired resistance(GO:0010113) |
| 0.2 | 27.0 | GO:0015979 | photosynthesis(GO:0015979) |
| 0.2 | 1.2 | GO:0019419 | sulfate reduction(GO:0019419) |
| 0.2 | 2.3 | GO:0009554 | megasporogenesis(GO:0009554) |
| 0.2 | 0.7 | GO:0009102 | biotin metabolic process(GO:0006768) biotin biosynthetic process(GO:0009102) |
| 0.2 | 2.9 | GO:0010161 | red light signaling pathway(GO:0010161) |
| 0.2 | 3.4 | GO:0030497 | fatty acid elongation(GO:0030497) |
| 0.2 | 0.7 | GO:0009143 | nucleoside triphosphate catabolic process(GO:0009143) |
| 0.2 | 0.7 | GO:0001738 | establishment of planar polarity(GO:0001736) morphogenesis of a polarized epithelium(GO:0001738) morphogenesis of an epithelium(GO:0002009) tissue morphogenesis(GO:0048729) |
| 0.2 | 0.9 | GO:0010500 | transmitting tissue development(GO:0010500) |
| 0.2 | 0.9 | GO:0071323 | cellular response to chitin(GO:0071323) |
| 0.2 | 0.4 | GO:0070829 | heterochromatin maintenance(GO:0070829) |
| 0.2 | 1.5 | GO:0015909 | long-chain fatty acid transport(GO:0015909) |
| 0.2 | 1.7 | GO:0031222 | arabinan catabolic process(GO:0031222) |
| 0.2 | 4.4 | GO:0005983 | starch catabolic process(GO:0005983) |
| 0.2 | 3.1 | GO:0055069 | zinc ion homeostasis(GO:0055069) |
| 0.2 | 3.3 | GO:0051346 | negative regulation of hydrolase activity(GO:0051346) |
| 0.2 | 0.6 | GO:0042817 | pyridoxal metabolic process(GO:0042817) |
| 0.2 | 1.0 | GO:0031022 | nuclear migration along microfilament(GO:0031022) |
| 0.2 | 0.8 | GO:0090207 | regulation of triglyceride metabolic process(GO:0090207) |
| 0.2 | 0.8 | GO:0046741 | transport of virus in host, tissue to tissue(GO:0046741) |
| 0.2 | 1.0 | GO:0048871 | multicellular organismal homeostasis(GO:0048871) |
| 0.2 | 2.4 | GO:0010044 | response to aluminum ion(GO:0010044) |
| 0.2 | 11.9 | GO:0015995 | chlorophyll biosynthetic process(GO:0015995) |
| 0.2 | 2.7 | GO:0048759 | xylem vessel member cell differentiation(GO:0048759) |
| 0.2 | 1.0 | GO:0045730 | respiratory burst involved in defense response(GO:0002679) respiratory burst(GO:0045730) |
| 0.2 | 2.5 | GO:2000071 | regulation of defense response by callose deposition(GO:2000071) |
| 0.2 | 1.9 | GO:0030104 | water homeostasis(GO:0030104) |
| 0.2 | 0.6 | GO:0010070 | zygote asymmetric cell division(GO:0010070) |
| 0.2 | 2.7 | GO:0010274 | hydrotropism(GO:0010274) |
| 0.2 | 1.9 | GO:0045144 | meiotic sister chromatid segregation(GO:0045144) meiotic sister chromatid cohesion(GO:0051177) |
| 0.2 | 0.9 | GO:0070525 | tRNA threonylcarbamoyladenosine metabolic process(GO:0070525) |
| 0.2 | 0.6 | GO:0001173 | DNA-templated transcriptional start site selection(GO:0001173) |
| 0.2 | 1.1 | GO:0090116 | C-5 methylation of cytosine(GO:0090116) |
| 0.2 | 0.9 | GO:0001682 | tRNA 5'-leader removal(GO:0001682) |
| 0.2 | 0.9 | GO:0006556 | S-adenosylmethionine biosynthetic process(GO:0006556) |
| 0.2 | 1.8 | GO:0042727 | flavin-containing compound biosynthetic process(GO:0042727) |
| 0.2 | 2.3 | GO:0009051 | pentose-phosphate shunt, oxidative branch(GO:0009051) |
| 0.2 | 1.6 | GO:0080144 | amino acid homeostasis(GO:0080144) |
| 0.2 | 1.4 | GO:0016045 | detection of bacterium(GO:0016045) |
| 0.2 | 2.8 | GO:0000373 | Group II intron splicing(GO:0000373) |
| 0.2 | 2.6 | GO:0006547 | histidine biosynthetic process(GO:0000105) histidine metabolic process(GO:0006547) imidazole-containing compound metabolic process(GO:0052803) |
| 0.2 | 3.1 | GO:2000012 | regulation of auxin polar transport(GO:2000012) |
| 0.2 | 3.9 | GO:0043572 | chloroplast fission(GO:0010020) plastid fission(GO:0043572) |
| 0.2 | 0.8 | GO:0034051 | negative regulation of plant-type hypersensitive response(GO:0034051) |
| 0.2 | 2.2 | GO:0006353 | DNA-templated transcription, termination(GO:0006353) |
| 0.2 | 2.8 | GO:0048829 | root cap development(GO:0048829) |
| 0.2 | 0.5 | GO:1903961 | positive regulation of transporter activity(GO:0032411) positive regulation of ion transmembrane transporter activity(GO:0032414) positive regulation of ion transmembrane transport(GO:0034767) positive regulation of anion channel activity(GO:1901529) positive regulation of anion transport(GO:1903793) positive regulation of anion transmembrane transport(GO:1903961) |
| 0.2 | 2.1 | GO:1901259 | chloroplast rRNA processing(GO:1901259) |
| 0.2 | 1.0 | GO:0048629 | trichome patterning(GO:0048629) |
| 0.2 | 0.5 | GO:1901537 | positive regulation of DNA demethylation(GO:1901537) |
| 0.2 | 2.7 | GO:0009638 | phototropism(GO:0009638) |
| 0.2 | 1.1 | GO:1902969 | mitotic DNA replication(GO:1902969) |
| 0.2 | 1.1 | GO:0043489 | RNA stabilization(GO:0043489) |
| 0.2 | 2.0 | GO:0010600 | regulation of auxin biosynthetic process(GO:0010600) |
| 0.2 | 1.5 | GO:0032876 | negative regulation of DNA endoreduplication(GO:0032876) |
| 0.1 | 0.7 | GO:0015940 | pantothenate metabolic process(GO:0015939) pantothenate biosynthetic process(GO:0015940) |
| 0.1 | 0.7 | GO:0007349 | cellularization(GO:0007349) |
| 0.1 | 3.5 | GO:0009944 | polarity specification of adaxial/abaxial axis(GO:0009944) specification of axis polarity(GO:0065001) |
| 0.1 | 0.6 | GO:0097054 | L-glutamate biosynthetic process(GO:0097054) |
| 0.1 | 1.6 | GO:0048496 | maintenance of organ identity(GO:0048496) maintenance of floral organ identity(GO:0048497) |
| 0.1 | 0.3 | GO:0051457 | maintenance of protein location in nucleus(GO:0051457) |
| 0.1 | 0.7 | GO:0009097 | isoleucine metabolic process(GO:0006549) isoleucine biosynthetic process(GO:0009097) |
| 0.1 | 0.1 | GO:0010376 | stomatal complex formation(GO:0010376) |
| 0.1 | 2.1 | GO:0009098 | leucine biosynthetic process(GO:0009098) |
| 0.1 | 0.8 | GO:0000395 | mRNA 5'-splice site recognition(GO:0000395) |
| 0.1 | 0.4 | GO:0046521 | sphingoid catabolic process(GO:0046521) |
| 0.1 | 4.5 | GO:0005992 | trehalose biosynthetic process(GO:0005992) |
| 0.1 | 2.5 | GO:0009292 | genetic transfer(GO:0009292) DNA mediated transformation(GO:0009294) |
| 0.1 | 0.4 | GO:2000736 | regulation of stem cell population maintenance(GO:2000036) regulation of stem cell differentiation(GO:2000736) |
| 0.1 | 1.5 | GO:0050898 | nitrile metabolic process(GO:0050898) nitrile biosynthetic process(GO:0080028) |
| 0.1 | 6.6 | GO:0048825 | cotyledon development(GO:0048825) |
| 0.1 | 0.3 | GO:0007097 | nuclear migration(GO:0007097) establishment of nucleus localization(GO:0040023) nucleus localization(GO:0051647) |
| 0.1 | 1.0 | GO:0006183 | GTP biosynthetic process(GO:0006183) |
| 0.1 | 3.5 | GO:0010027 | thylakoid membrane organization(GO:0010027) |
| 0.1 | 0.4 | GO:0010454 | negative regulation of cell fate specification(GO:0009996) negative regulation of trichoblast fate specification(GO:0010062) negative regulation of cell fate commitment(GO:0010454) negative regulation of plant epidermal cell differentiation(GO:1903889) |
| 0.1 | 1.1 | GO:0009827 | plant-type cell wall modification(GO:0009827) |
| 0.1 | 2.7 | GO:0045037 | protein import into chloroplast stroma(GO:0045037) |
| 0.1 | 7.0 | GO:0009734 | auxin-activated signaling pathway(GO:0009734) |
| 0.1 | 3.3 | GO:0016145 | S-glycoside catabolic process(GO:0016145) glycosinolate catabolic process(GO:0019759) glucosinolate catabolic process(GO:0019762) |
| 0.1 | 0.7 | GO:0090057 | root radial pattern formation(GO:0090057) |
| 0.1 | 0.6 | GO:1902584 | positive regulation of response to water deprivation(GO:1902584) |
| 0.1 | 1.1 | GO:0043171 | peptide catabolic process(GO:0043171) |
| 0.1 | 2.9 | GO:0045492 | xylan biosynthetic process(GO:0045492) |
| 0.1 | 0.6 | GO:2000114 | regulation of establishment of cell polarity(GO:2000114) |
| 0.1 | 0.2 | GO:0060776 | simple leaf morphogenesis(GO:0060776) |
| 0.1 | 0.1 | GO:0061013 | regulation of mRNA catabolic process(GO:0061013) positive regulation of mRNA catabolic process(GO:0061014) |
| 0.1 | 0.4 | GO:0048439 | flower morphogenesis(GO:0048439) |
| 0.1 | 0.5 | GO:0071732 | cellular response to nitric oxide(GO:0071732) |
| 0.1 | 2.0 | GO:0000162 | tryptophan biosynthetic process(GO:0000162) indolalkylamine biosynthetic process(GO:0046219) |
| 0.1 | 0.4 | GO:0090506 | axillary shoot meristem initiation(GO:0090506) |
| 0.1 | 0.5 | GO:0071786 | endoplasmic reticulum tubular network organization(GO:0071786) |
| 0.1 | 0.7 | GO:0010158 | abaxial cell fate specification(GO:0010158) |
| 0.1 | 1.1 | GO:0045723 | positive regulation of fatty acid biosynthetic process(GO:0045723) |
| 0.1 | 1.0 | GO:0048859 | formation of organ boundary(GO:0010160) organ boundary specification between lateral organs and the meristem(GO:0010199) formation of anatomical boundary(GO:0048859) |
| 0.1 | 0.8 | GO:0010439 | regulation of glucosinolate biosynthetic process(GO:0010439) |
| 0.1 | 1.7 | GO:0050779 | RNA destabilization(GO:0050779) mRNA destabilization(GO:0061157) |
| 0.1 | 1.2 | GO:0048575 | short-day photoperiodism(GO:0048572) short-day photoperiodism, flowering(GO:0048575) |
| 0.1 | 2.1 | GO:0010582 | floral meristem determinacy(GO:0010582) |
| 0.1 | 1.9 | GO:0019852 | L-ascorbic acid metabolic process(GO:0019852) L-ascorbic acid biosynthetic process(GO:0019853) |
| 0.1 | 1.4 | GO:0009913 | epidermis development(GO:0008544) epidermal cell differentiation(GO:0009913) epithelial cell differentiation(GO:0030855) epithelium development(GO:0060429) |
| 0.1 | 1.5 | GO:0006521 | regulation of cellular amino acid metabolic process(GO:0006521) regulation of cellular amine metabolic process(GO:0033238) |
| 0.1 | 0.8 | GO:0010106 | cellular response to iron ion starvation(GO:0010106) |
| 0.1 | 2.3 | GO:0006817 | phosphate ion transport(GO:0006817) |
| 0.1 | 2.5 | GO:0010268 | brassinosteroid homeostasis(GO:0010268) |
| 0.1 | 0.8 | GO:0009089 | lysine biosynthetic process(GO:0009085) lysine biosynthetic process via diaminopimelate(GO:0009089) diaminopimelate metabolic process(GO:0046451) |
| 0.1 | 5.0 | GO:0007267 | cell-cell signaling(GO:0007267) |
| 0.1 | 0.9 | GO:1904668 | positive regulation of ubiquitin protein ligase activity(GO:1904668) |
| 0.1 | 0.8 | GO:0010115 | regulation of abscisic acid biosynthetic process(GO:0010115) |
| 0.1 | 0.3 | GO:0007266 | Rho protein signal transduction(GO:0007266) |
| 0.1 | 0.4 | GO:2000104 | negative regulation of DNA-dependent DNA replication(GO:2000104) |
| 0.1 | 0.3 | GO:0042724 | thiamine biosynthetic process(GO:0009228) thiamine-containing compound biosynthetic process(GO:0042724) |
| 0.1 | 0.7 | GO:1902170 | cellular response to nitrate(GO:0071249) cellular response to reactive nitrogen species(GO:1902170) |
| 0.1 | 0.2 | GO:1902458 | positive regulation of stomatal opening(GO:1902458) |
| 0.1 | 1.1 | GO:0010305 | leaf vascular tissue pattern formation(GO:0010305) |
| 0.1 | 0.4 | GO:0080009 | mRNA methylation(GO:0080009) |
| 0.1 | 0.2 | GO:0015969 | guanosine tetraphosphate metabolic process(GO:0015969) purine ribonucleoside bisphosphate metabolic process(GO:0034035) |
| 0.1 | 1.1 | GO:0035999 | tetrahydrofolate interconversion(GO:0035999) |
| 0.1 | 1.1 | GO:0031425 | chloroplast RNA processing(GO:0031425) |
| 0.1 | 2.1 | GO:0051667 | chloroplast relocation(GO:0009902) establishment of plastid localization(GO:0051667) |
| 0.1 | 0.5 | GO:0000379 | tRNA-type intron splice site recognition and cleavage(GO:0000379) |
| 0.1 | 3.5 | GO:0071489 | red or far-red light signaling pathway(GO:0010017) cellular response to red or far red light(GO:0071489) |
| 0.1 | 0.9 | GO:0071329 | cellular response to sucrose stimulus(GO:0071329) |
| 0.1 | 0.3 | GO:0009819 | drought recovery(GO:0009819) |
| 0.1 | 0.8 | GO:0016554 | base conversion or substitution editing(GO:0016553) cytidine to uridine editing(GO:0016554) |
| 0.1 | 0.5 | GO:0010358 | leaf shaping(GO:0010358) |
| 0.1 | 0.9 | GO:0006535 | cysteine biosynthetic process from serine(GO:0006535) |
| 0.1 | 0.5 | GO:0042128 | nitrate metabolic process(GO:0042126) nitrate assimilation(GO:0042128) |
| 0.1 | 0.4 | GO:0080175 | phragmoplast microtubule organization(GO:0080175) |
| 0.1 | 0.3 | GO:0048830 | adventitious root development(GO:0048830) |
| 0.1 | 0.5 | GO:0031577 | mitotic spindle assembly checkpoint(GO:0007094) spindle checkpoint(GO:0031577) negative regulation of proteasomal ubiquitin-dependent protein catabolic process(GO:0032435) negative regulation of sister chromatid segregation(GO:0033046) negative regulation of mitotic sister chromatid segregation(GO:0033048) negative regulation of mitotic metaphase/anaphase transition(GO:0045841) negative regulation of chromosome segregation(GO:0051985) spindle assembly checkpoint(GO:0071173) mitotic spindle checkpoint(GO:0071174) negative regulation of proteasomal protein catabolic process(GO:1901799) negative regulation of metaphase/anaphase transition of cell cycle(GO:1902100) negative regulation of proteolysis involved in cellular protein catabolic process(GO:1903051) negative regulation of cellular protein catabolic process(GO:1903363) negative regulation of mitotic sister chromatid separation(GO:2000816) |
| 0.1 | 1.4 | GO:0080188 | RNA-directed DNA methylation(GO:0080188) |
| 0.1 | 0.8 | GO:0007050 | cell cycle arrest(GO:0007050) |
| 0.1 | 3.5 | GO:0010393 | galacturonan metabolic process(GO:0010393) pectin metabolic process(GO:0045488) |
| 0.1 | 4.8 | GO:0006885 | regulation of pH(GO:0006885) |
| 0.1 | 0.1 | GO:0080003 | thalianol metabolic process(GO:0080003) |
| 0.1 | 1.5 | GO:2000034 | regulation of seed maturation(GO:2000034) |
| 0.1 | 0.5 | GO:1905177 | tracheary element differentiation(GO:1905177) |
| 0.1 | 0.6 | GO:0032922 | circadian regulation of gene expression(GO:0032922) |
| 0.1 | 0.2 | GO:0006015 | 5-phosphoribose 1-diphosphate biosynthetic process(GO:0006015) 5-phosphoribose 1-diphosphate metabolic process(GO:0046391) |
| 0.1 | 0.4 | GO:0006545 | glycine biosynthetic process(GO:0006545) |
| 0.1 | 0.2 | GO:0018279 | peptidyl-asparagine modification(GO:0018196) protein N-linked glycosylation via asparagine(GO:0018279) |
| 0.1 | 1.4 | GO:0009269 | response to desiccation(GO:0009269) |
| 0.1 | 0.4 | GO:0006011 | UDP-glucose metabolic process(GO:0006011) |
| 0.1 | 0.4 | GO:0030308 | negative regulation of cell growth(GO:0030308) |
| 0.1 | 0.6 | GO:0006308 | DNA catabolic process(GO:0006308) |
| 0.1 | 1.1 | GO:0010152 | pollen maturation(GO:0010152) |
| 0.1 | 0.9 | GO:0000712 | resolution of meiotic recombination intermediates(GO:0000712) |
| 0.1 | 0.9 | GO:0070475 | rRNA base methylation(GO:0070475) |
| 0.1 | 0.7 | GO:0051446 | positive regulation of meiotic cell cycle(GO:0051446) |
| 0.1 | 0.7 | GO:0005986 | sucrose biosynthetic process(GO:0005986) |
| 0.1 | 0.6 | GO:0006491 | N-glycan processing(GO:0006491) |
| 0.1 | 0.6 | GO:0006120 | mitochondrial electron transport, NADH to ubiquinone(GO:0006120) |
| 0.1 | 0.2 | GO:0015904 | tetracycline transport(GO:0015904) antibiotic transport(GO:0042891) toxin transport(GO:1901998) |
| 0.1 | 3.5 | GO:0009630 | gravitropism(GO:0009630) |
| 0.1 | 1.9 | GO:0000413 | protein peptidyl-prolyl isomerization(GO:0000413) |
| 0.1 | 0.5 | GO:0043486 | histone exchange(GO:0043486) |
| 0.1 | 0.7 | GO:0015743 | malate transport(GO:0015743) |
| 0.1 | 1.5 | GO:0010311 | lateral root formation(GO:0010311) |
| 0.1 | 0.4 | GO:0046900 | tetrahydrofolylpolyglutamate metabolic process(GO:0046900) |
| 0.1 | 2.9 | GO:0009566 | fertilization(GO:0009566) double fertilization forming a zygote and endosperm(GO:0009567) |
| 0.1 | 0.3 | GO:0042218 | 1-aminocyclopropane-1-carboxylate metabolic process(GO:0018871) 1-aminocyclopropane-1-carboxylate biosynthetic process(GO:0042218) |
| 0.1 | 0.4 | GO:0048441 | petal development(GO:0048441) corolla development(GO:0048465) |
| 0.1 | 3.4 | GO:0007018 | microtubule-based movement(GO:0007018) |
| 0.1 | 0.5 | GO:0070592 | cell wall polysaccharide biosynthetic process(GO:0070592) |
| 0.1 | 1.4 | GO:0009825 | multidimensional cell growth(GO:0009825) |
| 0.1 | 0.7 | GO:0051762 | sesquiterpene biosynthetic process(GO:0051762) |
| 0.0 | 0.6 | GO:0005978 | glycogen biosynthetic process(GO:0005978) |
| 0.0 | 1.2 | GO:0051225 | spindle assembly(GO:0051225) |
| 0.0 | 1.5 | GO:0009142 | nucleoside triphosphate biosynthetic process(GO:0009142) |
| 0.0 | 0.1 | GO:0046156 | siroheme biosynthetic process(GO:0019354) siroheme metabolic process(GO:0046156) |
| 0.0 | 0.3 | GO:0034315 | regulation of Arp2/3 complex-mediated actin nucleation(GO:0034315) regulation of actin nucleation(GO:0051125) positive regulation of actin nucleation(GO:0051127) positive regulation of Arp2/3 complex-mediated actin nucleation(GO:2000601) |
| 0.0 | 0.8 | GO:0032880 | regulation of protein localization(GO:0032880) |
| 0.0 | 0.3 | GO:0010424 | DNA methylation on cytosine within a CG sequence(GO:0010424) |
| 0.0 | 1.2 | GO:0009664 | plant-type cell wall organization(GO:0009664) |
| 0.0 | 1.3 | GO:0000027 | ribosomal large subunit assembly(GO:0000027) |
| 0.0 | 0.8 | GO:0006282 | regulation of DNA repair(GO:0006282) |
| 0.0 | 0.8 | GO:0016556 | mRNA modification(GO:0016556) |
| 0.0 | 1.0 | GO:0010584 | pollen exine formation(GO:0010584) |
| 0.0 | 1.1 | GO:0010166 | wax metabolic process(GO:0010166) |
| 0.0 | 0.2 | GO:2000574 | regulation of microtubule motor activity(GO:2000574) positive regulation of microtubule motor activity(GO:2000576) regulation of ATP-dependent microtubule motor activity, plus-end-directed(GO:2000580) positive regulation of ATP-dependent microtubule motor activity, plus-end-directed(GO:2000582) |
| 0.0 | 0.4 | GO:0034314 | Arp2/3 complex-mediated actin nucleation(GO:0034314) |
| 0.0 | 1.4 | GO:0009834 | plant-type secondary cell wall biogenesis(GO:0009834) |
| 0.0 | 0.3 | GO:0097437 | maintenance of seed dormancy(GO:0010231) maintenance of dormancy(GO:0097437) |
| 0.0 | 0.7 | GO:0071482 | cellular response to light stimulus(GO:0071482) |
| 0.0 | 2.5 | GO:0009875 | pollen-pistil interaction(GO:0009875) |
| 0.0 | 0.5 | GO:0015833 | oligopeptide transport(GO:0006857) peptide transport(GO:0015833) |
| 0.0 | 0.2 | GO:0007021 | tubulin complex assembly(GO:0007021) |
| 0.0 | 0.4 | GO:0044070 | regulation of anion transport(GO:0044070) |
| 0.0 | 0.1 | GO:0071585 | detoxification of cadmium ion(GO:0071585) |
| 0.0 | 0.8 | GO:0009691 | cytokinin biosynthetic process(GO:0009691) |
| 0.0 | 0.2 | GO:0070979 | protein K11-linked ubiquitination(GO:0070979) |
| 0.0 | 0.5 | GO:0009299 | mRNA transcription(GO:0009299) |
| 0.0 | 0.5 | GO:0045927 | positive regulation of growth(GO:0045927) |
| 0.0 | 0.6 | GO:0006879 | cellular iron ion homeostasis(GO:0006879) |
| 0.0 | 0.7 | GO:0046834 | lipid phosphorylation(GO:0046834) phosphatidylinositol phosphorylation(GO:0046854) |
| 0.0 | 0.3 | GO:0017182 | peptidyl-diphthamide metabolic process(GO:0017182) peptidyl-diphthamide biosynthetic process from peptidyl-histidine(GO:0017183) peptidyl-histidine modification(GO:0018202) |
| 0.0 | 0.3 | GO:0006086 | acetyl-CoA biosynthetic process from pyruvate(GO:0006086) |
| 0.0 | 0.1 | GO:0042149 | cellular response to glucose starvation(GO:0042149) |
| 0.0 | 0.8 | GO:0006505 | GPI anchor metabolic process(GO:0006505) GPI anchor biosynthetic process(GO:0006506) |
| 0.0 | 1.0 | GO:0010043 | response to zinc ion(GO:0010043) |
| 0.0 | 0.2 | GO:0034204 | lipid translocation(GO:0034204) |
| 0.0 | 1.1 | GO:0009853 | photorespiration(GO:0009853) |
| 0.0 | 0.1 | GO:0000719 | photoreactive repair(GO:0000719) |
| 0.0 | 0.3 | GO:0009306 | protein secretion(GO:0009306) |
| 0.0 | 0.1 | GO:0006527 | arginine catabolic process(GO:0006527) |
| 0.0 | 0.1 | GO:0045046 | protein import into peroxisome membrane(GO:0045046) |
| 0.0 | 0.6 | GO:0009644 | response to high light intensity(GO:0009644) |
| 0.0 | 0.2 | GO:0009423 | chorismate biosynthetic process(GO:0009423) |
| 0.0 | 0.1 | GO:0019509 | L-methionine biosynthetic process from methylthioadenosine(GO:0019509) amino acid salvage(GO:0043102) L-methionine salvage(GO:0071267) |
| 0.0 | 0.1 | GO:0000080 | mitotic G1 phase(GO:0000080) mitotic S phase(GO:0000084) mitotic G2 phase(GO:0000085) G1 phase(GO:0051318) G2 phase(GO:0051319) S phase(GO:0051320) interphase(GO:0051325) mitotic interphase(GO:0051329) |
| 0.0 | 0.1 | GO:0072337 | modified amino acid transport(GO:0072337) |
| 0.0 | 0.1 | GO:0009786 | regulation of asymmetric cell division(GO:0009786) |
| 0.0 | 1.3 | GO:0071367 | cellular response to brassinosteroid stimulus(GO:0071367) |
| 0.0 | 0.1 | GO:0072530 | purine-containing compound transmembrane transport(GO:0072530) |
| 0.0 | 0.1 | GO:0006566 | threonine metabolic process(GO:0006566) threonine biosynthetic process(GO:0009088) |
| 0.0 | 0.3 | GO:0018231 | peptidyl-L-cysteine S-palmitoylation(GO:0018230) peptidyl-S-diacylglycerol-L-cysteine biosynthetic process from peptidyl-cysteine(GO:0018231) |
| 0.0 | 0.0 | GO:0042219 | cellular modified amino acid catabolic process(GO:0042219) |
| 0.0 | 0.1 | GO:0080190 | secondary growth(GO:0080117) lateral growth(GO:0080190) |
| 0.0 | 0.1 | GO:0000973 | posttranscriptional tethering of RNA polymerase II gene DNA at nuclear periphery(GO:0000973) |
| 0.0 | 0.7 | GO:0030422 | production of siRNA involved in RNA interference(GO:0030422) |
| 0.0 | 0.4 | GO:0009682 | induced systemic resistance(GO:0009682) |
| 0.0 | 0.2 | GO:0032366 | intracellular sterol transport(GO:0032366) |
| 0.0 | 0.1 | GO:0071466 | xenobiotic metabolic process(GO:0006805) xenobiotic catabolic process(GO:0042178) cellular response to xenobiotic stimulus(GO:0071466) |
| 0.0 | 0.1 | GO:0006654 | phosphatidic acid biosynthetic process(GO:0006654) |
| 0.0 | 0.3 | GO:0009686 | gibberellin metabolic process(GO:0009685) gibberellin biosynthetic process(GO:0009686) |
| 0.0 | 0.2 | GO:0006730 | one-carbon metabolic process(GO:0006730) |
| 0.0 | 0.0 | GO:0042908 | xenobiotic transport(GO:0042908) |
| 0.0 | 0.2 | GO:0010383 | cell wall polysaccharide metabolic process(GO:0010383) |
| 0.0 | 0.1 | GO:0080086 | stamen filament development(GO:0080086) |
| 0.0 | 0.1 | GO:0009061 | anaerobic respiration(GO:0009061) |
| 0.0 | 0.1 | GO:0009920 | cell plate formation involved in plant-type cell wall biogenesis(GO:0009920) |
Gene overrepresentation in cellular component category:
| Log-likelihood per target | Total log-likelihood | Term | Description |
|---|---|---|---|
| 1.7 | 15.1 | GO:0009503 | thylakoid light-harvesting complex(GO:0009503) PSII associated light-harvesting complex II(GO:0009517) light-harvesting complex(GO:0030076) |
| 1.4 | 1.4 | GO:0016328 | lateral plasma membrane(GO:0016328) |
| 1.2 | 9.9 | GO:0009538 | photosystem I reaction center(GO:0009538) |
| 1.0 | 1.0 | GO:0031351 | intrinsic component of plastid membrane(GO:0031350) integral component of plastid membrane(GO:0031351) |
| 0.9 | 3.5 | GO:0031515 | tRNA (m1A) methyltransferase complex(GO:0031515) |
| 0.9 | 6.1 | GO:0009533 | chloroplast stromal thylakoid(GO:0009533) |
| 0.7 | 3.6 | GO:0009569 | chloroplast starch grain(GO:0009569) starch grain(GO:0043036) |
| 0.7 | 2.1 | GO:0043674 | pollen wall(GO:0043667) exine(GO:0043668) sexine(GO:0043673) columella(GO:0043674) |
| 0.6 | 27.3 | GO:0009543 | chloroplast thylakoid lumen(GO:0009543) plastid thylakoid lumen(GO:0031978) |
| 0.6 | 11.2 | GO:0031977 | thylakoid lumen(GO:0031977) |
| 0.6 | 2.9 | GO:0009897 | external side of plasma membrane(GO:0009897) |
| 0.5 | 19.9 | GO:0010319 | stromule(GO:0010319) |
| 0.5 | 2.4 | GO:0009522 | photosystem I(GO:0009522) |
| 0.4 | 1.7 | GO:0032807 | DNA ligase IV complex(GO:0032807) |
| 0.4 | 1.5 | GO:0010330 | cellulose synthase complex(GO:0010330) |
| 0.4 | 2.9 | GO:0009654 | photosystem II oxygen evolving complex(GO:0009654) |
| 0.4 | 1.1 | GO:0030015 | CCR4-NOT core complex(GO:0030015) |
| 0.3 | 1.0 | GO:0009925 | basal plasma membrane(GO:0009925) basolateral plasma membrane(GO:0016323) basal part of cell(GO:0045178) |
| 0.3 | 14.7 | GO:0010287 | plastoglobule(GO:0010287) |
| 0.3 | 5.1 | GO:0010598 | NAD(P)H dehydrogenase complex (plastoquinone)(GO:0010598) |
| 0.3 | 3.2 | GO:0000427 | plastid-encoded plastid RNA polymerase complex(GO:0000427) |
| 0.3 | 0.9 | GO:1990298 | bub1-bub3 complex(GO:1990298) |
| 0.3 | 0.8 | GO:0032432 | actin filament bundle(GO:0032432) |
| 0.3 | 1.9 | GO:0000311 | plastid large ribosomal subunit(GO:0000311) |
| 0.2 | 4.8 | GO:0031355 | intrinsic component of plastid outer membrane(GO:0031354) integral component of plastid outer membrane(GO:0031355) intrinsic component of chloroplast outer membrane(GO:0031358) integral component of chloroplast outer membrane(GO:0031359) |
| 0.2 | 0.2 | GO:0031897 | Tic complex(GO:0031897) |
| 0.2 | 0.9 | GO:0009330 | DNA topoisomerase complex (ATP-hydrolyzing)(GO:0009330) |
| 0.2 | 57.2 | GO:0009534 | chloroplast thylakoid(GO:0009534) |
| 0.2 | 1.0 | GO:0001673 | male germ cell nucleus(GO:0001673) |
| 0.2 | 48.5 | GO:0048046 | apoplast(GO:0048046) |
| 0.2 | 1.8 | GO:0010168 | ER body(GO:0010168) |
| 0.2 | 0.9 | GO:0000812 | Swr1 complex(GO:0000812) |
| 0.2 | 32.5 | GO:0009505 | plant-type cell wall(GO:0009505) |
| 0.2 | 2.0 | GO:0009986 | cell surface(GO:0009986) |
| 0.2 | 4.0 | GO:0016324 | apical plasma membrane(GO:0016324) |
| 0.2 | 2.2 | GO:0005880 | nuclear microtubule(GO:0005880) |
| 0.2 | 1.1 | GO:0034991 | nuclear cohesin complex(GO:0000798) mitotic cohesin complex(GO:0030892) meiotic cohesin complex(GO:0030893) nuclear mitotic cohesin complex(GO:0034990) nuclear meiotic cohesin complex(GO:0034991) |
| 0.1 | 0.4 | GO:0043240 | Fanconi anaemia nuclear complex(GO:0043240) |
| 0.1 | 1.0 | GO:0000778 | condensed nuclear chromosome kinetochore(GO:0000778) |
| 0.1 | 0.8 | GO:0009346 | citrate lyase complex(GO:0009346) |
| 0.1 | 1.3 | GO:0009508 | plastid chromosome(GO:0009508) |
| 0.1 | 0.6 | GO:0033063 | Rad51B-Rad51C-Rad51D-XRCC2 complex(GO:0033063) |
| 0.1 | 3.5 | GO:0055028 | cortical microtubule(GO:0055028) |
| 0.1 | 1.5 | GO:0045298 | tubulin complex(GO:0045298) |
| 0.1 | 0.8 | GO:0005854 | nascent polypeptide-associated complex(GO:0005854) |
| 0.1 | 2.0 | GO:0009579 | thylakoid(GO:0009579) |
| 0.1 | 42.0 | GO:0009532 | plastid stroma(GO:0009532) |
| 0.1 | 3.1 | GO:0009707 | chloroplast outer membrane(GO:0009707) |
| 0.1 | 11.9 | GO:0046658 | anchored component of plasma membrane(GO:0046658) |
| 0.1 | 0.5 | GO:0000214 | tRNA-intron endonuclease complex(GO:0000214) |
| 0.1 | 0.2 | GO:0005828 | kinetochore microtubule(GO:0005828) |
| 0.1 | 0.2 | GO:0002189 | ribose phosphate diphosphokinase complex(GO:0002189) |
| 0.1 | 0.6 | GO:0035618 | root hair(GO:0035618) |
| 0.1 | 2.0 | GO:0009528 | plastid inner membrane(GO:0009528) |
| 0.1 | 0.2 | GO:0032153 | cell division site(GO:0032153) |
| 0.1 | 0.3 | GO:0001401 | mitochondrial sorting and assembly machinery complex(GO:0001401) |
| 0.1 | 0.5 | GO:0000776 | kinetochore(GO:0000776) |
| 0.1 | 0.5 | GO:0042555 | MCM complex(GO:0042555) |
| 0.1 | 0.3 | GO:0000796 | condensin complex(GO:0000796) |
| 0.1 | 0.3 | GO:0031209 | SCAR complex(GO:0031209) |
| 0.0 | 0.6 | GO:0032300 | mismatch repair complex(GO:0032300) |
| 0.0 | 0.5 | GO:0071458 | integral component of cytoplasmic side of endoplasmic reticulum membrane(GO:0071458) cytoplasmic side of endoplasmic reticulum membrane(GO:0098554) |
| 0.0 | 13.1 | GO:0005802 | trans-Golgi network(GO:0005802) |
| 0.0 | 0.7 | GO:0016459 | myosin complex(GO:0016459) |
| 0.0 | 0.4 | GO:0012511 | monolayer-surrounded lipid storage body(GO:0012511) |
| 0.0 | 0.2 | GO:0000408 | EKC/KEOPS complex(GO:0000408) |
| 0.0 | 0.2 | GO:0030286 | dynein complex(GO:0030286) |
| 0.0 | 1.0 | GO:0005680 | anaphase-promoting complex(GO:0005680) |
| 0.0 | 0.7 | GO:0016602 | CCAAT-binding factor complex(GO:0016602) |
| 0.0 | 3.9 | GO:0022625 | cytosolic large ribosomal subunit(GO:0022625) |
| 0.0 | 0.4 | GO:0005749 | mitochondrial respiratory chain complex II, succinate dehydrogenase complex (ubiquinone)(GO:0005749) succinate dehydrogenase complex (ubiquinone)(GO:0045257) fumarate reductase complex(GO:0045283) |
| 0.0 | 0.5 | GO:0000137 | Golgi cis cisterna(GO:0000137) |
| 0.0 | 2.0 | GO:0005874 | microtubule(GO:0005874) |
| 0.0 | 0.3 | GO:0031464 | Cul4A-RING E3 ubiquitin ligase complex(GO:0031464) |
| 0.0 | 4.9 | GO:0009941 | chloroplast envelope(GO:0009941) |
| 0.0 | 0.4 | GO:0005885 | Arp2/3 protein complex(GO:0005885) |
| 0.0 | 0.2 | GO:0010369 | chromocenter(GO:0010369) |
| 0.0 | 0.2 | GO:0016272 | prefoldin complex(GO:0016272) |
| 0.0 | 0.1 | GO:0000172 | ribonuclease MRP complex(GO:0000172) |
| 0.0 | 50.8 | GO:0005576 | extracellular region(GO:0005576) |
| 0.0 | 0.5 | GO:0000159 | protein phosphatase type 2A complex(GO:0000159) |
| 0.0 | 0.1 | GO:0000808 | origin recognition complex(GO:0000808) nuclear origin of replication recognition complex(GO:0005664) |
| 0.0 | 0.1 | GO:0044614 | nuclear pore cytoplasmic filaments(GO:0044614) |
| 0.0 | 0.1 | GO:0000439 | core TFIIH complex(GO:0000439) |
Gene overrepresentation in molecular function category:
| Log-likelihood per target | Total log-likelihood | Term | Description |
|---|---|---|---|
| 2.6 | 7.8 | GO:0051738 | xanthophyll binding(GO:0051738) |
| 1.9 | 5.8 | GO:0015204 | urea transmembrane transporter activity(GO:0015204) |
| 1.2 | 7.4 | GO:0016984 | ribulose-bisphosphate carboxylase activity(GO:0016984) |
| 1.1 | 3.3 | GO:0047100 | glyceraldehyde-3-phosphate dehydrogenase (NADP+) (phosphorylating) activity(GO:0047100) |
| 1.0 | 3.1 | GO:0016630 | protochlorophyllide reductase activity(GO:0016630) |
| 1.0 | 3.0 | GO:0045485 | omega-6 fatty acid desaturase activity(GO:0045485) |
| 1.0 | 3.0 | GO:0004822 | isoleucine-tRNA ligase activity(GO:0004822) |
| 1.0 | 2.9 | GO:0046422 | violaxanthin de-epoxidase activity(GO:0046422) |
| 0.9 | 3.6 | GO:0015245 | fatty acid transporter activity(GO:0015245) |
| 0.9 | 3.5 | GO:0016429 | tRNA (adenine-N1-)-methyltransferase activity(GO:0016429) |
| 0.9 | 3.4 | GO:0050734 | hydroxycinnamoyltransferase activity(GO:0050734) |
| 0.8 | 4.8 | GO:0051723 | protein methylesterase activity(GO:0051723) |
| 0.8 | 3.2 | GO:0016712 | oxidoreductase activity, acting on paired donors, with incorporation or reduction of molecular oxygen, reduced flavin or flavoprotein as one donor, and incorporation of one atom of oxygen(GO:0016712) aromatase activity(GO:0070330) |
| 0.8 | 17.7 | GO:0016168 | chlorophyll binding(GO:0016168) |
| 0.8 | 3.8 | GO:0015434 | cadmium-transporting ATPase activity(GO:0015434) zinc-exporting ATPase activity(GO:0016463) |
| 0.7 | 2.2 | GO:0044540 | L-cystine L-cysteine-lyase (deaminating)(GO:0044540) |
| 0.7 | 2.9 | GO:0004512 | inositol-3-phosphate synthase activity(GO:0004512) |
| 0.7 | 15.7 | GO:0080161 | auxin transmembrane transporter activity(GO:0080161) |
| 0.7 | 2.1 | GO:0004528 | phosphodiesterase I activity(GO:0004528) double-stranded DNA 3'-5' exodeoxyribonuclease activity(GO:0008311) |
| 0.7 | 3.4 | GO:0004072 | aspartate kinase activity(GO:0004072) |
| 0.7 | 5.3 | GO:0033946 | xyloglucan-specific endo-beta-1,4-glucanase activity(GO:0033946) |
| 0.7 | 2.0 | GO:0004013 | adenosylhomocysteinase activity(GO:0004013) trialkylsulfonium hydrolase activity(GO:0016802) |
| 0.6 | 1.9 | GO:0004042 | acetyl-CoA:L-glutamate N-acetyltransferase activity(GO:0004042) |
| 0.6 | 3.2 | GO:0031956 | medium-chain fatty acid-CoA ligase activity(GO:0031956) |
| 0.6 | 3.6 | GO:0004838 | L-tyrosine:2-oxoglutarate aminotransferase activity(GO:0004838) L-tyrosine aminotransferase activity(GO:0070547) |
| 0.6 | 2.3 | GO:0008703 | 5-amino-6-(5-phosphoribosylamino)uracil reductase activity(GO:0008703) |
| 0.6 | 2.3 | GO:0045548 | phenylalanine ammonia-lyase activity(GO:0045548) |
| 0.5 | 2.2 | GO:0004817 | cysteine-tRNA ligase activity(GO:0004817) |
| 0.5 | 6.6 | GO:0103075 | indole-3-pyruvate monooxygenase activity(GO:0103075) |
| 0.5 | 4.5 | GO:0009922 | fatty acid elongase activity(GO:0009922) |
| 0.5 | 12.6 | GO:0016762 | xyloglucan:xyloglucosyl transferase activity(GO:0016762) |
| 0.5 | 1.5 | GO:0080045 | quercetin 3'-O-glucosyltransferase activity(GO:0080045) |
| 0.5 | 2.4 | GO:0004127 | cytidylate kinase activity(GO:0004127) |
| 0.5 | 5.4 | GO:0008725 | alkylbase DNA N-glycosylase activity(GO:0003905) DNA-3-methyladenine glycosylase activity(GO:0008725) DNA-3-methylbase glycosylase activity(GO:0043733) |
| 0.5 | 2.9 | GO:0017057 | 6-phosphogluconolactonase activity(GO:0017057) |
| 0.5 | 1.4 | GO:0010283 | pinoresinol reductase activity(GO:0010283) |
| 0.5 | 1.4 | GO:0016618 | hydroxypyruvate reductase activity(GO:0016618) |
| 0.5 | 1.4 | GO:0045174 | oxidoreductase activity, acting on a sulfur group of donors, quinone or similar compound as acceptor(GO:0016672) glutathione dehydrogenase (ascorbate) activity(GO:0045174) |
| 0.5 | 1.4 | GO:0004742 | dihydrolipoyllysine-residue acetyltransferase activity(GO:0004742) S-acetyltransferase activity(GO:0016418) |
| 0.5 | 1.8 | GO:0003959 | NADPH dehydrogenase activity(GO:0003959) |
| 0.4 | 3.9 | GO:0004096 | catalase activity(GO:0004096) |
| 0.4 | 12.6 | GO:0008266 | poly(U) RNA binding(GO:0008266) |
| 0.4 | 3.8 | GO:0009882 | blue light photoreceptor activity(GO:0009882) |
| 0.4 | 1.2 | GO:0004014 | adenosylmethionine decarboxylase activity(GO:0004014) |
| 0.4 | 5.7 | GO:0004332 | fructose-bisphosphate aldolase activity(GO:0004332) |
| 0.4 | 3.2 | GO:0046933 | proton-transporting ATP synthase activity, rotational mechanism(GO:0046933) |
| 0.4 | 0.4 | GO:0008835 | diaminohydroxyphosphoribosylaminopyrimidine deaminase activity(GO:0008835) |
| 0.4 | 3.1 | GO:0004024 | alcohol dehydrogenase activity, zinc-dependent(GO:0004024) |
| 0.4 | 1.6 | GO:0004556 | alpha-amylase activity(GO:0004556) |
| 0.4 | 1.5 | GO:0019172 | glyoxalase III activity(GO:0019172) |
| 0.4 | 1.1 | GO:0000234 | phosphoethanolamine N-methyltransferase activity(GO:0000234) |
| 0.4 | 2.2 | GO:0045547 | dehydrodolichyl diphosphate synthase activity(GO:0045547) |
| 0.4 | 1.1 | GO:0003861 | 3-isopropylmalate dehydratase activity(GO:0003861) |
| 0.4 | 0.7 | GO:0004359 | glutaminase activity(GO:0004359) |
| 0.4 | 1.1 | GO:0004563 | beta-N-acetylhexosaminidase activity(GO:0004563) |
| 0.4 | 0.7 | GO:0016841 | ammonia-lyase activity(GO:0016841) |
| 0.3 | 1.4 | GO:0003852 | 2-isopropylmalate synthase activity(GO:0003852) |
| 0.3 | 4.4 | GO:0042389 | omega-3 fatty acid desaturase activity(GO:0042389) |
| 0.3 | 1.2 | GO:0052740 | phosphatidylserine 1-acylhydrolase activity(GO:0052739) 1-acyl-2-lysophosphatidylserine acylhydrolase activity(GO:0052740) |
| 0.3 | 3.7 | GO:0033926 | glycopeptide alpha-N-acetylgalactosaminidase activity(GO:0033926) |
| 0.3 | 1.2 | GO:0042132 | fructose 1,6-bisphosphate 1-phosphatase activity(GO:0042132) |
| 0.3 | 1.8 | GO:0004126 | cytidine deaminase activity(GO:0004126) |
| 0.3 | 0.9 | GO:0016661 | oxidoreductase activity, acting on other nitrogenous compounds as donors(GO:0016661) |
| 0.3 | 5.7 | GO:0005199 | structural constituent of cell wall(GO:0005199) |
| 0.3 | 7.0 | GO:0030570 | carbon-oxygen lyase activity, acting on polysaccharides(GO:0016837) pectate lyase activity(GO:0030570) |
| 0.3 | 1.4 | GO:0010313 | phytochrome binding(GO:0010313) |
| 0.3 | 1.1 | GO:0015018 | galactosylgalactosylxylosylprotein 3-beta-glucuronosyltransferase activity(GO:0015018) |
| 0.3 | 0.8 | GO:0008839 | 4-hydroxy-tetrahydrodipicolinate reductase(GO:0008839) |
| 0.3 | 1.6 | GO:0045431 | flavonol synthase activity(GO:0045431) |
| 0.3 | 0.8 | GO:0036381 | pyridoxal 5'-phosphate synthase (glutamine hydrolysing) activity(GO:0036381) |
| 0.3 | 1.3 | GO:0003979 | UDP-glucose 6-dehydrogenase activity(GO:0003979) |
| 0.3 | 1.0 | GO:0016433 | rRNA (adenine) methyltransferase activity(GO:0016433) |
| 0.3 | 1.5 | GO:0050378 | UDP-glucuronate 4-epimerase activity(GO:0050378) |
| 0.3 | 0.8 | GO:0004347 | glucose-6-phosphate isomerase activity(GO:0004347) |
| 0.2 | 0.7 | GO:0003864 | 3-methyl-2-oxobutanoate hydroxymethyltransferase activity(GO:0003864) |
| 0.2 | 1.2 | GO:0004049 | anthranilate synthase activity(GO:0004049) |
| 0.2 | 3.4 | GO:0016308 | 1-phosphatidylinositol-4-phosphate 5-kinase activity(GO:0016308) |
| 0.2 | 1.2 | GO:0045544 | gibberellin 20-oxidase activity(GO:0045544) |
| 0.2 | 6.1 | GO:0004565 | beta-galactosidase activity(GO:0004565) |
| 0.2 | 0.7 | GO:0001216 | bacterial-type RNA polymerase transcription factor activity, sequence-specific DNA binding(GO:0001130) bacterial-type RNA polymerase transcriptional activator activity, sequence-specific DNA binding(GO:0001216) |
| 0.2 | 5.2 | GO:0052716 | hydroquinone:oxygen oxidoreductase activity(GO:0052716) |
| 0.2 | 3.1 | GO:0016207 | 4-coumarate-CoA ligase activity(GO:0016207) |
| 0.2 | 0.7 | GO:0004134 | 4-alpha-glucanotransferase activity(GO:0004134) |
| 0.2 | 2.6 | GO:0016682 | oxidoreductase activity, acting on diphenols and related substances as donors, oxygen as acceptor(GO:0016682) |
| 0.2 | 1.6 | GO:0003885 | D-arabinono-1,4-lactone oxidase activity(GO:0003885) |
| 0.2 | 0.7 | GO:0035671 | enone reductase activity(GO:0035671) |
| 0.2 | 4.2 | GO:0000822 | inositol hexakisphosphate binding(GO:0000822) |
| 0.2 | 9.6 | GO:0019203 | carbohydrate phosphatase activity(GO:0019203) |
| 0.2 | 0.7 | GO:0045430 | chalcone isomerase activity(GO:0045430) |
| 0.2 | 0.7 | GO:0000249 | C-22 sterol desaturase activity(GO:0000249) |
| 0.2 | 1.1 | GO:0004535 | poly(A)-specific ribonuclease activity(GO:0004535) |
| 0.2 | 1.0 | GO:0005354 | galactose transmembrane transporter activity(GO:0005354) |
| 0.2 | 0.8 | GO:0016882 | cyclo-ligase activity(GO:0016882) |
| 0.2 | 0.6 | GO:0003844 | 1,4-alpha-glucan branching enzyme activity(GO:0003844) |
| 0.2 | 0.9 | GO:1990825 | sequence-specific mRNA binding(GO:1990825) |
| 0.2 | 0.2 | GO:0019202 | amino acid kinase activity(GO:0019202) |
| 0.2 | 0.6 | GO:0043140 | ATP-dependent 3'-5' DNA helicase activity(GO:0043140) single-stranded DNA-dependent ATP-dependent 3'-5' DNA helicase activity(GO:1990518) |
| 0.2 | 0.9 | GO:0004478 | methionine adenosyltransferase activity(GO:0004478) |
| 0.2 | 0.5 | GO:0004452 | isopentenyl-diphosphate delta-isomerase activity(GO:0004452) |
| 0.2 | 1.4 | GO:0052622 | ATP dimethylallyltransferase activity(GO:0052622) ADP dimethylallyltransferase activity(GO:0052623) |
| 0.2 | 3.8 | GO:0042973 | glucan endo-1,3-beta-D-glucosidase activity(GO:0042973) |
| 0.2 | 3.4 | GO:0015250 | water transmembrane transporter activity(GO:0005372) water channel activity(GO:0015250) |
| 0.2 | 1.6 | GO:2001070 | starch binding(GO:2001070) |
| 0.2 | 2.1 | GO:0047259 | glucomannan 4-beta-mannosyltransferase activity(GO:0047259) |
| 0.2 | 4.6 | GO:0008810 | cellulase activity(GO:0008810) |
| 0.2 | 7.8 | GO:0001871 | pattern binding(GO:0001871) polysaccharide binding(GO:0030247) |
| 0.2 | 0.5 | GO:0004807 | triose-phosphate isomerase activity(GO:0004807) |
| 0.2 | 1.2 | GO:0047274 | galactinol-sucrose galactosyltransferase activity(GO:0047274) |
| 0.2 | 0.8 | GO:0070035 | ATP-dependent DNA helicase activity(GO:0004003) ATP-dependent helicase activity(GO:0008026) single-stranded DNA-dependent ATP-dependent DNA helicase activity(GO:0017116) single-stranded DNA-dependent ATPase activity(GO:0043142) purine NTP-dependent helicase activity(GO:0070035) |
| 0.2 | 3.2 | GO:0005089 | Rho guanyl-nucleotide exchange factor activity(GO:0005089) |
| 0.2 | 1.0 | GO:0031177 | phosphopantetheine binding(GO:0031177) |
| 0.2 | 0.8 | GO:0036374 | peptidyltransferase activity(GO:0000048) glutathione hydrolase activity(GO:0036374) |
| 0.2 | 0.3 | GO:0019166 | trans-2-enoyl-CoA reductase (NADPH) activity(GO:0019166) |
| 0.2 | 1.2 | GO:0008083 | growth factor activity(GO:0008083) |
| 0.2 | 4.9 | GO:0004089 | carbonate dehydratase activity(GO:0004089) |
| 0.2 | 0.6 | GO:0070818 | oxygen-dependent protoporphyrinogen oxidase activity(GO:0004729) protoporphyrinogen oxidase activity(GO:0070818) |
| 0.2 | 0.8 | GO:0034511 | U3 snoRNA binding(GO:0034511) |
| 0.1 | 16.7 | GO:0004252 | serine-type endopeptidase activity(GO:0004252) |
| 0.1 | 9.7 | GO:0004650 | polygalacturonase activity(GO:0004650) |
| 0.1 | 0.4 | GO:0004645 | phosphorylase activity(GO:0004645) |
| 0.1 | 0.9 | GO:0004792 | thiosulfate sulfurtransferase activity(GO:0004792) |
| 0.1 | 2.3 | GO:0047196 | long-chain-alcohol O-fatty-acyltransferase activity(GO:0047196) |
| 0.1 | 0.6 | GO:0045181 | glutamate synthase activity(GO:0015930) glutamate synthase (NADH) activity(GO:0016040) glutamate synthase activity, NAD(P)H as acceptor(GO:0045181) |
| 0.1 | 1.0 | GO:0030332 | cyclin binding(GO:0030332) |
| 0.1 | 4.9 | GO:0005179 | hormone activity(GO:0005179) |
| 0.1 | 1.1 | GO:0070696 | transmembrane receptor protein serine/threonine kinase binding(GO:0070696) |
| 0.1 | 1.8 | GO:0070567 | cytidylyltransferase activity(GO:0070567) |
| 0.1 | 5.6 | GO:0045735 | nutrient reservoir activity(GO:0045735) |
| 0.1 | 0.8 | GO:0003878 | ATP citrate synthase activity(GO:0003878) |
| 0.1 | 0.4 | GO:0009678 | hydrogen-translocating pyrophosphatase activity(GO:0009678) |
| 0.1 | 1.1 | GO:0008453 | alanine-glyoxylate transaminase activity(GO:0008453) |
| 0.1 | 0.8 | GO:0016531 | copper chaperone activity(GO:0016531) |
| 0.1 | 0.5 | GO:0016717 | oxidoreductase activity, acting on paired donors, with oxidation of a pair of donors resulting in the reduction of molecular oxygen to two molecules of water(GO:0016717) |
| 0.1 | 1.7 | GO:0046556 | alpha-L-arabinofuranosidase activity(GO:0046556) |
| 0.1 | 0.4 | GO:0051377 | mannose-ethanolamine phosphotransferase activity(GO:0051377) |
| 0.1 | 1.1 | GO:0016646 | oxidoreductase activity, acting on the CH-NH group of donors, NAD or NADP as acceptor(GO:0016646) |
| 0.1 | 0.6 | GO:0033843 | xyloglucan 6-xylosyltransferase activity(GO:0033843) |
| 0.1 | 0.6 | GO:0015367 | oxoglutarate:malate antiporter activity(GO:0015367) |
| 0.1 | 1.0 | GO:0004045 | aminoacyl-tRNA hydrolase activity(GO:0004045) |
| 0.1 | 1.2 | GO:0015038 | peptide disulfide oxidoreductase activity(GO:0015037) glutathione disulfide oxidoreductase activity(GO:0015038) |
| 0.1 | 0.2 | GO:0051753 | beta-1,4-mannosyltransferase activity(GO:0019187) mannan synthase activity(GO:0051753) |
| 0.1 | 6.4 | GO:0102483 | scopolin beta-glucosidase activity(GO:0102483) |
| 0.1 | 0.6 | GO:0008477 | purine nucleosidase activity(GO:0008477) |
| 0.1 | 0.6 | GO:0008964 | phosphoenolpyruvate carboxylase activity(GO:0008964) |
| 0.1 | 0.5 | GO:0046423 | allene-oxide cyclase activity(GO:0046423) |
| 0.1 | 3.3 | GO:0047262 | polygalacturonate 4-alpha-galacturonosyltransferase activity(GO:0047262) |
| 0.1 | 1.7 | GO:0004675 | transmembrane receptor protein serine/threonine kinase activity(GO:0004675) |
| 0.1 | 0.6 | GO:0010179 | IAA-Ala conjugate hydrolase activity(GO:0010179) |
| 0.1 | 0.4 | GO:0019534 | tetracycline transporter activity(GO:0008493) toxin transporter activity(GO:0019534) antibiotic transporter activity(GO:0042895) |
| 0.1 | 0.4 | GO:0000035 | acyl binding(GO:0000035) |
| 0.1 | 6.9 | GO:0046910 | pectinesterase inhibitor activity(GO:0046910) |
| 0.1 | 0.4 | GO:0004048 | anthranilate phosphoribosyltransferase activity(GO:0004048) |
| 0.1 | 2.1 | GO:0022839 | calcium activated cation channel activity(GO:0005227) ion gated channel activity(GO:0022839) |
| 0.1 | 0.6 | GO:0015288 | porin activity(GO:0015288) wide pore channel activity(GO:0022829) |
| 0.1 | 0.3 | GO:0004476 | mannose-6-phosphate isomerase activity(GO:0004476) |
| 0.1 | 1.7 | GO:0003746 | translation elongation factor activity(GO:0003746) |
| 0.1 | 0.9 | GO:0004869 | cysteine-type endopeptidase inhibitor activity(GO:0004869) |
| 0.1 | 0.3 | GO:0008534 | oxidized purine nucleobase lesion DNA N-glycosylase activity(GO:0008534) |
| 0.1 | 0.3 | GO:0050362 | L-tryptophan:2-oxoglutarate aminotransferase activity(GO:0050362) L-tryptophan aminotransferase activity(GO:0070529) |
| 0.1 | 4.9 | GO:0016278 | lysine N-methyltransferase activity(GO:0016278) protein-lysine N-methyltransferase activity(GO:0016279) |
| 0.1 | 1.8 | GO:0030145 | manganese ion binding(GO:0030145) |
| 0.1 | 0.4 | GO:0004831 | tyrosine-tRNA ligase activity(GO:0004831) |
| 0.1 | 1.1 | GO:0003918 | DNA topoisomerase type II (ATP-hydrolyzing) activity(GO:0003918) DNA topoisomerase II activity(GO:0061505) |
| 0.1 | 3.8 | GO:0008171 | O-methyltransferase activity(GO:0008171) |
| 0.1 | 3.1 | GO:0051087 | chaperone binding(GO:0051087) |
| 0.1 | 0.9 | GO:1990757 | ubiquitin ligase activator activity(GO:1990757) |
| 0.1 | 0.3 | GO:0005094 | Rho GDP-dissociation inhibitor activity(GO:0005094) |
| 0.1 | 1.5 | GO:0016780 | phosphotransferase activity, for other substituted phosphate groups(GO:0016780) |
| 0.1 | 3.2 | GO:0015385 | sodium:proton antiporter activity(GO:0015385) |
| 0.1 | 0.8 | GO:0043495 | protein anchor(GO:0043495) |
| 0.1 | 0.2 | GO:0003849 | 3-deoxy-7-phosphoheptulonate synthase activity(GO:0003849) |
| 0.1 | 3.2 | GO:0016759 | cellulose synthase activity(GO:0016759) |
| 0.1 | 0.9 | GO:0004124 | cysteine synthase activity(GO:0004124) |
| 0.1 | 2.3 | GO:0016782 | transferase activity, transferring sulfur-containing groups(GO:0016782) |
| 0.1 | 0.7 | GO:0035673 | oligopeptide transmembrane transporter activity(GO:0035673) peptide transmembrane transporter activity(GO:1904680) |
| 0.1 | 0.5 | GO:0004356 | glutamate-ammonia ligase activity(GO:0004356) |
| 0.1 | 0.9 | GO:0015165 | pyrimidine nucleotide-sugar transmembrane transporter activity(GO:0015165) |
| 0.1 | 1.5 | GO:0016868 | intramolecular transferase activity, phosphotransferases(GO:0016868) |
| 0.1 | 0.5 | GO:0016872 | intramolecular lyase activity(GO:0016872) |
| 0.1 | 0.2 | GO:0004749 | ribose phosphate diphosphokinase activity(GO:0004749) |
| 0.1 | 0.7 | GO:0008506 | sucrose:proton symporter activity(GO:0008506) |
| 0.1 | 2.8 | GO:0008408 | 3'-5' exonuclease activity(GO:0008408) |
| 0.1 | 0.4 | GO:0003983 | UTP:glucose-1-phosphate uridylyltransferase activity(GO:0003983) |
| 0.1 | 0.4 | GO:0003985 | acetyl-CoA C-acetyltransferase activity(GO:0003985) C-acetyltransferase activity(GO:0016453) |
| 0.1 | 0.4 | GO:0003909 | DNA ligase activity(GO:0003909) DNA ligase (ATP) activity(GO:0003910) |
| 0.1 | 2.5 | GO:0050135 | NAD(P)+ nucleosidase activity(GO:0050135) |
| 0.1 | 0.5 | GO:0046912 | transferase activity, transferring acyl groups, acyl groups converted into alkyl on transfer(GO:0046912) |
| 0.1 | 1.2 | GO:0102337 | 3-oxo-arachidoyl-CoA synthase activity(GO:0102336) 3-oxo-cerotoyl-CoA synthase activity(GO:0102337) 3-oxo-lignoceronyl-CoA synthase activity(GO:0102338) |
| 0.1 | 0.5 | GO:0016774 | phosphotransferase activity, carboxyl group as acceptor(GO:0016774) |
| 0.1 | 0.6 | GO:0003886 | DNA (cytosine-5-)-methyltransferase activity(GO:0003886) |
| 0.1 | 0.6 | GO:0004526 | ribonuclease P activity(GO:0004526) |
| 0.1 | 2.0 | GO:0005200 | structural constituent of cytoskeleton(GO:0005200) |
| 0.1 | 0.8 | GO:0005451 | monovalent cation:proton antiporter activity(GO:0005451) |
| 0.1 | 0.5 | GO:0035198 | miRNA binding(GO:0035198) |
| 0.1 | 1.3 | GO:0008378 | galactosyltransferase activity(GO:0008378) |
| 0.1 | 0.2 | GO:0003919 | FMN adenylyltransferase activity(GO:0003919) |
| 0.1 | 0.6 | GO:0000293 | ferric-chelate reductase activity(GO:0000293) oxidoreductase activity, oxidizing metal ions, NAD or NADP as acceptor(GO:0016723) |
| 0.1 | 0.4 | GO:0004834 | tryptophan synthase activity(GO:0004834) |
| 0.0 | 2.5 | GO:0016763 | transferase activity, transferring pentosyl groups(GO:0016763) |
| 0.0 | 3.6 | GO:0003777 | microtubule motor activity(GO:0003777) |
| 0.0 | 0.1 | GO:0070259 | tyrosyl-DNA phosphodiesterase activity(GO:0070259) |
| 0.0 | 0.2 | GO:0008395 | steroid hydroxylase activity(GO:0008395) |
| 0.0 | 0.1 | GO:0008428 | ribonuclease inhibitor activity(GO:0008428) 4-hydroxy-4-methyl-2-oxoglutarate aldolase activity(GO:0047443) |
| 0.0 | 0.4 | GO:0009378 | four-way junction helicase activity(GO:0009378) |
| 0.0 | 0.5 | GO:0009927 | histidine phosphotransfer kinase activity(GO:0009927) |
| 0.0 | 5.6 | GO:0009055 | electron carrier activity(GO:0009055) |
| 0.0 | 0.3 | GO:0034237 | protein kinase A regulatory subunit binding(GO:0034237) protein kinase A binding(GO:0051018) Arp2/3 complex binding(GO:0071933) |
| 0.0 | 0.3 | GO:0015210 | pyrimidine nucleobase transmembrane transporter activity(GO:0005350) uracil transmembrane transporter activity(GO:0015210) |
| 0.0 | 2.4 | GO:0003755 | peptidyl-prolyl cis-trans isomerase activity(GO:0003755) |
| 0.0 | 0.2 | GO:0008728 | GTP diphosphokinase activity(GO:0008728) |
| 0.0 | 0.2 | GO:0045502 | dynein binding(GO:0045502) dynein intermediate chain binding(GO:0045505) dynein light intermediate chain binding(GO:0051959) |
| 0.0 | 0.2 | GO:0015114 | phosphate ion transmembrane transporter activity(GO:0015114) |
| 0.0 | 0.2 | GO:0048038 | quinone binding(GO:0048038) |
| 0.0 | 0.3 | GO:0008381 | mechanically-gated ion channel activity(GO:0008381) mechanically gated channel activity(GO:0022833) |
| 0.0 | 0.5 | GO:0032440 | 2-alkenal reductase [NAD(P)] activity(GO:0032440) |
| 0.0 | 0.3 | GO:0010428 | methyl-CpNpG binding(GO:0010428) methyl-CpNpN binding(GO:0010429) |
| 0.0 | 2.9 | GO:0008757 | S-adenosylmethionine-dependent methyltransferase activity(GO:0008757) |
| 0.0 | 1.4 | GO:0003727 | single-stranded RNA binding(GO:0003727) |
| 0.0 | 1.8 | GO:0070001 | aspartic-type peptidase activity(GO:0070001) |
| 0.0 | 0.2 | GO:0048487 | beta-tubulin binding(GO:0048487) |
| 0.0 | 2.7 | GO:0008017 | microtubule binding(GO:0008017) |
| 0.0 | 0.2 | GO:0050062 | long-chain-fatty-acyl-CoA reductase activity(GO:0050062) |
| 0.0 | 8.3 | GO:0003735 | structural constituent of ribosome(GO:0003735) |
| 0.0 | 0.1 | GO:0008172 | 5-methyltetrahydropteroyltriglutamate-homocysteine S-methyltransferase activity(GO:0003871) S-methyltransferase activity(GO:0008172) methionine synthase activity(GO:0008705) 5-methyltetrahydrofolate-dependent methyltransferase activity(GO:0042084) 5-methyltetrahydropteroyltri-L-glutamate-dependent methyltransferase activity(GO:0042085) |
| 0.0 | 0.1 | GO:0004181 | metallocarboxypeptidase activity(GO:0004181) |
| 0.0 | 0.3 | GO:0031176 | endo-1,4-beta-xylanase activity(GO:0031176) |
| 0.0 | 0.4 | GO:0070628 | proteasome binding(GO:0070628) |
| 0.0 | 0.1 | GO:0004679 | AMP-activated protein kinase activity(GO:0004679) |
| 0.0 | 0.1 | GO:0051019 | mitogen-activated protein kinase binding(GO:0051019) |
| 0.0 | 0.1 | GO:0032135 | DNA insertion or deletion binding(GO:0032135) |
| 0.0 | 0.1 | GO:0008253 | 5'-nucleotidase activity(GO:0008253) |
| 0.0 | 0.3 | GO:0004084 | branched-chain-amino-acid transaminase activity(GO:0004084) |
| 0.0 | 0.2 | GO:0004714 | transmembrane receptor protein tyrosine kinase activity(GO:0004714) |
| 0.0 | 0.2 | GO:0047372 | acylglycerol lipase activity(GO:0047372) |
| 0.0 | 0.3 | GO:0004430 | 1-phosphatidylinositol 4-kinase activity(GO:0004430) |
| 0.0 | 0.1 | GO:0005458 | GDP-mannose transmembrane transporter activity(GO:0005458) |
| 0.0 | 0.2 | GO:0030983 | mismatched DNA binding(GO:0030983) |
| 0.0 | 0.3 | GO:0019706 | protein-cysteine S-palmitoyltransferase activity(GO:0019706) protein-cysteine S-acyltransferase activity(GO:0019707) |
| 0.0 | 0.3 | GO:0030599 | pectinesterase activity(GO:0030599) |
| 0.0 | 0.2 | GO:0046923 | ER retention sequence binding(GO:0046923) |
| 0.0 | 0.7 | GO:0016620 | oxidoreductase activity, acting on the aldehyde or oxo group of donors, NAD or NADP as acceptor(GO:0016620) |
| 0.0 | 0.7 | GO:0016413 | O-acetyltransferase activity(GO:0016413) |
| 0.0 | 0.1 | GO:0003841 | 1-acylglycerol-3-phosphate O-acyltransferase activity(GO:0003841) lysophosphatidic acid acyltransferase activity(GO:0042171) |
| 0.0 | 0.0 | GO:0004385 | guanylate kinase activity(GO:0004385) |
| 0.0 | 0.0 | GO:0016707 | gibberellin 3-beta-dioxygenase activity(GO:0016707) |
Gene overrepresentation in curated gene sets: canonical pathways category:
| Log-likelihood per target | Total log-likelihood | Term | Description |
|---|---|---|---|
| 0.4 | 2.3 | PID AP1 PATHWAY | AP-1 transcription factor network |
| 0.2 | 1.0 | ST WNT BETA CATENIN PATHWAY | Wnt/beta-catenin Pathway |
| 0.2 | 1.5 | PID HES HEY PATHWAY | Notch-mediated HES/HEY network |
| 0.2 | 0.6 | SA G2 AND M PHASES | Cdc25 activates the cdc2/cyclin B complex to induce the G2/M transition. |
| 0.1 | 0.9 | PID HIF1 TFPATHWAY | HIF-1-alpha transcription factor network |
| 0.1 | 0.9 | PID CXCR4 PATHWAY | CXCR4-mediated signaling events |
| 0.1 | 0.7 | PID MYC ACTIV PATHWAY | Validated targets of C-MYC transcriptional activation |
| 0.1 | 0.6 | PID CMYB PATHWAY | C-MYB transcription factor network |
| 0.0 | 0.2 | SIG INSULIN RECEPTOR PATHWAY IN CARDIAC MYOCYTES | Genes related to the insulin receptor pathway |
Gene overrepresentation in curated gene sets: REACTOME pathways category:
| Log-likelihood per target | Total log-likelihood | Term | Description |
|---|---|---|---|
| 1.6 | 4.7 | REACTOME GABA SYNTHESIS RELEASE REUPTAKE AND DEGRADATION | Genes involved in GABA synthesis, release, reuptake and degradation |
| 0.6 | 1.9 | REACTOME INTEGRATION OF ENERGY METABOLISM | Genes involved in Integration of energy metabolism |
| 0.4 | 2.8 | REACTOME MITOTIC G2 G2 M PHASES | Genes involved in Mitotic G2-G2/M phases |
| 0.4 | 1.1 | REACTOME GASTRIN CREB SIGNALLING PATHWAY VIA PKC AND MAPK | Genes involved in Gastrin-CREB signalling pathway via PKC and MAPK |
| 0.2 | 1.1 | REACTOME DOPAMINE NEUROTRANSMITTER RELEASE CYCLE | Genes involved in Dopamine Neurotransmitter Release Cycle |
| 0.2 | 0.6 | REACTOME GLYCOSPHINGOLIPID METABOLISM | Genes involved in Glycosphingolipid metabolism |
| 0.2 | 3.0 | REACTOME ABCA TRANSPORTERS IN LIPID HOMEOSTASIS | Genes involved in ABCA transporters in lipid homeostasis |
| 0.2 | 1.1 | REACTOME UNWINDING OF DNA | Genes involved in Unwinding of DNA |
| 0.1 | 1.0 | REACTOME ASPARAGINE N LINKED GLYCOSYLATION | Genes involved in Asparagine N-linked glycosylation |
| 0.1 | 0.8 | REACTOME ANTIVIRAL MECHANISM BY IFN STIMULATED GENES | Genes involved in Antiviral mechanism by IFN-stimulated genes |
| 0.1 | 0.3 | REACTOME GLUTATHIONE CONJUGATION | Genes involved in Glutathione conjugation |
| 0.1 | 0.6 | REACTOME GENERIC TRANSCRIPTION PATHWAY | Genes involved in Generic Transcription Pathway |
| 0.1 | 0.2 | REACTOME ABACAVIR TRANSPORT AND METABOLISM | Genes involved in Abacavir transport and metabolism |
| 0.0 | 0.2 | REACTOME PEROXISOMAL LIPID METABOLISM | Genes involved in Peroxisomal lipid metabolism |
| 0.0 | 0.1 | REACTOME E2F ENABLED INHIBITION OF PRE REPLICATION COMPLEX FORMATION | Genes involved in E2F-enabled inhibition of pre-replication complex formation |
| 0.0 | 0.6 | REACTOME INFLUENZA LIFE CYCLE | Genes involved in Influenza Life Cycle |