Project
GSE43616: Time-course of wild-type Arabidopsis leaf
Navigation
Downloads
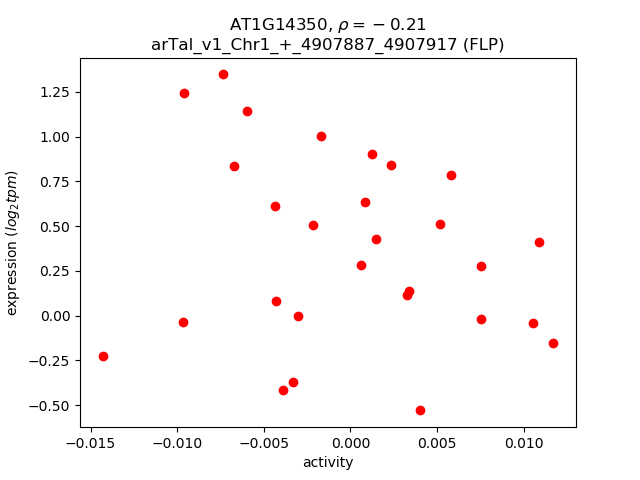
Results for AT1G14350
Z-value: 0.38
Transcription factors associated with AT1G14350
| Gene Symbol | Gene ID | Gene Info |
|---|---|---|
|
AT1G14350
|
AT1G14350 | Duplicated homeodomain-like superfamily protein |
Activity-expression correlation:
| Gene | Promoter | Pearson corr. coef. | P-value | Plot |
|---|---|---|---|---|
| FLP | arTal_v1_Chr1_+_4907887_4907917 | -0.21 | 2.9e-01 | Click! |
Activity profile of AT1G14350 motif
Sorted Z-values of AT1G14350 motif
| Promoter | Log-likelihood | Transcript | Gene | Gene Info |
|---|---|---|---|---|
| arTal_v1_Chr1_-_19336072_19336135 | 0.99 |
AT1G52000.2
AT1G52000.1 |
AT1G52000
|
Mannose-binding lectin superfamily protein |
| arTal_v1_Chr2_-_1800472_1800472 | 0.72 |
AT2G05070.1
|
LHCB2.2
|
photosystem II light harvesting complex protein 2.2 |
| arTal_v1_Chr3_-_8229619_8229619 | 0.59 |
AT3G23120.1
|
RLP38
|
receptor like protein 38 |
| arTal_v1_Chr3_+_22373013_22373013 | 0.52 |
AT3G60530.1
|
GATA4
|
GATA transcription factor 4 |
| arTal_v1_Chr4_-_7992429_7992429 | 0.51 |
AT4G13770.1
|
CYP83A1
|
cytochrome P450, family 83, subfamily A, polypeptide 1 |
| arTal_v1_Chr4_-_7153571_7153681 | 0.51 |
AT4G11900.10
AT4G11900.8 AT4G11900.9 AT4G11900.7 AT4G11900.6 AT4G11900.3 AT4G11900.5 AT4G11900.2 AT4G11900.4 AT4G11900.1 |
AT4G11900
|
S-locus lectin protein kinase family protein |
| arTal_v1_Chr1_-_498539_498539 | 0.46 |
AT1G02450.1
|
NIMIN1
|
NIM1-interacting 1 |
| arTal_v1_Chr2_+_14783254_14783254 | 0.42 |
AT2G35070.1
AT2G35070.2 |
AT2G35070
|
transmembrane protein |
| arTal_v1_Chr2_+_6947096_6947096 | 0.38 |
AT2G15960.1
|
AT2G15960
|
stress-induced protein |
| arTal_v1_Chr3_+_9769634_9769666 | 0.35 |
AT3G26600.2
AT3G26600.1 |
ARO4
|
armadillo repeat only 4 |
| arTal_v1_Chr5_-_22230500_22230500 | 0.34 |
AT5G54710.1
|
AT5G54710
|
Ankyrin repeat family protein |
| arTal_v1_Chr1_+_2238017_2238154 | 0.33 |
AT1G07280.1
AT1G07280.2 AT1G07280.4 AT1G07280.3 |
AT1G07280
|
Tetratricopeptide repeat (TPR)-like superfamily protein |
| arTal_v1_Chr5_-_22230663_22230663 | 0.33 |
AT5G54710.2
|
AT5G54710
|
Ankyrin repeat family protein |
| arTal_v1_Chr1_+_21746354_21746373 | 0.33 |
AT1G58602.2
AT1G58602.1 |
AT1G58602
|
LRR and NB-ARC domains-containing disease resistance protein |
| arTal_v1_Chr5_-_15859911_15859911 | 0.33 |
AT5G39610.1
|
NAC6
|
NAC domain containing protein 6 |
| arTal_v1_Chr4_-_1230164_1230164 | 0.30 |
AT4G02770.1
|
PSAD-1
|
photosystem I subunit D-1 |
| arTal_v1_Chr1_+_20112141_20112149 | 0.28 |
AT1G53870.2
AT1G53870.1 AT1G53870.3 AT1G53870.4 |
AT1G53870
|
LURP-one-like protein (DUF567) |
| arTal_v1_Chr1_-_17898804_17898813 | 0.26 |
AT1G48420.3
AT1G48420.2 AT1G48420.1 |
D-CDES
|
D-cysteine desulfhydrase |
| arTal_v1_Chr1_-_3590928_3590928 | 0.26 |
AT1G10760.1
AT1G10760.3 |
SEX1
|
Pyruvate phosphate dikinase, PEP/pyruvate binding domain-containing protein |
| arTal_v1_Chr1_-_3590701_3590701 | 0.25 |
AT1G10760.2
|
SEX1
|
Pyruvate phosphate dikinase, PEP/pyruvate binding domain-containing protein |
| arTal_v1_Chr4_-_367274_367274 | 0.23 |
AT4G00880.1
|
AT4G00880
|
SAUR-like auxin-responsive protein family |
| arTal_v1_Chr1_-_17706460_17706460 | 0.23 |
AT1G48000.1
|
MYB112
|
myb domain protein 112 |
| arTal_v1_Chr3_-_9765570_9765570 | 0.21 |
AT3G26590.1
|
AT3G26590
|
MATE efflux family protein |
| arTal_v1_Chr3_-_10047453_10047453 | 0.20 |
AT3G27210.1
|
AT3G27210
|
hypothetical protein |
| arTal_v1_Chr1_+_12366810_12366831 | 0.20 |
AT1G34020.2
AT1G34020.1 AT1G34020.3 |
AT1G34020
|
Nucleotide-sugar transporter family protein |
| arTal_v1_Chr2_+_18498909_18499053 | 0.19 |
AT2G44850.2
AT2G44850.3 |
AT2G44850
|
hypothetical protein |
| arTal_v1_Chr2_+_15568926_15568986 | 0.19 |
AT2G37050.4
AT2G37050.3 AT2G37050.1 AT2G37050.2 |
AT2G37050
|
Leucine-rich repeat protein kinase family protein |
| arTal_v1_Chr3_+_18071454_18071454 | 0.18 |
AT3G48750.1
|
CDC2
|
cell division control 2 |
| arTal_v1_Chr1_+_4788463_4788550 | 0.18 |
AT1G13980.2
AT1G13980.1 |
GN
|
sec7 domain-containing protein |
| arTal_v1_Chr5_-_15385247_15385320 | 0.18 |
AT5G38430.2
AT5G38430.1 |
RBCS1B
|
Ribulose bisphosphate carboxylase (small chain) family protein |
| arTal_v1_Chr5_-_6072334_6072334 | 0.17 |
AT5G18340.1
|
AT5G18340
|
ARM repeat superfamily protein |
| arTal_v1_Chr3_-_9764614_9764614 | 0.17 |
AT3G26590.2
|
AT3G26590
|
MATE efflux family protein |
| arTal_v1_Chr1_-_20979395_20979448 | 0.16 |
AT1G56090.1
AT1G56090.2 |
AT1G56090
|
Tetratricopeptide repeat (TPR)-like superfamily protein |
| arTal_v1_Chr5_-_2070378_2070378 | 0.16 |
AT5G06710.3
AT5G06710.4 |
HAT14
|
homeobox leucine zipper protein |
| arTal_v1_Chr5_-_2070566_2070566 | 0.15 |
AT5G06710.1
AT5G06710.2 |
HAT14
|
homeobox leucine zipper protein |
| arTal_v1_Chr5_+_3253122_3253122 | 0.15 |
AT5G10340.1
|
AT5G10340
|
F-box family protein |
| arTal_v1_Chr1_-_19851435_19851435 | 0.15 |
AT1G53230.2
|
TCP3
|
TEOSINTE BRANCHED 1, cycloidea and PCF transcription factor 3 |
| arTal_v1_Chr5_+_8354637_8354637 | 0.15 |
AT5G24460.1
|
AT5G24460
|
RING-H2 zinc finger protein |
| arTal_v1_Chr1_+_10654800_10654857 | 0.15 |
AT1G30270.1
AT1G30270.2 AT1G30270.3 |
CIPK23
|
CBL-interacting protein kinase 23 |
| arTal_v1_Chr2_+_18661460_18661464 | 0.15 |
AT2G45250.1
AT2G45250.3 AT2G45250.2 |
AT2G45250
|
integral membrane hemolysin-III-like protein |
| arTal_v1_Chr1_-_3823088_3823088 | 0.14 |
AT1G11360.4
AT1G11360.1 AT1G11360.3 AT1G11360.2 |
AT1G11360
|
Adenine nucleotide alpha hydrolases-like superfamily protein |
| arTal_v1_Chr5_+_25181296_25181296 | 0.14 |
AT5G62690.1
|
TUB2
|
tubulin beta chain 2 |
| arTal_v1_Chr1_+_21732566_21732636 | 0.14 |
AT1G58520.2
AT1G58520.4 AT1G58520.5 AT1G58520.1 AT1G58520.6 |
RXW8
|
GDSL-like lipase/acylhydrolase superfamily protein |
| arTal_v1_Chr1_-_19851725_19851725 | 0.14 |
AT1G53230.1
|
TCP3
|
TEOSINTE BRANCHED 1, cycloidea and PCF transcription factor 3 |
| arTal_v1_Chr3_+_20870000_20870000 | 0.14 |
AT3G56270.1
|
AT3G56270
|
WEB family protein (DUF827) |
| arTal_v1_Chr1_+_5702153_5702153 | 0.13 |
AT1G16680.1
|
AT1G16680
|
Chaperone DnaJ-domain superfamily protein |
| arTal_v1_Chr2_+_505375_505375 | 0.13 |
AT2G02070.1
AT2G02070.2 |
IDD5
|
indeterminate(ID)-domain 5 |
| arTal_v1_Chr2_+_18498672_18498672 | 0.12 |
AT2G44850.1
|
AT2G44850
|
hypothetical protein |
| arTal_v1_Chr4_+_8195881_8195881 | 0.12 |
AT4G14220.1
|
RHF1A
|
RING-H2 group F1A |
| arTal_v1_Chr3_-_4824913_4824913 | 0.12 |
AT3G14430.1
|
AT3G14430
|
GRIP/coiled-coil protein |
| arTal_v1_Chr1_+_7963813_7963813 | 0.12 |
AT1G22540.1
|
AT1G22540
|
Major facilitator superfamily protein |
| arTal_v1_Chr4_-_18563981_18563987 | 0.12 |
AT4G40050.2
AT4G40050.1 |
AT4G40050
|
signal transducer, putative (DUF3550/UPF0682) |
| arTal_v1_Chr4_+_12714624_12714624 | 0.10 |
AT4G24630.1
|
AT4G24630
|
DHHC-type zinc finger family protein |
| arTal_v1_Chr1_+_21733493_21733493 | 0.10 |
AT1G58520.7
|
RXW8
|
GDSL-like lipase/acylhydrolase superfamily protein |
| arTal_v1_Chr1_-_12566615_12566615 | 0.10 |
AT1G34400.1
|
AT1G34400
|
hypothetical protein |
| arTal_v1_Chr3_+_20671115_20671115 | 0.09 |
AT3G55700.1
|
AT3G55700
|
UDP-Glycosyltransferase superfamily protein |
| arTal_v1_Chr2_-_12978868_12978949 | 0.09 |
AT2G30460.4
AT2G30460.3 AT2G30460.5 AT2G30460.2 AT2G30460.1 |
AT2G30460
|
Nucleotide/sugar transporter family protein |
| arTal_v1_Chr5_-_7152876_7152922 | 0.08 |
AT5G21060.3
AT5G21060.2 AT5G21060.1 |
AT5G21060
|
Glyceraldehyde-3-phosphate dehydrogenase-like family protein |
| arTal_v1_Chr1_+_6744353_6744405 | 0.08 |
AT1G19480.1
AT1G19480.2 |
AT1G19480
|
DNA glycosylase superfamily protein |
| arTal_v1_Chr2_+_567873_567873 | 0.08 |
AT2G02190.1
|
AT2G02190
|
|
| arTal_v1_Chr1_-_24026209_24026209 | 0.07 |
AT1G64650.2
|
AT1G64650
|
Major facilitator superfamily protein |
| arTal_v1_Chr1_+_22208089_22208089 | 0.07 |
AT1G60220.1
|
ULP1D
|
UB-like protease 1D |
| arTal_v1_Chr3_+_10576961_10576961 | 0.07 |
AT3G28310.1
|
AT3G28310
|
hypothetical protein (DUF677) |
| arTal_v1_Chr1_-_24026530_24026530 | 0.06 |
AT1G64650.1
|
AT1G64650
|
Major facilitator superfamily protein |
| arTal_v1_Chr3_+_16569051_16569051 | 0.06 |
AT3G45230.1
|
AT3G45230
|
hydroxyproline-rich glycoprotein family protein |
| arTal_v1_Chr1_-_30249305_30249337 | 0.06 |
AT1G80460.2
AT1G80460.1 |
NHO1
|
Actin-like ATPase superfamily protein |
| arTal_v1_Chr1_+_11391199_11391199 | 0.06 |
AT1G31780.1
|
AT1G31780
|
oligomeric golgi complex subunit |
| arTal_v1_Chr5_-_15575712_15575712 | 0.05 |
AT5G38900.1
|
AT5G38900
|
Thioredoxin superfamily protein |
| arTal_v1_Chr3_+_20958563_20958584 | 0.05 |
AT3G56570.1
AT3G56570.2 |
AT3G56570
|
SET domain-containing protein |
| arTal_v1_Chr1_-_9864779_9864779 | 0.05 |
AT1G28230.1
|
PUP1
|
purine permease 1 |
| arTal_v1_Chr2_-_12978194_12978194 | 0.05 |
AT2G30460.6
|
AT2G30460
|
Nucleotide/sugar transporter family protein |
| arTal_v1_Chr3_+_16421045_16421045 | 0.05 |
AT3G44950.1
|
AT3G44950
|
glycine-rich protein |
| arTal_v1_Chr5_-_15575437_15575437 | 0.05 |
AT5G38900.2
|
AT5G38900
|
Thioredoxin superfamily protein |
| arTal_v1_Chr3_-_20785885_20785885 | 0.05 |
AT3G56000.1
|
CSLA14
|
cellulose synthase like A14 |
| arTal_v1_Chr5_+_9189425_9189440 | 0.04 |
AT5G26240.1
AT5G26240.2 |
CLC-D
|
chloride channel D |
| arTal_v1_Chr3_-_11086003_11086003 | 0.04 |
AT3G29110.1
|
AT3G29110
|
Terpenoid cyclases/Protein prenyltransferases superfamily protein |
| arTal_v1_Chr1_+_22192758_22192758 | 0.04 |
AT1G60170.1
|
emb1220
|
pre-mRNA processing ribonucleoprotein binding region-containing protein |
| arTal_v1_Chr2_+_13508493_13508493 | 0.04 |
AT2G31760.1
|
ARI10
|
RING/U-box superfamily protein |
| arTal_v1_Chr1_-_6155796_6155804 | 0.04 |
AT1G17890.2
AT1G17890.1 AT1G17890.3 |
GER2
|
NAD(P)-binding Rossmann-fold superfamily protein |
| arTal_v1_Chr2_+_16627216_16627216 | 0.04 |
AT2G39840.1
|
TOPP4
|
type one serine/threonine protein phosphatase 4 |
| arTal_v1_Chr2_+_1798155_1798155 | 0.04 |
AT2G05060.1
|
AT2G05060
|
Protein kinase superfamily protein |
| arTal_v1_Chr4_+_5295756_5295756 | 0.04 |
AT4G08360.1
|
AT4G08360
|
KOW domain-containing protein |
| arTal_v1_Chr1_+_23121_23121 | 0.03 |
AT1G01040.1
|
DCL1
|
dicer-like 1 |
| arTal_v1_Chr5_+_17409524_17409524 | 0.03 |
AT5G43360.1
|
PHT1%3B3
|
phosphate transporter 1;3 |
| arTal_v1_Chr1_+_23416_23416 | 0.03 |
AT1G01040.2
|
DCL1
|
dicer-like 1 |
| arTal_v1_Chr1_-_21334727_21334790 | 0.03 |
AT1G57600.1
AT1G57600.2 AT1G57600.3 |
AT1G57600
|
MBOAT (membrane bound O-acyl transferase) family protein |
| arTal_v1_Chr1_+_16999446_16999446 | 0.03 |
AT1G44960.1
|
AT1G44960
|
SNARE associated Golgi protein family |
| arTal_v1_Chr1_+_12426700_12426778 | 0.03 |
AT1G34120.1
AT1G34120.4 AT1G34120.2 AT1G34120.3 |
IP5PI
|
inositol polyphosphate 5-phosphatase I |
| arTal_v1_Chr1_-_11406809_11406809 | 0.03 |
AT1G31810.1
|
AFH14
|
Formin Homology 14 |
| arTal_v1_Chr4_-_16862420_16862420 | 0.03 |
AT4G35510.1
|
AT4G35510
|
PHD finger-like protein |
| arTal_v1_Chr3_+_8014809_8014809 | 0.02 |
AT3G22650.1
AT3G22650.2 |
CEG
|
F-box and associated interaction domains-containing protein |
| arTal_v1_Chr2_+_9315204_9315204 | 0.02 |
AT2G21850.1
|
AT2G21850
|
Cysteine/Histidine-rich C1 domain family protein |
| arTal_v1_Chr4_+_7105136_7105136 | 0.02 |
AT4G11810.3
|
AT4G11810
|
Major Facilitator Superfamily with SPX (SYG1/Pho81/XPR1) domain-containing protein |
| arTal_v1_Chr5_+_9596766_9596766 | 0.02 |
AT5G27240.1
|
AT5G27240
|
DNAJ heat shock N-terminal domain-containing protein |
| arTal_v1_Chr2_+_12689581_12689581 | 0.02 |
AT2G29680.1
|
CDC6
|
cell division control 6 |
| arTal_v1_Chr1_-_21334018_21334018 | 0.02 |
AT1G57600.4
|
AT1G57600
|
MBOAT (membrane bound O-acyl transferase) family protein |
| arTal_v1_Chr5_+_9597307_9597307 | 0.02 |
AT5G27240.2
|
AT5G27240
|
DNAJ heat shock N-terminal domain-containing protein |
| arTal_v1_Chr1_+_4197396_4197396 | 0.02 |
AT1G12340.1
|
AT1G12340
|
Cornichon family protein |
| arTal_v1_Chr2_-_1206249_1206249 | 0.02 |
AT2G03930.2
|
AT2G03930
|
hypothetical protein (DUF239) |
| arTal_v1_Chr1_-_19767334_19767507 | 0.02 |
AT1G53040.1
AT1G53040.4 AT1G53040.6 AT1G53040.5 AT1G53040.2 AT1G53040.3 |
AT1G53040
|
tRNA (met) cytidine acetyltransferase, putative (DUF616) |
| arTal_v1_Chr1_+_22452573_22452573 | 0.02 |
AT1G60980.1
|
GA20OX4
|
gibberellin 20-oxidase 4 |
| arTal_v1_Chr5_+_9597552_9597552 | 0.02 |
AT5G27240.3
|
AT5G27240
|
DNAJ heat shock N-terminal domain-containing protein |
| arTal_v1_Chr4_+_7104510_7104510 | 0.02 |
AT4G11810.1
AT4G11810.2 |
AT4G11810
|
Major Facilitator Superfamily with SPX (SYG1/Pho81/XPR1) domain-containing protein |
| arTal_v1_Chr2_-_13056384_13056384 | 0.02 |
AT2G30650.2
AT2G30650.1 |
AT2G30650
|
ATP-dependent caseinolytic (Clp) protease/crotonase family protein |
| arTal_v1_Chr5_+_14690436_14690436 | 0.02 |
AT5G37140.1
|
AT5G37140
|
P-loop containing nucleoside triphosphate hydrolases superfamily protein |
| arTal_v1_Chr2_+_12689171_12689171 | 0.02 |
AT2G29680.2
|
CDC6
|
cell division control 6 |
| arTal_v1_Chr1_+_8117286_8117286 | 0.02 |
AT1G22930.1
|
AT1G22930
|
T-complex protein 11 |
| arTal_v1_Chr1_+_8117732_8117732 | 0.02 |
AT1G22930.2
|
AT1G22930
|
T-complex protein 11 |
| arTal_v1_Chr3_+_17385161_17385161 | 0.01 |
AT3G47210.1
|
AT3G47210
|
hypothetical protein (DUF247) |
| arTal_v1_Chr5_+_14783436_14783436 | 0.01 |
AT5G37330.1
|
AT5G37330
|
|
| arTal_v1_Chr1_+_12427475_12427475 | 0.01 |
AT1G34120.5
|
IP5PI
|
inositol polyphosphate 5-phosphatase I |
| arTal_v1_Chr5_-_9382331_9382331 | 0.01 |
AT5G26590.1
|
AT5G26590
|
|
| arTal_v1_Chr1_-_18632039_18632039 | 0.01 |
AT1G50300.1
AT1G50300.2 |
TAF15
|
TBP-associated factor 15 |
| arTal_v1_Chr1_-_11406017_11406017 | 0.01 |
AT1G31810.2
|
AFH14
|
Formin Homology 14 |
| arTal_v1_Chr1_-_5898728_5898728 | 0.01 |
AT1G17240.1
|
RLP2
|
receptor like protein 2 |
| arTal_v1_Chr1_+_761261_761282 | 0.01 |
AT1G03160.3
AT1G03160.1 AT1G03160.2 AT1G03160.4 |
FZL
|
FZO-like protein |
| arTal_v1_Chr4_-_5271148_5271148 | 0.01 |
AT4G08340.1
|
AT4G08340
|
|
| arTal_v1_Chr1_+_13018289_13018289 | 0.01 |
AT1G35400.1
|
AT1G35400
|
hypothetical protein (DUF1184) |
| arTal_v1_Chr1_+_21729913_21729913 | 0.01 |
AT1G58525.1
AT1G58520.3 |
AT1G58525
RXW8
|
GDSL-like lipase/acylhydrolase superfamily protein GDSL-like lipase/acylhydrolase superfamily protein |
| arTal_v1_Chr5_+_9343785_9343785 | 0.01 |
AT5G26650.1
|
AGL36
|
AGAMOUS-like 36 |
| arTal_v1_Chr1_+_10531831_10531831 | 0.01 |
AT1G30030.1
|
AT1G30030
|
|
| arTal_v1_Chr1_-_5898931_5898931 | 0.01 |
AT1G17240.2
|
RLP2
|
receptor like protein 2 |
| arTal_v1_Chr1_-_18764367_18764367 | 0.01 |
AT1G50650.1
|
AT1G50650
|
Stigma-specific Stig1 family protein |
| arTal_v1_Chr1_-_8266048_8266048 | 0.01 |
AT1G23300.1
|
AT1G23300
|
MATE efflux family protein |
| arTal_v1_Chr3_+_21884426_21884520 | 0.00 |
AT3G59190.2
AT3G59190.1 |
AT3G59190
|
F-box/RNI-like superfamily protein |
| arTal_v1_Chr1_-_17683629_17683719 | 0.00 |
AT1G47960.1
AT1G47960.2 |
C/VIF1
|
cell wall / vacuolar inhibitor of fructosidase 1 |
| arTal_v1_Chr2_-_6728183_6728183 | 0.00 |
AT2G15420.1
|
AT2G15420
|
myosin heavy chain-like protein |
| arTal_v1_Chr1_+_25701770_25701770 | 0.00 |
AT1G68500.1
|
AT1G68500
|
hypothetical protein |
| arTal_v1_Chr3_+_11177290_11177290 | 0.00 |
AT3G29210.1
|
AT3G29210
|
|
| arTal_v1_Chr1_+_24909178_24909178 | 0.00 |
AT1G66780.1
|
AT1G66780
|
MATE efflux family protein |
| arTal_v1_Chr2_-_1037675_1037675 | 0.00 |
AT2G03430.1
|
AT2G03430
|
Ankyrin repeat family protein |
| arTal_v1_Chr3_+_22492811_22492811 | 0.00 |
AT3G60870.1
|
AHL18
|
AT-hook motif nuclear-localized protein 18 |
| arTal_v1_Chr3_+_17278542_17278542 | 0.00 |
AT3G46910.1
|
AT3G46910
|
Cullin family protein |
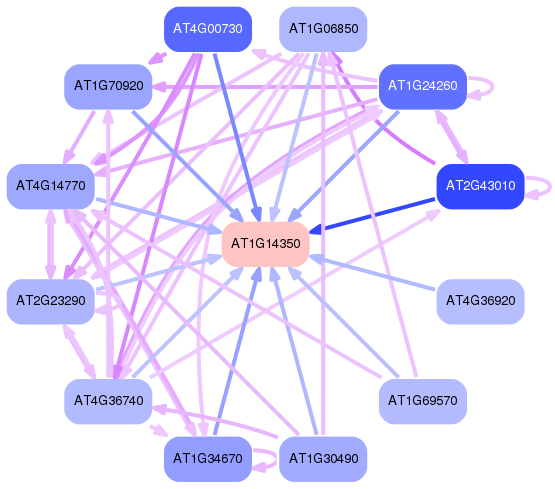
Network of associatons between targets according to the STRING database.

First level regulatory network of AT1G14350
Gene Ontology Analysis
Gene overrepresentation in biological process category:
| Log-likelihood per target | Total log-likelihood | Term | Description |
|---|---|---|---|
| 0.1 | 0.7 | GO:0009769 | photosynthesis, light harvesting in photosystem II(GO:0009769) positive regulation of reactive oxygen species biosynthetic process(GO:1903428) |
| 0.1 | 0.3 | GO:0009093 | cysteine catabolic process(GO:0009093) |
| 0.1 | 0.3 | GO:0051091 | positive regulation of sequence-specific DNA binding transcription factor activity(GO:0051091) |
| 0.1 | 0.2 | GO:0002009 | establishment of planar polarity(GO:0001736) morphogenesis of a polarized epithelium(GO:0001738) morphogenesis of an epithelium(GO:0002009) tissue morphogenesis(GO:0048729) |
| 0.0 | 0.5 | GO:0009610 | response to symbiotic fungus(GO:0009610) |
| 0.0 | 0.2 | GO:0010444 | G1/S transition of mitotic cell cycle(GO:0000082) guard mother cell cytokinesis(GO:0010235) guard mother cell differentiation(GO:0010444) |
| 0.0 | 0.3 | GO:0045962 | positive regulation of development, heterochronic(GO:0045962) |
| 0.0 | 0.5 | GO:0010112 | regulation of systemic acquired resistance(GO:0010112) |
| 0.0 | 0.1 | GO:0015689 | molybdate ion transport(GO:0015689) |
| 0.0 | 0.1 | GO:0010184 | cytokinin transport(GO:0010184) |
| 0.0 | 0.1 | GO:0006307 | DNA dealkylation involved in DNA repair(GO:0006307) |
| 0.0 | 0.1 | GO:0009090 | homoserine biosynthetic process(GO:0009090) |
| 0.0 | 0.1 | GO:0098795 | production of lsiRNA involved in RNA interference(GO:0010599) mRNA cleavage involved in gene silencing by miRNA(GO:0035279) mRNA cleavage involved in gene silencing(GO:0098795) |
| 0.0 | 0.5 | GO:0019761 | S-glycoside biosynthetic process(GO:0016144) glycosinolate biosynthetic process(GO:0019758) glucosinolate biosynthetic process(GO:0019761) |
Gene overrepresentation in cellular component category:
| Log-likelihood per target | Total log-likelihood | Term | Description |
|---|---|---|---|
| 0.1 | 0.7 | GO:0030076 | thylakoid light-harvesting complex(GO:0009503) PSII associated light-harvesting complex II(GO:0009517) light-harvesting complex(GO:0030076) |
| 0.0 | 0.3 | GO:0009538 | photosystem I reaction center(GO:0009538) |
| 0.0 | 0.1 | GO:0017053 | transcriptional repressor complex(GO:0017053) |
| 0.0 | 0.2 | GO:0010005 | cortical microtubule, transverse to long axis(GO:0010005) |
| 0.0 | 0.1 | GO:0045298 | tubulin complex(GO:0045298) |
Gene overrepresentation in molecular function category:
| Log-likelihood per target | Total log-likelihood | Term | Description |
|---|---|---|---|
| 0.1 | 0.5 | GO:0016781 | phosphotransferase activity, paired acceptors(GO:0016781) |
| 0.0 | 0.2 | GO:0016984 | ribulose-bisphosphate carboxylase activity(GO:0016984) |
| 0.0 | 0.7 | GO:0016168 | chlorophyll binding(GO:0016168) |
| 0.0 | 0.1 | GO:0004412 | homoserine dehydrogenase activity(GO:0004412) |
| 0.0 | 0.1 | GO:0032131 | alkylated DNA binding(GO:0032131) |
| 0.0 | 0.2 | GO:0030332 | cyclin binding(GO:0030332) |
| 0.0 | 0.1 | GO:0015098 | molybdate ion transmembrane transporter activity(GO:0015098) |
| 0.0 | 0.2 | GO:0005086 | ARF guanyl-nucleotide exchange factor activity(GO:0005086) |
| 0.0 | 0.1 | GO:0070138 | ubiquitin-like protein-specific isopeptidase activity(GO:0070138) SUMO-specific isopeptidase activity(GO:0070140) |
| 0.0 | 0.3 | GO:0019239 | deaminase activity(GO:0019239) |
| 0.0 | 0.0 | GO:0050577 | GDP-L-fucose synthase activity(GO:0050577) |
| 0.0 | 0.2 | GO:0022839 | calcium activated cation channel activity(GO:0005227) ion gated channel activity(GO:0022839) |
Gene overrepresentation in curated gene sets: canonical pathways category:
| Log-likelihood per target | Total log-likelihood | Term | Description |
|---|---|---|---|
| 0.1 | 0.5 | PID HES HEY PATHWAY | Notch-mediated HES/HEY network |
Gene overrepresentation in curated gene sets: REACTOME pathways category:
| Log-likelihood per target | Total log-likelihood | Term | Description |
|---|---|---|---|
| 0.2 | 0.5 | REACTOME INTEGRATION OF ENERGY METABOLISM | Genes involved in Integration of energy metabolism |