Project
GSE43616: Time-course of wild-type Arabidopsis leaf
Navigation
Downloads
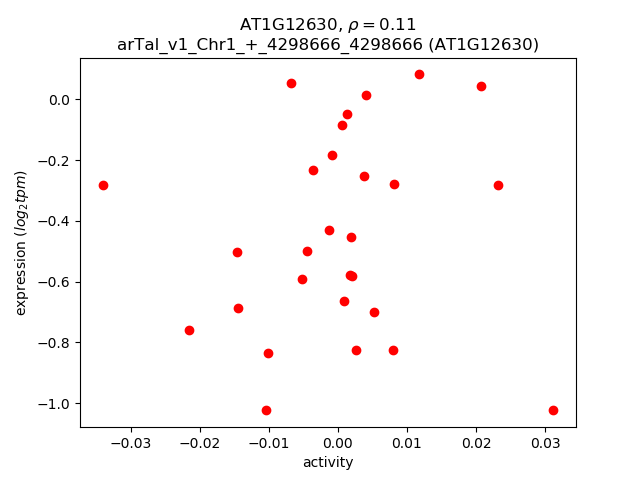
Results for AT1G12630
Z-value: 0.78
Transcription factors associated with AT1G12630
| Gene Symbol | Gene ID | Gene Info |
|---|---|---|
|
AT1G12630
|
AT1G12630 | Integrase-type DNA-binding superfamily protein |
Activity-expression correlation:
| Gene | Promoter | Pearson corr. coef. | P-value | Plot |
|---|---|---|---|---|
| AT1G12630 | arTal_v1_Chr1_+_4298666_4298666 | 0.11 | 5.8e-01 | Click! |
Activity profile of AT1G12630 motif
Sorted Z-values of AT1G12630 motif
| Promoter | Log-likelihood | Transcript | Gene | Gene Info |
|---|---|---|---|---|
| arTal_v1_Chr3_+_15983199_15983199 | 4.24 |
AT3G44300.1
|
NIT2
|
nitrilase 2 |
| arTal_v1_Chr2_+_10906460_10906460 | 3.91 |
AT2G25625.2
|
AT2G25625
|
histone deacetylase-like protein |
| arTal_v1_Chr3_+_18873911_18873911 | 3.82 |
AT3G50770.1
|
CML41
|
calmodulin-like 41 |
| arTal_v1_Chr3_-_6258426_6258426 | 3.78 |
AT3G18250.1
|
AT3G18250
|
Putative membrane lipoprotein |
| arTal_v1_Chr2_+_10906215_10906215 | 3.76 |
AT2G25625.1
|
AT2G25625
|
histone deacetylase-like protein |
| arTal_v1_Chr3_+_5234457_5234457 | 3.59 |
AT3G15500.1
|
NAC3
|
NAC domain containing protein 3 |
| arTal_v1_Chr3_-_20769324_20769410 | 3.50 |
AT3G55970.2
AT3G55970.1 |
JRG21
|
jasmonate-regulated gene 21 |
| arTal_v1_Chr2_-_18781973_18781973 | 3.38 |
AT2G45570.1
|
CYP76C2
|
cytochrome P450, family 76, subfamily C, polypeptide 2 |
| arTal_v1_Chr3_-_162905_162905 | 3.26 |
AT3G01420.1
|
DOX1
|
Peroxidase superfamily protein |
| arTal_v1_Chr1_-_17076417_17076417 | 3.17 |
AT1G45145.1
|
TRX5
|
thioredoxin H-type 5 |
| arTal_v1_Chr3_-_2699257_2699257 | 3.08 |
AT3G08860.2
|
PYD4
|
PYRIMIDINE 4 |
| arTal_v1_Chr4_-_12018492_12018492 | 3.06 |
AT4G22920.1
|
NYE1
|
non-yellowing 1 |
| arTal_v1_Chr4_-_12018643_12018643 | 3.05 |
AT4G22920.2
|
NYE1
|
non-yellowing 1 |
| arTal_v1_Chr4_+_8392825_8392825 | 3.02 |
AT4G14630.1
|
GLP9
|
germin-like protein 9 |
| arTal_v1_Chr3_-_327412_327412 | 2.99 |
AT3G01970.1
|
WRKY45
|
WRKY DNA-binding protein 45 |
| arTal_v1_Chr3_-_2699420_2699420 | 2.99 |
AT3G08860.1
|
PYD4
|
PYRIMIDINE 4 |
| arTal_v1_Chr5_+_3239617_3239617 | 2.97 |
AT5G10300.2
|
MES5
|
methyl esterase 5 |
| arTal_v1_Chr5_+_5995479_5995479 | 2.93 |
AT5G18130.2
|
AT5G18130
|
transmembrane protein |
| arTal_v1_Chr5_+_5995323_5995323 | 2.92 |
AT5G18130.1
|
AT5G18130
|
transmembrane protein |
| arTal_v1_Chr5_+_3239455_3239455 | 2.91 |
AT5G10300.1
|
MES5
|
methyl esterase 5 |
| arTal_v1_Chr3_-_7999552_7999552 | 2.91 |
AT3G22560.1
|
AT3G22560
|
Acyl-CoA N-acyltransferases (NAT) superfamily protein |
| arTal_v1_Chr5_-_5033540_5033540 | 2.89 |
AT5G15500.2
AT5G15500.1 |
AT5G15500
|
Ankyrin repeat family protein |
| arTal_v1_Chr4_+_17597110_17597110 | 2.86 |
AT4G37430.1
|
CYP91A2
|
cytochrome P450, family 91, subfamily A, polypeptide 2 |
| arTal_v1_Chr3_-_7576623_7576721 | 2.82 |
AT3G21500.1
AT3G21500.3 AT3G21500.2 |
DXPS1
|
1-deoxy-D-xylulose 5-phosphate synthase 1 |
| arTal_v1_Chr3_-_1055196_1055196 | 2.81 |
AT3G04060.1
|
NAC046
|
NAC domain containing protein 46 |
| arTal_v1_Chr5_-_9247540_9247540 | 2.81 |
AT5G26340.1
|
MSS1
|
Major facilitator superfamily protein |
| arTal_v1_Chr1_+_10892445_10892445 | 2.79 |
AT1G30700.1
|
AT1G30700
|
FAD-binding Berberine family protein |
| arTal_v1_Chr5_-_23673287_23673287 | 2.79 |
AT5G58570.1
|
AT5G58570
|
transmembrane protein |
| arTal_v1_Chr5_+_2204206_2204248 | 2.79 |
AT5G07100.5
AT5G07100.3 AT5G07100.4 AT5G07100.2 AT5G07100.1 |
WRKY26
|
WRKY DNA-binding protein 26 |
| arTal_v1_Chr1_-_460696_460831 | 2.73 |
AT1G02310.1
AT1G02310.2 |
MAN1
|
Glycosyl hydrolase superfamily protein |
| arTal_v1_Chr2_-_11295918_11295918 | 2.69 |
AT2G26560.1
|
PLA2A
|
phospholipase A 2A |
| arTal_v1_Chr4_+_9407611_9407611 | 2.68 |
AT4G16740.4
AT4G16740.3 AT4G16740.1 |
TPS03
|
terpene synthase 03 |
| arTal_v1_Chr5_-_216773_216773 | 2.67 |
AT5G01550.1
|
LECRKA4.2
|
lectin receptor kinase a4.1 |
| arTal_v1_Chr5_-_23896702_23896702 | 2.66 |
AT5G59220.2
|
HAI1
|
PP2C protein (Clade A protein phosphatases type 2C) |
| arTal_v1_Chr5_-_2176446_2176446 | 2.64 |
AT5G07010.1
|
ST2A
|
sulfotransferase 2A |
| arTal_v1_Chr5_-_8659352_8659352 | 2.63 |
AT5G25110.1
|
CIPK25
|
CBL-interacting protein kinase 25 |
| arTal_v1_Chr4_-_9368852_9368852 | 2.61 |
AT4G16640.1
|
AT4G16640
|
Matrixin family protein |
| arTal_v1_Chr3_-_23150606_23150606 | 2.61 |
AT3G62590.1
|
AT3G62590
|
alpha/beta-Hydrolases superfamily protein |
| arTal_v1_Chr4_+_7304323_7304323 | 2.61 |
AT4G12290.2
|
AT4G12290
|
Copper amine oxidase family protein |
| arTal_v1_Chr5_-_23896939_23896939 | 2.60 |
AT5G59220.1
|
HAI1
|
PP2C protein (Clade A protein phosphatases type 2C) |
| arTal_v1_Chr4_+_7303985_7303985 | 2.58 |
AT4G12290.1
|
AT4G12290
|
Copper amine oxidase family protein |
| arTal_v1_Chr5_+_15501126_15501184 | 2.58 |
AT5G38710.1
AT5G38710.2 |
AT5G38710
|
Methylenetetrahydrofolate reductase family protein |
| arTal_v1_Chr2_-_19291632_19291632 | 2.56 |
AT2G46950.2
AT2G46950.1 |
CYP709B2
|
cytochrome P450, family 709, subfamily B, polypeptide 2 |
| arTal_v1_Chr3_+_19086344_19086452 | 2.55 |
AT3G51430.1
AT3G51430.2 |
YLS2
|
Calcium-dependent phosphotriesterase superfamily protein |
| arTal_v1_Chr3_+_9892791_9892791 | 2.55 |
AT3G26840.1
|
PES2
|
Esterase/lipase/thioesterase family protein |
| arTal_v1_Chr1_+_21652988_21652988 | 2.54 |
AT1G58340.1
|
ZF14
|
MATE efflux family protein |
| arTal_v1_Chr4_-_15903523_15903523 | 2.52 |
AT4G32940.1
|
GAMMA-VPE
|
gamma vacuolar processing enzyme |
| arTal_v1_Chr3_-_7818985_7818985 | 2.52 |
AT3G22160.1
|
AT3G22160
|
VQ motif-containing protein |
| arTal_v1_Chr4_-_15991536_15991633 | 2.52 |
AT4G33150.1
AT4G33150.2 |
AT4G33150
|
lysine-ketoglutarate reductase/saccharopine dehydrogenase bifunctional enzyme |
| arTal_v1_Chr2_+_17251819_17251819 | 2.51 |
AT2G41380.1
|
AT2G41380
|
S-adenosyl-L-methionine-dependent methyltransferases superfamily protein |
| arTal_v1_Chr4_+_13653579_13653579 | 2.50 |
AT4G27260.1
|
WES1
|
Auxin-responsive GH3 family protein |
| arTal_v1_Chr2_+_18558885_18558938 | 2.50 |
AT2G44990.2
AT2G44990.3 AT2G44990.1 |
CCD7
|
carotenoid cleavage dioxygenase 7 |
| arTal_v1_Chr2_-_18646606_18646606 | 2.48 |
AT2G45220.1
|
AT2G45220
|
Plant invertase/pectin methylesterase inhibitor superfamily |
| arTal_v1_Chr2_-_14541617_14541617 | 2.47 |
AT2G34500.1
|
CYP710A1
|
cytochrome P450, family 710, subfamily A, polypeptide 1 |
| arTal_v1_Chr5_+_19616066_19616066 | 2.46 |
AT5G48400.1
AT5G48400.2 |
ATGLR1.2
|
Glutamate receptor family protein |
| arTal_v1_Chr1_+_5389952_5389952 | 2.46 |
AT1G15670.1
|
AT1G15670
|
Galactose oxidase/kelch repeat superfamily protein |
| arTal_v1_Chr3_+_995217_995217 | 2.45 |
AT3G03870.1
|
AT3G03870
|
transmembrane protein |
| arTal_v1_Chr3_+_995062_995062 | 2.45 |
AT3G03870.2
|
AT3G03870
|
transmembrane protein |
| arTal_v1_Chr3_-_3993886_3993886 | 2.44 |
AT3G12580.1
|
HSP70
|
heat shock protein 70 |
| arTal_v1_Chr5_+_20764096_20764096 | 2.42 |
AT5G51070.1
|
ERD1
|
Clp ATPase |
| arTal_v1_Chr3_-_4657723_4657723 | 2.42 |
AT3G14060.1
|
AT3G14060
|
hypothetical protein |
| arTal_v1_Chr4_+_5244865_5244865 | 2.42 |
AT4G08300.1
|
UMAMIT17
|
nodulin MtN21 /EamA-like transporter family protein |
| arTal_v1_Chr3_+_4603885_4603885 | 2.42 |
AT3G13950.1
|
AT3G13950
|
ankyrin |
| arTal_v1_Chr5_-_3405571_3405571 | 2.41 |
AT5G10770.1
|
AT5G10770
|
Eukaryotic aspartyl protease family protein |
| arTal_v1_Chr4_-_7026224_7026224 | 2.40 |
AT4G11650.1
|
OSM34
|
osmotin 34 |
| arTal_v1_Chr3_-_4269691_4269691 | 2.39 |
AT3G13229.1
|
AT3G13229
|
kinesin-like protein (DUF868) |
| arTal_v1_Chr4_+_10974456_10974510 | 2.37 |
AT4G20320.2
AT4G20320.4 AT4G20320.3 AT4G20320.1 AT4G20320.5 AT4G20320.6 |
AT4G20320
|
CTP synthase family protein |
| arTal_v1_Chr5_+_25550937_25550937 | 2.36 |
AT5G63850.1
|
AAP4
|
amino acid permease 4 |
| arTal_v1_Chr2_-_11980003_11980003 | 2.35 |
AT2G28110.1
|
FRA8
|
Exostosin family protein |
| arTal_v1_Chr4_-_8870801_8870979 | 2.35 |
AT4G15530.7
AT4G15530.6 AT4G15530.5 AT4G15530.3 AT4G15530.4 AT4G15530.1 |
PPDK
|
pyruvate orthophosphate dikinase |
| arTal_v1_Chr1_-_28318362_28318375 | 2.35 |
AT1G75450.1
AT1G75450.2 |
CKX5
|
cytokinin oxidase 5 |
| arTal_v1_Chr1_+_3945584_3945584 | 2.34 |
AT1G11700.1
|
AT1G11700
|
senescence regulator (Protein of unknown function, DUF584) |
| arTal_v1_Chr5_+_206432_206432 | 2.34 |
AT5G01520.2
AT5G01520.1 |
AIRP2
|
RING/U-box superfamily protein |
| arTal_v1_Chr2_+_12871984_12872134 | 2.34 |
AT2G30140.1
AT2G30140.2 |
UGT87A2
|
UDP-Glycosyltransferase superfamily protein |
| arTal_v1_Chr1_+_27132014_27132014 | 2.33 |
AT1G72120.1
|
AT1G72120
|
Major facilitator superfamily protein |
| arTal_v1_Chr4_+_10398857_10398857 | 2.32 |
AT4G18980.1
|
AtS40-3
|
AtS40-3 |
| arTal_v1_Chr1_-_2282828_2282828 | 2.32 |
AT1G07430.1
|
HAI2
|
highly ABA-induced PP2C protein 2 |
| arTal_v1_Chr2_+_14783254_14783254 | 2.31 |
AT2G35070.1
AT2G35070.2 |
AT2G35070
|
transmembrane protein |
| arTal_v1_Chr1_-_29622445_29622447 | 2.31 |
AT1G78780.1
AT1G78780.2 AT1G78780.4 |
AT1G78780
|
pathogenesis-related family protein |
| arTal_v1_Chr4_+_5238773_5238917 | 2.30 |
AT4G08290.1
AT4G08290.2 |
UMAMIT20
|
nodulin MtN21 /EamA-like transporter family protein |
| arTal_v1_Chr3_+_23289243_23289243 | 2.29 |
AT3G63010.1
|
GID1B
|
alpha/beta-Hydrolases superfamily protein |
| arTal_v1_Chr1_-_3756998_3756998 | 2.28 |
AT1G11210.1
|
AT1G11210
|
cotton fiber protein, putative (DUF761) |
| arTal_v1_Chr3_+_1635194_1635194 | 2.28 |
AT3G05630.1
|
PLDP2
|
phospholipase D P2 |
| arTal_v1_Chr1_+_5869543_5869543 | 2.28 |
AT1G17170.1
|
GSTU24
|
glutathione S-transferase TAU 24 |
| arTal_v1_Chr2_-_17806073_17806073 | 2.28 |
AT2G42790.1
|
CSY3
|
citrate synthase 3 |
| arTal_v1_Chr1_+_23168767_23168767 | 2.27 |
AT1G62570.1
|
FMO GS-OX4
|
flavin-monooxygenase glucosinolate S-oxygenase 4 |
| arTal_v1_Chr3_-_6788424_6788424 | 2.25 |
AT3G19550.1
|
AT3G19550
|
glutamate racemase |
| arTal_v1_Chr4_-_17494279_17494279 | 2.25 |
AT4G37150.1
|
MES9
|
methyl esterase 9 |
| arTal_v1_Chr1_+_1469541_1469541 | 2.24 |
AT1G05100.1
|
MAPKKK18
|
mitogen-activated protein kinase kinase kinase 18 |
| arTal_v1_Chr1_-_23690807_23690807 | 2.24 |
AT1G63840.1
|
AT1G63840
|
RING/U-box superfamily protein |
| arTal_v1_Chr4_-_15988441_15988441 | 2.23 |
AT4G33150.3
|
AT4G33150
|
lysine-ketoglutarate reductase/saccharopine dehydrogenase bifunctional enzyme |
| arTal_v1_Chr4_-_14820595_14820595 | 2.22 |
AT4G30270.1
|
XTH24
|
xyloglucan endotransglucosylase/hydrolase 24 |
| arTal_v1_Chr5_-_6042938_6043014 | 2.22 |
AT5G18270.2
AT5G18270.1 |
ANAC087
|
NAC domain containing protein 87 |
| arTal_v1_Chr1_-_27755297_27755297 | 2.21 |
AT1G73810.1
|
AT1G73810
|
Core-2/I-branching beta-1,6-N-acetylglucosaminyltransferase family protein |
| arTal_v1_Chr3_+_22552560_22552560 | 2.21 |
AT3G60966.1
|
AT3G60966
|
RING/U-box superfamily protein |
| arTal_v1_Chr2_+_8998450_8998450 | 2.21 |
AT2G20920.1
|
AT2G20920
|
chaperone (DUF3353) |
| arTal_v1_Chr1_-_5133860_5133860 | 2.21 |
AT1G14880.1
|
PCR1
|
PLANT CADMIUM RESISTANCE 1 |
| arTal_v1_Chr1_+_25473544_25473544 | 2.21 |
AT1G67920.1
|
AT1G67920
|
hypothetical protein |
| arTal_v1_Chr3_-_4474364_4474378 | 2.20 |
AT3G13672.2
AT3G13672.1 |
AT3G13672
|
TRAF-like superfamily protein |
| arTal_v1_Chr1_-_11719988_11719988 | 2.20 |
AT1G32450.1
|
NRT1.5
|
nitrate transporter 1.5 |
| arTal_v1_Chr4_-_15991202_15991202 | 2.19 |
AT4G33150.4
|
AT4G33150
|
lysine-ketoglutarate reductase/saccharopine dehydrogenase bifunctional enzyme |
| arTal_v1_Chr3_+_6093990_6093990 | 2.19 |
AT3G17810.1
|
PYD1
|
pyrimidine 1 |
| arTal_v1_Chr3_-_19577141_19577141 | 2.18 |
AT3G52820.1
|
PAP22
|
purple acid phosphatase 22 |
| arTal_v1_Chr5_-_14256284_14256284 | 2.17 |
AT5G36220.2
AT5G36220.1 |
CYP81D1
|
cytochrome p450 81d1 |
| arTal_v1_Chr2_+_14685170_14685170 | 2.17 |
AT2G34810.1
|
AT2G34810
|
FAD-binding Berberine family protein |
| arTal_v1_Chr2_+_8097420_8097420 | 2.16 |
AT2G18690.2
AT2G18690.1 |
AT2G18690
|
transmembrane protein |
| arTal_v1_Chr3_+_3249513_3249526 | 2.16 |
AT3G10450.3
AT3G10450.2 AT3G10450.1 AT3G10450.4 |
SCPL7
|
serine carboxypeptidase-like 7 |
| arTal_v1_Chr3_+_18634546_18634546 | 2.15 |
AT3G50260.1
|
CEJ1
|
cooperatively regulated by ethylene and jasmonate 1 |
| arTal_v1_Chr2_-_275002_275002 | 2.15 |
AT2G01610.1
|
AT2G01610
|
Plant invertase/pectin methylesterase inhibitor superfamily protein |
| arTal_v1_Chr2_+_16303295_16303295 | 2.15 |
AT2G39050.1
|
EULS3
|
hydroxyproline-rich glycoprotein family protein |
| arTal_v1_Chr5_-_5904380_5904380 | 2.14 |
AT5G17860.2
|
CAX7
|
calcium exchanger 7 |
| arTal_v1_Chr1_-_25445357_25445357 | 2.13 |
AT1G67860.1
|
AT1G67860
|
transmembrane protein |
| arTal_v1_Chr4_+_11655562_11655613 | 2.13 |
AT4G21980.1
AT4G21980.2 |
APG8A
|
Ubiquitin-like superfamily protein |
| arTal_v1_Chr5_+_2938193_2938193 | 2.13 |
AT5G09440.1
|
EXL4
|
EXORDIUM like 4 |
| arTal_v1_Chr1_+_9378404_9378404 | 2.12 |
AT1G27020.1
|
AT1G27020
|
plant/protein |
| arTal_v1_Chr5_+_19381519_19381519 | 2.11 |
AT5G47860.1
|
AT5G47860
|
Gut esterase (DUF1350) |
| arTal_v1_Chr3_+_18940643_18940643 | 2.11 |
AT3G50970.1
|
LTI30
|
dehydrin family protein |
| arTal_v1_Chr5_-_5904532_5904532 | 2.11 |
AT5G17860.1
|
CAX7
|
calcium exchanger 7 |
| arTal_v1_Chr5_+_7138762_7138762 | 2.11 |
AT5G21020.2
|
AT5G21020
|
transmembrane protein |
| arTal_v1_Chr4_-_8869319_8869319 | 2.10 |
AT4G15530.2
|
PPDK
|
pyruvate orthophosphate dikinase |
| arTal_v1_Chr1_-_4621585_4621585 | 2.10 |
AT1G13470.1
|
AT1G13470
|
hypothetical protein (DUF1262) |
| arTal_v1_Chr1_-_2163387_2163387 | 2.09 |
AT1G07040.1
|
AT1G07040
|
plant/protein |
| arTal_v1_Chr4_+_7239200_7239200 | 2.09 |
AT4G12080.1
|
AHL1
|
AT-hook motif nuclear-localized protein 1 |
| arTal_v1_Chr3_-_1956397_1956397 | 2.08 |
AT3G06420.1
|
ATG8H
|
Ubiquitin-like superfamily protein |
| arTal_v1_Chr1_-_27837443_27837443 | 2.07 |
AT1G74020.1
|
SS2
|
strictosidine synthase 2 |
| arTal_v1_Chr3_+_9496102_9496102 | 2.05 |
AT3G25950.1
|
AT3G25950
|
TRAM, LAG1 and CLN8 (TLC) lipid-sensing domain containing protein |
| arTal_v1_Chr3_+_5243432_5243432 | 2.05 |
AT3G15510.1
|
NAC2
|
NAC domain containing protein 2 |
| arTal_v1_Chr2_+_18577500_18577500 | 2.05 |
AT2G45040.1
|
AT2G45040
|
Matrixin family protein |
| arTal_v1_Chr3_-_7676519_7676519 | 2.05 |
AT3G21780.1
|
UGT71B6
|
UDP-glucosyl transferase 71B6 |
| arTal_v1_Chr3_-_19165322_19165322 | 2.04 |
AT3G51660.1
|
AT3G51660
|
Tautomerase/MIF superfamily protein |
| arTal_v1_Chr2_-_8471644_8471644 | 2.04 |
AT2G19570.1
|
CDA1
|
cytidine deaminase 1 |
| arTal_v1_Chr1_-_977761_977911 | 2.02 |
AT1G03850.1
AT1G03850.2 AT1G03850.3 |
GRXS13
|
Glutaredoxin family protein |
| arTal_v1_Chr4_-_12242706_12242736 | 2.02 |
AT4G23450.4
AT4G23450.6 AT4G23450.2 AT4G23450.5 AT4G23450.3 AT4G23450.1 |
AIRP1
|
RING/U-box superfamily protein |
| arTal_v1_Chr5_-_3402389_3402389 | 2.02 |
AT5G10760.1
|
AT5G10760
|
Eukaryotic aspartyl protease family protein |
| arTal_v1_Chr4_+_9171280_9171280 | 2.02 |
AT4G16190.1
|
AT4G16190
|
Papain family cysteine protease |
| arTal_v1_Chr5_+_7718118_7718118 | 2.01 |
AT5G23020.1
|
IMS2
|
2-isopropylmalate synthase 2 |
| arTal_v1_Chr4_+_994726_994726 | 2.00 |
AT4G02280.1
|
SUS3
|
sucrose synthase 3 |
| arTal_v1_Chr5_-_25168060_25168060 | 2.00 |
AT5G62680.1
|
GTR2
|
Major facilitator superfamily protein |
| arTal_v1_Chr5_+_25692425_25692425 | 2.00 |
AT5G64230.1
|
AT5G64230
|
1,8-cineole synthase |
| arTal_v1_Chr2_-_14863412_14863412 | 2.00 |
AT2G35300.1
|
LEA18
|
Late embryogenesis abundant protein, group 1 protein |
| arTal_v1_Chr3_+_815550_815550 | 1.99 |
AT3G03440.1
|
AT3G03440
|
ARM repeat superfamily protein |
| arTal_v1_Chr4_+_9407768_9407768 | 1.99 |
AT4G16740.2
|
TPS03
|
terpene synthase 03 |
| arTal_v1_Chr1_-_612324_612324 | 1.98 |
AT1G02790.1
|
PGA4
|
polygalacturonase 4 |
| arTal_v1_Chr2_-_8447355_8447355 | 1.98 |
AT2G19500.1
|
CKX2
|
cytokinin oxidase 2 |
| arTal_v1_Chr1_+_8720309_8720309 | 1.97 |
AT1G24600.1
|
AT1G24600
|
hypothetical protein |
| arTal_v1_Chr1_+_2867203_2867271 | 1.97 |
AT1G08920.1
AT1G08920.2 AT1G08920.3 |
ESL1
|
ERD (early response to dehydration) six-like 1 |
| arTal_v1_Chr1_+_202103_202136 | 1.97 |
AT1G01560.3
AT1G01560.2 AT1G01560.1 AT1G01560.4 |
MPK11
|
MAP kinase 11 |
| arTal_v1_Chr3_+_18919327_18919327 | 1.97 |
AT3G50910.1
|
AT3G50910
|
netrin receptor DCC |
| arTal_v1_Chr1_-_27834207_27834207 | 1.95 |
AT1G74010.1
|
AT1G74010
|
Calcium-dependent phosphotriesterase superfamily protein |
| arTal_v1_Chr1_-_7534927_7534927 | 1.95 |
AT1G21520.1
|
AT1G21520
|
hypothetical protein |
| arTal_v1_Chr5_-_315405_315405 | 1.94 |
AT5G01820.1
|
SR1
|
serine/threonine protein kinase 1 |
| arTal_v1_Chr3_+_16466144_16466144 | 1.94 |
AT3G45010.1
|
scpl48
|
serine carboxypeptidase-like 48 |
| arTal_v1_Chr5_-_18611166_18611166 | 1.93 |
AT5G45880.1
|
AT5G45880
|
Pollen Ole e 1 allergen and extensin family protein |
| arTal_v1_Chr5_-_2079005_2079005 | 1.93 |
AT5G06720.1
|
PA2
|
peroxidase 2 |
| arTal_v1_Chr4_+_7148124_7148386 | 1.93 |
AT4G11890.3
AT4G11890.1 AT4G11890.4 |
ARCK1
|
Protein kinase superfamily protein |
| arTal_v1_Chr3_-_21293158_21293171 | 1.92 |
AT3G57520.2
AT3G57520.3 AT3G57520.1 |
SIP2
|
seed imbibition 2 |
| arTal_v1_Chr4_+_585598_585610 | 1.92 |
AT4G01430.1
AT4G01430.2 AT4G01430.3 |
UMAMIT29
|
nodulin MtN21 /EamA-like transporter family protein |
| arTal_v1_Chr5_+_8082650_8082744 | 1.91 |
AT5G23950.2
AT5G23950.1 |
AT5G23950
|
Calcium-dependent lipid-binding (CaLB domain) family protein |
| arTal_v1_Chr1_-_17266724_17266824 | 1.91 |
AT1G46768.3
AT1G46768.2 AT1G46768.1 |
RAP2.1
|
related to AP2 1 |
| arTal_v1_Chr1_+_26038905_26038905 | 1.90 |
AT1G69260.1
|
AFP1
|
ABI five binding protein |
| arTal_v1_Chr3_-_22945288_22945329 | 1.90 |
AT3G61960.2
AT3G61960.1 |
AT3G61960
|
Protein kinase superfamily protein |
| arTal_v1_Chr3_+_25355_25507 | 1.90 |
AT3G01080.2
AT3G01080.3 AT3G01080.1 |
WRKY58
|
WRKY DNA-binding protein 58 |
| arTal_v1_Chr1_+_6100964_6101015 | 1.90 |
AT1G17745.1
AT1G17745.2 |
PGDH
|
D-3-phosphoglycerate dehydrogenase |
| arTal_v1_Chr1_-_5645443_5645443 | 1.89 |
AT1G16510.1
|
AT1G16510
|
SAUR-like auxin-responsive protein family |
| arTal_v1_Chr5_-_5759817_5759817 | 1.88 |
AT5G17460.3
AT5G17460.2 AT5G17460.1 |
AT5G17460
|
glutamyl-tRNA (Gln) amidotransferase subunit C |
| arTal_v1_Chr3_+_20736508_20736512 | 1.88 |
AT3G55880.1
AT3G55880.3 AT3G55880.2 AT3G55880.4 |
SUE4
|
Alpha/beta hydrolase related protein |
| arTal_v1_Chr1_-_24362054_24362054 | 1.87 |
AT1G65520.1
|
ECI1
|
delta(3), delta(2)-enoyl CoA isomerase 1 |
| arTal_v1_Chr4_-_8123835_8123835 | 1.87 |
AT4G14090.1
|
AT4G14090
|
UDP-Glycosyltransferase superfamily protein |
| arTal_v1_Chr3_+_23377976_23377979 | 1.86 |
AT3G63280.1
AT3G63280.3 |
NEK4
|
NIMA-related kinase 4 |
| arTal_v1_Chr1_+_22198266_22198266 | 1.86 |
AT1G60190.1
|
PUB19
|
ARM repeat superfamily protein |
| arTal_v1_Chr2_-_13613573_13613728 | 1.85 |
AT2G31990.1
AT2G31990.3 AT2G31990.2 |
AT2G31990
|
Exostosin family protein |
| arTal_v1_Chr1_-_8967562_8967562 | 1.85 |
AT1G25530.1
|
AT1G25530
|
Transmembrane amino acid transporter family protein |
| arTal_v1_Chr2_-_17882636_17882636 | 1.85 |
AT2G43000.1
AT2G43000.2 |
NAC042
|
NAC domain containing protein 42 |
| arTal_v1_Chr1_-_25446952_25446952 | 1.85 |
AT1G67865.1
|
AT1G67865
|
hypothetical protein |
| arTal_v1_Chr1_-_25447622_25447622 | 1.84 |
AT1G67865.2
|
AT1G67865
|
hypothetical protein |
| arTal_v1_Chr2_-_19330197_19330197 | 1.83 |
AT2G47040.1
|
VGD1
|
Plant invertase/pectin methylesterase inhibitor superfamily |
| arTal_v1_Chr1_-_20849054_20849054 | 1.83 |
AT1G55760.1
|
AT1G55760
|
BTB/POZ domain-containing protein |
| arTal_v1_Chr5_-_10213598_10213598 | 1.83 |
AT5G28237.1
AT5G28237.2 |
AT5G28237
|
Pyridoxal-5'-phosphate-dependent enzyme family protein |
| arTal_v1_Chr3_-_20361560_20361560 | 1.83 |
AT3G54950.1
|
pPLAIIIbeta
|
patatin-like protein 6 |
| arTal_v1_Chr5_-_25764420_25764420 | 1.82 |
AT5G64430.1
|
AT5G64430
|
Octicosapeptide/Phox/Bem1p family protein |
| arTal_v1_Chr3_+_20564236_20564236 | 1.82 |
AT3G55470.1
|
AT3G55470
|
Calcium-dependent lipid-binding (CaLB domain) family protein |
| arTal_v1_Chr1_-_23460884_23460884 | 1.81 |
AT1G63245.1
|
CLE14
|
CLAVATA3/ESR-RELATED 14 |
| arTal_v1_Chr5_+_16297465_16297597 | 1.81 |
AT5G40720.1
AT5G40720.3 |
AT5G40720
|
C3H4 type zinc finger protein (DUF23) |
| arTal_v1_Chr5_+_1153740_1153740 | 1.81 |
AT5G04200.1
|
MC9
|
metacaspase 9 |
| arTal_v1_Chr3_+_5471735_5471735 | 1.80 |
AT3G16150.1
|
ASPGB1
|
N-terminal nucleophile aminohydrolases (Ntn hydrolases) superfamily protein |
| arTal_v1_Chr3_+_20564081_20564081 | 1.79 |
AT3G55470.2
|
AT3G55470
|
Calcium-dependent lipid-binding (CaLB domain) family protein |
| arTal_v1_Chr3_-_6676520_6676521 | 1.79 |
AT3G19270.1
AT3G19270.2 |
CYP707A4
|
cytochrome P450, family 707, subfamily A, polypeptide 4 |
| arTal_v1_Chr3_-_18373147_18373147 | 1.79 |
AT3G49570.1
|
LSU3
|
response to low sulfur 3 |
| arTal_v1_Chr2_+_16298110_16298110 | 1.78 |
AT2G39030.1
|
NATA1
|
Acyl-CoA N-acyltransferases (NAT) superfamily protein |
| arTal_v1_Chr1_-_19993334_19993458 | 1.78 |
AT1G53580.2
AT1G53580.1 |
GLY3
|
glyoxalase II 3 |
| arTal_v1_Chr5_+_2866222_2866222 | 1.78 |
AT5G09220.1
|
AAP2
|
amino acid permease 2 |
| arTal_v1_Chr5_+_6826365_6826365 | 1.78 |
AT5G20230.1
|
BCB
|
blue-copper-binding protein |
| arTal_v1_Chr2_-_9858778_9858778 | 1.77 |
AT2G23150.1
|
NRAMP3
|
natural resistance-associated macrophage protein 3 |
| arTal_v1_Chr5_-_5862462_5862475 | 1.77 |
AT5G17760.2
AT5G17760.1 |
AT5G17760
|
P-loop containing nucleoside triphosphate hydrolases superfamily protein |
| arTal_v1_Chr1_-_4305907_4305907 | 1.77 |
AT1G12640.1
|
LPLAT1
|
MBOAT (membrane bound O-acyl transferase) family protein |
| arTal_v1_Chr3_+_4889063_4889063 | 1.77 |
AT3G14560.1
|
AT3G14560
|
hypothetical protein |
| arTal_v1_Chr3_-_10047453_10047453 | 1.77 |
AT3G27210.1
|
AT3G27210
|
hypothetical protein |
| arTal_v1_Chr2_+_13658888_13659004 | 1.76 |
AT2G32150.1
AT2G32150.2 AT2G32150.3 |
AT2G32150
|
Haloacid dehalogenase-like hydrolase (HAD) superfamily protein |
| arTal_v1_Chr4_-_13222376_13222376 | 1.75 |
AT4G26080.1
|
ABI1
|
Protein phosphatase 2C family protein |
| arTal_v1_Chr1_+_30135024_30135024 | 1.75 |
AT1G80110.1
|
PP2-B11
|
phloem protein 2-B11 |
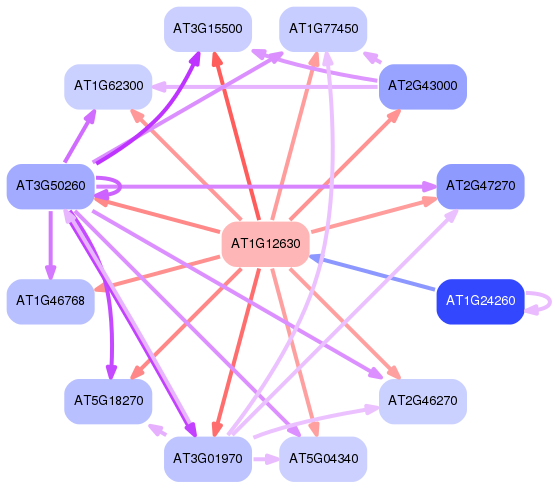
Network of associatons between targets according to the STRING database.

First level regulatory network of AT1G12630
Gene Ontology Analysis
Gene overrepresentation in biological process category:
| Log-likelihood per target | Total log-likelihood | Term | Description |
|---|---|---|---|
| 1.6 | 4.7 | GO:0016046 | detection of fungus(GO:0016046) |
| 1.5 | 5.9 | GO:0016139 | glycoside catabolic process(GO:0016139) |
| 1.3 | 3.8 | GO:0016107 | sesquiterpenoid catabolic process(GO:0016107) apocarotenoid catabolic process(GO:0043290) abscisic acid catabolic process(GO:0046345) |
| 1.2 | 4.8 | GO:0048838 | release of seed from dormancy(GO:0048838) exit from dormancy(GO:0097438) |
| 1.1 | 1.1 | GO:0034486 | vacuolar transmembrane transport(GO:0034486) |
| 0.9 | 1.9 | GO:0009970 | cellular response to sulfate starvation(GO:0009970) |
| 0.9 | 4.5 | GO:0051091 | positive regulation of sequence-specific DNA binding transcription factor activity(GO:0051091) |
| 0.9 | 2.6 | GO:0010446 | response to alkaline pH(GO:0010446) |
| 0.8 | 2.5 | GO:0016540 | protein autoprocessing(GO:0016540) |
| 0.8 | 2.5 | GO:0016118 | tetraterpenoid catabolic process(GO:0016110) carotenoid catabolic process(GO:0016118) xanthophyll catabolic process(GO:0016124) |
| 0.8 | 2.4 | GO:0015802 | basic amino acid transport(GO:0015802) |
| 0.7 | 2.2 | GO:0006210 | thymine catabolic process(GO:0006210) uracil catabolic process(GO:0006212) beta-alanine biosynthetic process(GO:0019483) thymine metabolic process(GO:0019859) |
| 0.7 | 4.2 | GO:0006624 | vacuolar protein processing(GO:0006624) |
| 0.7 | 2.0 | GO:0032963 | collagen metabolic process(GO:0032963) multicellular organism metabolic process(GO:0044236) multicellular organismal macromolecule metabolic process(GO:0044259) |
| 0.7 | 1.3 | GO:0046218 | tryptophan catabolic process(GO:0006569) indolalkylamine catabolic process(GO:0046218) |
| 0.6 | 1.9 | GO:0002215 | defense response to nematode(GO:0002215) |
| 0.6 | 3.8 | GO:0071732 | cellular response to nitric oxide(GO:0071732) |
| 0.6 | 1.9 | GO:0033530 | raffinose metabolic process(GO:0033530) |
| 0.6 | 2.5 | GO:0033306 | phytol metabolic process(GO:0033306) |
| 0.6 | 5.7 | GO:0010188 | response to microbial phytotoxin(GO:0010188) |
| 0.6 | 2.5 | GO:1900378 | positive regulation of secondary metabolite biosynthetic process(GO:1900378) |
| 0.6 | 1.8 | GO:1902347 | response to strigolactone(GO:1902347) |
| 0.6 | 1.8 | GO:0051938 | L-amino acid import(GO:0043092) L-glutamate import(GO:0051938) |
| 0.6 | 1.8 | GO:0015800 | acidic amino acid transport(GO:0015800) |
| 0.6 | 0.6 | GO:0061014 | positive regulation of mRNA catabolic process(GO:0061014) |
| 0.6 | 2.3 | GO:0034720 | histone H3-K4 demethylation(GO:0034720) |
| 0.6 | 1.7 | GO:2000693 | positive regulation of seed maturation(GO:2000693) |
| 0.6 | 7.3 | GO:1900057 | positive regulation of leaf senescence(GO:1900057) |
| 0.6 | 2.8 | GO:1902418 | (+)-abscisic acid D-glucopyranosyl ester transmembrane transport(GO:1902418) |
| 0.5 | 2.0 | GO:0016098 | monoterpenoid metabolic process(GO:0016098) monoterpenoid biosynthetic process(GO:0016099) |
| 0.5 | 9.2 | GO:0019374 | galactolipid metabolic process(GO:0019374) |
| 0.5 | 1.5 | GO:0009945 | radial axis specification(GO:0009945) |
| 0.5 | 2.0 | GO:0010507 | negative regulation of autophagy(GO:0010507) |
| 0.5 | 1.5 | GO:0010288 | response to lead ion(GO:0010288) |
| 0.5 | 1.9 | GO:0019322 | pentose biosynthetic process(GO:0019322) arabinose biosynthetic process(GO:0019567) |
| 0.5 | 4.2 | GO:0051410 | detoxification of nitrogen compound(GO:0051410) |
| 0.5 | 1.4 | GO:0032490 | detection of molecule of bacterial origin(GO:0032490) |
| 0.5 | 1.8 | GO:0070676 | intralumenal vesicle formation(GO:0070676) |
| 0.4 | 1.3 | GO:0009221 | deoxyribonucleoside triphosphate biosynthetic process(GO:0009202) pyrimidine deoxyribonucleoside triphosphate metabolic process(GO:0009211) pyrimidine deoxyribonucleotide metabolic process(GO:0009219) pyrimidine deoxyribonucleotide biosynthetic process(GO:0009221) 2'-deoxyribonucleotide biosynthetic process(GO:0009265) deoxyribose phosphate biosynthetic process(GO:0046385) |
| 0.4 | 1.8 | GO:0015692 | lead ion transport(GO:0015692) |
| 0.4 | 3.5 | GO:0009939 | positive regulation of gibberellic acid mediated signaling pathway(GO:0009939) |
| 0.4 | 2.6 | GO:0042447 | cytokinin catabolic process(GO:0009823) hormone catabolic process(GO:0042447) |
| 0.4 | 1.3 | GO:0055064 | chloride ion homeostasis(GO:0055064) |
| 0.4 | 1.7 | GO:0080029 | cellular response to boron-containing substance levels(GO:0080029) |
| 0.4 | 6.7 | GO:0015996 | chlorophyll catabolic process(GO:0015996) pigment catabolic process(GO:0046149) |
| 0.4 | 1.2 | GO:1903513 | retrograde protein transport, ER to cytosol(GO:0030970) endoplasmic reticulum to cytosol transport(GO:1903513) |
| 0.4 | 0.4 | GO:0009394 | deoxyribonucleoside triphosphate metabolic process(GO:0009200) 2'-deoxyribonucleotide metabolic process(GO:0009394) deoxyribose phosphate metabolic process(GO:0019692) |
| 0.4 | 2.4 | GO:0042981 | apoptotic process(GO:0006915) regulation of apoptotic process(GO:0042981) negative regulation of apoptotic process(GO:0043066) |
| 0.4 | 2.0 | GO:0046208 | spermine catabolic process(GO:0046208) |
| 0.4 | 1.6 | GO:0042040 | molybdenum incorporation into molybdenum-molybdopterin complex(GO:0018315) metal incorporation into metallo-molybdopterin complex(GO:0042040) |
| 0.4 | 1.2 | GO:0000973 | posttranscriptional tethering of RNA polymerase II gene DNA at nuclear periphery(GO:0000973) |
| 0.4 | 0.8 | GO:0030002 | cellular anion homeostasis(GO:0030002) |
| 0.4 | 16.9 | GO:0043562 | cellular response to nitrogen levels(GO:0043562) |
| 0.4 | 4.7 | GO:0015749 | monosaccharide transport(GO:0015749) |
| 0.4 | 7.0 | GO:0006826 | iron ion transport(GO:0006826) |
| 0.4 | 1.9 | GO:1900367 | positive regulation of defense response to insect(GO:1900367) |
| 0.4 | 1.2 | GO:0051202 | phytochromobilin biosynthetic process(GO:0010024) phytochromobilin metabolic process(GO:0051202) |
| 0.4 | 1.1 | GO:0071569 | protein ufmylation(GO:0071569) |
| 0.4 | 1.9 | GO:0019048 | modulation by virus of host morphology or physiology(GO:0019048) |
| 0.4 | 2.6 | GO:0030007 | cellular potassium ion homeostasis(GO:0030007) |
| 0.4 | 1.9 | GO:0051289 | protein homotetramerization(GO:0051289) |
| 0.4 | 2.2 | GO:0046247 | carotene catabolic process(GO:0016121) terpene catabolic process(GO:0046247) |
| 0.4 | 1.4 | GO:0010480 | microsporocyte differentiation(GO:0010480) |
| 0.4 | 1.1 | GO:1900111 | positive regulation of histone H3-K9 dimethylation(GO:1900111) |
| 0.4 | 1.1 | GO:0010203 | response to very low fluence red light stimulus(GO:0010203) |
| 0.3 | 2.1 | GO:0051365 | cellular response to potassium ion starvation(GO:0051365) |
| 0.3 | 3.4 | GO:0031204 | posttranslational protein targeting to membrane, translocation(GO:0031204) |
| 0.3 | 3.8 | GO:0010120 | camalexin biosynthetic process(GO:0010120) camalexin metabolic process(GO:0052317) |
| 0.3 | 1.0 | GO:0030322 | stabilization of membrane potential(GO:0030322) |
| 0.3 | 2.7 | GO:0061727 | lactate metabolic process(GO:0006089) methylglyoxal metabolic process(GO:0009438) methylglyoxal catabolic process to D-lactate via S-lactoyl-glutathione(GO:0019243) ketone catabolic process(GO:0042182) methylglyoxal catabolic process(GO:0051596) methylglyoxal catabolic process to lactate(GO:0061727) |
| 0.3 | 2.0 | GO:1903428 | positive regulation of reactive oxygen species biosynthetic process(GO:1903428) |
| 0.3 | 1.3 | GO:0045332 | phospholipid translocation(GO:0045332) |
| 0.3 | 0.7 | GO:0071421 | manganese ion transmembrane transport(GO:0071421) |
| 0.3 | 2.6 | GO:0031222 | arabinan catabolic process(GO:0031222) |
| 0.3 | 0.3 | GO:0034058 | endosomal vesicle fusion(GO:0034058) |
| 0.3 | 0.6 | GO:0010107 | potassium ion import(GO:0010107) |
| 0.3 | 1.0 | GO:0050000 | chromosome localization(GO:0050000) protein localization to nuclear envelope(GO:0090435) |
| 0.3 | 1.6 | GO:0009590 | detection of gravity(GO:0009590) |
| 0.3 | 0.6 | GO:0061062 | nematode larval development(GO:0002119) larval development(GO:0002164) regulation of nematode larval development(GO:0061062) |
| 0.3 | 1.2 | GO:0046786 | viral replication complex formation and maintenance(GO:0046786) |
| 0.3 | 3.0 | GO:0070813 | hydrogen sulfide metabolic process(GO:0070813) |
| 0.3 | 1.2 | GO:0071836 | nectar secretion(GO:0071836) |
| 0.3 | 1.5 | GO:0048464 | sepal development(GO:0048442) flower calyx development(GO:0048464) |
| 0.3 | 2.9 | GO:0070370 | cellular heat acclimation(GO:0070370) |
| 0.3 | 1.5 | GO:0019323 | pentose catabolic process(GO:0019323) |
| 0.3 | 0.9 | GO:0046416 | D-amino acid metabolic process(GO:0046416) |
| 0.3 | 5.4 | GO:0043068 | positive regulation of programmed cell death(GO:0043068) |
| 0.3 | 2.0 | GO:0048578 | positive regulation of long-day photoperiodism, flowering(GO:0048578) |
| 0.3 | 2.2 | GO:0009061 | anaerobic respiration(GO:0009061) |
| 0.3 | 2.8 | GO:0090158 | endoplasmic reticulum membrane organization(GO:0090158) |
| 0.3 | 1.9 | GO:0046482 | para-aminobenzoic acid metabolic process(GO:0046482) |
| 0.3 | 0.8 | GO:0048281 | inflorescence morphogenesis(GO:0048281) |
| 0.3 | 1.4 | GO:0006564 | L-serine biosynthetic process(GO:0006564) |
| 0.3 | 2.2 | GO:0050691 | regulation of defense response to virus by host(GO:0050691) |
| 0.3 | 0.8 | GO:0046740 | transport of virus in host, cell to cell(GO:0046740) multi-organism intercellular transport(GO:1902586) |
| 0.3 | 1.3 | GO:0006116 | NADH oxidation(GO:0006116) |
| 0.3 | 0.3 | GO:0080001 | mucilage extrusion from seed coat(GO:0080001) |
| 0.3 | 3.0 | GO:0048317 | seed morphogenesis(GO:0048317) |
| 0.3 | 0.8 | GO:0015812 | gamma-aminobutyric acid transport(GO:0015812) |
| 0.3 | 0.8 | GO:1990116 | ribosome-associated ubiquitin-dependent protein catabolic process(GO:1990116) |
| 0.3 | 1.0 | GO:2000036 | regulation of stem cell population maintenance(GO:2000036) regulation of stem cell differentiation(GO:2000736) |
| 0.2 | 1.2 | GO:0019433 | triglyceride catabolic process(GO:0019433) |
| 0.2 | 0.7 | GO:0000050 | urea cycle(GO:0000050) |
| 0.2 | 0.7 | GO:0071763 | nuclear membrane organization(GO:0071763) |
| 0.2 | 1.2 | GO:0006809 | nitric oxide biosynthetic process(GO:0006809) |
| 0.2 | 0.7 | GO:0006369 | termination of RNA polymerase II transcription(GO:0006369) |
| 0.2 | 11.5 | GO:0009788 | negative regulation of abscisic acid-activated signaling pathway(GO:0009788) |
| 0.2 | 2.8 | GO:0016558 | protein import into peroxisome matrix(GO:0016558) |
| 0.2 | 0.7 | GO:0030974 | thiamine pyrophosphate transport(GO:0030974) vitamin transmembrane transport(GO:0035461) azole transport(GO:0045117) |
| 0.2 | 0.7 | GO:0070537 | histone H2A K63-linked deubiquitination(GO:0070537) |
| 0.2 | 3.2 | GO:0080027 | response to herbivore(GO:0080027) |
| 0.2 | 1.1 | GO:0046865 | isoprenoid transport(GO:0046864) terpenoid transport(GO:0046865) |
| 0.2 | 4.1 | GO:0031408 | oxylipin biosynthetic process(GO:0031408) |
| 0.2 | 0.6 | GO:0055089 | fatty acid homeostasis(GO:0055089) |
| 0.2 | 1.3 | GO:1900036 | positive regulation of cellular response to heat(GO:1900036) |
| 0.2 | 1.5 | GO:0009942 | longitudinal axis specification(GO:0009942) |
| 0.2 | 0.6 | GO:0052315 | toxin biosynthetic process(GO:0009403) indole phytoalexin biosynthetic process(GO:0009700) indole phytoalexin metabolic process(GO:0046217) phytoalexin metabolic process(GO:0052314) phytoalexin biosynthetic process(GO:0052315) |
| 0.2 | 0.8 | GO:0015744 | succinate transport(GO:0015744) |
| 0.2 | 1.7 | GO:0007205 | protein kinase C-activating G-protein coupled receptor signaling pathway(GO:0007205) |
| 0.2 | 0.8 | GO:0010185 | regulation of cellular defense response(GO:0010185) |
| 0.2 | 1.9 | GO:0006656 | phosphatidylcholine biosynthetic process(GO:0006656) |
| 0.2 | 3.7 | GO:0010555 | response to mannitol(GO:0010555) |
| 0.2 | 0.8 | GO:1902916 | regulation of protein polyubiquitination(GO:1902914) positive regulation of protein polyubiquitination(GO:1902916) |
| 0.2 | 8.7 | GO:2000022 | regulation of jasmonic acid mediated signaling pathway(GO:2000022) |
| 0.2 | 0.6 | GO:0017145 | stem cell division(GO:0017145) |
| 0.2 | 1.0 | GO:1901420 | negative regulation of response to alcohol(GO:1901420) |
| 0.2 | 2.4 | GO:0001676 | long-chain fatty acid metabolic process(GO:0001676) |
| 0.2 | 1.0 | GO:0070861 | regulation of protein exit from endoplasmic reticulum(GO:0070861) positive regulation of protein exit from endoplasmic reticulum(GO:0070863) |
| 0.2 | 2.1 | GO:1901141 | regulation of lignin biosynthetic process(GO:1901141) |
| 0.2 | 1.3 | GO:0032456 | endocytic recycling(GO:0032456) |
| 0.2 | 0.6 | GO:0043982 | histone H4-K8 acetylation(GO:0043982) |
| 0.2 | 0.9 | GO:0034051 | negative regulation of plant-type hypersensitive response(GO:0034051) |
| 0.2 | 10.9 | GO:0009631 | cold acclimation(GO:0009631) |
| 0.2 | 0.6 | GO:1903008 | organelle disassembly(GO:1903008) |
| 0.2 | 0.7 | GO:0000472 | endonucleolytic cleavage to generate mature 5'-end of SSU-rRNA from (SSU-rRNA, 5.8S rRNA, LSU-rRNA)(GO:0000472) endonucleolytic cleavage in 5'-ETS of tricistronic rRNA transcript (SSU-rRNA, 5.8S rRNA, LSU-rRNA)(GO:0000480) |
| 0.2 | 0.7 | GO:0043693 | monoterpene biosynthetic process(GO:0043693) |
| 0.2 | 0.5 | GO:0045857 | regulation of molecular function, epigenetic(GO:0040030) negative regulation of molecular function, epigenetic(GO:0045857) |
| 0.2 | 6.3 | GO:0009816 | defense response to bacterium, incompatible interaction(GO:0009816) |
| 0.2 | 1.6 | GO:0010112 | regulation of systemic acquired resistance(GO:0010112) |
| 0.2 | 1.1 | GO:0034087 | establishment of mitotic sister chromatid cohesion(GO:0034087) establishment of protein localization to chromosome(GO:0070199) rDNA condensation(GO:0070550) establishment of protein localization to chromatin(GO:0071169) transcriptional activation by promoter-enhancer looping(GO:0071733) gene looping(GO:0090202) dsDNA loop formation(GO:0090579) |
| 0.2 | 3.2 | GO:0009593 | detection of chemical stimulus(GO:0009593) |
| 0.2 | 0.5 | GO:0034247 | snoRNA splicing(GO:0034247) |
| 0.2 | 1.0 | GO:0015846 | polyamine transport(GO:0015846) |
| 0.2 | 3.8 | GO:0071577 | zinc II ion transmembrane transport(GO:0071577) |
| 0.2 | 0.7 | GO:0032527 | protein exit from endoplasmic reticulum(GO:0032527) |
| 0.2 | 2.5 | GO:0072506 | phosphate ion homeostasis(GO:0055062) trivalent inorganic anion homeostasis(GO:0072506) |
| 0.2 | 0.8 | GO:0080024 | indolebutyric acid metabolic process(GO:0080024) |
| 0.2 | 0.8 | GO:2000580 | regulation of microtubule motor activity(GO:2000574) positive regulation of microtubule motor activity(GO:2000576) regulation of ATP-dependent microtubule motor activity, plus-end-directed(GO:2000580) positive regulation of ATP-dependent microtubule motor activity, plus-end-directed(GO:2000582) |
| 0.2 | 0.7 | GO:0046440 | lysine catabolic process(GO:0006554) L-lysine catabolic process to acetyl-CoA(GO:0019474) L-lysine catabolic process(GO:0019477) L-lysine catabolic process to acetyl-CoA via saccharopine(GO:0033512) L-lysine metabolic process(GO:0046440) |
| 0.2 | 3.6 | GO:0060548 | negative regulation of cell death(GO:0060548) |
| 0.2 | 0.5 | GO:2000058 | protein ubiquitination involved in ubiquitin-dependent protein catabolic process(GO:0042787) regulation of protein ubiquitination involved in ubiquitin-dependent protein catabolic process(GO:2000058) |
| 0.2 | 0.6 | GO:0015854 | adenine transport(GO:0015853) guanine transport(GO:0015854) |
| 0.2 | 1.1 | GO:0051014 | actin filament severing(GO:0051014) |
| 0.2 | 1.1 | GO:0019632 | shikimate metabolic process(GO:0019632) |
| 0.2 | 0.6 | GO:0050792 | regulation of viral process(GO:0050792) |
| 0.2 | 0.8 | GO:0010142 | farnesyl diphosphate biosynthetic process, mevalonate pathway(GO:0010142) isoprenoid biosynthetic process via mevalonate(GO:1902767) |
| 0.2 | 1.1 | GO:0045898 | regulation of RNA polymerase II transcriptional preinitiation complex assembly(GO:0045898) positive regulation of RNA polymerase II transcriptional preinitiation complex assembly(GO:0045899) |
| 0.2 | 0.6 | GO:0048358 | mucilage pectin biosynthetic process(GO:0048358) |
| 0.1 | 2.8 | GO:0046855 | inositol phosphate dephosphorylation(GO:0046855) inositol phosphate catabolic process(GO:0071545) |
| 0.1 | 0.1 | GO:0006469 | negative regulation of protein kinase activity(GO:0006469) negative regulation of kinase activity(GO:0033673) |
| 0.1 | 1.2 | GO:0052482 | defense response by cell wall thickening(GO:0052482) |
| 0.1 | 1.8 | GO:1902074 | response to salt(GO:1902074) |
| 0.1 | 0.9 | GO:0034227 | tRNA thio-modification(GO:0034227) |
| 0.1 | 1.6 | GO:0045116 | protein neddylation(GO:0045116) |
| 0.1 | 6.7 | GO:0002239 | response to oomycetes(GO:0002239) |
| 0.1 | 0.8 | GO:0006011 | UDP-glucose metabolic process(GO:0006011) |
| 0.1 | 1.8 | GO:0009051 | pentose-phosphate shunt, oxidative branch(GO:0009051) |
| 0.1 | 1.5 | GO:0048015 | phosphatidylinositol-mediated signaling(GO:0048015) |
| 0.1 | 2.7 | GO:0098869 | cellular oxidant detoxification(GO:0098869) |
| 0.1 | 1.1 | GO:0080183 | response to photooxidative stress(GO:0080183) |
| 0.1 | 0.7 | GO:0033356 | UDP-L-arabinose metabolic process(GO:0033356) |
| 0.1 | 0.4 | GO:0080026 | response to indolebutyric acid(GO:0080026) |
| 0.1 | 0.5 | GO:0006651 | diacylglycerol biosynthetic process(GO:0006651) |
| 0.1 | 1.2 | GO:0046512 | sphingosine metabolic process(GO:0006670) diol metabolic process(GO:0034311) diol biosynthetic process(GO:0034312) sphingosine biosynthetic process(GO:0046512) |
| 0.1 | 0.7 | GO:2000144 | regulation of transcription initiation from RNA polymerase II promoter(GO:0060260) positive regulation of transcription initiation from RNA polymerase II promoter(GO:0060261) positive regulation of DNA-templated transcription, initiation(GO:2000144) |
| 0.1 | 4.5 | GO:0043547 | positive regulation of GTPase activity(GO:0043547) |
| 0.1 | 1.2 | GO:0016119 | carotene metabolic process(GO:0016119) |
| 0.1 | 0.1 | GO:0051180 | vitamin transport(GO:0051180) |
| 0.1 | 0.5 | GO:0010336 | gibberellic acid homeostasis(GO:0010336) |
| 0.1 | 0.8 | GO:0009187 | cyclic nucleotide metabolic process(GO:0009187) |
| 0.1 | 1.4 | GO:0072666 | protein targeting to vacuole(GO:0006623) protein localization to vacuole(GO:0072665) establishment of protein localization to vacuole(GO:0072666) |
| 0.1 | 0.6 | GO:0015074 | DNA integration(GO:0015074) |
| 0.1 | 0.9 | GO:0016584 | nucleosome positioning(GO:0016584) |
| 0.1 | 3.6 | GO:0006914 | autophagy(GO:0006914) |
| 0.1 | 3.0 | GO:0071230 | cellular response to amino acid stimulus(GO:0071230) |
| 0.1 | 0.6 | GO:0048439 | flower morphogenesis(GO:0048439) |
| 0.1 | 1.0 | GO:0097034 | respiratory chain complex IV assembly(GO:0008535) mitochondrial respiratory chain complex IV assembly(GO:0033617) mitochondrial respiratory chain complex IV biogenesis(GO:0097034) |
| 0.1 | 1.0 | GO:0044375 | regulation of peroxisome size(GO:0044375) |
| 0.1 | 0.4 | GO:1901998 | tetracycline transport(GO:0015904) antibiotic transport(GO:0042891) toxin transport(GO:1901998) |
| 0.1 | 1.0 | GO:0009610 | response to symbiotic fungus(GO:0009610) |
| 0.1 | 1.1 | GO:1902170 | cellular response to reactive nitrogen species(GO:1902170) |
| 0.1 | 5.1 | GO:0009626 | plant-type hypersensitive response(GO:0009626) |
| 0.1 | 0.8 | GO:0006655 | phosphatidylglycerol biosynthetic process(GO:0006655) |
| 0.1 | 0.4 | GO:0002188 | translation reinitiation(GO:0002188) |
| 0.1 | 1.3 | GO:0080113 | seed growth(GO:0080112) regulation of seed growth(GO:0080113) |
| 0.1 | 0.5 | GO:0006419 | alanyl-tRNA aminoacylation(GO:0006419) |
| 0.1 | 1.3 | GO:0006646 | phosphatidylethanolamine biosynthetic process(GO:0006646) phosphatidylethanolamine metabolic process(GO:0046337) |
| 0.1 | 3.4 | GO:0006635 | fatty acid beta-oxidation(GO:0006635) |
| 0.1 | 0.7 | GO:0042126 | nitrate metabolic process(GO:0042126) nitrate assimilation(GO:0042128) |
| 0.1 | 1.7 | GO:0080163 | regulation of protein serine/threonine phosphatase activity(GO:0080163) |
| 0.1 | 1.0 | GO:0052126 | movement in host(GO:0044000) transport of virus in multicellular host(GO:0046739) movement in other organism involved in symbiotic interaction(GO:0051814) movement in host environment(GO:0052126) movement in environment of other organism involved in symbiotic interaction(GO:0052192) |
| 0.1 | 1.0 | GO:0070828 | heterochromatin organization(GO:0070828) |
| 0.1 | 0.7 | GO:0048530 | fruit morphogenesis(GO:0048530) |
| 0.1 | 0.5 | GO:0001173 | DNA-templated transcriptional start site selection(GO:0001173) |
| 0.1 | 2.7 | GO:0010499 | proteasomal ubiquitin-independent protein catabolic process(GO:0010499) |
| 0.1 | 1.5 | GO:0042147 | retrograde transport, endosome to Golgi(GO:0042147) |
| 0.1 | 2.3 | GO:0032968 | positive regulation of transcription elongation from RNA polymerase II promoter(GO:0032968) |
| 0.1 | 2.3 | GO:0006817 | phosphate ion transport(GO:0006817) |
| 0.1 | 3.3 | GO:0007166 | cell surface receptor signaling pathway(GO:0007166) |
| 0.1 | 1.7 | GO:0071218 | cellular response to misfolded protein(GO:0071218) |
| 0.1 | 1.2 | GO:0043162 | ubiquitin-dependent protein catabolic process via the multivesicular body sorting pathway(GO:0043162) |
| 0.1 | 0.6 | GO:0080190 | lateral growth(GO:0080190) |
| 0.1 | 0.5 | GO:0010321 | regulation of vegetative phase change(GO:0010321) |
| 0.1 | 0.8 | GO:0045739 | positive regulation of DNA repair(GO:0045739) |
| 0.1 | 1.2 | GO:0006574 | valine catabolic process(GO:0006574) |
| 0.1 | 0.1 | GO:0010617 | circadian regulation of calcium ion oscillation(GO:0010617) |
| 0.1 | 1.0 | GO:0016925 | protein sumoylation(GO:0016925) |
| 0.1 | 0.8 | GO:0033169 | histone H3-K9 demethylation(GO:0033169) |
| 0.1 | 1.2 | GO:0010413 | glucuronoxylan metabolic process(GO:0010413) glucuronoxylan biosynthetic process(GO:0010417) |
| 0.1 | 0.5 | GO:0048363 | mucilage pectin metabolic process(GO:0048363) |
| 0.1 | 0.9 | GO:0043902 | positive regulation of multi-organism process(GO:0043902) |
| 0.1 | 0.3 | GO:0001672 | regulation of chromatin assembly or disassembly(GO:0001672) |
| 0.1 | 1.1 | GO:0006825 | copper ion transport(GO:0006825) |
| 0.1 | 0.4 | GO:0000967 | rRNA 5'-end processing(GO:0000967) ncRNA 5'-end processing(GO:0034471) |
| 0.1 | 0.9 | GO:1903830 | magnesium ion transmembrane transport(GO:1903830) |
| 0.1 | 1.7 | GO:0046834 | lipid phosphorylation(GO:0046834) phosphatidylinositol phosphorylation(GO:0046854) |
| 0.1 | 3.6 | GO:0090332 | stomatal closure(GO:0090332) |
| 0.1 | 0.3 | GO:0001887 | selenium compound metabolic process(GO:0001887) |
| 0.1 | 2.1 | GO:0006896 | Golgi to vacuole transport(GO:0006896) |
| 0.1 | 0.4 | GO:1902626 | assembly of large subunit precursor of preribosome(GO:1902626) |
| 0.1 | 1.8 | GO:0010941 | regulation of cell death(GO:0010941) |
| 0.1 | 1.2 | GO:0009098 | leucine biosynthetic process(GO:0009098) |
| 0.1 | 0.2 | GO:0032786 | positive regulation of DNA-templated transcription, elongation(GO:0032786) |
| 0.1 | 2.3 | GO:0009718 | anthocyanin-containing compound biosynthetic process(GO:0009718) |
| 0.1 | 0.5 | GO:0051571 | positive regulation of histone H3-K4 methylation(GO:0051571) |
| 0.1 | 1.5 | GO:0009065 | glutamine family amino acid catabolic process(GO:0009065) |
| 0.1 | 0.6 | GO:0045851 | pH reduction(GO:0045851) |
| 0.1 | 1.0 | GO:0015833 | oligopeptide transport(GO:0006857) peptide transport(GO:0015833) |
| 0.1 | 0.7 | GO:1904030 | negative regulation of cyclin-dependent protein serine/threonine kinase activity(GO:0045736) negative regulation of cyclin-dependent protein kinase activity(GO:1904030) |
| 0.1 | 0.2 | GO:0019368 | fatty acid elongation, saturated fatty acid(GO:0019367) fatty acid elongation, unsaturated fatty acid(GO:0019368) fatty acid elongation, monounsaturated fatty acid(GO:0034625) fatty acid elongation, polyunsaturated fatty acid(GO:0034626) |
| 0.1 | 0.7 | GO:0033319 | UDP-D-xylose metabolic process(GO:0033319) UDP-D-xylose biosynthetic process(GO:0033320) |
| 0.1 | 0.2 | GO:0051297 | centrosome cycle(GO:0007098) centriole replication(GO:0007099) centrosome organization(GO:0051297) centrosome duplication(GO:0051298) centriole assembly(GO:0098534) |
| 0.1 | 0.6 | GO:1902532 | negative regulation of ethylene-activated signaling pathway(GO:0010105) negative regulation of phosphorelay signal transduction system(GO:0070298) negative regulation of intracellular signal transduction(GO:1902532) |
| 0.1 | 0.2 | GO:0080005 | photosystem stoichiometry adjustment(GO:0080005) |
| 0.1 | 2.1 | GO:0006012 | galactose metabolic process(GO:0006012) |
| 0.1 | 0.3 | GO:0000455 | enzyme-directed rRNA pseudouridine synthesis(GO:0000455) |
| 0.1 | 0.5 | GO:0000244 | spliceosomal tri-snRNP complex assembly(GO:0000244) |
| 0.1 | 0.9 | GO:0000165 | MAPK cascade(GO:0000165) |
| 0.1 | 0.3 | GO:0006677 | glycosylceramide metabolic process(GO:0006677) glucosylceramide metabolic process(GO:0006678) glucosylceramide catabolic process(GO:0006680) glycosphingolipid metabolic process(GO:0006687) glycolipid catabolic process(GO:0019377) glycosylceramide catabolic process(GO:0046477) glycosphingolipid catabolic process(GO:0046479) ceramide catabolic process(GO:0046514) |
| 0.1 | 0.1 | GO:0071398 | response to fatty acid(GO:0070542) cellular response to fatty acid(GO:0071398) |
| 0.1 | 0.5 | GO:0032511 | late endosome to vacuole transport via multivesicular body sorting pathway(GO:0032511) |
| 0.1 | 1.0 | GO:0018230 | peptidyl-L-cysteine S-palmitoylation(GO:0018230) peptidyl-S-diacylglycerol-L-cysteine biosynthetic process from peptidyl-cysteine(GO:0018231) |
| 0.1 | 1.7 | GO:0071472 | cellular response to salt stress(GO:0071472) |
| 0.1 | 0.7 | GO:0017183 | peptidyl-diphthamide metabolic process(GO:0017182) peptidyl-diphthamide biosynthetic process from peptidyl-histidine(GO:0017183) peptidyl-histidine modification(GO:0018202) |
| 0.1 | 0.5 | GO:0006513 | protein monoubiquitination(GO:0006513) |
| 0.1 | 1.1 | GO:0032981 | mitochondrial respiratory chain complex I assembly(GO:0032981) mitochondrial respiratory chain complex I biogenesis(GO:0097031) |
| 0.1 | 1.0 | GO:0009299 | mRNA transcription(GO:0009299) |
| 0.1 | 2.7 | GO:0009911 | positive regulation of flower development(GO:0009911) |
| 0.1 | 1.4 | GO:0035304 | regulation of protein dephosphorylation(GO:0035304) |
| 0.1 | 0.4 | GO:0006821 | chloride transport(GO:0006821) |
| 0.1 | 0.1 | GO:0031221 | arabinan metabolic process(GO:0031221) |
| 0.1 | 0.3 | GO:0046487 | glyoxylate cycle(GO:0006097) glyoxylate metabolic process(GO:0046487) |
| 0.1 | 2.8 | GO:0009896 | positive regulation of catabolic process(GO:0009896) |
| 0.1 | 2.9 | GO:0034605 | cellular response to heat(GO:0034605) |
| 0.1 | 0.4 | GO:0000184 | nuclear-transcribed mRNA catabolic process, nonsense-mediated decay(GO:0000184) |
| 0.1 | 0.9 | GO:0009306 | protein secretion(GO:0009306) |
| 0.1 | 0.2 | GO:0042149 | cellular response to glucose starvation(GO:0042149) |
| 0.1 | 1.6 | GO:0006986 | response to unfolded protein(GO:0006986) cellular response to unfolded protein(GO:0034620) |
| 0.1 | 0.9 | GO:0018394 | internal protein amino acid acetylation(GO:0006475) histone acetylation(GO:0016573) internal peptidyl-lysine acetylation(GO:0018393) peptidyl-lysine acetylation(GO:0018394) |
| 0.1 | 0.3 | GO:0042351 | 'de novo' GDP-L-fucose biosynthetic process(GO:0042351) |
| 0.1 | 0.6 | GO:0010193 | response to ozone(GO:0010193) |
| 0.1 | 0.4 | GO:0018344 | protein geranylgeranylation(GO:0018344) |
| 0.1 | 0.5 | GO:0097428 | protein maturation by iron-sulfur cluster transfer(GO:0097428) |
| 0.1 | 0.3 | GO:0052543 | callose deposition in cell wall(GO:0052543) |
| 0.1 | 3.2 | GO:0048481 | plant ovule development(GO:0048481) |
| 0.1 | 0.6 | GO:0009870 | defense response signaling pathway, resistance gene-dependent(GO:0009870) |
| 0.1 | 6.1 | GO:0010498 | proteasomal protein catabolic process(GO:0010498) proteasome-mediated ubiquitin-dependent protein catabolic process(GO:0043161) |
| 0.1 | 0.2 | GO:0090392 | sepal giant cell differentiation(GO:0090392) |
| 0.1 | 0.4 | GO:0043248 | proteasome assembly(GO:0043248) |
| 0.1 | 27.0 | GO:0032446 | protein modification by small protein conjugation(GO:0032446) |
| 0.1 | 0.3 | GO:1901269 | lipid A biosynthetic process(GO:0009245) lipid A metabolic process(GO:0046493) lipooligosaccharide metabolic process(GO:1901269) lipooligosaccharide biosynthetic process(GO:1901271) |
| 0.1 | 0.5 | GO:0006607 | NLS-bearing protein import into nucleus(GO:0006607) |
| 0.1 | 1.1 | GO:0019674 | NAD metabolic process(GO:0019674) |
| 0.1 | 1.3 | GO:0019252 | starch biosynthetic process(GO:0019252) |
| 0.1 | 2.9 | GO:0019760 | S-glycoside metabolic process(GO:0016143) glycosinolate metabolic process(GO:0019757) glucosinolate metabolic process(GO:0019760) |
| 0.1 | 1.1 | GO:0042744 | hydrogen peroxide catabolic process(GO:0042744) |
| 0.1 | 0.7 | GO:0050821 | protein stabilization(GO:0050821) |
| 0.1 | 0.6 | GO:0042343 | indole glucosinolate metabolic process(GO:0042343) |
| 0.1 | 1.9 | GO:0009694 | jasmonic acid metabolic process(GO:0009694) |
| 0.1 | 0.6 | GO:0010540 | basipetal auxin transport(GO:0010540) |
| 0.0 | 0.6 | GO:0009862 | systemic acquired resistance, salicylic acid mediated signaling pathway(GO:0009862) |
| 0.0 | 0.3 | GO:0006368 | transcription elongation from RNA polymerase II promoter(GO:0006368) |
| 0.0 | 0.2 | GO:0010019 | chloroplast-nucleus signaling pathway(GO:0010019) |
| 0.0 | 0.2 | GO:0050777 | negative regulation of immune response(GO:0050777) |
| 0.0 | 0.6 | GO:0060321 | acceptance of pollen(GO:0060321) |
| 0.0 | 0.6 | GO:0070413 | trehalose metabolism in response to stress(GO:0070413) |
| 0.0 | 4.8 | GO:0007568 | aging(GO:0007568) |
| 0.0 | 1.7 | GO:0016126 | sterol biosynthetic process(GO:0016126) |
| 0.0 | 0.5 | GO:0009682 | induced systemic resistance(GO:0009682) |
| 0.0 | 0.1 | GO:0000098 | sulfur amino acid catabolic process(GO:0000098) |
| 0.0 | 7.4 | GO:0016311 | dephosphorylation(GO:0016311) |
| 0.0 | 0.3 | GO:0097437 | maintenance of seed dormancy(GO:0010231) maintenance of dormancy(GO:0097437) |
| 0.0 | 1.4 | GO:0016579 | protein deubiquitination(GO:0016579) |
| 0.0 | 1.2 | GO:0016144 | S-glycoside biosynthetic process(GO:0016144) glycosinolate biosynthetic process(GO:0019758) glucosinolate biosynthetic process(GO:0019761) |
| 0.0 | 1.3 | GO:0006289 | nucleotide-excision repair(GO:0006289) |
| 0.0 | 10.8 | GO:0006357 | regulation of transcription from RNA polymerase II promoter(GO:0006357) |
| 0.0 | 0.4 | GO:0006621 | protein retention in ER lumen(GO:0006621) |
| 0.0 | 0.2 | GO:0010117 | photoprotection(GO:0010117) |
| 0.0 | 0.5 | GO:0008285 | negative regulation of cell proliferation(GO:0008285) |
| 0.0 | 0.6 | GO:0010072 | primary shoot apical meristem specification(GO:0010072) |
| 0.0 | 0.8 | GO:0000162 | tryptophan biosynthetic process(GO:0000162) indolalkylamine biosynthetic process(GO:0046219) |
| 0.0 | 1.0 | GO:0000245 | spliceosomal complex assembly(GO:0000245) |
| 0.0 | 4.8 | GO:0051603 | proteolysis involved in cellular protein catabolic process(GO:0051603) |
| 0.0 | 0.4 | GO:0071051 | polyadenylation-dependent snoRNA 3'-end processing(GO:0071051) |
| 0.0 | 0.4 | GO:0031053 | primary miRNA processing(GO:0031053) |
| 0.0 | 1.7 | GO:0000380 | alternative mRNA splicing, via spliceosome(GO:0000380) |
| 0.0 | 0.4 | GO:0044030 | regulation of DNA methylation(GO:0044030) |
| 0.0 | 0.1 | GO:1901703 | protein localization involved in auxin polar transport(GO:1901703) |
| 0.0 | 0.1 | GO:0009683 | indoleacetic acid metabolic process(GO:0009683) indoleacetic acid biosynthetic process(GO:0009684) |
| 0.0 | 0.5 | GO:0010821 | regulation of mitochondrion organization(GO:0010821) |
| 0.0 | 0.7 | GO:0007030 | Golgi organization(GO:0007030) |
| 0.0 | 0.6 | GO:0050826 | response to freezing(GO:0050826) |
| 0.0 | 0.2 | GO:0032366 | intracellular sterol transport(GO:0032366) |
| 0.0 | 0.5 | GO:0016024 | CDP-diacylglycerol biosynthetic process(GO:0016024) CDP-diacylglycerol metabolic process(GO:0046341) |
| 0.0 | 1.4 | GO:0006749 | glutathione metabolic process(GO:0006749) |
| 0.0 | 0.8 | GO:0008219 | cell death(GO:0008219) |
| 0.0 | 1.4 | GO:0055046 | microgametogenesis(GO:0055046) |
| 0.0 | 0.3 | GO:0046294 | formaldehyde metabolic process(GO:0046292) formaldehyde catabolic process(GO:0046294) |
| 0.0 | 0.6 | GO:0031163 | iron-sulfur cluster assembly(GO:0016226) metallo-sulfur cluster assembly(GO:0031163) |
| 0.0 | 0.5 | GO:0051781 | positive regulation of cell division(GO:0051781) |
| 0.0 | 1.1 | GO:0006366 | transcription from RNA polymerase II promoter(GO:0006366) |
| 0.0 | 1.0 | GO:0000413 | protein peptidyl-prolyl isomerization(GO:0000413) |
| 0.0 | 5.1 | GO:0071453 | cellular response to decreased oxygen levels(GO:0036294) cellular response to oxygen levels(GO:0071453) cellular response to hypoxia(GO:0071456) |
| 0.0 | 3.4 | GO:0010228 | vegetative to reproductive phase transition of meristem(GO:0010228) |
| 0.0 | 0.3 | GO:0009901 | anther dehiscence(GO:0009901) |
| 0.0 | 0.2 | GO:0032890 | amine transport(GO:0015837) regulation of organic acid transport(GO:0032890) regulation of amine transport(GO:0051952) regulation of amino acid transport(GO:0051955) regulation of amino acid export(GO:0080143) |
| 0.0 | 0.9 | GO:0006664 | glycolipid metabolic process(GO:0006664) liposaccharide metabolic process(GO:1903509) |
| 0.0 | 0.1 | GO:0001682 | tRNA 5'-leader removal(GO:0001682) |
| 0.0 | 0.8 | GO:0010256 | endomembrane system organization(GO:0010256) |
| 0.0 | 0.3 | GO:0070973 | protein localization to endoplasmic reticulum exit site(GO:0070973) |
| 0.0 | 0.6 | GO:0006888 | ER to Golgi vesicle-mediated transport(GO:0006888) |
| 0.0 | 0.5 | GO:1905177 | tracheary element differentiation(GO:1905177) |
| 0.0 | 0.0 | GO:1901348 | positive regulation of secondary cell wall biogenesis(GO:1901348) positive regulation of cell wall organization or biogenesis(GO:1903340) |
| 0.0 | 0.3 | GO:0009704 | de-etiolation(GO:0009704) |
| 0.0 | 0.3 | GO:0006535 | cysteine biosynthetic process from serine(GO:0006535) |
| 0.0 | 0.4 | GO:0016117 | tetraterpenoid biosynthetic process(GO:0016109) carotenoid biosynthetic process(GO:0016117) |
| 0.0 | 0.5 | GO:0042023 | DNA endoreduplication(GO:0042023) |
| 0.0 | 0.4 | GO:2000242 | negative regulation of reproductive process(GO:2000242) |
| 0.0 | 0.9 | GO:0008037 | cell recognition(GO:0008037) recognition of pollen(GO:0048544) |
| 0.0 | 0.2 | GO:0030497 | fatty acid elongation(GO:0030497) |
| 0.0 | 0.1 | GO:0007266 | Rho protein signal transduction(GO:0007266) |
| 0.0 | 0.2 | GO:0036065 | fucosylation(GO:0036065) |
| 0.0 | 0.2 | GO:0006108 | malate metabolic process(GO:0006108) |
| 0.0 | 0.1 | GO:0042989 | sequestering of actin monomers(GO:0042989) |
| 0.0 | 0.3 | GO:0008360 | regulation of cell shape(GO:0008360) |
| 0.0 | 0.2 | GO:0046513 | ceramide biosynthetic process(GO:0046513) |
| 0.0 | 0.9 | GO:0045454 | cell redox homeostasis(GO:0045454) |
| 0.0 | 0.1 | GO:0001578 | microtubule bundle formation(GO:0001578) |
| 0.0 | 0.3 | GO:0030150 | protein import into mitochondrial matrix(GO:0030150) |
| 0.0 | 0.7 | GO:0042594 | response to starvation(GO:0042594) |
| 0.0 | 0.3 | GO:0035196 | production of miRNAs involved in gene silencing by miRNA(GO:0035196) |
| 0.0 | 0.4 | GO:0045168 | cell-cell signaling involved in cell fate commitment(GO:0045168) |
| 0.0 | 0.1 | GO:0060966 | regulation of gene silencing by RNA(GO:0060966) |
| 0.0 | 0.3 | GO:0030641 | regulation of cellular pH(GO:0030641) regulation of intracellular pH(GO:0051453) |
Gene overrepresentation in cellular component category:
| Log-likelihood per target | Total log-likelihood | Term | Description |
|---|---|---|---|
| 0.7 | 2.1 | GO:0005775 | vacuolar lumen(GO:0005775) |
| 0.7 | 2.0 | GO:0000792 | heterochromatin(GO:0000792) |
| 0.6 | 1.7 | GO:0009514 | glyoxysome(GO:0009514) |
| 0.5 | 2.1 | GO:0034663 | endoplasmic reticulum chaperone complex(GO:0034663) |
| 0.5 | 2.8 | GO:0031205 | endoplasmic reticulum Sec complex(GO:0031205) |
| 0.4 | 3.5 | GO:0017119 | Golgi transport complex(GO:0017119) |
| 0.4 | 5.5 | GO:0005801 | cis-Golgi network(GO:0005801) |
| 0.3 | 1.1 | GO:0035032 | phosphatidylinositol 3-kinase complex(GO:0005942) phosphatidylinositol 3-kinase complex, class III, type I(GO:0034271) phosphatidylinositol 3-kinase complex, class III, type II(GO:0034272) phosphatidylinositol 3-kinase complex, class III(GO:0035032) |
| 0.3 | 1.3 | GO:0034657 | GID complex(GO:0034657) |
| 0.3 | 1.3 | GO:0009331 | glycerol-3-phosphate dehydrogenase complex(GO:0009331) |
| 0.3 | 2.3 | GO:0000813 | ESCRT I complex(GO:0000813) |
| 0.3 | 1.0 | GO:0031353 | intrinsic component of plastid inner membrane(GO:0031352) integral component of plastid inner membrane(GO:0031353) intrinsic component of chloroplast inner membrane(GO:0031356) integral component of chloroplast inner membrane(GO:0031357) |
| 0.3 | 1.5 | GO:0038201 | TORC1 complex(GO:0031931) TOR complex(GO:0038201) |
| 0.3 | 0.8 | GO:1990112 | RQC complex(GO:1990112) |
| 0.2 | 1.2 | GO:0030906 | retromer, cargo-selective complex(GO:0030906) |
| 0.2 | 1.4 | GO:0034098 | VCP-NPL4-UFD1 AAA ATPase complex(GO:0034098) |
| 0.2 | 1.5 | GO:0042406 | extrinsic component of endoplasmic reticulum membrane(GO:0042406) |
| 0.2 | 0.7 | GO:0035101 | FACT complex(GO:0035101) |
| 0.2 | 0.9 | GO:0000220 | vacuolar proton-transporting V-type ATPase, V0 domain(GO:0000220) |
| 0.2 | 0.8 | GO:0005967 | mitochondrial pyruvate dehydrogenase complex(GO:0005967) |
| 0.2 | 1.4 | GO:0016363 | nuclear matrix(GO:0016363) |
| 0.2 | 4.4 | GO:0031012 | extracellular matrix(GO:0031012) |
| 0.2 | 1.0 | GO:0005782 | peroxisomal matrix(GO:0005782) microbody lumen(GO:0031907) |
| 0.2 | 3.8 | GO:0031970 | organelle envelope lumen(GO:0031970) |
| 0.2 | 2.0 | GO:0005788 | endoplasmic reticulum lumen(GO:0005788) |
| 0.2 | 0.4 | GO:0034457 | Mpp10 complex(GO:0034457) |
| 0.2 | 1.4 | GO:0005851 | eukaryotic translation initiation factor 2B complex(GO:0005851) |
| 0.2 | 2.2 | GO:0000109 | nucleotide-excision repair complex(GO:0000109) |
| 0.2 | 0.8 | GO:0030286 | dynein complex(GO:0030286) |
| 0.2 | 0.7 | GO:0005784 | Sec61 translocon complex(GO:0005784) |
| 0.1 | 1.2 | GO:0070390 | transcription export complex 2(GO:0070390) |
| 0.1 | 1.3 | GO:0045252 | oxoglutarate dehydrogenase complex(GO:0045252) |
| 0.1 | 0.7 | GO:0048188 | Set1C/COMPASS complex(GO:0048188) |
| 0.1 | 1.1 | GO:0031588 | nucleotide-activated protein kinase complex(GO:0031588) |
| 0.1 | 5.9 | GO:0000323 | lytic vacuole(GO:0000323) |
| 0.1 | 0.9 | GO:0000153 | cytoplasmic ubiquitin ligase complex(GO:0000153) |
| 0.1 | 1.0 | GO:0005834 | heterotrimeric G-protein complex(GO:0005834) |
| 0.1 | 1.2 | GO:0030131 | clathrin adaptor complex(GO:0030131) |
| 0.1 | 1.2 | GO:0030140 | trans-Golgi network transport vesicle(GO:0030140) |
| 0.1 | 0.2 | GO:0045254 | pyruvate dehydrogenase complex(GO:0045254) |
| 0.1 | 0.4 | GO:0030015 | CCR4-NOT core complex(GO:0030015) |
| 0.1 | 0.8 | GO:0031372 | ubiquitin conjugating enzyme complex(GO:0031371) UBC13-MMS2 complex(GO:0031372) |
| 0.1 | 0.7 | GO:0070552 | BRISC complex(GO:0070552) |
| 0.1 | 0.9 | GO:0016593 | Cdc73/Paf1 complex(GO:0016593) |
| 0.1 | 3.7 | GO:0008287 | protein serine/threonine phosphatase complex(GO:0008287) phosphatase complex(GO:1903293) |
| 0.1 | 0.3 | GO:0030897 | HOPS complex(GO:0030897) |
| 0.1 | 1.0 | GO:0005675 | holo TFIIH complex(GO:0005675) carboxy-terminal domain protein kinase complex(GO:0032806) |
| 0.1 | 0.9 | GO:0090544 | SWI/SNF complex(GO:0016514) BAF-type complex(GO:0090544) |
| 0.1 | 15.9 | GO:0000325 | plant-type vacuole(GO:0000325) |
| 0.1 | 0.9 | GO:0043189 | NuA4 histone acetyltransferase complex(GO:0035267) H4/H2A histone acetyltransferase complex(GO:0043189) H4 histone acetyltransferase complex(GO:1902562) |
| 0.1 | 1.1 | GO:0031519 | PcG protein complex(GO:0031519) |
| 0.1 | 0.6 | GO:0017053 | transcriptional repressor complex(GO:0017053) |
| 0.1 | 0.6 | GO:0044545 | NSL complex(GO:0044545) |
| 0.1 | 12.1 | GO:0000790 | nuclear chromatin(GO:0000790) |
| 0.1 | 0.9 | GO:0008023 | transcription elongation factor complex(GO:0008023) |
| 0.1 | 0.6 | GO:0034045 | pre-autophagosomal structure membrane(GO:0034045) |
| 0.1 | 1.0 | GO:0019774 | proteasome core complex, beta-subunit complex(GO:0019774) |
| 0.1 | 0.7 | GO:0089701 | U2AF(GO:0089701) |
| 0.1 | 0.7 | GO:0034399 | nuclear periphery(GO:0034399) |
| 0.1 | 0.5 | GO:0031082 | BLOC complex(GO:0031082) BLOC-1 complex(GO:0031083) |
| 0.1 | 0.3 | GO:0030681 | nucleolar ribonuclease P complex(GO:0005655) multimeric ribonuclease P complex(GO:0030681) |
| 0.1 | 0.8 | GO:0005844 | polysome(GO:0005844) |
| 0.1 | 0.9 | GO:0005849 | mRNA cleavage factor complex(GO:0005849) |
| 0.1 | 0.2 | GO:0005814 | centrosome(GO:0005813) centriole(GO:0005814) |
| 0.1 | 0.2 | GO:0097361 | CIA complex(GO:0097361) |
| 0.1 | 0.6 | GO:0030127 | COPII vesicle coat(GO:0030127) |
| 0.1 | 0.6 | GO:0000312 | plastid small ribosomal subunit(GO:0000312) |
| 0.1 | 4.0 | GO:0009707 | chloroplast outer membrane(GO:0009707) |
| 0.1 | 1.0 | GO:0005682 | U5 snRNP(GO:0005682) |
| 0.1 | 0.4 | GO:0035145 | exon-exon junction complex(GO:0035145) |
| 0.1 | 1.1 | GO:0008540 | proteasome regulatory particle, base subcomplex(GO:0008540) |
| 0.1 | 1.4 | GO:0005669 | transcription factor TFIID complex(GO:0005669) |
| 0.1 | 1.0 | GO:0031231 | integral component of peroxisomal membrane(GO:0005779) intrinsic component of peroxisomal membrane(GO:0031231) |
| 0.1 | 0.4 | GO:0005968 | Rab-protein geranylgeranyltransferase complex(GO:0005968) |
| 0.1 | 1.0 | GO:0019773 | proteasome core complex, alpha-subunit complex(GO:0019773) |
| 0.1 | 0.5 | GO:0030688 | preribosome, small subunit precursor(GO:0030688) |
| 0.1 | 4.0 | GO:0005615 | extracellular space(GO:0005615) |
| 0.1 | 0.7 | GO:0000815 | ESCRT III complex(GO:0000815) |
| 0.0 | 0.4 | GO:0010445 | nuclear dicing body(GO:0010445) |
| 0.0 | 1.2 | GO:0012511 | monolayer-surrounded lipid storage body(GO:0012511) |
| 0.0 | 0.6 | GO:0033179 | proton-transporting V-type ATPase, V0 domain(GO:0033179) |
| 0.0 | 0.7 | GO:0005770 | late endosome(GO:0005770) |
| 0.0 | 0.8 | GO:0030427 | site of polarized growth(GO:0030427) |
| 0.0 | 0.8 | GO:0000123 | histone acetyltransferase complex(GO:0000123) |
| 0.0 | 0.9 | GO:0005778 | peroxisomal membrane(GO:0005778) microbody membrane(GO:0031903) |
| 0.0 | 0.4 | GO:0043230 | extracellular organelle(GO:0043230) extracellular exosome(GO:0070062) extracellular vesicle(GO:1903561) |
| 0.0 | 1.5 | GO:0010008 | endosome membrane(GO:0010008) |
| 0.0 | 11.5 | GO:0042579 | peroxisome(GO:0005777) microbody(GO:0042579) |
| 0.0 | 1.1 | GO:0031228 | integral component of Golgi membrane(GO:0030173) intrinsic component of Golgi membrane(GO:0031228) |
| 0.0 | 4.5 | GO:0018995 | host(GO:0018995) host cell part(GO:0033643) host intracellular part(GO:0033646) host intracellular organelle(GO:0033647) host intracellular membrane-bounded organelle(GO:0033648) host cell nucleus(GO:0042025) intracellular region of host(GO:0043656) host cell(GO:0043657) other organism(GO:0044215) other organism cell(GO:0044216) other organism part(GO:0044217) |
| 0.0 | 7.7 | GO:0005789 | endoplasmic reticulum membrane(GO:0005789) |
| 0.0 | 0.9 | GO:0005811 | lipid particle(GO:0005811) |
| 0.0 | 1.9 | GO:0045271 | mitochondrial respiratory chain complex I(GO:0005747) NADH dehydrogenase complex(GO:0030964) respiratory chain complex I(GO:0045271) |
| 0.0 | 0.4 | GO:0000127 | transcription factor TFIIIC complex(GO:0000127) |
| 0.0 | 3.5 | GO:0005681 | spliceosomal complex(GO:0005681) |
| 0.0 | 1.1 | GO:0000932 | cytoplasmic mRNA processing body(GO:0000932) |
| 0.0 | 0.4 | GO:0000176 | nuclear exosome (RNase complex)(GO:0000176) |
| 0.0 | 0.2 | GO:0001405 | presequence translocase-associated import motor(GO:0001405) |
| 0.0 | 0.2 | GO:0000346 | transcription export complex(GO:0000346) THO complex part of transcription export complex(GO:0000445) |
| 0.0 | 0.9 | GO:0016592 | mediator complex(GO:0016592) |
| 0.0 | 4.6 | GO:0005654 | nucleoplasm(GO:0005654) |
| 0.0 | 0.3 | GO:0005798 | Golgi-associated vesicle(GO:0005798) |
| 0.0 | 0.1 | GO:0005736 | DNA-directed RNA polymerase I complex(GO:0005736) |
| 0.0 | 0.3 | GO:0031305 | integral component of mitochondrial inner membrane(GO:0031305) |
| 0.0 | 0.7 | GO:0000139 | Golgi membrane(GO:0000139) |
| 0.0 | 1.0 | GO:0019005 | SCF ubiquitin ligase complex(GO:0019005) |
| 0.0 | 0.2 | GO:0005744 | mitochondrial inner membrane presequence translocase complex(GO:0005744) |
| 0.0 | 0.2 | GO:0010494 | cytoplasmic stress granule(GO:0010494) |
| 0.0 | 0.3 | GO:0000137 | Golgi cis cisterna(GO:0000137) |
Gene overrepresentation in molecular function category:
| Log-likelihood per target | Total log-likelihood | Term | Description |
|---|---|---|---|
| 1.6 | 4.7 | GO:0052626 | 4-aminobenzoate amino acid synthetase activity(GO:0052625) benzoate amino acid synthetase activity(GO:0052626) vanillate amino acid synthetase activity(GO:0052627) 4-hydroxybenzoate amino acid synthetase activity(GO:0052628) |
| 1.5 | 5.9 | GO:0046593 | mandelonitrile lyase activity(GO:0046593) |
| 1.2 | 4.7 | GO:0052578 | alpha-farnesene synthase activity(GO:0052578) |
| 1.1 | 5.4 | GO:0015186 | L-glutamine transmembrane transporter activity(GO:0015186) |
| 1.1 | 4.3 | GO:0005432 | calcium:sodium antiporter activity(GO:0005432) |
| 1.0 | 2.9 | GO:0000249 | C-22 sterol desaturase activity(GO:0000249) |
| 0.9 | 2.8 | GO:0010331 | gibberellin binding(GO:0010331) |
| 0.9 | 2.6 | GO:0050736 | O-malonyltransferase activity(GO:0050736) |
| 0.9 | 4.3 | GO:0010295 | (+)-abscisic acid 8'-hydroxylase activity(GO:0010295) |
| 0.8 | 2.5 | GO:0008798 | beta-aspartyl-peptidase activity(GO:0008798) |
| 0.7 | 2.1 | GO:0019779 | Atg8 ligase activity(GO:0019776) Atg8 activating enzyme activity(GO:0019779) |
| 0.7 | 4.2 | GO:0080109 | indole-3-acetonitrile nitrile hydratase activity(GO:0080109) |
| 0.7 | 2.8 | GO:0016985 | mannan endo-1,4-beta-mannosidase activity(GO:0016985) |
| 0.7 | 2.0 | GO:0052901 | spermine:oxygen oxidoreductase (spermidine-forming) activity(GO:0052901) |
| 0.7 | 4.7 | GO:0045549 | 9-cis-epoxycarotenoid dioxygenase activity(GO:0045549) |
| 0.6 | 3.2 | GO:0046509 | 1,2-diacylglycerol 3-beta-galactosyltransferase activity(GO:0046509) |
| 0.6 | 3.2 | GO:0004108 | citrate (Si)-synthase activity(GO:0004108) citrate synthase activity(GO:0036440) |
| 0.6 | 1.9 | GO:0004557 | alpha-galactosidase activity(GO:0004557) raffinose alpha-galactosidase activity(GO:0052692) |
| 0.6 | 4.4 | GO:0016781 | phosphotransferase activity, paired acceptors(GO:0016781) |
| 0.6 | 3.5 | GO:0004416 | hydroxyacylglutathione hydrolase activity(GO:0004416) |
| 0.6 | 2.3 | GO:0080103 | 4-methylthiopropyl glucosinolate S-oxygenase activity(GO:0080103) |
| 0.6 | 2.8 | GO:1902417 | (+)-abscisic acid D-glucopyranosyl ester transmembrane transporter activity(GO:1902417) |
| 0.6 | 6.1 | GO:0008453 | alanine-glyoxylate transaminase activity(GO:0008453) |
| 0.5 | 2.7 | GO:0005355 | glucose transmembrane transporter activity(GO:0005355) |
| 0.5 | 2.1 | GO:0080002 | UDP-glucose:4-aminobenzoate acylglucosyltransferase activity(GO:0080002) |
| 0.5 | 1.6 | GO:0008265 | Mo-molybdopterin cofactor sulfurase activity(GO:0008265) |
| 0.5 | 1.5 | GO:0046524 | sucrose-phosphate synthase activity(GO:0046524) |
| 0.5 | 0.5 | GO:0030620 | U2 snRNA binding(GO:0030620) pre-mRNA intronic binding(GO:0097157) |
| 0.5 | 1.5 | GO:0008661 | 1-deoxy-D-xylulose-5-phosphate synthase activity(GO:0008661) |
| 0.5 | 1.5 | GO:0004750 | ribulose-phosphate 3-epimerase activity(GO:0004750) |
| 0.5 | 1.4 | GO:0008936 | nicotinamidase activity(GO:0008936) |
| 0.5 | 1.8 | GO:0047782 | coniferin beta-glucosidase activity(GO:0047782) |
| 0.5 | 1.4 | GO:0050412 | cinnamate beta-D-glucosyltransferase activity(GO:0050412) |
| 0.4 | 1.3 | GO:0016661 | oxidoreductase activity, acting on other nitrogenous compounds as donors(GO:0016661) |
| 0.4 | 1.3 | GO:0003995 | acyl-CoA dehydrogenase activity(GO:0003995) |
| 0.4 | 2.2 | GO:0004165 | dodecenoyl-CoA delta-isomerase activity(GO:0004165) |
| 0.4 | 2.1 | GO:0003680 | AT DNA binding(GO:0003680) |
| 0.4 | 3.4 | GO:0015172 | acidic amino acid transmembrane transporter activity(GO:0015172) |
| 0.4 | 1.3 | GO:0016767 | geranylgeranyl-diphosphate geranylgeranyltransferase activity(GO:0016767) |
| 0.4 | 2.5 | GO:0047635 | L-alanine:2-oxoglutarate aminotransferase activity(GO:0004021) cystathionine beta-lyase activity(GO:0004121) L-tyrosine:2-oxoglutarate aminotransferase activity(GO:0004838) alanine-oxo-acid transaminase activity(GO:0047635) L-tyrosine aminotransferase activity(GO:0070547) |
| 0.4 | 1.2 | GO:0008442 | 3-hydroxyisobutyrate dehydrogenase activity(GO:0008442) |
| 0.4 | 2.0 | GO:0050551 | (E)-beta-ocimene synthase activity(GO:0034768) myrcene synthase activity(GO:0050551) |
| 0.4 | 1.2 | GO:0008481 | sphinganine kinase activity(GO:0008481) |
| 0.4 | 3.2 | GO:0004566 | beta-glucuronidase activity(GO:0004566) |
| 0.4 | 1.2 | GO:0010291 | carotene beta-ring hydroxylase activity(GO:0010291) |
| 0.4 | 1.2 | GO:0035671 | enone reductase activity(GO:0035671) |
| 0.4 | 1.2 | GO:0035605 | peptidyl-cysteine S-nitrosylase activity(GO:0035605) |
| 0.4 | 1.1 | GO:0019788 | NEDD8 transferase activity(GO:0019788) |
| 0.4 | 1.5 | GO:0004737 | pyruvate decarboxylase activity(GO:0004737) |
| 0.4 | 1.5 | GO:0032791 | lead ion binding(GO:0032791) |
| 0.4 | 2.6 | GO:0019139 | cytokinin dehydrogenase activity(GO:0019139) |
| 0.4 | 2.6 | GO:0004834 | tryptophan synthase activity(GO:0004834) |
| 0.4 | 2.2 | GO:0030544 | Hsp70 protein binding(GO:0030544) |
| 0.4 | 2.5 | GO:0008157 | protein phosphatase 1 binding(GO:0008157) |
| 0.3 | 1.7 | GO:0016629 | 12-oxophytodienoate reductase activity(GO:0016629) |
| 0.3 | 1.7 | GO:0015116 | sulfate transmembrane transporter activity(GO:0015116) |
| 0.3 | 1.3 | GO:0003852 | 2-isopropylmalate synthase activity(GO:0003852) |
| 0.3 | 1.0 | GO:0043425 | bHLH transcription factor binding(GO:0043425) |
| 0.3 | 2.8 | GO:0047216 | inositol 3-alpha-galactosyltransferase activity(GO:0047216) |
| 0.3 | 5.3 | GO:0016702 | oxidoreductase activity, acting on single donors with incorporation of molecular oxygen, incorporation of two atoms of oxygen(GO:0016702) |
| 0.3 | 5.8 | GO:0016844 | strictosidine synthase activity(GO:0016844) |
| 0.3 | 1.2 | GO:0004617 | phosphoglycerate dehydrogenase activity(GO:0004617) |
| 0.3 | 0.9 | GO:0031219 | levanase activity(GO:0031219) fructan beta-fructosidase activity(GO:0051669) |
| 0.3 | 1.5 | GO:0004322 | ferroxidase activity(GO:0004322) oxidoreductase activity, oxidizing metal ions, oxygen as acceptor(GO:0016724) |
| 0.3 | 1.5 | GO:0033897 | ribonuclease T2 activity(GO:0033897) |
| 0.3 | 1.2 | GO:0031516 | far-red light photoreceptor activity(GO:0031516) |
| 0.3 | 3.1 | GO:0047617 | acyl-CoA hydrolase activity(GO:0047617) |
| 0.3 | 2.0 | GO:0010279 | indole-3-acetic acid amido synthetase activity(GO:0010279) |
| 0.3 | 0.8 | GO:0015089 | high-affinity copper ion transmembrane transporter activity(GO:0015089) |
| 0.3 | 1.4 | GO:0004473 | malate dehydrogenase (decarboxylating) (NADP+) activity(GO:0004473) |
| 0.3 | 5.1 | GO:0005381 | iron ion transmembrane transporter activity(GO:0005381) |
| 0.3 | 2.4 | GO:0071617 | lysophospholipid acyltransferase activity(GO:0071617) |
| 0.3 | 0.8 | GO:0047134 | protein-disulfide reductase activity(GO:0047134) |
| 0.3 | 1.6 | GO:0001102 | RNA polymerase II activating transcription factor binding(GO:0001102) |
| 0.3 | 1.8 | GO:0005247 | voltage-gated chloride channel activity(GO:0005247) chloride channel activity(GO:0005254) |
| 0.3 | 1.5 | GO:0050302 | aryl-aldehyde oxidase activity(GO:0018488) indole-3-acetaldehyde oxidase activity(GO:0050302) |
| 0.2 | 2.4 | GO:0004602 | glutathione peroxidase activity(GO:0004602) |
| 0.2 | 0.2 | GO:0015141 | succinate transmembrane transporter activity(GO:0015141) |
| 0.2 | 0.7 | GO:0050997 | phosphatidylcholine binding(GO:0031210) quaternary ammonium group binding(GO:0050997) |
| 0.2 | 0.7 | GO:0016906 | sterol 3-beta-glucosyltransferase activity(GO:0016906) |
| 0.2 | 1.8 | GO:0010294 | abscisic acid glucosyltransferase activity(GO:0010294) |
| 0.2 | 0.7 | GO:0090422 | thiamine pyrophosphate transporter activity(GO:0090422) |
| 0.2 | 2.3 | GO:0005086 | ARF guanyl-nucleotide exchange factor activity(GO:0005086) |
| 0.2 | 0.9 | GO:1901982 | disaccharide binding(GO:0048030) maltose binding(GO:1901982) |
| 0.2 | 1.4 | GO:0008199 | ferric iron binding(GO:0008199) |
| 0.2 | 1.1 | GO:0004765 | shikimate kinase activity(GO:0004765) |
| 0.2 | 0.7 | GO:0016504 | peptidase activator activity(GO:0016504) |
| 0.2 | 1.3 | GO:0009041 | uridylate kinase activity(GO:0009041) |
| 0.2 | 2.4 | GO:0005384 | manganese ion transmembrane transporter activity(GO:0005384) |
| 0.2 | 1.5 | GO:0016812 | hydrolase activity, acting on carbon-nitrogen (but not peptide) bonds, in cyclic amides(GO:0016812) |
| 0.2 | 1.1 | GO:0033836 | flavonol 7-O-beta-glucosyltransferase activity(GO:0033836) |
| 0.2 | 1.1 | GO:0004614 | phosphoglucomutase activity(GO:0004614) |
| 0.2 | 2.0 | GO:0000285 | 1-phosphatidylinositol-3-phosphate 5-kinase activity(GO:0000285) |
| 0.2 | 0.9 | GO:0034722 | gamma-glutamyl-peptidase activity(GO:0034722) |
| 0.2 | 3.6 | GO:0070290 | phospholipase D activity(GO:0004630) N-acylphosphatidylethanolamine-specific phospholipase D activity(GO:0070290) |
| 0.2 | 1.5 | GO:0003872 | 6-phosphofructokinase activity(GO:0003872) |
| 0.2 | 1.7 | GO:0004143 | diacylglycerol kinase activity(GO:0004143) |
| 0.2 | 1.0 | GO:0015203 | polyamine transmembrane transporter activity(GO:0015203) |
| 0.2 | 0.6 | GO:0052635 | C-20 gibberellin 2-beta-dioxygenase activity(GO:0052635) |
| 0.2 | 1.0 | GO:0022841 | leak channel activity(GO:0022840) potassium ion leak channel activity(GO:0022841) narrow pore channel activity(GO:0022842) |
| 0.2 | 0.8 | GO:0004112 | cyclic-nucleotide phosphodiesterase activity(GO:0004112) 2',3'-cyclic-nucleotide 3'-phosphodiesterase activity(GO:0004113) |
| 0.2 | 1.0 | GO:0031683 | G-protein coupled receptor binding(GO:0001664) G-protein beta/gamma-subunit complex binding(GO:0031683) |
| 0.2 | 0.8 | GO:0004792 | thiosulfate sulfurtransferase activity(GO:0004792) |
| 0.2 | 0.5 | GO:0047874 | dolichyldiphosphatase activity(GO:0047874) |
| 0.2 | 2.1 | GO:0050373 | UDP-arabinose 4-epimerase activity(GO:0050373) |
| 0.2 | 3.4 | GO:0015020 | glucuronosyltransferase activity(GO:0015020) |
| 0.2 | 0.9 | GO:0004535 | poly(A)-specific ribonuclease activity(GO:0004535) |
| 0.2 | 1.7 | GO:0047372 | acylglycerol lipase activity(GO:0047372) |
| 0.2 | 0.8 | GO:0051959 | dynein binding(GO:0045502) dynein intermediate chain binding(GO:0045505) dynein light intermediate chain binding(GO:0051959) |
| 0.2 | 0.8 | GO:0005544 | calcium-dependent phospholipid binding(GO:0005544) |
| 0.2 | 0.7 | GO:0016751 | dihydrolipoyllysine-residue succinyltransferase activity(GO:0004149) succinyltransferase activity(GO:0016748) S-succinyltransferase activity(GO:0016751) |
| 0.2 | 1.3 | GO:0043995 | histone acetyltransferase activity (H4-K5 specific)(GO:0043995) |
| 0.2 | 0.5 | GO:0070003 | threonine-type endopeptidase activity(GO:0004298) threonine-type peptidase activity(GO:0070003) |
| 0.2 | 1.5 | GO:0004435 | phosphatidylinositol phospholipase C activity(GO:0004435) |
| 0.2 | 0.6 | GO:0016034 | maleylacetoacetate isomerase activity(GO:0016034) |
| 0.2 | 2.3 | GO:0051879 | Hsp90 protein binding(GO:0051879) |
| 0.1 | 1.5 | GO:0035198 | miRNA binding(GO:0035198) |
| 0.1 | 2.8 | GO:0004439 | phosphatidylinositol-4,5-bisphosphate 5-phosphatase activity(GO:0004439) phosphatidylinositol phosphate 5-phosphatase activity(GO:0034595) |
| 0.1 | 0.9 | GO:0050378 | UDP-glucuronate 4-epimerase activity(GO:0050378) |
| 0.1 | 17.2 | GO:0004722 | protein serine/threonine phosphatase activity(GO:0004722) |
| 0.1 | 0.6 | GO:0000268 | peroxisome targeting sequence binding(GO:0000268) |
| 0.1 | 8.0 | GO:0031625 | ubiquitin protein ligase binding(GO:0031625) |
| 0.1 | 0.8 | GO:0003983 | UTP:glucose-1-phosphate uridylyltransferase activity(GO:0003983) |
| 0.1 | 0.4 | GO:0019781 | NEDD8 activating enzyme activity(GO:0019781) |
| 0.1 | 1.0 | GO:0001047 | core promoter sequence-specific DNA binding(GO:0001046) core promoter binding(GO:0001047) |
| 0.1 | 1.0 | GO:0016703 | oxidoreductase activity, acting on single donors with incorporation of molecular oxygen, incorporation of one atom of oxygen (internal monooxygenases or internal mixed function oxidases)(GO:0016703) |
| 0.1 | 1.0 | GO:0010178 | IAA-amino acid conjugate hydrolase activity(GO:0010178) |
| 0.1 | 1.2 | GO:0004020 | adenylylsulfate kinase activity(GO:0004020) |
| 0.1 | 0.5 | GO:0003935 | GTP cyclohydrolase II activity(GO:0003935) 3,4-dihydroxy-2-butanone-4-phosphate synthase activity(GO:0008686) |
| 0.1 | 0.4 | GO:0015173 | aromatic amino acid transmembrane transporter activity(GO:0015173) |
| 0.1 | 2.0 | GO:0016157 | sucrose synthase activity(GO:0016157) |
| 0.1 | 0.5 | GO:0010296 | prenylcysteine methylesterase activity(GO:0010296) |
| 0.1 | 0.7 | GO:0004148 | dihydrolipoyl dehydrogenase activity(GO:0004148) |
| 0.1 | 1.5 | GO:0016161 | beta-amylase activity(GO:0016161) |
| 0.1 | 2.1 | GO:0016018 | cyclosporin A binding(GO:0016018) |
| 0.1 | 1.2 | GO:0043023 | ribosomal large subunit binding(GO:0043023) |
| 0.1 | 1.7 | GO:0015145 | monosaccharide transmembrane transporter activity(GO:0015145) |
| 0.1 | 16.9 | GO:0000978 | RNA polymerase II core promoter proximal region sequence-specific DNA binding(GO:0000978) |
| 0.1 | 0.4 | GO:0019166 | trans-2-enoyl-CoA reductase (NADPH) activity(GO:0019166) |
| 0.1 | 1.4 | GO:0004396 | hexokinase activity(GO:0004396) |
| 0.1 | 3.8 | GO:0005385 | zinc ion transmembrane transporter activity(GO:0005385) |
| 0.1 | 0.4 | GO:0046480 | galactolipid galactosyltransferase activity(GO:0046480) |
| 0.1 | 1.7 | GO:0046556 | xylan 1,4-beta-xylosidase activity(GO:0009044) alpha-L-arabinofuranosidase activity(GO:0046556) |
| 0.1 | 0.5 | GO:0004123 | cystathionine gamma-lyase activity(GO:0004123) |
| 0.1 | 0.9 | GO:0031492 | nucleosomal DNA binding(GO:0031492) |
| 0.1 | 1.2 | GO:0004806 | triglyceride lipase activity(GO:0004806) |
| 0.1 | 3.0 | GO:0008066 | glutamate receptor activity(GO:0008066) |
| 0.1 | 1.6 | GO:0002020 | protease binding(GO:0002020) |
| 0.1 | 1.1 | GO:0035673 | oligopeptide transmembrane transporter activity(GO:0035673) peptide transmembrane transporter activity(GO:1904680) |
| 0.1 | 9.8 | GO:0051213 | dioxygenase activity(GO:0051213) |
| 0.1 | 0.7 | GO:0004930 | G-protein coupled receptor activity(GO:0004930) |
| 0.1 | 1.1 | GO:0009882 | blue light photoreceptor activity(GO:0009882) |
| 0.1 | 1.8 | GO:0005242 | inward rectifier potassium channel activity(GO:0005242) |
| 0.1 | 1.1 | GO:0015112 | nitrate transmembrane transporter activity(GO:0015112) |
| 0.1 | 1.5 | GO:0008252 | nucleotidase activity(GO:0008252) |
| 0.1 | 0.8 | GO:0004345 | glucose-6-phosphate dehydrogenase activity(GO:0004345) |
| 0.1 | 0.5 | GO:0004813 | alanine-tRNA ligase activity(GO:0004813) |
| 0.1 | 2.7 | GO:0097602 | cullin family protein binding(GO:0097602) |
| 0.1 | 0.8 | GO:0033549 | MAP kinase phosphatase activity(GO:0033549) |
| 0.1 | 0.8 | GO:0016621 | cinnamoyl-CoA reductase activity(GO:0016621) |
| 0.1 | 1.6 | GO:0004709 | MAP kinase kinase kinase activity(GO:0004709) |
| 0.1 | 1.0 | GO:0101005 | ubiquitinyl hydrolase activity(GO:0101005) |
| 0.1 | 0.4 | GO:0004534 | 5'-3' exoribonuclease activity(GO:0004534) |
| 0.1 | 6.2 | GO:0005096 | GTPase activator activity(GO:0005096) |
| 0.1 | 0.4 | GO:0004821 | histidine-tRNA ligase activity(GO:0004821) |
| 0.1 | 1.6 | GO:0000993 | RNA polymerase II core binding(GO:0000993) |
| 0.1 | 1.5 | GO:0004144 | diacylglycerol O-acyltransferase activity(GO:0004144) |
| 0.1 | 0.8 | GO:0051920 | thioredoxin peroxidase activity(GO:0008379) peroxiredoxin activity(GO:0051920) |
| 0.1 | 7.4 | GO:0004197 | cysteine-type endopeptidase activity(GO:0004197) |
| 0.1 | 0.3 | GO:0019003 | GDP binding(GO:0019003) |
| 0.1 | 0.3 | GO:0047209 | coniferyl-alcohol glucosyltransferase activity(GO:0047209) |
| 0.1 | 2.1 | GO:0008353 | RNA polymerase II carboxy-terminal domain kinase activity(GO:0008353) |
| 0.1 | 4.2 | GO:0001228 | transcriptional activator activity, RNA polymerase II transcription regulatory region sequence-specific binding(GO:0001228) |
| 0.1 | 0.6 | GO:0047893 | flavonol 3-O-glucosyltransferase activity(GO:0047893) daphnetin 3-O-glucosyltransferase activity(GO:0102360) |
| 0.1 | 0.4 | GO:0047714 | galactolipase activity(GO:0047714) |
| 0.1 | 0.7 | GO:0001872 | (1->3)-beta-D-glucan binding(GO:0001872) |
| 0.1 | 37.1 | GO:0004842 | ubiquitin-protein transferase activity(GO:0004842) |
| 0.1 | 3.1 | GO:0016597 | amino acid binding(GO:0016597) |
| 0.1 | 0.7 | GO:0080025 | phosphatidylinositol-3,5-bisphosphate binding(GO:0080025) |
| 0.1 | 5.0 | GO:0008080 | N-acetyltransferase activity(GO:0008080) |
| 0.1 | 0.7 | GO:0004392 | heme oxygenase (decyclizing) activity(GO:0004392) |
| 0.1 | 1.7 | GO:0005227 | calcium activated cation channel activity(GO:0005227) ion gated channel activity(GO:0022839) |
| 0.1 | 0.5 | GO:0035064 | methylated histone binding(GO:0035064) |
| 0.1 | 0.9 | GO:0034979 | NAD-dependent histone deacetylase activity(GO:0017136) histone deacetylase activity (H3-K14 specific)(GO:0031078) NAD-dependent histone deacetylase activity (H3-K14 specific)(GO:0032041) NAD-dependent protein deacetylase activity(GO:0034979) |
| 0.1 | 1.5 | GO:0031369 | translation initiation factor binding(GO:0031369) |
| 0.1 | 1.0 | GO:0015174 | basic amino acid transmembrane transporter activity(GO:0015174) |
| 0.1 | 0.3 | GO:0003962 | cystathionine gamma-synthase activity(GO:0003962) |
| 0.1 | 1.1 | GO:0016208 | AMP binding(GO:0016208) |
| 0.1 | 0.9 | GO:0004860 | protein kinase inhibitor activity(GO:0004860) |
| 0.1 | 0.5 | GO:0047627 | hydrolase activity, acting on acid anhydrides, in sulfonyl-containing anhydrides(GO:0016819) adenylylsulfatase activity(GO:0047627) |
| 0.1 | 3.5 | GO:0004702 | receptor signaling protein serine/threonine kinase activity(GO:0004702) MAP kinase activity(GO:0004707) |
| 0.1 | 0.6 | GO:0001653 | peptide receptor activity(GO:0001653) |
| 0.1 | 9.9 | GO:0046982 | protein heterodimerization activity(GO:0046982) |
| 0.1 | 1.0 | GO:0030295 | kinase activator activity(GO:0019209) protein kinase activator activity(GO:0030295) |
| 0.1 | 1.7 | GO:0008146 | sulfotransferase activity(GO:0008146) |
| 0.1 | 0.2 | GO:0080046 | quercetin 4'-O-glucosyltransferase activity(GO:0080046) |
| 0.1 | 0.4 | GO:0050664 | NAD(P)H oxidase activity(GO:0016174) oxidoreductase activity, acting on NAD(P)H, oxygen as acceptor(GO:0050664) |
| 0.1 | 5.2 | GO:0042910 | xenobiotic transporter activity(GO:0042910) |
| 0.1 | 4.8 | GO:0032182 | ubiquitin-like protein binding(GO:0032182) ubiquitin binding(GO:0043130) |
| 0.1 | 1.2 | GO:0031491 | nucleosome binding(GO:0031491) |
| 0.1 | 0.5 | GO:0052691 | UDP-arabinopyranose mutase activity(GO:0052691) |
| 0.1 | 0.6 | GO:0000095 | S-adenosyl-L-methionine transmembrane transporter activity(GO:0000095) coenzyme transporter activity(GO:0051185) |
| 0.1 | 1.1 | GO:0030674 | protein binding, bridging(GO:0030674) |
| 0.1 | 0.2 | GO:1990247 | N6-methyladenosine-containing RNA binding(GO:1990247) |
| 0.1 | 0.3 | GO:0004367 | glycerol-3-phosphate dehydrogenase [NAD+] activity(GO:0004367) |
| 0.1 | 0.9 | GO:0003950 | NAD+ ADP-ribosyltransferase activity(GO:0003950) |
| 0.1 | 0.7 | GO:0004869 | cysteine-type endopeptidase inhibitor activity(GO:0004869) |
| 0.1 | 0.7 | GO:0004351 | glutamate decarboxylase activity(GO:0004351) |
| 0.1 | 0.3 | GO:0004348 | glucosylceramidase activity(GO:0004348) |
| 0.1 | 1.8 | GO:0080044 | quercetin 7-O-glucosyltransferase activity(GO:0080044) |
| 0.1 | 0.4 | GO:0008970 | phosphatidylcholine 1-acylhydrolase activity(GO:0008970) |
| 0.1 | 0.8 | GO:0017169 | CDP-alcohol phosphatidyltransferase activity(GO:0017169) |
| 0.1 | 0.6 | GO:0043495 | protein anchor(GO:0043495) |
| 0.1 | 1.8 | GO:0017137 | Rab GTPase binding(GO:0017137) |
| 0.1 | 0.5 | GO:0004356 | glutamate-ammonia ligase activity(GO:0004356) |
| 0.1 | 2.5 | GO:0016628 | oxidoreductase activity, acting on the CH-CH group of donors, NAD or NADP as acceptor(GO:0016628) |
| 0.1 | 0.5 | GO:0004366 | glycerol-3-phosphate O-acyltransferase activity(GO:0004366) |
| 0.1 | 0.4 | GO:0048038 | quinone binding(GO:0048038) |
| 0.1 | 0.1 | GO:0008517 | folic acid transporter activity(GO:0008517) |
| 0.1 | 1.0 | GO:0019707 | protein-cysteine S-palmitoyltransferase activity(GO:0019706) protein-cysteine S-acyltransferase activity(GO:0019707) |
| 0.1 | 0.7 | GO:0030628 | pre-mRNA 3'-splice site binding(GO:0030628) |
| 0.1 | 0.7 | GO:0016813 | hydrolase activity, acting on carbon-nitrogen (but not peptide) bonds, in linear amidines(GO:0016813) |
| 0.1 | 2.6 | GO:0016671 | oxidoreductase activity, acting on a sulfur group of donors, disulfide as acceptor(GO:0016671) |
| 0.1 | 0.9 | GO:0015095 | magnesium ion transmembrane transporter activity(GO:0015095) |
| 0.1 | 0.7 | GO:0048040 | UDP-glucuronate decarboxylase activity(GO:0048040) |
| 0.1 | 0.2 | GO:0046920 | alpha-(1->3)-fucosyltransferase activity(GO:0046920) |
| 0.1 | 0.3 | GO:0051740 | ethylene receptor activity(GO:0038199) ethylene binding(GO:0051740) alkene binding(GO:0072328) |
| 0.1 | 0.4 | GO:0004791 | thioredoxin-disulfide reductase activity(GO:0004791) |
| 0.1 | 2.7 | GO:0036442 | hydrogen-exporting ATPase activity(GO:0036442) |
| 0.1 | 0.7 | GO:0004311 | farnesyltranstransferase activity(GO:0004311) |
| 0.1 | 0.2 | GO:0035516 | oxidative DNA demethylase activity(GO:0035516) |
| 0.1 | 0.7 | GO:0016289 | CoA hydrolase activity(GO:0016289) |
| 0.1 | 0.2 | GO:0004424 | imidazoleglycerol-phosphate dehydratase activity(GO:0004424) |
| 0.0 | 0.7 | GO:0005253 | anion channel activity(GO:0005253) |
| 0.0 | 0.4 | GO:0004526 | ribonuclease P activity(GO:0004526) |
| 0.0 | 0.6 | GO:0003825 | alpha,alpha-trehalose-phosphate synthase (UDP-forming) activity(GO:0003825) |
| 0.0 | 0.1 | GO:0051731 | polynucleotide 5'-hydroxyl-kinase activity(GO:0051731) |
| 0.0 | 0.5 | GO:0000210 | NAD+ diphosphatase activity(GO:0000210) |
| 0.0 | 0.3 | GO:0048029 | monosaccharide binding(GO:0048029) |
| 0.0 | 0.5 | GO:0004675 | transmembrane receptor protein serine/threonine kinase activity(GO:0004675) |
| 0.0 | 0.4 | GO:0016790 | thiolester hydrolase activity(GO:0016790) |
| 0.0 | 0.3 | GO:0060229 | phospholipase activator activity(GO:0016004) lipase activator activity(GO:0060229) |
| 0.0 | 0.0 | GO:0016277 | [myelin basic protein]-arginine N-methyltransferase activity(GO:0016277) |
| 0.0 | 0.6 | GO:0004427 | inorganic diphosphatase activity(GO:0004427) |
| 0.0 | 20.7 | GO:0000975 | regulatory region DNA binding(GO:0000975) transcription regulatory region sequence-specific DNA binding(GO:0000976) regulatory region nucleic acid binding(GO:0001067) transcription regulatory region DNA binding(GO:0044212) |
| 0.0 | 0.5 | GO:0008139 | nuclear localization sequence binding(GO:0008139) |
| 0.0 | 0.4 | GO:0008536 | Ran GTPase binding(GO:0008536) |
| 0.0 | 0.1 | GO:0042895 | tetracycline transporter activity(GO:0008493) toxin transporter activity(GO:0019534) antibiotic transporter activity(GO:0042895) |
| 0.0 | 0.2 | GO:0016531 | copper chaperone activity(GO:0016531) |
| 0.0 | 0.9 | GO:0051539 | 4 iron, 4 sulfur cluster binding(GO:0051539) |
| 0.0 | 0.1 | GO:0017110 | nucleoside-diphosphatase activity(GO:0017110) |
| 0.0 | 3.9 | GO:0003712 | transcription factor activity, transcription factor binding(GO:0000989) transcription cofactor activity(GO:0003712) |
| 0.0 | 0.1 | GO:0004488 | methenyltetrahydrofolate cyclohydrolase activity(GO:0004477) methylenetetrahydrofolate dehydrogenase (NADP+) activity(GO:0004488) |
| 0.0 | 2.0 | GO:0008234 | cysteine-type peptidase activity(GO:0008234) |
| 0.0 | 0.1 | GO:0044389 | ubiquitin-like protein ligase binding(GO:0044389) |
| 0.0 | 0.2 | GO:0001671 | ATPase activator activity(GO:0001671) |
| 0.0 | 1.6 | GO:0015171 | amino acid transmembrane transporter activity(GO:0015171) |
| 0.0 | 0.8 | GO:0005048 | signal sequence binding(GO:0005048) |
| 0.0 | 0.2 | GO:0050017 | L-3-cyanoalanine synthase activity(GO:0050017) |
| 0.0 | 0.1 | GO:0050291 | sphingosine N-acyltransferase activity(GO:0050291) |
| 0.0 | 10.5 | GO:0004674 | protein serine/threonine kinase activity(GO:0004674) |
| 0.0 | 0.4 | GO:0004022 | alcohol dehydrogenase (NAD) activity(GO:0004022) |
| 0.0 | 0.3 | GO:0008417 | fucosyltransferase activity(GO:0008417) |
| 0.0 | 0.8 | GO:0003684 | damaged DNA binding(GO:0003684) |
| 0.0 | 1.3 | GO:0004185 | serine-type carboxypeptidase activity(GO:0004185) |
| 0.0 | 0.3 | GO:0052747 | sinapyl alcohol dehydrogenase activity(GO:0052747) |
| 0.0 | 1.0 | GO:0003993 | acid phosphatase activity(GO:0003993) |
| 0.0 | 0.1 | GO:0016670 | oxidoreductase activity, acting on a sulfur group of donors, oxygen as acceptor(GO:0016670) |
| 0.0 | 0.2 | GO:0004506 | squalene monooxygenase activity(GO:0004506) |
| 0.0 | 0.1 | GO:0050062 | long-chain-fatty-acyl-CoA reductase activity(GO:0050062) |
| 0.0 | 0.1 | GO:0004738 | pyruvate dehydrogenase activity(GO:0004738) |
| 0.0 | 0.1 | GO:0005094 | GDP-dissociation inhibitor activity(GO:0005092) Rho GDP-dissociation inhibitor activity(GO:0005094) |
| 0.0 | 0.6 | GO:0042393 | histone binding(GO:0042393) |
| 0.0 | 0.0 | GO:0045140 | inositol phosphoceramide synthase activity(GO:0045140) |
| 0.0 | 0.8 | GO:0000981 | RNA polymerase II transcription factor activity, sequence-specific DNA binding(GO:0000981) |
| 0.0 | 0.1 | GO:0003785 | actin monomer binding(GO:0003785) |
| 0.0 | 2.2 | GO:0005509 | calcium ion binding(GO:0005509) |
| 0.0 | 0.1 | GO:0017025 | TBP-class protein binding(GO:0017025) |
| 0.0 | 0.2 | GO:0016868 | intramolecular transferase activity, phosphotransferases(GO:0016868) |
| 0.0 | 0.9 | GO:0003682 | chromatin binding(GO:0003682) |
| 0.0 | 0.4 | GO:0035091 | phosphatidylinositol binding(GO:0035091) |
| 0.0 | 0.4 | GO:0050135 | NAD(P)+ nucleosidase activity(GO:0050135) |
Gene overrepresentation in curated gene sets: canonical pathways category:
| Log-likelihood per target | Total log-likelihood | Term | Description |
|---|---|---|---|
| 0.5 | 1.5 | PID TAP63 PATHWAY | Validated transcriptional targets of TAp63 isoforms |
| 0.4 | 1.2 | PID IL12 2PATHWAY | IL12-mediated signaling events |
| 0.4 | 1.8 | PID CIRCADIAN PATHWAY | Circadian rhythm pathway |
| 0.3 | 1.5 | PID ECADHERIN NASCENT AJ PATHWAY | E-cadherin signaling in the nascent adherens junction |
| 0.3 | 0.3 | PID MYC PATHWAY | C-MYC pathway |
| 0.2 | 1.4 | PID RAC1 PATHWAY | RAC1 signaling pathway |
| 0.1 | 0.3 | PID PI3KCI PATHWAY | Class I PI3K signaling events |
| 0.1 | 0.5 | PID BCR 5PATHWAY | BCR signaling pathway |
| 0.1 | 0.3 | PID HNF3B PATHWAY | FOXA2 and FOXA3 transcription factor networks |
| 0.1 | 0.2 | PID PTP1B PATHWAY | Signaling events mediated by PTP1B |
| 0.1 | 0.5 | PID MTOR 4PATHWAY | mTOR signaling pathway |
| 0.0 | 0.2 | PID REG GR PATHWAY | Glucocorticoid receptor regulatory network |
| 0.0 | 0.1 | PID TRKR PATHWAY | Neurotrophic factor-mediated Trk receptor signaling |
| 0.0 | 0.2 | PID P73PATHWAY | p73 transcription factor network |
Gene overrepresentation in curated gene sets: REACTOME pathways category:
| Log-likelihood per target | Total log-likelihood | Term | Description |
|---|---|---|---|
| 0.5 | 1.8 | REACTOME BMAL1 CLOCK NPAS2 ACTIVATES CIRCADIAN EXPRESSION | Genes involved in BMAL1:CLOCK/NPAS2 Activates Circadian Expression |
| 0.4 | 1.2 | REACTOME SPHINGOLIPID DE NOVO BIOSYNTHESIS | Genes involved in Sphingolipid de novo biosynthesis |
| 0.4 | 1.5 | REACTOME METABOLISM OF NUCLEOTIDES | Genes involved in Metabolism of nucleotides |
| 0.4 | 1.4 | REACTOME MITOCHONDRIAL PROTEIN IMPORT | Genes involved in Mitochondrial Protein Import |
| 0.3 | 1.7 | REACTOME L1CAM INTERACTIONS | Genes involved in L1CAM interactions |
| 0.2 | 1.8 | REACTOME CHEMOKINE RECEPTORS BIND CHEMOKINES | Genes involved in Chemokine receptors bind chemokines |
| 0.2 | 0.5 | REACTOME TCR SIGNALING | Genes involved in TCR signaling |
| 0.1 | 1.5 | REACTOME TRANSCRIPTION | Genes involved in Transcription |
| 0.1 | 0.4 | REACTOME MRNA DECAY BY 5 TO 3 EXORIBONUCLEASE | Genes involved in mRNA Decay by 5' to 3' Exoribonuclease |
| 0.1 | 1.9 | REACTOME FATTY ACID TRIACYLGLYCEROL AND KETONE BODY METABOLISM | Genes involved in Fatty acid, triacylglycerol, and ketone body metabolism |
| 0.1 | 1.1 | REACTOME GLUCOSE METABOLISM | Genes involved in Glucose metabolism |
| 0.1 | 0.3 | REACTOME SYNTHESIS OF PIPS AT THE GOLGI MEMBRANE | Genes involved in Synthesis of PIPs at the Golgi membrane |
| 0.1 | 0.4 | REACTOME FORMATION OF INCISION COMPLEX IN GG NER | Genes involved in Formation of incision complex in GG-NER |
| 0.1 | 0.2 | REACTOME AMINO ACID SYNTHESIS AND INTERCONVERSION TRANSAMINATION | Genes involved in Amino acid synthesis and interconversion (transamination) |
| 0.0 | 1.6 | REACTOME ABC FAMILY PROTEINS MEDIATED TRANSPORT | Genes involved in ABC-family proteins mediated transport |
| 0.0 | 0.1 | REACTOME FRS2 MEDIATED CASCADE | Genes involved in FRS2-mediated cascade |
| 0.0 | 0.2 | REACTOME SIGNALING BY SCF KIT | Genes involved in Signaling by SCF-KIT |
| 0.0 | 0.3 | REACTOME SIGNALING BY RHO GTPASES | Genes involved in Signaling by Rho GTPases |
| 0.0 | 0.6 | REACTOME FORMATION OF THE TERNARY COMPLEX AND SUBSEQUENTLY THE 43S COMPLEX | Genes involved in Formation of the ternary complex, and subsequently, the 43S complex |
| 0.0 | 0.1 | REACTOME G0 AND EARLY G1 | Genes involved in G0 and Early G1 |